


INTRODUCTION
The late Holocene Bonneville landslide dammed the Columbia River in the Columbia River Gorge where the river bisects the volcanic arc of the Cascade Range in the U.S. Pacific Northwest. This report describes new analysis of landslide age by radiocarbon dating three trees killed by the landslide—two drowned by rising water of the impounded Columbia River and one killed by uprooting and burial within the landslide itself. Our analysis builds on a long history of earlier studies of the landslide, its consequences, and several attempts at dating, which we first summarize. We then describe the sampled trees, collected decades ago, including their acquisition and provenance. Our analysis consists of two steps: (1) dendrochronology to show all three trees indeed died the same year; and (2) radiocarbon analysis of multiple samples from each of the trees, combined to give a precise estimate of tree death, and hence landslide occurrence.
The Bonneville Landslide and the “Submerged Forest”
The Bonneville landslide is a 15.5 km2 rockslide-debris avalanche (Coe, Reference Coe2019; Fig. 1) within the larger Cascade landslide complex in the central part of the 1000-m-deep Columbia River Gorge (Fig. 2). Landslides have continuously widened the canyon, especially on the north side where south-dipping, clay-rich contacts within weathered volcaniclastic rocks promote south-moving mass movements (Waters, Reference Waters and Beaulieu1973; Palmer, Reference Palmer1977; Sager, Reference Sager1989; Schuster and Pringle, Reference Schuster, Pringle, Rybar, Stemberk and Wagner2002; Pierson et al., Reference Pierson, Evarts and Bard2016). The Bonneville landslide headed from 1040 m on Table Mountain, descended to the tidal Columbia River and 2 km across the valley bottom, blocking it with a 90–120 m high lobe of bedrock blocks and granular matrix (Palmer, Reference Palmer1977). Recent mapping and analysis show parts of the Cascade landslide complex and other Gorge landslides are seasonally active (Pierson et al., Reference Pierson, Evarts and Bard2016; Tong and Schmidt, Reference Tong and Schmidt2016), but the Bonneville landslide itself is stable.
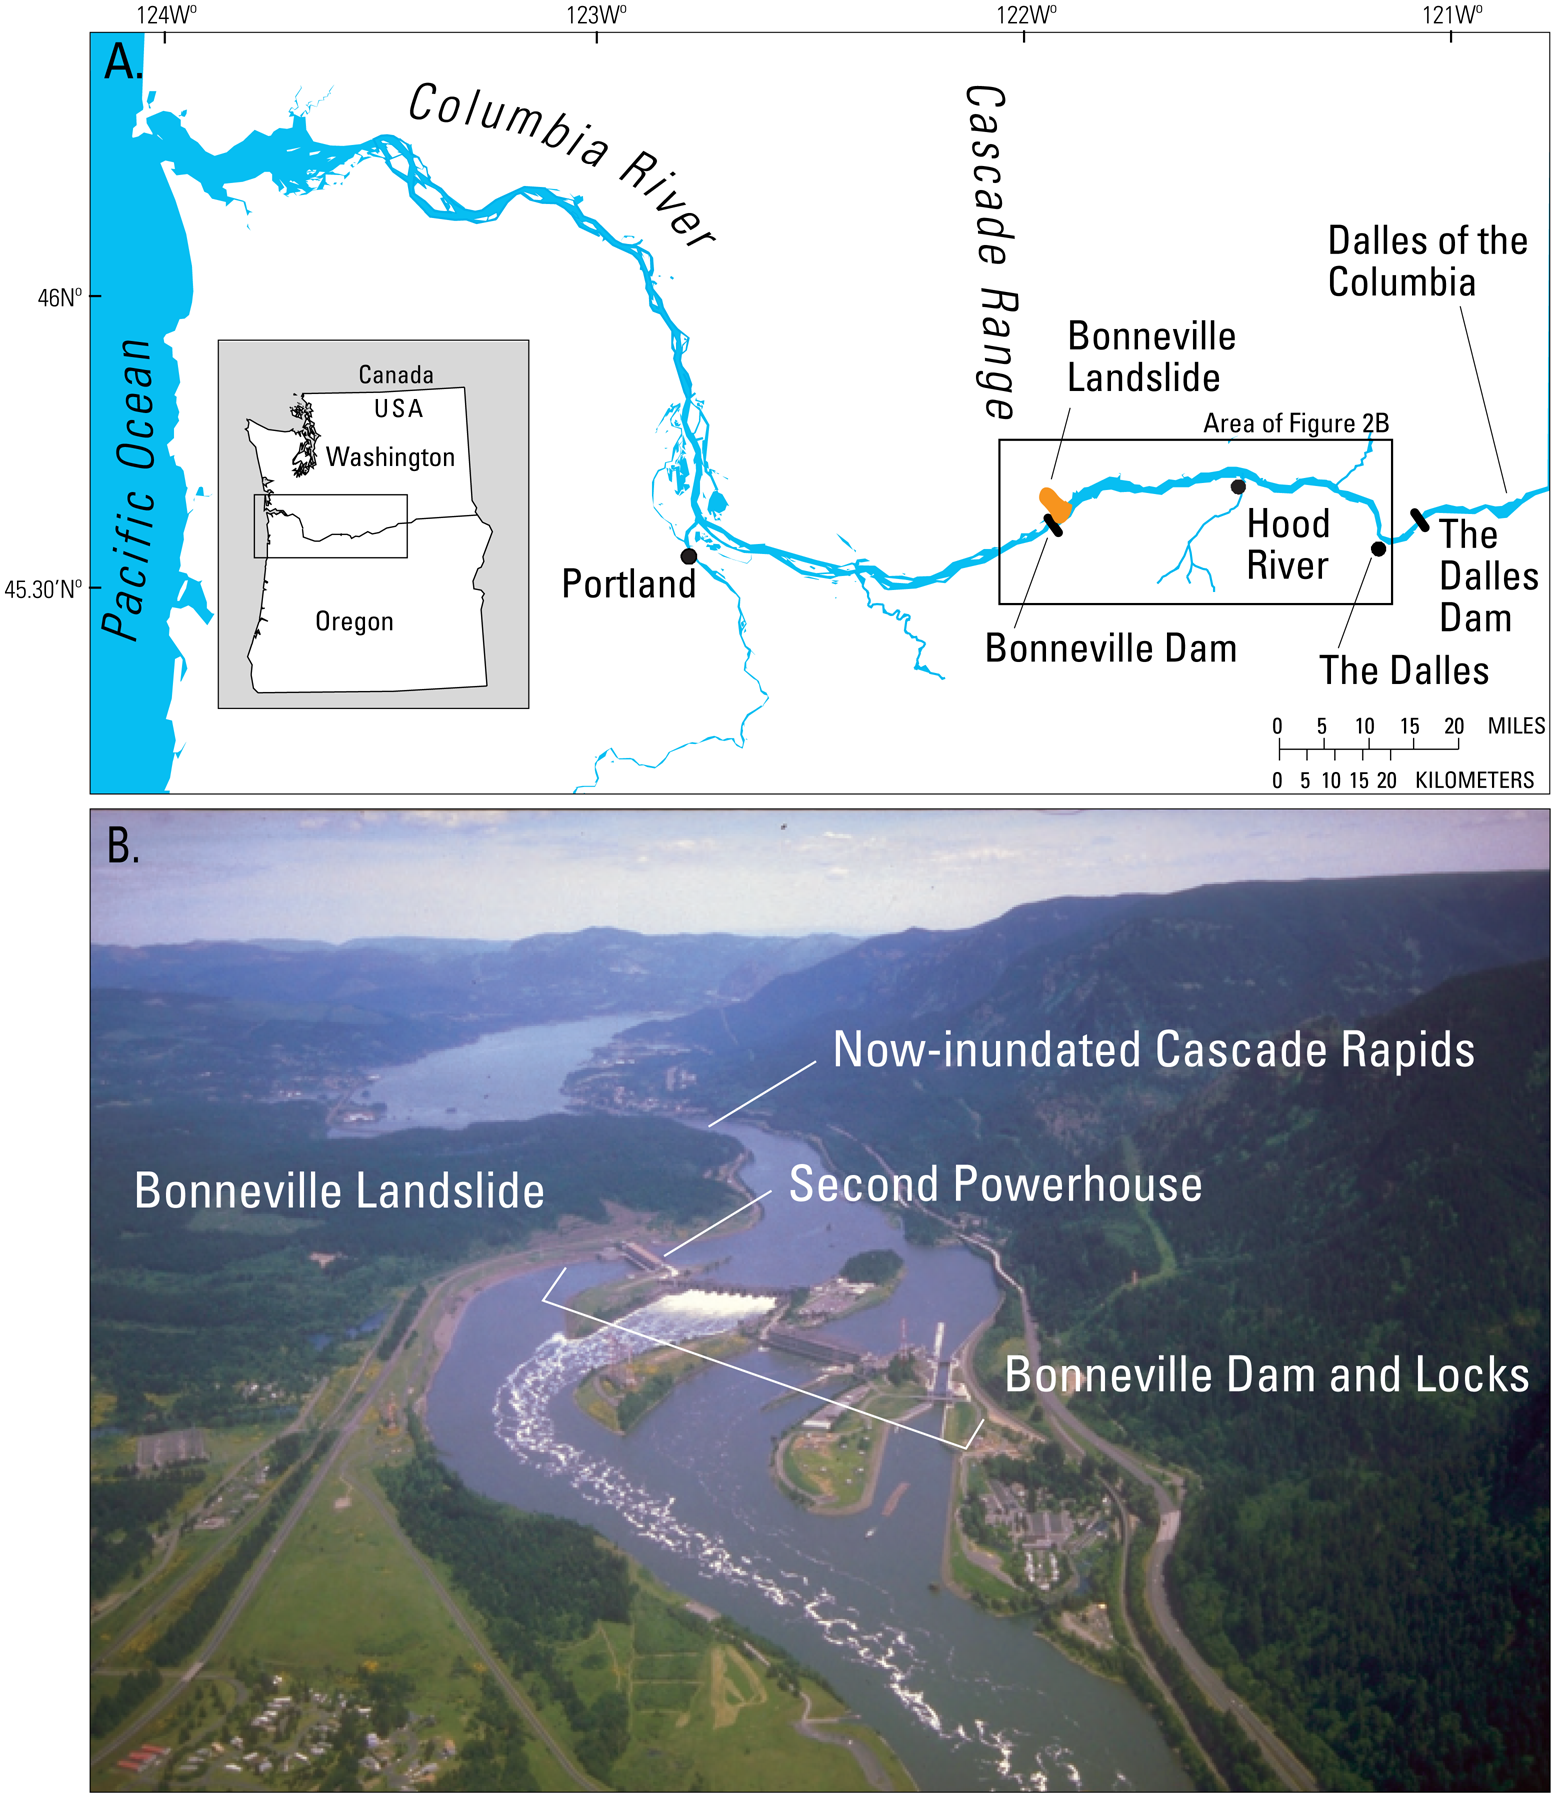
Locations of interest. (A) Regional map of the lower Columbia River, showing location of Bonneville landslide, Bonneville Dam, and the area of the map of drowned forest shown in Figure 2B. (B) View east and upriver of Bonneville Dam and Locks and the toe of the Bonneville landslide, which descended from the north (left) and blocked and displaced the Columbia River two km southward. Bonneville Dam was closed in 1938, inundating the remains of the submerged forest. The second powerhouse was constructed in the late 1970s and early 1980s; excavation for the foundation and the tailrace channel uncovered the Powerhouse tree used in this analysis. U.S. Army Corps of Engineers photograph, ca. 1995.
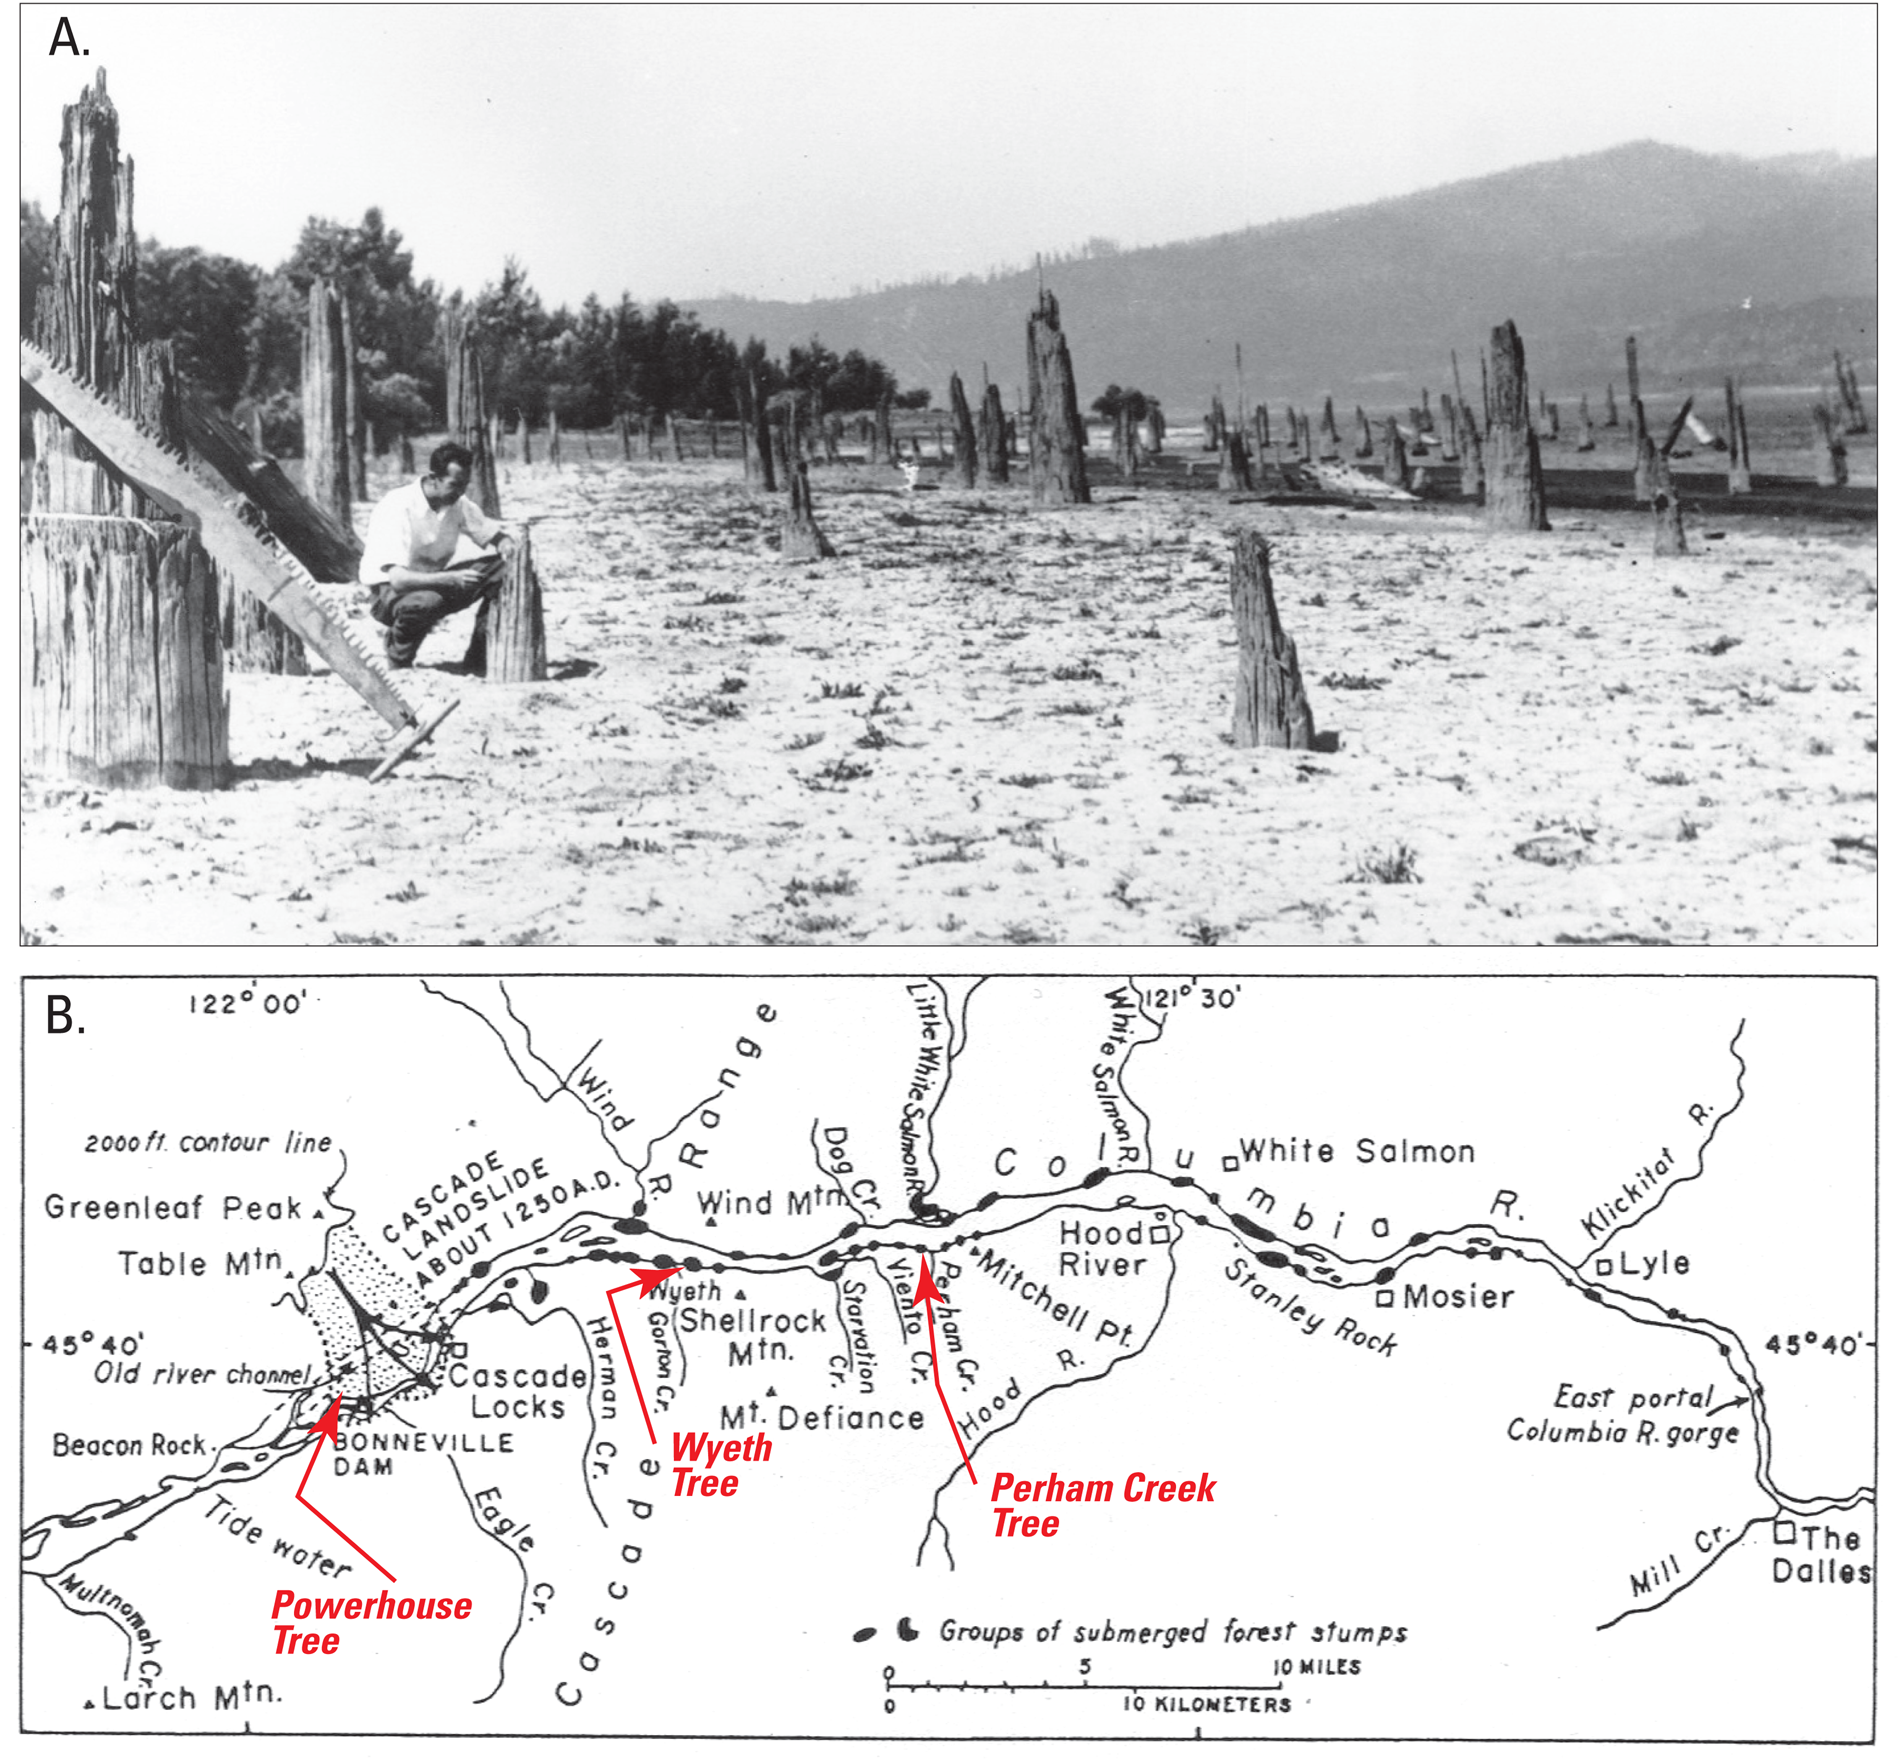
The submerged forest of the Columbia. (A) The Wyeth group of submerged snags exposed at low flow on August, 21, 1934. Accompanying caption reads “Section of douglas fir submerged forest off Wyeth, Oregon. Douglas fir, cedar, and some oak.” This photograph, by Thornton T. Munger of the U.S. Forest Service, shows Donald B. Lawrence in the course of his dendrochronology studies. Photograph courtesy of the Oregon Historical Society, negative number OrHi 95467. (B) Map of submerged forest stumps as it appeared in Lawrence and Lawrence (Reference Lawrence and Lawrence1958), annotated with collection locations of Powerhouse, Wyeth, and Perham Creek samples.
The Bonneville landslide impounded a temporary lake 75–80 m deep to an elevation of ~85 m NAVD (Hodge, Reference Hodge1938; all elevations referenced to North American Vertical Datum of 1988), containing as much as 10 km3 of water (as estimated from 30 m resolution digital elevation data) and extending >200 km upriver (O'Connor and Burns, Reference O'Connor, Burns, O'Connor, Dorsey and Madin2009; O'Connor et al., Reference O'Connor, Wells, Bennett, Cannon, Staisch, Anderson, Pivarunas, Booth and Grunder2021). Subsequent overtopping of the landslide dam incised a 12 km-long new channel around the southern margin of the landslide and lowered the level of the temporary lake, eventually to the historic low-water elevation of ~14.5 m above the remaining blockages. These obstructions formed a series of rapids known as the Cascades that impounded the river ~11.5 m (low-water drop, greater at high flows) above the pre-landslide river level, which was likely close to the historic pre-damming, low-water level below the Cascades rapids of 3.0 m. The still-impounded river above the Cascades rapids extended 68 km upstream to the foot of the bedrock rapids and falls known as “The Dalles of the Columbia.” This sequence was elaborated in Indigenous cultural narratives of the “Bridge of the Gods,” which described the blockage, upstream impoundment, breaching, and appearance of the Cascades rapids (Lee and Frost, Reference Lee, Frost and Collard1844; Gibbs, Reference Gibbs1854; Tappan, Reference Tappan1854; Saylor, Reference Saylor1900; Condon, Reference Condon and McCornack1910; Judson, Reference Judson1910; Lyman, Reference Lyman1915; Clark, Reference Clark1952, Reference Clark and Clark1953; Lawrence and Lawrence, Reference Lawrence and Lawrence1958; Deloria, Reference Deloria1997; Budhwa, Reference Budhwa2002). The sequence of events and features was first fully written in a geologic narrative by Williams (Reference Williams1916).
One consequence of the historically persistent ~11.5 m impoundment above the Cascade rapids was the “submerged forest” of the Columbia, as named by Frémont in 1843 (Frémont and Smucker, Reference Frémont and Smucker1856, p. 335). The submerged forest consisted of snags protruding from the river and flanking beaches at low water within the remnant-impounded reach of the river (Fig. 2). William Clark's journal entry for October 30, 1805, during the westward leg of the Lewis and Clark expedition, is the first written Western observation of the submerged forest. He noted, in his free-form spelling and grammar, “the stumps of Pine trees are in maney places are at Some distance in the river” (Moulton, Reference Moulton2002, pp. 354–355). Clark's initial description of the submerged snags was followed by those of many explorers and geologists (summarized by Barry, Reference Barry1935; Lawrence, Reference Lawrence1936; and O'Connor, Reference O'Connor2004), even meriting a footnote in Lyell's foundational Principles of Geology (Reference Lyell1832). Not until the early twentieth century, however, was the submerged forest understood to be the remains of a forest fringing the pre-landslide Columbia River, when river elevation was ~11.5 m lower (Gilbert, Reference Gilbert1899, Reference Gilbert1900; Harza, Reference Harza1916; Williams, Reference Williams1916; Hodge, Reference Hodge1932; Holdredge, Reference Holdredge1937). The submerged forest was most thoroughly studied by Lawrence (Reference Lawrence1936, Reference Lawrence1937), who counted ~3000 standing snags of Douglas-fir, western redcedar, ponderosa pine, and Garry oak in groups extending 60 km upriver of the landslide dam.
After Williams’ (Reference Williams1916) compelling assessment linking the drowned forest to the landslide, subsequent studies mostly focused on the cause and consequences of the landslide, first motivated by the search for dam sites on the lower Columbia River (Hodge, Reference Hodge1932, Reference Hodge1938; Holdredge, Reference Holdredge1937; Palmer, Reference Palmer1977). These studies ultimately led to the building and 1938 closure of Bonneville Dam (Fig. 1B), cutting of remnant submerged forest snags in the reservoir area as hazards to navigation, and the subsequent drowning of the Cascades rapids and submerged forest stumps by Lake Bonneville, the dam's reservoir.
Another persistent line of inquiry has been the landslide's effects on pre-contact Indigenous cultures in the region (Lawrence and Lawrence, Reference Lawrence and Lawrence1958; Sanger, Reference Sanger1967; Browman and Munsell, Reference Browman and Munsell1969; Minor, Reference Minor1984; Bourdeau, Reference Bourdeau1999; Schuster and Pringle, Reference Schuster, Pringle, Rybar, Stemberk and Wagner2002; O'Connor, Reference O'Connor2004). Key aspects include potential effects on fish passage (Lawrence and Lawrence, Reference Lawrence and Lawrence1958; Sanger, Reference Sanger1967; Hutchinson and Hall, Reference Hutchinson and Hall2019) and effects of Indigenous settlement patterns and movements in the region (Pettigrew, Reference Pettigrew1981; Lunney and Taylor, Reference Lunney and Taylor2000; Bourdeau Reference Bourdeau2004).
More recently, possible triggering mechanisms have spurred research into the Bonneville landslide (e.g., Schuster and Pringle, Reference Schuster, Pringle, Rybar, Stemberk and Wagner2002) and other landslides in the region (e.g., Schuster et al., Reference Schuster, Logan and Pringle1992; Schulz et al., Reference Schulz, Galloway and Higgins2012; Leithold et al., Reference Leithold, Wegmann, Bohnenstiehl, Smith, Noren and O'Grady2018, Reference Leithold, Wegmann, Bohnenstiehl, Joyner and Pollen2019; LaHusen et al., Reference LaHusen, Duvall, Booth, Grant, Mishkin, Montgomery, Struble, Roering and Wartman2020; Struble et al., Reference Struble, Roering, Black, Burns, Calhoun and Wetherell2020). These studies have mostly evaluated evidence for initiation by the last Cascadia Subduction Zone earthquake of AD 1700 or by rupture of a shallow crustal fault, but hydrological causes also have been evaluated (e.g., Henn et al., Reference Henn, Cao, Lettenmaier, Magirl, Mass, Brent Bower, Laurent, Mao and Perica2015; Struble et al., Reference Struble, Roering, Burns, Calhoun, Wetherell and Black2021).
Previous Assessments of Landslide Age
Central to understanding the causes and consequences of the Bonneville landslide is its timing. Approaches to dating have varied, including interpreting indigenous and explorer narratives (Barry, Reference Barry1935), dendrochronology (Gilbert, Reference Gilbert1900; Lawrence, Reference Lawrence1936, Reference Lawrence1937; Hodge, Reference Hodge1938; Pringle et al., Reference Pringle, O'Connor, Schuster, Reynolds and Bourdeau2002; Weaver and Pringle, Reference Weaver and Pringle2003), radiocarbon dating (Lawrence and Lawrence, Reference Lawrence and Lawrence1958; Minor, Reference Minor1984; O'Connor et al., Reference O'Connor, Pierson, Turner, Atwater and Pringle1996; Pringle et al., Reference Pringle, O'Connor, Schuster, Reynolds and Bourdeau2002), lichenometry (Reynolds, Reference Reynolds2001), and thermoviscous remanent magnetism (Smith and Verosub, Reference Smith and Verosub1994). These studies have given conflicting results, ranging from AD 1100 (Minor, Reference Minor1984) to AD 1775 (Barry, Reference Barry1935), a range causing substantial uncertainty with respect to hazard assessments, understanding of ecological and cultural effects, and plausible triggering mechanisms such as earthquakes.
The first assessments were dendrochronologic, either by counting rings of trees growing on and presumably post-dating the landslide or by attempting to cross-date the landslide by comparing tree-ring width patterns from cut samples of the submerged forest with nearby live trees. From counts of “rings in the stumps of trees which had grown on the landslide,” Gilbert (Reference Gilbert1900, p. 99–100) suggested the landslide was “not less than 350 years old” (ca. AD 1550). Hodge (Reference Hodge1938, p. 916–917) reported an attempt at cross-dating, but found no evident correlation or overlap between the drowned trees and nearby live trees. He did note, however, the oldest trees on the landslide were 250 years old, thereby giving a minimum age (ca. AD 1690) for the landslide. Lawrence (Reference Lawrence1936, Reference Lawrence1937) conducted the most detailed study, excavating and cutting rounds from six trees of the submerged forest as well as three live trees from nearby valley slopes. From ring-width patterns, he concluded at least four of the submerged forest trees died the same year, consistent with them being killed by rapid impoundment of the Columbia River, probably within days or weeks of the landslide. But like Hodge (Reference Hodge1938), he could not correlate the submerged trees with live trees, thus concluding the landslide preceded the ca. AD 1720 germination of his oldest sampled live tree (Lawrence, Reference Lawrence1936). Later, from ring counts of trees growing on the landslide and thus inferred to postdate the landslide, Lawrence (Reference Lawrence1937) concluded the landslide dated to sometime before AD 1562, similar to Gilbert's (Reference Gilbert1900) conclusion. Weaver and Pringle (Reference Weaver and Pringle2003) also counted annual rings for tens of old trees growing on the surface of the landslide, showing the landslide dated to before AD 1550.
Lawrence and Lawrence (Reference Lawrence and Lawrence1958) provided the first radiocarbon analyses for landslide age by dating samples of two of the submerged forest snags (Table 1). The resulting ages of 670 ± 300 and 700 ± 200 14C yr BP (obtained before the now-standard practice of calibrating radiocarbon age results to calendar years) led them to propose the landslide blocked the river ca. AD 1250. Since these very early radiocarbon analyses, more radiocarbon dating has been performed in connection with archaeologic and geologic investigations conducted in the late 1970s and 1980s during construction of the second Bonneville Dam powerhouse and channel excavated into the southern margin of the landslide (Fig. 1B). Radiocarbon ages compiled by Minor (Reference Minor1984; Table 1) include five samples of wood from material buried in the landslide or in Columbia River alluvium below the landslide. These ranged from 5550 ± 90 14C yr BP to 400 ± 70 14C yr BP. One sample came from the outer rings of a “tree covered by landslide debris” excavated during construction of the second powerhouse. This sample of what we term the Powerhouse tree (Table 2) gave an age of 830 ± 60 14C yr BP, leading Minor to suggest the landslide occurred ca. AD 1100. In making this assessment, Minor (Reference Minor1984, p. 10) dismissed the 400 ± 70 14C yr BP age from detrital wood fragments in alluvium below slide debris as “inconsistent with its order in the stratigraphic sequence,” speculating that “it may date a secondary deposit on top of Bonneville landslide deposits.” Schuster and Pringle (Reference Schuster, Pringle, Rybar, Stemberk and Wagner2002) later obtained two younger ages, 360 ± 50 14C yr BP and 410 ± 50 14C yr BP, from the same Powerhouse tree, contrasting with the 830 ± 60 14C yr BP age obtained by Minor (Reference Minor1984). These results, in conjunction with the previously dismissed 410 ± 50 14C yr BP age reported by Minor (Reference Minor1984), led Schuster and Pringle (Reference Schuster, Pringle, Rybar, Stemberk and Wagner2002) to suggest the landslide was younger, dating between AD 1670 and AD 1760, possibly coincident with and triggered by the most recent Cascadia subduction zone earthquake of January 26, 1700 (Satake et al., Reference Satake, Shimazaki, Tsuji and Ueda1996; Atwater et al., Reference Atwater, Musumi-Rokkaku, Satake, Tsuji, Ueda and Yamaguchi2005).
Radiocarbon ages from previous and current studies directly relevant to age of the Bonneville landslide.

Location coordinates in decimal degrees, WGS84; all locations approximate and based on original source documents and maps
Elevations relative to North American Vertical Datum of 1988 (NAVD88), adjusted +1.02 m from original reporting in NGVD29 on basis of VDatum v.4.1.2 transformation (https://vdatum.noaa.gov/).
Corrected radiocarbon ages (in 14C yr BP) are calculated on basis of Libby half-life of 5568 years. The error stated is +/- 1 standard deviation (sigma) on basis of combined measurements of the sample, background, and modern reference standards. Age referenced to year 1950 Common Era (CE). Where no measurements of 13C/12C, a value of -25‰ assumed for determining corrected conventional age.
Offsets assigned uncertainty of +/- 1 year for purposes of Oxcal “combine” analysis.
Calibrated 3-sigma calendar year age intercepts, in years relative to Common Era (CE), on basis of OxCal version 4.4.2 (5) (Bronk Ramsey, 2020) using IntCal20 Northern Hemispere radiocarbon age calibraton curve (Reimer et al., 2020) and a laboratory error multiplier of 1; where multiple intercepts, we list all ranges of >1% liklihood; BCE indicates before common era
Sampled ring intervals measured from pith except for the Wyeth
Summary of analyzed trees, including locations, current locations, ring counts, associated samples.

All analyzed trees were Douglas fir (Pseudotsuga menziesii)
Location coordinates in decimal degrees, WGS84; all locations approximate and based on original source documents and maps
Elevations relative to North American Vertical Datum of 1988 (NAVD88), adjusted + 1.02 m from original reporting in NGVD29 on basis of VDatum v.4.1.2 transformation (https://vdatum.noaa.gov/); Lawrence sample elevations estimated on basis of “low-water” elevation as shown in U.S. Army Corps of Engineers (1948, Appendix L, Plate 1)
Radiocarbon sample IDs as specified in Table 1
NEW DENDROCHRONOLOGIC AND RADIOCARBON ANALYSIS
Our study consists of new dendrochronologic and radiocarbon analyses of the Powerhouse tree and two of Lawrence's rounds excavated and cut from the submerged forest in 1934—one from the Perham Creek site and another from the Wyeth site (Fig. 2; Table 2). Because these samples have complicated histories and prior analyses affecting interpretation, we initially detail their provenance. We follow with our new dendrochronologic assessment of whether these three trees died the same year. Concluding they do, we use new radiocarbon analyses to determine a precise age estimate for their demise and thus the time of the Bonneville landslide.
Sources of Data
The Powerhouse Tree
During the 1970s, the U.S. Army Corps of Engineers constructed a second powerhouse at Bonneville Dam, north of the original 1938 structure and on the toe of the Bonneville landslide (Fig. 1B; Sager, Reference Sager1989). During excavation for the foundation, an 18-m-long, bark-bearing Douglas-fir tree bole and root wad, but missing branches, was retrieved from deep within the landslide deposit (Fig. 3A). The tree showed no evidence of pre-burial decay; thus we infer it was living at the time of entrainment and burial by the landslide. Upon excavation, it was cut into various sections, many of which were intended for display at regional museums and interpretive centers. It was from a sample of this tree that Minor (Reference Minor1984) obtained a radiocarbon age indicating a date of ca. AD 1100 for the landslide. Schuster and Pringle (Reference Schuster, Pringle, Rybar, Stemberk and Wagner2002) later obtained radiocarbon ages from a section of this tree indicating the landslide occurred as recently as AD 1700. These samples were later determined to have possibly been contaminated by wood preservative applied to the surface of the section they sampled.
Powerhouse tree. (A) Photocopied photograph from February 17, 1978, issue of the Skamania County Pioneer of tree being extracted during the 1978 excavation of the second Bonneville Dam powerhouse; courtesy of Tim Collins, Bencor Corp., personal communication to Pringle, 1998. (B) Sampling the round conserved at Willamette Locks Museum; photograph by Patrick Pringle.

Our current analysis is bolstered by discovery of a different portion of the Powerhouse tree—a single cross-section round from the main stem of the tree on display at the Willamette Locks Museum in Oregon City, Oregon, USA (Fig. 3B). In contrast to the previously sampled portion of the Powerhouse tree from the Columbia Gorge Interpretive Center, this round shows no evidence of preservative.
Our dendrochronologic analyses are based on both the Columbia Gorge Interpretive Center sample (for which contamination by preservative does not affect analysis or results) and the Willamette Locks Museum sample. We used three rays (radially oriented wedges cut from center to edge) obtained from a cut round of the Powerhouse tree stored at the Columbia Gorge Interpretive Center. This round was cut from ~2 m above the rootball, from which we extracted samples POW01a (100 rings), POW01b (103 rings), and POW01d (split into two incomplete parts). None of the sampled rays are complete from pith to bark, but the rays readily can be pieced together by ring tracing for a total ring count of 141 rings below preserved bark. We also analyzed two rays obtained from the round stored at the Willamette Locks Museum, sample POW01e (136 rings from outermost annual ring to pith) and POW01f (131 rings), oriented 65° to the first cut. POW01f is missing five innermost rings and pith owing to extraction of POW01e (Table 2). This round was cut from higher in the tree and hence has fewer total rings.
Our new radiocarbon dates of the Powerhouse tree derive from two 5-ring samples from the innermost and outermost sections of the uncontaminated round stored at the Willamette Locks Museum.
Trees of the submerged forest—Donald Lawrence samples from Wyeth and Perham Creek
In August and September of 1934, Lawrence (Reference Lawrence1936) collected six separate samples of standing snags of the submerged forest (Fig. 2). Because the above-ground portions of the snags had an unknown number of missing rings from erosion and decay, he excavated 1–2 m into the alluvium burying the base of each snag until reaching bark (Fig. 4A), where Lawrence (Reference Lawrence1936) reported excellent preservation of both bark and wood in the reducing conditions of the water-saturated sand and silt enclosing the stumps. Lawrence and a crew of Civilian Conservation Corps workers dug to below bark level and then, by crosscut saw, sliced rounds including the attached bark, which he affixed to the sampled round by wire banding. The six samples were four rounds of Douglas-fir and one of western redcedar from the Wyeth area, ~15 km upriver of the landslide, and a single round of Douglas-fir from near the Perham Creek confluence with the Columbia River, ~25 km upriver of the landslide (Fig. 2B). Lawrence's (Reference Lawrence1936) ring counts on the sampled trees ranged from 115–325.
Wyeth Tree. (A) Photographic figure from Lawrence (Reference Lawrence1936) showing excavation of bark-bearing snag from the Wyeth group of submerged and partly buried trees, possibly the sample preserved at the World Forestry Center. (B) Unlabeled round preserved at World Forestry Center, inferred to be one of Donald Lawrence's Wyeth group samples. Cut wedge is sample WYE01a.

It was from these samples that Lawrence correlated ring-width patterns that led him to conclude these trees died in the same year. The wood Lawrence and Lawrence (Reference Lawrence and Lawrence1958) sampled for radiocarbon dating was from cross sections of two samples: the largest 325-ring Douglas-fir in the Wyeth group sampled in 1934, and a Garry oak near the upriver end of the submerged forest that probably was collected in 1936–1937 (Lawrence and Lawrence, Reference Lawrence and Lawrence1958; Table 1).
Some of Lawrence's samples were displayed in the Lewis and Clark Centennial Exposition's Forestry Building in Portland, Oregon, but these apparently were destroyed by fire in 1964. In 1987, Donald Lawrence knew of no existing samples of the submerged forest (personal communication with Patrick Pringle at that time). Our attempts in the 1990s to retrieve additional samples from Lake Bonneville were unsuccessful. In 2001, alerted by a museum curator, we fortuitously discovered four rounds of trees originally cut by Lawrence in 1934. The samples were stored at the World Forestry Center in Portland, Oregon, where they had been recently accessioned as part of the personal materials of Thornton T. Munger, first director of the U.S. Forest Service's Pacific Northwest Forest and Range Experiment Station. Munger facilitated Lawrence's 1934 study, accompanied and photographed Lawrence's fieldwork (Fig. 2A), and prepared the Forestry Building exhibit that reportedly burned in 1964. Munger died in 1975, which may explain why Lawrence was unaware of these remaining samples in 1987.
The samples held by the World Forestry Center (Figs 4, 5) include the only known samples of the submerged forest, hence their provenance and completeness is critical to our analysis. These samples were unambiguously collected by Lawrence. Three had attached handwritten sample tags signed by Lawrence and noting location and date of collection. One was unlabeled, but retained the wire ring and nails characteristic of Lawrence's strategy to preserve the outer bark (Fig. 4B). Of these four rounds, two with labels were from live trees felled in 1934, a Douglas-fir and cottonwood, and the other two (one labeled, one not) were Douglas-firs from the submerged forest. The labeled round was from Perham Creek (Fig. 5C). Lawrence (Reference Lawrence1936) reported only one sample from Perham Creek, and that it had 212 annual rings. The portion preserved at the World Forestry Center was checked, cracked, and missing bark (Lawrence's sample note describes that in this instance, the bark was peeled off during collection); we counted 186 annual growth rings on the most-complete axis and infer the outermost 25 rings are missing (Lawrence apparently included the center pith in his ring counts; because we did not, our ring counts are one fewer than Lawrence's—a conclusion confirmed by our ring-width analyses described herein).
Perham Creek tree. (A) Scanned photograph appearing in August 25, 1935, Oregonian (Lawrence, Reference Lawrence1935) showing excavation in preparation for sampling a Douglas fir snag in the Perham Creek group of submerged trees, probably the sample preserved at the World Forestry Center; from Washington State University digital collection. (B) Labeled round preserved at World Forestry Center from which both sampled wedges were cut. (C) Note by Donald B. Lawrence that had been attached to the round in (B), documenting provenance of this key sample.

The unlabeled Douglas-fir sample (Fig. 4B) had 127 counted rings and bark (fixed to the round by nails and wire). We did not count or measure the pith and a very narrow, partly formed first ring. This round is almost certainly the 129-ring sample (by Lawrence's count) extracted from the Wyeth group in 1934 (Lawrence, Reference Lawrence1936). From each of the Lawrence rounds of the submerged forest, we sampled two radial wedges for radiocarbon and ring-width analyses (Figs. 4B, 5B).
Assessing synchroneity of tree death
Did all trees die the same year? This question is critical to our subsequent radiocarbon assessment of landslide age. Only by knowing tree death was synchronous among the three analyzed trees can we relate and combine the radiocarbon analyses of the three trees. We assessed this question with dendrochronology, by examining ring-width patterns visually and statistically to establish correlation among the nine rays cut from three trees.
Dendrochronologic methods
All sampled rays were glued to mounts, sanded, and polished using progressively finer sandpaper, finishing with 1000-grit (9.5 μm) or finer paper. All polished rays were scanned with a high-resolution (0.01 mm) flatbed scanner. These scans were used in conjunction with image analysis software to count and measure the widths of the annual growth rings for the entirety of each sample (Fig. 6; Supplementary Table 1).
Ring-width measurements for all nine individual measurement rays from the three analyzed trees (ray pow01d consisted of multiple segments), referenced to year of tree death; marker rings indicated by dashed vertical red lines. Radiocarbon sample intervals shown by gray shading. Underlying data in Supplementary Table 1.

Our visual examination used the list method described by Phipps (Reference Phipps1985) and Yamaguchi (Reference Yamaguchi1991). We also used a variation of the skeleton plot technique (Stokes and Smiley, Reference Stokes and Smiley1968; Swetnam et al., Reference Swetnam, Thompson and Sutherland1985) to identify “marker rings” common between samples from different trees that might indicate simultaneous recording of regional climatic conditions or other factors affecting tree growth over a wide area.
Our quantitative assessment first entailed constructing a standardized chronology for each of the three trees (Fig. 7; Supplementary Table 2), which was done with the aid of the ARSTAN software (Cook and Krusic, Reference Cook and Krusic2008; Speer, Reference Speer2010). Ring-width measurements were normalized in reference to a 32-year spline curve that was fit to each series, producing serially independent standard indices highlighting annual ring-width variability. The multiple series of indices from each tree were averaged within ARSTAN using bi-weight means. For the Powerhouse tree, all five sets of ring-width measurements were combined. For each of the Wyeth and Perham Creek trees, we combined the two series of ring-width measurements. The resulting standardized chronology for each tree is “floating,” meaning its reference to a calendar age is unknown.
Standardized ring-width indices and marker rings (dashed vertical red lines) for each of the three trees, normalized in reference to a 32-year spline curve fit to each series and averaged using bi-weight means within the ARSTAN software (Cook and Krusic, Reference Cook and Krusic2008; Speer, Reference Speer2010). Ring-width index values provided in Supplementary Table 2.

The possible correlations among these three standardized chronologies were evaluated with COFECHA software (Holmes, Reference Holmes1983; Grissino-Mayer, Reference Grissino-Mayer2001), which quantifies correlations among ring-width series by calculating Pearson product-moment correlation coefficients, specified as r values. In comparing two series, the software examines all possible alignments of the ring-width indices and calculates the best potential matches from the resulting correlation values and associated t statistic, which is a function of the degree of correlation and the number of rings in the aligned series. For example, two ring-width series compared over a length of 50 rings with a correlation (r) value of 0.3281 would allow one to reject the null hypothesis that the two series are unrelated at the P = 0.01 level for a one-tailed (only positive correlations are of interest) test (t = 3.5). Longer overlapping segments and higher correlation coefficients give higher t values, and therefore more secure matches. Ring-width correlations among two series are commonly judged to be conclusively matched—that is to mean from the same series of years—when t > 6.0 (Grissino-Mayer, Reference Grissino-Mayer2001).
Dendrochronologic results
From visual examination of the nine sampled rays from the three trees, we identified narrow marker rings 7, 14, 30, 46, 54, 82, 85, and 109 rings below the bark among the samples, assuming the Perham sample is missing the outermost 25 rings (Fig. 6). Our analysis indicates marker rings 30, 54, 82, 85, and 109 below the bark were common to all three trees. The marker rings 7 and 14 below the bark were common to the Powerhouse tree and the Wyeth sample. These rings are now missing from the Perham Creek round, but Lawrence's handwritten note attached to the sample reported a narrow ring 13 rings below the bark, which is possibly the same as the 14th ring noted on the other trees. The markedly narrow ring (following a thick ring) 46 rings below the bark was common to almost all samples, but in many Powerhouse samples, the 45th ring is slightly narrower.
Our verification of the co-occurrence of these marker rings in Lawrence's samples supports his conclusion that trees of the submerged forest died the same year. This result is bolstered by identifying corroborating marker ring patterns in the Powerhouse tree, which was killed directly by the landslide. Moreover, the quantitative correlations among the standardized chronologies strongly indicate that all three trees died the same year, assuming the Perham tree is missing the outermost 25 rings as judged from Lawrence's description of the original sample (Fig. 8; Table 3). The Wyeth chronology, from a central site between the Powerhouse tree (15 km west) and the Perham Creek tree (10 km east), correlates strongly (r >0.5, t >6, p <.0001) with both the upriver and downriver chronologies. The match between the Powerhouse and Perham Creek chronologies is also highly significant (r = 0.43, t = 5, p <.0001), although not as strong, possibly a consequence of the 25 km distance between the two trees in an area of strong climatic gradients. Moreover, the correlations for the final ring being the same year for all three trees, assuming the Perham Creek tree is missing its outermost 25 rings, are much stronger than any alternative best-match correlations (Fig. 8).
Top five matches by t statistic of lagged correlations among the standardized ring-width indices for the three trees. All correlations are significant at p =.01. In all cases, the best correlation by far, as measured by the t statistic, is for the case of the final ring of all three trees being from the same year (with the condition of the Perham Creek tree missing its outermost 25 rings).

Correlation matrix among three index series; based on “MatchCorrelationsStandardizedIndices.xlsx.”

Correlations are among the ring-width indices developed for each of three sampled trees (Supplementary Table 2)
Last correlated ring indicates matched final ring for each sample (counted from pith) of the correlation
Years overlap indicates the number of correlated rings common to the ring-width indices of both trees
r is the Pearson product-moment correlation coefficient for the tentative match
t is the t statistic, a function of the correlation (r) and sample size (years overlap)
P value indicates the one-tailed probability of the null hypothesis for the correlation
Our conclusion, from both co-occurrence of marker rings and statistical assessment, is that all three trees died the same year. The Powerhouse tree died by entrainment and burial in the Bonneville landslide. The Wyeth and Perham trees died by drowning as the Columbia River quickly rose behind the 80-m-high landslide dam.
Radiocarbon dating the timing of tree death
The dendrochronologic evidence showing all three trees died the same year enables precise radiocarbon dating of the timing of tree death by taking advantage of multiple samples of different ages, but of known age relation (by ring count) to each other.
Radiocarbon dating methods
We dated nine new samples in total—four from the submerged tree at Wyeth, three from the Perham Creek tree, and two samples from the Powerhouse tree entombed by the Bonneville landslide (Fig. 6; Table 1). Each sample consisted of a specified number of rings, 5 or 10, measured from the outermost ring under the bark. For the case of the Perham Creek tree, our ring count accounted for the outermost missing 25 rings from a total 211 rings, our revision of Lawrence's original count of 212, as confirmed by our dendrochronological analysis.
Our first assessment was for two samples of ten rings each, spaced several decades apart, from the submerged trees at Wyeth and Perham Creek. These four samples were sent to Stafford Labs for processing and analyzed by acceleration mass spectroscopy at Lawrence Livermore Labs, California, USA (Table 1). The results from these analyses guided subsequent sampling targeted at steep segments of the radiocarbon calibration curve to improve precision (e.g. Svetlik et al., Reference Svetlik, Jull, Molnár, Povinec, Kolář, Demján and Pachnerova Brabcova2019). The second assessment was for two additional samples of the Wyeth tree, another sample of the Perham Creek tree, and two samples of the uncontaminated Powerhouse tree round stored at the Willamette Locks museum. These five samples were 5-ring segments, sent to the U.S. Geological Survey laboratory for pre-processing, including cellulose extraction, then analyzed by acceleration mass spectroscopy at Lawrence Livermore Labs.
All nine results were calibrated to calendar years using the software program OxCal version 4.4 (Bronk Ramsey, Reference Bronk Ramsey2009) and the IntCal20 atmospheric radiocarbon decay curve (Reimer et al., Reference Reimer, Austin, Bard, Bayliss, Blackwell, Bronk Ramsey and Butzin2020) (Table 1, Fig. 9A). Each result was further adjusted by using the “Offset” function of OxCal 4.4. We moved each calibrated calendar-year probability distribution forward in time by the number of years between the centroid ring position of each sample and the bark (as determined from tree-ring counts and the verified missing outer 25 rings of the Perham round), so each calendar-year distribution represents the final year of tree growth (Fig. 9B). These nine measurements, offset on the basis of the dendrochronology results, were combined into a single probability distribution with the “Combine” function of OxCal 4.4. This approach applies Bayesian statistics to pool likelihoods from multiple probability distributions to resolve a single combined probability distribution, in this application representing the calibrated age of the final annual ring (Fig. 9B).
Radiocarbon age calibrations and combined age analysis. (A) Probability density functions of calendar age calibrations of radiocarbon age determinations (Table 1) based on IntCal20 Northern Hemisphere radiocarbon age calibration curve (Reimer et al., Reference Reimer, Austin, Bard, Bayliss, Blackwell, Bronk Ramsey and Butzin2020). Calibrations by OxCal version 4.4.2 (r5) (Bronk Ramsey, Reference Bronk Ramsey2009). (B) Combined age assessment of tree death accounting for offsets from final ring (annotated in A and accounting for 25 missing outer rings in the Perham Creek samples) by wiggle matching approach of Bronk Ramsey et al. (Reference Bronk Ramsey, van der Plicht and Weninger2001). Resulting three-sigma estimate of the final ring date of each tree is AD 1421–1455.

Radiocarbon dating results
Each of the individual radiocarbon-age results have calibrated calendar age uncertainties spanning several decades because of substantial variations in atmospheric 14C between AD 1000 and AD 1500 (Table 1; Fig. 9B). The results of the offset and combined analysis, however, provide a much more precise age for the timing of the synchronous tree death: a 2σ (95% probability) estimate of AD 1426–1448, and a 3σ (99.7% probability) estimate of AD 1421–1455. The Bonneville landslide and rapid drowning of the submerged forest almost certainly happened within this age range.
SUMMARY AND IMPLICATIONS
Our new age determination of AD 1421–1455 (3σ) for the Bonneville landslide derives from combined radiocarbon dating of a tree killed by entrainment in the landslide and two trees killed by drowning in the resulting impoundment of the Columbia River. This result is premised upon dendrochronologic analysis showing that all three trees died the same year.
Our results are consistent with the age of the oldest trees found on the landslide by Gilbert (Reference Gilbert1900), Lawrence (Reference Lawrence and Lawrence1958), and Weaver and Pringle (Reference Weaver and Pringle2003), all germinating after ca. AD 1550. The germination gap of about 100 years may represent ecesis time, growth to sampling height, fire history, or lifespan limits of Douglas-fir on the landslide. The age is also consistent with several previous radiocarbon ages, including calibrated assessments of Lawrence and Lawrence's (Reference Lawrence and Lawrence1958) results, the two analyses deemed contaminated by Pringle and Schuster (Reference Pringle, O'Connor, Schuster, Reynolds and Bourdeau2002), as well as the discounted young age of Minor (Reference Minor1984), which calibrates to AD 1386–1675 (3σ) (Table 1). Our results indicate a landslide age more than 150 years younger than the AD 1250 age estimated by Lawrence and Lawrence (Reference Lawrence and Lawrence1958) from their early radiocarbon dating of samples of the submerged forest, and more than 300 years younger than AD 1100 age proposed by Minor (Reference Minor1984).
Despite the well-preserved state of the submerged forest snags, tree death was nearly 600 years ago, explaining why Lawrence could not readily cross-date his samples with live trees. Cross-dating efforts continue, bolstered by longer records extracted regionally from long-lived trees, as well as those killed by past geologic events such as lahars and earthquake-formed lakes (Zhang and Hebda Reference Zhang and Hebda2004, Reference Zhang and Hebda2005; Yamaguchi, Reference Yamaguchi2005; Pringle, Reference Pringle2014). It is likely such cross-dating, guided by the high-precision radiocarbon dating reported here, will reveal the exact year of the Bonneville landslide (Pringle et al., Reference Pringle, Reynolds, O'Connor, Schuster, Weaver and Black2021).
Our refined date provides context for the cultural and ecologic consequences of the landslide, river blockage, subsequent incision, and downstream flooding. Upstream Indigenous settlements were quickly inundated, as recounted by oral histories (e.g., Clark, Reference Clark1952). Even after the temporary impoundment receded, formation of the Cascades rapids from landslide remnants created local new portage and fisheries economies for Indigenous people, thereby permanently altering landscape occupancy, resource acquisition, and trade patterns (Beckham, Reference Beckham1984; Minor, Reference Minor1984). Some upstream village sites likely remained permanently flooded by the 11.5 m remnant ponding of river level upstream of the Cascades rapids (Strong, Reference Strong1959). Downstream Indigenous settlements may have been affected by dam-breach flooding (Pettigrew, Reference Pettigrew1981; Bourdeau, Reference Bourdeau2004). Such flooding, indicated by boulder bars downstream of the breach and distinctly coarse sand and silt deposits in the downstream estuary, predate the AD 1479 Kalama eruption of Mount St. Helens (Atwater, Reference Atwater1994; O'Connor et al., Reference O'Connor, Pierson, Turner, Atwater and Pringle1996; Bourdeau, Reference Bourdeau2004; O'Connor and Burns, Reference O'Connor, Burns, O'Connor, Dorsey and Madin2009).
The ecologic consequences also may have been significant. As reviewed by O'Connor (Reference O'Connor2004), a blockage ~75 m high may have hindered anadromous fish passage; if blockage lasted for more than the 3–5-year life history cycle of Pacific salmon, upper Columbia basin runs could have been significantly diminished, at least temporarily. It is also possible the landslide and remnant ponding upstream of the Cascades rapids enhanced fish passage into the upper Columbia basin by reducing the total fall of the Dalles of the Columbia—a scenario told in oral histories (Lawrence and Lawrence, Reference Lawrence and Lawrence1958) and elaborated by Condon (Reference Condon1869) and O'Connor (Reference O'Connor2004).
Our more precise age also facilitates consideration of triggering mechanisms for the landslide. One possibility is a hydrologic trigger, wherein in a wet season or series of wet years help initiate motion, which is a possible factor for the catastrophic Oso slide in Washington State in 2014 (Henn et al., Reference Henn, Cao, Lettenmaier, Magirl, Mass, Brent Bower, Laurent, Mao and Perica2015) and for several landslides in Oregon (Struble et al., Reference Struble, Roering, Burns, Calhoun, Wetherell and Black2021). Another potential trigger is seismic shaking, which has caused many landslides and landslide dam disasters globally (Fan et al., Reference Fan, Scaringi, Korup, West, Van Westen, Tanyas and Hovius2019). Earthquake-landslide co-occurrence has been the subject of focused research in the Coast and Cascade ranges of the Pacific Northwest, with both Cascadia Subduction Zone quakes and rupture of shallow crustal faults (Schuster et al., Reference Schuster, Logan and Pringle1992; Leithold et al., Reference Leithold, Wegmann, Bohnenstiehl, Smith, Noren and O'Grady2018, 2019; LaHusen et al., Reference LaHusen, Duvall, Booth, Grant, Mishkin, Montgomery, Struble, Roering and Wartman2020; Struble et al., Reference Struble, Roering, Black, Burns, Calhoun and Wetherell2020) identified as seismic triggers. Our AD 1421–1455 (3σ) age for the Bonneville landslide shows it preceded the last great Cascadia Subduction Zone earthquake of AD 1700 (Atwater et al., Reference Atwater, Nelson, Clague, Carver, Yamaguchi, Bobrowsky and Bourgeois1995, Reference Atwater, Musumi-Rokkaku, Satake, Tsuji, Ueda and Yamaguchi2005; Yamaguchi et al., Reference Yamaguchi, Atwater, Bunker, Benson and Reid1997) by more than 250 years. The Bonneville landslide, however, may correlate with the penultimate “T2” megathrust rupture inferred from offshore turbidite deposits dating to AD 1402–1502 (Goldfinger et al., Reference Goldfinger, Nelson, Morey, Johnson, Patton, Karabanov, Gutierrez-Pastor, Eriksson, Gracia and Dunhill2012). Alternately, a candidate for rupture of a local crustal fault is the recently discovered Gate Creek fault, which is marked by a fresh-appearing scarp cutting north into the Columbia River Gorge ~15 km east of the Bonneville landslide headscarp. Preliminary dating indicates the latest rupture was ca. AD 1350–1500, consistent with the landslide age (Bennett et al., Reference Bennett, Streig, Levinson, Roberts, Dunning, Wells and Madin2021; O'Connor et al., Reference O'Connor, Wells, Bennett, Cannon, Staisch, Anderson, Pivarunas, Booth and Grunder2021).
Acknowledgments
Curator David Popma alerted us to the presence and facilitated sampling of Lawrence's two surviving rounds from the drowned forest at The World Forestry Center, Portland, Oregon, USA. U.S. Army Corps of Engineers permitted our sampling of the Willamette Locks round of the Powerhouse tree, which is held at the Willamette Locks Museum in Oregon City, Oregon, USA. Three additional samples of the Powerhouse Tree used in our dendrochronological analyses came from a section held at the Columbia Gorge Interpretive Center in Stevenson Washington, USA, which kindly permitted sampling. Radiocarbon analyses were funded by the U.S. Geological Survey. The manuscript was improved by reviews by Sean LaHusen, two Quaternary Research reviewers, and Quaternary Research editors Jeff Pigati and Derek Booth.
Supplementary material
The supplementary material for this article can be found at https://doi.org/10.1017/qua.2022.7.


 Open access