Introduction
Calving glaciers are dynamically important elements of the cryosphere, but the physical processes that control calving rates are complex, imperfectly understood and not yet quantified (Bahr, 1995; van der Veen, 1995). A robust, though unexplained, positive linear correlation exists between calving speed (v c) and water depth (h w) at grounded, temperate calving termini. This relationship applies both in tidewater (Brown and others, 1982) and in fresh water (Warren and others, 1995b), although the slope coefficient is some 15 times greater in the former. It is well established that the instability introduced to the glacier system by calving frequently produces heterogeneous glacial responses to climate (e.g. Wiles and others, 1995; Motyka and Begét, 1996) through the interaction of the calving terminus with topographic geometry and effective water depths (Powell, 1991; Sturm and others, 1991). Here we present a case-study of Glaciar Pio XI, the fluctuation history of which contrasts with regional patterns of glacier fluctuation. We present new data from 1993 and 1994, and revise and refine the explanatory hypothesis proposed by Warren and Rivera (1994).
During the 20th century, most glaciers throughout Patagonia have been retreating from extended Little Ice Age positions, with a variety of topoclimatic contrasts superimposed on this pattern (Warren and Sugden, 1993). Calving glaciers, which form the majority, have also mostly retreated in historic time, although some heterogeneous behaviour has been observed (Warren and others, 1995a). Climate records from Evangelistas (52°20ʹ S, 75° 06ʹ W) and Isla San Pedro (47°25ʹ S, 74° 35ʹW) span the periods since 1900 and 1932, respectively (Rosenblüth and others, 1995). They exhibit wide interannual variability and an irregular warming trend. Precipitation at Evangelistas has decreased monotonically. Local climatic gradients arc steep, so these records may not reliably indicate climatic trends affecting the glaciers. For example, increased precipitation was recorded in the 1930s and 1940s, and since 1970, at Punta Arenas (53°10ʹ S, 70°54ʹW) and Cabo Raper (46°48ʹS, 75°45ʹW). Thus even the sign of the climatic influences on the ice fields remains unclear. However, given that some western outlet glaciers of Hielo Patagónico Sur (HPS; southern Patagonia ice field) advanced during ibe middle years of the 20th century (Mercer, 1970), it is reasonable to assume that there was a climatically driven shift towards positive mass balance at that time.
Glaciar Pio XI
Glaciar Pio XI (49°43ʹ S, 74°00ʹW) (fig. 1a), also called Glaciar Brüggen, is the largest outlet glacier of HPS. It is 64 km long, with a surface area of 1277 km2 and an altitudinal range of some 3000 m (Aniya and others, in press). The equilibrium-line altitude (ELA) most probably fluctuates around the 1000 m contour, indicating a high accumulation area ratio AAR) of 0.80. The glacier (fig. 1b) bifurcates into two large distributaries, each about 4 km wide. One arm terminates in tidewater in Fiordo Eyre. The other terminates in Lago Greve, a 240 km2 ice-dammed lake which discharges northwards to the southern margin of Glaciar Hammick (or Glaciar Occidental) over a col at a height of about 150 m (fig. 1a). Prior to inundation the site of the lake was a broad out wash plain grading into intertidal mud-flats, so the calving front in Lago Greve is probably standing in water ≤150 m deep. The glacier surface in the ablation area is clean except for prominent medial moraines and outcropping tephra bands. The presumed source of the tephra is Volcàn Lautaro, an active nunatak volcano 3380 m high which abuts the glacier’s accumulation area (fig. 1a). Surface ice velocities appear to vary widely. Marangunic (1964) estimated a speed of 750 m a1 from the displacement of surface features on successive sets of aerial photographs. The same technique using Landsat images of 26 December 1984 and 14 January 1986 yields a mean velocity of 1200 m a−1 at a location 7 km behind the tidewater terminus and 1.5 km from the west margin. In November 1995, serac displacements over a 5 d period close to the tidewater terminus indicated a mean speed of 19.0 m d−1 (6980 m a −1) in the middle parts of the glacier (Rivera and others, 1997).
20th-century fluctuations of Glaciar Pio XI. (a) The northern half of Hielo Patagónico Sur, showing the main glaciers, primary drainage divides and ELAs (dashed lines) in the Pio XI region (after Aniya and others, in press). G.P.X., Glaciar Pio XI: G.G., Glaciar Greve; G.H., Glaciar Hammick; G.O., Glaciar O’Higgins; G.V., Glaciar Viedma. (b) Dated positions of the glacier termini since 1925. All undated ice margins are shown as at 14 January 1986. (c) Dated positions of the Lago Greve terminus since 1975. (d) Dated positions of the Fiordo Eyre terminus since 1975. (e) Location of the study area.

Methods
Ice front positions were plotted using a variety of remotely sensed images (aerial photographs from 1945, 1975, 1981 and 1984; Landsat scenes from 1976, 1984 and 1986; a 1994 Space Shuttle SAR image) supplemented with published material. During field visits in February 1992 and November 1993 the tidewater terminus was mapped using a combination of ground survey, global positioning system (GPS) equipment and nautical radar. Water depths close to the calving front were measured in both years, and a west–east transect of vertical water temperature profiles recorded. Frequent calving and increased floating ice prevented bathymetric survey as close to the terminus in 1993 (about 200 m) as in 1992 (about 50 m). The Lago Greve terminus was not reached, but was observed from a high vantage-point to the south. One of the authors (G.W.) obtained near-vertical views of Lago Greve in December 1993 from a commercial flight. Further work undertaken in November 1995 is reported by-Rivera and others (1997).
Results
Historic fluctuations
The behaviour of Glaciar Pio XI has been described by Lliboutry (1956), Mercer (1964), Iwata (1983), Aniya and others (1992) and Warren and Rivera (1994). These observations are summarised below and illustrated in figure 1b –d. The presence of icebergs in Fiordo Eyre in 1830 (King, 1839, p. 337) shows that the glacier terminated in tidewater at that time. During the 20th century the glacier has advanced and retreated several times, including a rapid advance across the fjord in 1926 at rates of ≤ 20 m d−1 (Agostini, 1945, p. 59–62; Lliboutry, 1956, p. 231, 389). This blocked the Greve valley which then became inundated. Contemporary photographs (Agostini, 1945, p. 60) show that calving was occurring along the margins of the terminus but that its central section was advancing on a morainal bank at sea level.
Between 1928 and 1945 the glacier retreated 3–5 km, and Lago Greve emptied. ? readvance of 5 km then occurred between 1945 and 1962, doubling the length of the tidewater front and causing Lago Greve to re-form. Almost 4 km of further advance had occurred by 1975. The Lago Greve terminus also advanced between 1945 and 1975, although at a lower mean rate (130 vs 290 m a−1), and in the interval 1975–93 the advance continued uninterruptedly at about 100 m a−1 (fig. 1c). By contrast, the tidewater front has oscillated rapidly since the early 1980s, A maximum was reached in 1982–83 (unpublished information from J. H. Mercer, 1987) followed by retreat totalling 1000–2500 m by 1989 (personal communication from E. Garcia, 1993). Advance then recommenced in the early 1990s followed by retreat most recently (fig. 1d). At its early 1980s maximum, the glacier cut a section through organic material which yielded a basal date of 5880 ± 70 BP (unpublished information from J. H. Mercer, 1987) showing that the glacier had not been further advanced during at least the last 6000 years. Given that elsewhere in Patagonia this interval comprises the entire Neoglacial (Mercer, 1982), it is likely that this position represented the glacier’s Neoglacial maximum.
Field observations: February 1992 and November 1993
In February 1992 the tidewater terminus had readvanced to within a few tens of metres of its 1983 maximum. Except for a vegetation trim-line zone near the terminus, most of the ice margin was overrunning mature forest. The calving front was 15–35 m high. The central 1500 m of the terminus was calving, but elsewhere a proglacial delta had aggraded to sea level to form extensive intertidal mud-flats. Glacial deformation of these sediments had formed stacked ice-contact wedges rising 5–10 m above sea level. Water depths were 17–22 m. Most icebergs were less than 5 m long and no berg larger than 20 m was observed. In contrast, many of the icebergs in Lago Greve exceeded 100 m in length. Production of large icebergs is characteristic at this terminus; the 1975 aerial photograph shows 15 bergs with long axes of > 100 m within 5 km of the calving front, and several bergs in the lake in 1985 had surface areas of ɤ20 000 m2.
By November 1993 the central part of the tidewater terminus had advanced a further 800 m (1.25 m d−1) (fig. 1d), and the calving cliff had increased in height to 50–65 m. At the site of the 1992 terminus the ice had thickened by 40–50 m. The proglacial sediment accumulations had been overridden, and calving was taking place along most of the terminus, producing icebergs ≤45 m long. Water depths ranged between 18 and 43 m, depths decreasing towards the ice front. Surface water temperatures were 6.6–7.1°C, increasing steadily to bottom temperatures of 8.2–8.9°C. Most of the western glacier margin was advancing over mature forest, and about 1500 m up-glacier an area of woodland had been inundated by a new ice-marginal lake. Shortly before the field visit, a meltwater stream had flowed overland close to the terminus, cutting a swath 10 m wide through the dense forest and scouring to bedrock. A misfit stream flowing in this new channel was subject to strong, aperiodic flow variations. The northern terminus continued its uninterrupted advance between 1984 and 1993, though in an asymmetric fashion (fig. 1c). While the eastern end of the terminus had thickened and advanced only slightly, the rest of the terminus had advanced 800–1200 m (100–150 m a−1). In 1993 the lake was covered with a greater profusion of large icebergs than that shown on any of the earlier remotely-sensed imagery.
Fluctuations, 1993–95
In November 1995 the glacier was intensely crevassed, and the northern 5 km of Fiordo Eyre was choked with floating ice (Rivera and others, 1997). The tidewater terminus was retreating rapidly from a maximum position some 200–250 m beyond its 1993 location. A Space Shuttle synthetic aperture radar (SAR) image of 14 April 1994 shows that there had been net retreat relative to 1993 by that time (fig. 1d), so the maximum must have been attained early in 1994. The SAR image shows that the Lago Greve terminus had advanced since 1993 at the much-increased mean rate of 800 m a−1, and that profuse calving had produced a continuous mass of floating ice stretching some 4 km beyond the ice front.
Surface area changes
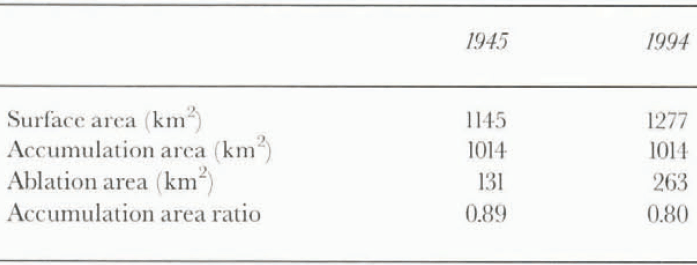
Table 1 presents surface areas for 1945 and 1994; the 1945 data also approximate to the situation in the early 1920s. Despite uncertainty about the ELA, it is clear that in 1945 the glacier had a high AAR, and that even by 1994, following enlargement of the ablation area by 132 km2, the AAR was about 0.80.
Surface area of Glaciar Pio XI in 1945 and 1994. Areas are based on the Chilean 1: 250 000 Carta Preliminar series (“Isla Angamos”) and digital analysis of 1986 Land-sat imagery (Aniya and others, in press), adjusted to incorporate subsequent advance. They assume an ELA of 1000 m, and no significant change in the accumulation area. The thickening ablation area is likely to have intersected the ELA, thus enlarging the accumulation area and maintaining a high AAR (cf. Mercer, 196l), but this cannot he demonstrated with available data.

Discussion
The oscillations of Glaciar Pio XI have been anomalous in relation to the general regional pattern of glacial fluctuations. It is well known that simple assumptions of linear glacier response to climate change are inadequate (Seltzer, 1994), and that some asymmetry and asynchrony is normal within any regional population of glaciers. However, calving glaciers are particularly prone to non-climatic oscillations (Wiles and others, 1995).
Glaciar Pio XI provides a striking example of glacier behaviour that cannot be explained with reference to climate change alone. The fluctuation pattern does not appear to relate to regional climatic trends, and contrasts sharply with that of neighbouring glaciers. For example, Glaciar O’Higgins, an eastern outlet glacier of HPS (fig. 1a), has simultaneously retreated some 12 km despite an AAR of >0.85 (Aniya and others, in press). Although the behaviour of Glaciar Pio XI is unique in South America, some tidewater glaciers in Alaska (e.g. Taku Glacier: Motyka and Beg3t, 1996) have oscillated in ways that display many of the features described here.
An explanatory model
The paucity of glaciological and meteorological data forbids rigorous investigation of Glaciar Pio XI’s dynamics, and renders any conclusions both speculative and tentative. However, the salient features of its recent behaviour may be explained through a simple descriptive model which combines the available empirical evidence with calving theory. The theoretical premises incorporated in this explanation are:
Sediment dynamics at a calving front can affect glacier stability by influencing effective water depths and hence v c, thereby permitting climatically independent fluctuations. This was proposed theoretically by Alley (1991) and confirmed by Hunter and others (1996).
Stability and behaviour of calving glaciers are conditioned by topographic geometry (Mercer, 1961; Warren, 1991).
We suggest that the primary control on recent oscillations has been effective water depth at the calving front, which has in turn been controlled by proglacial sedimentation. Climatically driven mass-balance variations may also have been significant in enabling the glacier to cross stability thresholds. Our hypothetical reconstruction is as follows.
1926–28 Proglacial sedimentation had progressively reduced h w and hence v c. A critical threshold was reached when ice supply exceeded mass loss at the terminus, permitting an advance. In 1925 or 1926 the ice front passed the mid-point of the channel. Thereafter, advance into progressively shallower water reduced v c and strengthened the advance through positive feedback. Along the central part of the terminus the morainal bank at sea level reduced v c to near zero, allowing the rate of advance to approach the ice velocity, as was observed at Hubbard Glacier, Alaska, in 1986 (Trabant and others, 1991).
1929–45 Two possible explanations exist for the 1930s retreat. It may have been climatically driven: temperatures were rising and precipitation in the 1920s had been low (Rosenblüth and others, 1995). Another possibility is that catastrophic drainage of Lago Greve triggered rapid retreat. A jökulhlaup draining a lake of this magnitude would generate large peak discharges. The present mean water depth is unlikely to be less than 75–100 m; given a surface area of 240 km2, the lake volume is therefore 18–24 km3. The outburst of a lake of this order of magnitude would erode the ice directly; more significantly, it could remove much proglacial sediment at the terminus, increasing h w and hence v c, perhaps triggering a retreat to the stable topographic pinning point (fig. 1b). During a lake outburst at Hubbard Glacier, the drainage of 5.4 km3 of water eroded a 300 m wide swath of soft sediments and jointed bedrock near the terminus, and caused glacier retreat (Trabant and others, 1991). It may be that both these processes operated, climate initialing glacier thinning which then permitted a jökulhlaup.
1945–75 Renewed sediment accumulation, combined perhaps with the climatic change that caused neighbouring glaciers to advance at this time (Mercer, 1970), produced a re-advance. The advance probably occurred on a morainal bank which moved with the terminus through a process of erosion on the proximal side and deposition on the distal side. Water depths in Fiordo Eyre nowhere exceeded 35 m (IHAC, 1951), permitting steady advance. Lago Greve refilled, reaching the altitude of the western col to overflow along the margin of Glaciar Hammick. The system thus attained a measure of stability, reducing the potential for a jökulhlaup.
1976–95 The present location of the tidewater terminus appears to be a quasi-stable position around which the front is fluctuating. The eastern end of the terminus has oscillated little following the formation of an ice-contact delta during the 1970s and consequent cessation of calving along that sector (fig. 1d). Given that the AAR is high (0.80) and that water depths are shallow, the glacier may continue to fluctuate around its present position. Advance beyond the fjord widening at the junction of Eyre and Exmouth fjords (fig. 1b) is unlikely since the glacier would face a steeply increasing ablation gradient at that point.
Weakness of the model
The primary weakness of the model is that it cannot be tested: glacier advance has obliterated the evidence. Data against which to test these ideas do not exist. Furthermore, two related and unanswered questions remain:
Is Glaciar Pio XI a surging glacier? The rates of advance in 1926 reported by Agoslini (1945), advance rates in 1992–94 and surface velocities in 1995 (Rivera and others, 1997) are typical of surging glaciers, as are the intense crevassing and rapid fluctuation observed recently. However, medial moraines are not looped and distorted, and the uninterrupted, steady advance of the Lago Greve terminus since 1945 is hard to reconcile with the possibility that the glacier surges; the dramatically increased rate of advance in 1992–94 is, however, consistent with surge behaviour. The question therefore remains open. One factor which may affect the behaviour of the glacier is the presence of Volcán Lautaro at the margin of the accumulation area (fig. 1a). Deposits of tephra on the glacier surface and increased geothermal heat flux could affect surface and basal melt rates, respectively, with consequences for flow dynamics (cf. Sturm and others, 1991).
Why has the calving terminus in Lago Greve advanced uninterruptedly while the tidewater front has fluctuated? It may be that lake-calving termini are inherently more stable than tidewater fronts, as indicated by observations in West Greenland (Warren, 1991) and in Alaska by one of the authors (A.P.). This is related to the fact that, in any given water depth, calving rates in lakes appear to be about 15 times lower than those in tidewater (Warren and others, 1995b).
Implications and Conclusion
At this site, calving instabilities have produced an oscillation history that may be anomalous on the time-scale of the entire Holocene. Given a long enough time-scale, most of the complexities of glacier–climate relationships usually disappear, but these results confirm that the climatically anomalous behaviour of calving glaciers may affect the glacio-climatic record on millennial time-scales (cf. Mann, 1986). This has implications for the Late-glacial and Holocene chronology of glacier oscillation in southern South America (Mercer, 1982) which rests on the dated fluctuations of a small number of (mainly calving) glaciers. It is also pertinent to the search for precise correlations between glacio-climatic episodes in the Chilean Andes and “Heinrich events” in the Northern Hemisphere (Lowell and others, 1995).
While most Patagonian glaciers have retreated during the 20th century, Glaciar Pio XI has advanced to its Holocene maximum. This cannot be explained through climate alone. We suggest, that sediment dynamics have been a primary factor permitting the anomalous advance, but the role of unusual ice dynamics such as surging remains unclear. The heterogeneous behaviour of other calving outlets of the Patagonian ice fields (Warren and others, 1995a) and of some calving glaciers in Cordillera Darwin (Holmlund and Fuenzalida, 1995) indicates that indirect climatic response of calving glaciers is not unusual in this region.
Acknowledgements
G. R. W. was in receipt of a U.K. Natural Environment Research Council Research Fellowship. A. R. acknowledges funding from FONDECYT Project 1950722. N. Glasser helped with fieldwork, and NAVIMAG, CONAF and the carabineros in Puerto Edén provided logistical assistance. M. Aniya kindly made pre-publication data available, and E. Rignot provided the 1994 SAR image. Detailed comments by two referees considerably improved the manuscript.