


Introduction
The semi-enclosed Mediterranean Sea underwent substantial changes due to its evolutionary history throughout the Tertiary period. Combined effects of the complex geological events, and palaeo-climatic history of the Mediterranean Sea, play a key role in shaping speciation and population structuring (Patarnello et al., Reference Patarnello, Volckaert and Castilho2007). Recent research, which describes genetic differentiation in some Mediterranean species, has indicated that habitats, biological and oceanographic conditions have a great impact on population structures, in addition to climatic changes and geological events (Avise, Reference Avise2000; Lemaire et al., Reference Lemaire, Versini and Bonhomme2005; Maggio et al., Reference Maggio, Lo Brutto, Garoia, Tinti and Arculeo2009; Mejri et al., Reference Mejri, Arculeo, Ben Hassine and Lo Brutto2011).
The gobiid fishes represent one of the most speciose groups in the Mediterranean Sea (Miller, Reference Miller, Whitehead, Bauchot, Hureau, Nielson and Tortonese1986). Among the Eastern Atlantic and Mediterranean gobiid fishes, the paraphyletic genus Pomatoschistus is one of the dominant gobiid group, consisting of 14 mainly marine species (Eschmeyer et al., Reference Eschmeyer, Fricke and van der Laan2019). Research on Pomatoschistus species and populations has revealed that there is a high genetic differentiation between both the western and eastern Mediterranean Sea and Atlantic–Mediterranean populations of these species (Gysels et al., Reference Gysels, Hellemans, Patarnello and Volckaert2004a, Reference Gysels, Hellemans, Pampoulie and Volckaert2004b; Larmuseau et al., Reference Larmuseau, Van Houdt, Guelinckx, Hellemenas and Volckaert2009; Mejri et al., Reference Mejri, Lo Brutto, Ben Hassine and Arculeo2009, Reference Mejri, Arculeo, Ben Hassine and Lo Brutto2011; Boissin et al., Reference Boissin, Hoareau and Berrebi2011; Tougard et al., Reference Tougard, Folly and Berrebi2014).
The marbled goby Pomatoschistus marmoratus (Risso, 1810) is a small benthic fish inhabiting near-shore sandy habitats and is widespread throughout the eastern Atlantic (western Spain and south-western coasts of France), Mediterranean, Black Sea, Azov Sea and Suez Canal (Miller, Reference Miller, Whitehead, Bauchot, Hureau, Nielson and Tortonese1986). They prefer spending their entire life cycle in shallow coastal regions, including lagoons with differing salinity values (Miller, Reference Miller, Whitehead, Bauchot, Hureau, Nielson and Tortonese1986; Mazzoldi & Rasotto, Reference Mazzoldi and Rasotto2001; Rigal et al., Reference Rigal, Chevalier, Lorin-Nebel, Charmantier, Jean-Antoine Tomasini, Aujoulat and Berrebi2008; Gonzalez-Wangüemert & Vergara-Chen, Reference Gonzales-Wangüemert and Vergara-Chen2014) and have a pelagic larval duration of 40–50 days under laboratory conditions (Locatello et al., Reference Locatello, Santon, Mazzoldi and Rasotto2017). The habitat preference of P. marmoratus is very close to the shoreline (generally 0–3 m), which is unstable and most affected by palaeo-climatic events. In addition, P. marmoratus exhibits benthic eggs and adults are known to be poor swimmers and habitat dependent, which makes this species quite convenient for researching genetic relationships between populations.
It is known that sand goby populations, which are important components of coastal biodiversity with their key roles in the food chain, are subject to many different selection pressures in the historical process of the Mediterranean Sea. Therefore, geographic variations between populations were emphasized (Gysels et al., Reference Gysels, Hellemans, Patarnello and Volckaert2004a, Reference Gysels, Hellemans, Pampoulie and Volckaert2004b; Huyse et al., Reference Huyse, Houdt and Volckaer2004; Larmuseau et al., Reference Larmuseau, Van Houdt, Guelinckx, Hellemenas and Volckaert2009; Mejri et al., Reference Mejri, Lo Brutto, Ben Hassine and Arculeo2009, Reference Mejri, Arculeo, Ben Hassine and Lo Brutto2011; Boissin et al., Reference Boissin, Hoareau and Berrebi2011; Tougard et al., Reference Tougard, Folly and Berrebi2014). The present study aims to obtain information about the evolutionary mechanisms and historical processes that affected the P. marmaratus populations in the sub-basins in the north-eastern Mediterranean Sea by identifying intra- and inter-population variation, possible isolations and gene flow.
Materials and methods
Sampling
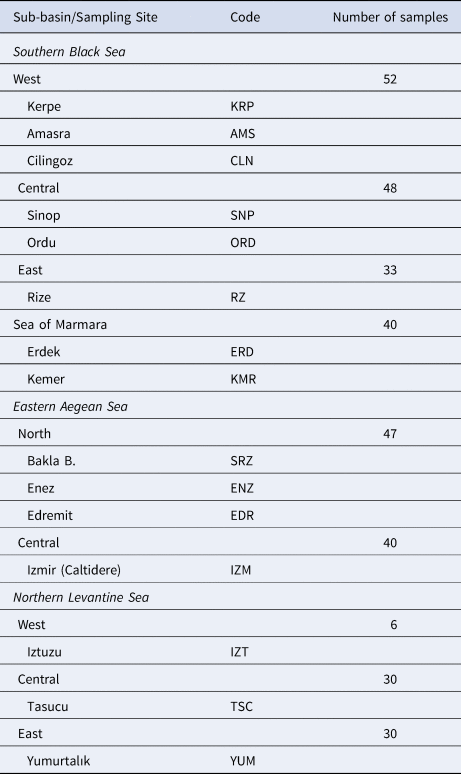
A total of 326 P. marmoratus specimens were sampled from 16 localities in the north-eastern Mediterranean (Turkish coasts of the Black Sea, Aegean Sea, Levantine Sea and Sea of Marmara) (Figure 1). Samplings and underwater observations were carried out in different seasons during a 3-year period from 2015–2018 with replications until 30 individuals were sampled from each sub-basin (Table 1). The specimens were caught from coastal shorelines at 0–3 m depth using hand nets in both scuba and free diving. All specimens were euthanized via an overdose anaesthetic (quinaldine). Pectoral fin clips of the specimens were fixed in 96% ethanol for genetic analysis.
Sampling locations of P. marmoratus. Each colour represents locations from different Seas. LEV, Levantine Sea; AEG, Aegean Sea; BLAMAR, Black Sea & Sea of Marmara.

Geographic locations of the P. marmoratus sampling sites, codes and number of samples
DNA extraction, amplification and sequencing
Total genomic DNA was isolated from the fin clips using the PureLink Genomic DNA mini kit (Invitrogen) and GeneJET Genomic DNA Purification Kit (Thermo Scientific). Fragments of mitochondrial DNA (mtDNA) were PCR-amplified with universal mitochondrial cytochrome c oxidase subunit I (COI) FishF1 and FishF2 primers, which are described in Ward et al. (Reference Ward, Zemlak, Innes, Last and Hebert2005) and specific primers PomCB1F and GobCB2R designed for the amplification of the mitochondrial cytochrome b (cyt b) described in Tougard et al. (Reference Tougard, Folly and Berrebi2014). The PCR thermal profile consisted of an initial step of 2 min at 95°C followed by 35 cycles of 30 s at 94°C, 30 s at 54°C, and 1 min at 72°C, followed in turn by 10 min at 72°C for COI, and DNA denaturation at 94°C for 5 min, followed by 35 cycles including a denaturation at 94°C for 45 s, an annealing at 50°C for 1 min, an extension at 72°C for 2 min, and a final extension at 72°C for 10 min for cyt b. Sequences produced by a private company (Macrogen Inc., Seoul, South Korea) were obtained for both strands to confirm polymorphic sites. They were aligned using MEGA v.7.0 (Kumar et al., Reference Kumar, Stecher and Tamura2016).
Population structure and phylogeographic analyses
Sequences were aligned using CLUSTAL W (Thompson et al., Reference Thompson, Higgins and Gibson1994) and manually edited in BIOEDIT 7.2.5. (Hall, Reference Hall1999). Polymorphic sites (s), haplotype diversity (h), nucleotide diversity (π), and the genetic structures of the locations were estimated using DnaSP v.5.0 (Librado & Rozas, Reference Librado and Rozas2009). The analysis of molecular variance (ϕst) and estimates of the gene flow (N em) (Hudson et al., Reference Hudson, Boos and Kaplan1992) were calculated using Arlequin 3.5 (Excoffier & Lischer, Reference Excoffier and Lischer2010), and P values were obtained by permutating data 1000 times.
The phylogeographic analyses for haplotypes were conducted on each separate gene, using MEGA. Pomatoschistus microps (GenBank accession numbers KM077855 and HF969830) was used to root the tree. The best-fit models of nucleotide substitution for COI and cyt b were calculated by the Akaike and Bayesian Information Criteria (AIC and BIC) approaches. The model with the lowest BIC and AIC scores are considered to describe the substitution pattern the best. Maximum likelihood (ML) analysis was performed with the software package MEGA, using the Kimura two parameter (K2P) distance model and Tamura–Nei model for COI and cyt b analyses, respectively, which were chosen after running the ‘Model Selection’ tool in MEGA. A bootstrap test with 1000 replicates was performed to verify the robustness of the tree. A median-joining haplotype network was generated through PopART (Leigh & Bryant, Reference Leigh and Bryant2015).
The samples which were clustered in a haplogroup, belonging to the same region, were subsequently used for analyses by means of a hierarchical analysis of molecular variance AMOVA (Excoffier et al., Reference Excoffier, Smouse and Quattro1992) using the software Arlequin 3.5 (Excoffier & Lischer, Reference Excoffier and Lischer2010). The historical demographic expansions were examined by the D test of Tajima, Fs test of Fu and Ramos-Onsins and Roza's R 2 (Tajima, Reference Tajima1989; Fu, Reference Fu1997; Ramos-Onsins & Rozas, Reference Ramos-Onsins and Rozas2002). While significant negative D and Fs statistics can be interpreted as a sudden population expansion after a bottleneck event, positive values indicate either balancing selection or demographic stability. The R 2 test, suitable for small sample sizes, is expected to produce lower values under a recent severe population growth scenario (Ramos-Onsins & Rozas, Reference Ramos-Onsins and Rozas2002). Historical demographic expansions were also investigated by examination of frequency distributions of pairwise differences between sequences (mismatch distribution) (Rogers & Harpending, Reference Rogers and Harpending1992). While the multimodal distributions indicate demographic stability, a unimodal distribution is consistent with sudden expansion (Slatkin & Hudson, Reference Slatkin and Hudson1991). Observed and expected distributions were compared with Harpending's (Reference Harpending1994) sum of squared deviations (SSD), and with the raggedness index (r) which were implemented in Arlequin 3.5. Due to this, the non-significant values of SSD indicate that the data do not deviate from that expected under the model of expansion. Besides this, the populations in demographic equilibrium, i.e. stable populations, have a large raggedness index and the populations that underwent recent expansion have small raggedness indices (Harpending, Reference Harpending1994).
The time since possible population expansion (t) was calculated separately for COI and cyt b through the equation τ = 2ut (Rogers & Harpending, Reference Rogers and Harpending1992), with u being the mutation rate of the sequence, calculated by u = 2μҡ, where μ is the mutation rate per nucleotide and ҡ is the number of nucleotides. A mutation rate of 2–4% per nucleotide and per million years (Myr) was used for COI analysis (Brown et al., Reference Brown, George and Wilson1979; Mejri et al., Reference Mejri, Lo Brutto, Ben Hassine and Arculeo2009, Reference Mejri, Arculeo, Ben Hassine and Lo Brutto2011) and 1–2% was used for cyt b analysis (Gysels et al., Reference Gysels, Hellemans, Patarnello and Volckaert2004a, Reference Gysels, Hellemans, Pampoulie and Volckaert2004b). To calculate the number of generations since expansion, we used the generation time of two years for P. marmoratus (Miller, Reference Miller, Whitehead, Bauchot, Hureau, Nielson and Tortonese1986).
Results
The abundance and prevalence of the Levantine Sea populations were found to be very low although the samplings were carried out in different seasons (with replications). Besides, these populations were observed only during the autumn (during the period of recruitment to stock). It should be noted that, during this period, we could observe just juvenile specimens, while adult individuals were very rarely observed. We think that the majority of individuals up to adult length are predated by lessepsians fishes in the area. However, it was found that the Aegean, Marmara and the Black Sea populations reached high abundance with uniform size classes if suitable habitats were found.
Genetic diversity
A 652 and 526 bp fragment of COI and cyt b gene were obtained for the 280 and 221 specimens of the marbled goby respectively, which were collected from the four sub-basins in the north-eastern Mediterranean Sea. The sequences were deposited in the GenBank under the accession numbers MT181761–MT181840 and MT181989–MT182021 for COI and cyt b, respecitvely. The COI sequences revealed 80 haplotypes, produced by the 105 variable sites, of which 69 were parsimony informative. A total of 74 variable sites and 59 parsimony informative sites produced 33 haplotypes for cyt b (Supplementary Table S1). All populations represented high values of haplotype diversity and low values for nucleotide diversity for each gene. The mean haplotype diversity (h) of the haplogroups varied from 0.762–0.889 and the mean nucleotide diversity (π) of the haplogroups varied from 0.002–0.004 for COI. The mean haplotype diversity (h) of the haplogroups varied from 0.401–0.802 and the mean nucleotide diversity (π) of the haplogroups varied from 0.001–0.005 for cyt b (Table 2).
Genetic diversity of the COI and cyt b sequences of P. marmoratus
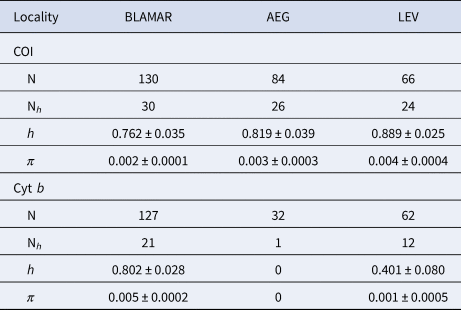
Number of analysed sequences (N); number of haplotypes (Nh); Haplotype diversity (h); Nucleotide diversity (π). LEV (Levantine Sea), AEG (Aegean Sea), BLAMAR (Black Sea & Sea of Marmara).
Population structure and phylogeographic analyses
Phylogeographic analysis of the haplotypes, performed on COI, revealed a phylogeographic division between analysed regions (Figure 2). Due to this, three highly divergent haplogroups from different seas were detected: (1) Haplotypes of the Sea of Marmara and the Black Sea grouped and generated BLAMAR haplogroup; (2) Aegean Sea haplogroup (AEG) and (3) Levantine Sea haplogroup (LEV) (Figure 2). Cyt b sequences showed lower resolution among populations and two haplogroups were detected: (1) Haplotypes of the Black Sea, Sea of Marmara and Aegean Sea grouped and generated one haplogroup AEGBLAMAR; (2) Levantine Sea haplogroup (LEV) (Figure 3).
ML tree constructed from COI sequences based on K2P model with P. microps (KM077855) as outgroup. Numbers at nodes are for ML bootstrap percentages (≥50%). The tree is drawn to scale, with branch lengths (under the branches) measured in the number of substitutions per site.

ML tree constructed from cyt b sequences based on Tamura–Nei model with P. microps (HF969830) as outgroup. Numbers at nodes are for ML bootstrap percentages (≥50%). The tree is drawn to scale, with branch lengths (under the branches) measured in the number of substitutions per site.

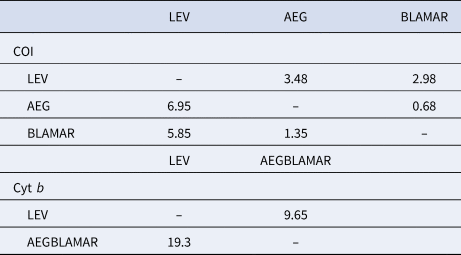
The estimated differentiation times of the haplogroups (LEV/AEG/BLAMAR) from each other were calculated. According to the analysis of the LEV and AEGBLAMAR haplogroups, based on the cyt b gene, the estimated differentiation times were 19.3–9.65 myr BP. The estimated differentiation times of both AEG-LEV and LEV-BLAMAR populations were found to be 6.95–3.48 and 5.85–2.98 myr BP and 0.68–1.35 myr BP for the AEG-BLAMAR haplogroups, respectively, based on the COI gene, which is thought to evolve faster and accumulate mutations. The most recent differentiation (1.35–0.68 myr BP) was observed between BLAMAR and AEG groups (Table 3).
Estimated differentiation times of the haplogroups based on a molecular clock of between 2% (slow/below diagonal) and 4% (fast/above diagonal) for COI gene and 1% (slow/below diagonal) and 2% (fast/above diagonal) for cyt b gene, respectively
AMOVA revealed that most of the total molecular variance (93.40%) was attributed to regional differences among groups. In addition, 2.14% was apportioned among the population within the group, and 4.46% was found to be the individuals within the population for COI (Table 4). Two alternative groupings were tested with AMOVA for cyt b sequences to find the best fit for our data: I. Clustering samples according to three haplogroup results, [BLAMAR] vs [AEG] vs [LEV]; and II. Clustering the samples according to two haplogroup results, [AEGBLAMAR] vs [LEV]. The grouping of sites which maximizes ᶲct was assumed to be the most probable geographic subdivision. Due to this, the first grouping showed the most probable geographic subdivision and AMOVA revealed that the total molecular variance (97.19%) can be found in regional differences among groups, while 1.83% was found among the population within the group and 0.99% individuals within the population for cyt b (Table 4).
AMOVA results for COI and cyt b sequences of P. marmoratus

Group 1 = BLAMAR (Black Sea and Sea of Marmara), Group 2 = AEG (Aegean Sea), Group 3 = LEV (Levantine Sea). *P < 0.05.
Evolutionary relationships among haplotype sequences were also analysed by median-joining networks for both genes, and these networks also supported the existence of three haplogroups (BLAMAR, AEG and LEV) for COI, and two haplogroups (AEGBLAMAR and LEV) for cyt b which were in agreement with ML trees in the north-eastern basin of the Mediterranean Sea (Figure 4A, B). The haplotype networks (Figure 4) resulted in a star-like shape, suggesting past demographic expansions for LEV (for both genes) and AEG haplogroups (Slatkin & Hudson, Reference Slatkin and Hudson1991), which were also consistent with mismatch analysis (Figure 5). The demographic history of the clades was inferred from neutrality tests (Fu's Fs, Tajima's D statistics and Ramos-Onsins and Rozas R 2) and mismatch distributions (sum of squared deviations SSD and raggedness index r) (Figure 5). A unimodal distribution was observed for LEV clade suggesting sudden expansion for both COI and cyt b analyses but results for BLAMAR clade were more confusing. While the results of Ramos-Onsins and Rozas R 2, SSD and r analyses and a multimodal distribution indicated stable populations for BLAMAR clade, negative values of Fu's Fs and Tajima's D statistics were observed for this clade. This inconsistency between mismatch distributions and neutrality test was explained by statistical power of the tests in previous studies (Ramos-Onsins & Rozas, Reference Ramos-Onsins and Rozas2002; Tougard et al., Reference Tougard, Folly and Berrebi2014). Due to this, BLAMAR clade is accepted as stable according to the results of Ramos-Onsins and Rozas R 2, SSD and r analyses and rejecting the population expansion model for both COI and cyt b. AEG clade produced significantly negative Fu's Fs and Tajima's D statistics and provided a unimodal pairwise mismatch analysis for the COI gene, which indicates population expansion. In addition to all these, cyt b analysis did not detect any polymorphism for AEG clade. Due to this, the estimates regarding timing since expansion based on COI analysis ranged from 0.194–0.097 myr BP and 0.236–0.118 myr BP for LEV and AEG clades, respectively, while it ranged from 475–237 BP for LEV clade in cyt b analysis (Figure 5).
Median joining network (A) for COI and (B) for cyt b genes. The network is connecting all sequences through putative mutational step and separating the three major clades for COI and two major clades for cyt b congruent with the ML tree subdivision. The number of samples is reflected by the size of the circles and each line segment between haplotypes represents a single mutation. Inferred intermediate haplotypes that were not sampled are shown as black dots.

Mismatch distribution analysis for COI and cyt b genes with neutrality tests and demographic indices for each Pomatoschistus marmoratus clade. Fu's test of neutrality (Fs), Tajima's D neutrality test (D), statistics of Ramos-Onsins and Rozas (R 2), sum of squared deviations (SSD), raggedness index (r), the time since possible population expansion (t). The time since possible population expansion (t) was expressed in 10−3 years before present (kyr BP) (*P < 0.05, **P < 0.01, not significant ns). LEV, Levantine Sea; AEG, Aegean Sea; BLAMAR, Black Sea & Sea of Marmara.

Gene flow Nem estimates and pairwise genetic distances between the clades of P. marmoratus were given in Table 5. The gene flow between the LEV and the other clades (BLAMAR and AEG) were found to be remarkably low, which is congruent with ϕ-statistics and indicated small number of migrants per generation (Nem < 0.03). Pairwise genetic distances indicated that the LEV clade was also significantly differentiated, which also supported the limited gene flow between LEV and other clades (Table 5).
Gene flow Nem among Pomatoschistus clades (above diagonal) with pairwise genetic distances (K2P for COI, Tamura–Nei for cyt b) from haplotype frequencies (below diagonal)

LEV, Levantine Sea; AEG, Aegean Sea; BLAMAR, Black Sea & Sea of Marmara.
Discussion
The understanding of population structure and the factors which affect it in the marine environment is important for conservation strategies for habitats, species and other conservation measures (Kelly & Palumbi, Reference Kelly and Palumbi2010). Different mechanisms may cause genetic differentiation between populations, such as vicariance processes caused by palaeo-climatic and geological events, oceanographic currents, habitat discontinuities, local adaptation, larval behaviour, dispersal capabilities of larvae and adults and even reproductive strategy (Marques et al., Reference Marques, Rego, Lino Costa, Costa and Cabral2006; Giovannotti et al., Reference Giovannotti, La Mesa and Caputo2009; Earl et al., Reference Earl, Louie, Bardeleben, Swift and Jacobs2010; Riginos et al., Reference Riginos, Douglas, Shanahan, Jin and Treml2011; Schunter et al., Reference Schunter, Carreras-Carbonell, MacPherson, Tintoré, Vidal-Vijande, Pascual, Guidetti and Pascual2011; Gonzalez-Wangüemert & Perez-Ruzafa, Reference Gonzalez-Wangüemert and Perez-Ruzafa2012; Hirase et al., Reference Hirase, Kanno, Ikeda and Kijima2012; Durand et al., Reference Durand, Guinand, Dodson and Lecomte2013; Portnoy et al., Reference Portnoy, Hollenbeck, Renshaw, Cummings and Gold2013).
The modern Mediterranean Sea and the Indo-West Pacific Region evolved independently from each other when the Arabian and Anatolian plates collided (Rögl, Reference Rögl1999; Seidenkrantz et al., Reference Seidenkrantz, Kouwenhoven, Jorissen, Shackleton and Van Der Zwaan2000). The Mediterranean–Atlantic connection became constricted at the end of the Miocene after the isolation of Paratethys from the Mediterranean. A consequence of this was the desiccation of the Mediterranean, in an event known as the Messinian Salinity Crisis (MSC), which took place about 6.14–5.96 myr (Hsü et al., Reference Hsü, Ryan and Cita1973; Krijgsman et al., Reference Krijgsman, Hilgen, Raffi, Sierro and Wilson1999). The present distribution of P. marmoratus in the Eastern Mediterranean is thought to be the result of the isolation of Paratethys from the Mediterranean and MSC (Miller, Reference Miller1990; Huyse et al., Reference Huyse, Houdt and Volckaer2004).
Estimated differentiation times (19.3–9.65 myr BP) of the LEV and AEGBLAMAR populations based on the cyt b gene coincide with the period in which Paratethys was first isolated from the Mediterranean Sea and, according to the results of COI analyses which are thought to evolve faster and accumulate mutations, the estimated differentiation time of both AEG-LEV and LEV-BLAMAR populations (6.95–3.48 and 5.85–2.98 myr BP, respectively) coincide with the opening of the Gibraltar Strait after MSC.
The impact of the salinity crisis and cyclic glacial ages with significant decreases in sea levels, which affected the origin of biodiversity in the Mediterranean Sea basin, have a significant impact on the populations of the gobies (Stefanni & Thorley, Reference Stefanni and Thorley2003; Gysels et al., Reference Gysels, Hellemans, Patarnello and Volckaert2004a, Reference Gysels, Hellemans, Pampoulie and Volckaert2004b; Huyse et al., Reference Huyse, Houdt and Volckaer2004; Larmuseau et al., Reference Larmuseau, Van Houdt, Guelinckx, Hellemenas and Volckaert2009; Mejri et al., Reference Mejri, Lo Brutto, Ben Hassine and Arculeo2009, Reference Mejri, Arculeo, Ben Hassine and Lo Brutto2011; Boissin et al., Reference Boissin, Hoareau and Berrebi2011). The sudden demographic expansion of populations with low genetic diversity and re-colonization of sand gobies have been described in many studies as the impact of the last glacial period which ended about 10 kyr BP (Hewitt, Reference Hewitt1996, Reference Hewitt1999, Reference Hewitt2000; Taberlet et al., Reference Taberlet, Fumagalli, Wust-Saucy and Cosson1998; Stefanni & Thorley, Reference Stefanni and Thorley2003; Gysels et al., Reference Gysels, Hellemans, Patarnello and Volckaert2004a, Reference Gysels, Hellemans, Pampoulie and Volckaert2004b; Huyse et al., Reference Huyse, Houdt and Volckaer2004). The sea level of Anatolian coasts had substantial changes during the last glacial period as did the whole Mediterranean basin (Lambeck, Reference Lambeck1995; Özdoğan, Reference Özdoğan1997; Lambeck & Purcell, Reference Lambeck and Purcell2005; Gökaşan et al., Reference Gökaşan, Tur, Ergin, Görüm, Batuk, Sağcı, Ustaömer, Emem and Alp2010). It is known that the sea level was at least 100–165 m lower in general during the last glacial maximum (van Andel & Shackleton, Reference van Andel and Shackleton1982; Lambeck & Purcell, Reference Lambeck and Purcell2005) and the borders of the territorial areas extending into the Aegean Sea were wider because of the sea level drops (Lambeck, Reference Lambeck1995; Özdoğan, Reference Özdoğan1997; Lambeck & Purcell, Reference Lambeck and Purcell2005). The lacustrine conditions occurred intermittently both in the Sea of Marmara and the Black Sea, but analysis of the deep sea cores indicates that the Sea of Marmara had similar conditions to that of the present Black Sea during the last glacial period (Meriç, Reference Meriç1990; Özdoğan, Reference Özdoğan1997). The level of the Sea of Marmara was ~45–50 m above the level of the Aegean Sea both during the last glacial period and also possibly the previous glacial period (Aksu et al., Reference Aksu, Hiscott and Yaşar1999). The Turkish Straits System (Dardanelles and Bosphorus) acted as rivers carrying meltwater from northern Europe into the Black Sea, and then through the Marmara Sea to the Aegean Sea and the eastern Mediterranean Sea during the glacial to interglacial transitions (Stanley & Blanpied, Reference Stanley and Blanpied1980; Aksu et al., Reference Aksu, Hiscott and Yaşar1999). These interactions between the Black Sea, Sea of Marmara and the Aegean Sea could prevent populations becoming completely isolated but also could restrict an effective gene flow. Due to this, the estimated differentiation time of BLAMAR and AEG groups (1.35–0.68 myr BP) can be linked with sea level changes in the last glacial period. Our results also underlined that demographic analyses as well as high haplotype diversity indicate a recent and rapid population divergence during the last glacial period due to τ values of the LEV and AEG groups (0.194–0.097 myr and 0.236–0.118 myr, respectively).
The potential distribution of planktonic larvae and eggs and the lack of geographic barriers among populations contribute to continuous gene flow and low genetic differentiation in marine ecosystems (McCusker & Bentzen, Reference McCusker and Bentzen2010; Wang et al., Reference Wang, Meng, Liu, Zhang and Lin2011). The continuous gene flow between populations was detected in various studies that were conducted in the sub-basins of the Eastern Mediterranean, although there were biotic and abiotic factors that resulted in the populations' differentiations (Bektaş & Beldüz, Reference Bektaş and Beldüz2008; Keskin & Atar, Reference Keskin and Atar2012; Turan et al., Reference Turan, Ivanova and Soldo2016; Bektaş et al., Reference Bektaş, Aksu, Kalaycı, Irmak, Engin and Turan2018). However, many studies have shown that intra-specific differences in many Mediterranean species are associated with the present-day physical barriers that may affect gene flow (Borsa et al., Reference Borsa, Naciri, Bahri-Sfar, Chikhi, Garcia De Leon, Kotoulas and Bonhomme1997; Mejri et al., Reference Mejri, Lo Brutto, Ben Hassine and Arculeo2009, Reference Mejri, Arculeo, Ben Hassine and Lo Brutto2011). Analyses of both gene regions indicated that the population groups had high haplotype diversity, while the nucleotide diversity was quite low in the present study. Moreover, the Levantine population is genetically different from all other populations and gene flow was determined to be very limited. When the results of the analyses of the neutrality and mismatch distribution that were applied to the haplogroups are evaluated as a whole, it was found that the haplogroup covering the Black Sea and Sea of Marmara was in equilibrium. However, the haplogroup covering the Levantine Sea coasts was under the sudden demographic expansion model following a population bottleneck, which was in agreement with a star-shaped haplotype network.
It was concluded that the limited gene exchange between the Levantine population and other populations is still affected by the prevailing hydrographic conditions. Bakun & Agostini (Reference Bakun and Agostini2001) reported that the eastern Aegean and north-western Levantine shores (approximately the Teke peninsula) are influenced by strong winds blowing from the land to the sea, and consequently the coastal surface water movements are directed towards the open sea by the Ekman transport and the Coriolis force. Researchers have stated that this transport is further strengthened in spring and summer (this corresponds to the spawning season and larval stage of P. marmoratus; Mazzoldi & Rasotto, Reference Mazzoldi and Rasotto2001) and consequently strong upwelling areas are formed in the Aegean and north-western Levantine coasts. This situation has also been observed by authors during fieldwork. For these reasons, it is concluded that the limited gene flow between the Levantine population and other populations is affected by the transport from the coast to the open sea on the eastern Aegean Sea and the northern Levantine Sea.
The entire life cycle, including the reproduction of P. marmoratus, takes place in shallow coastal habitats (generally 0–3 m) (Miller, Reference Miller, Whitehead, Bauchot, Hureau, Nielson and Tortonese1986) and this transport is thought to limit the gene flow by preventing the chance of survival in deep-water habitats during the transition phase of the larva to benthic form. Drost et al. (Reference Drost, Golla, von der Heyden and Teske2015) observed a similar situation in the gobies distributed in the South African coast. The researchers stated that the prevailing winds on the coasts of South Africa are directed offshore, and the larvae move away from the coastal waters due to wind-driven upwelling and Ekman transport. This situation limits the gene flow by decreasing the rate of recruitment success. Besides this, the offshore wind-driven surface flows and Ekman transport will keep planktonic larvae away from the protected coastal waters, and reduce the possibility of reaching suitable habitat for settlement (Lutjeharms, Reference Lutjeharms2006).
Coastal surface currents of the northern Levantine Sea are moving westward and change direction in front of Fethiye and Rhodes Island. The main currents in the Aegean Sea are generally south-oriented and have been reported to be directed towards the Ionian Sea before reaching the Levantine Sea (Fernández et al., Reference Fernández, Dietrich, Haney and Tintoré2005; Hamad et al., Reference Hamad, Millot and Taupier-Letage2006; Patarnello et al., Reference Patarnello, Volckaert and Castilho2007). Taking these into consideration, there are no main coastal surface currents extending from the Levantine Sea towards the Aegean Sea, and this phenomenon creates an effective hydrographic barrier that limits gene flow. In addition, it was observed in our field studies that the Datça peninsula, which is located near the intersection of the southern Aegean and western Levantine coasts, limits gene flow, while deep rocky habitats frequently found along the coastline of the peninsula interrupt the habitat connectivity of P. marmoratus. Similar habitat fragmentations such as steep cliff structures and the lack of shallow sandy areas were observed between Fethiye-Antalya and Alanya-Tasucu. However, although suitable habitats have been observed from the Tasucu coasts to Iskenderun Bay, it has been observed that the populations of P. marmoratus are either undetectable or are not abundant in these habitats. It was concluded that this might be due to the intense pressure of lessepsian fishes. It is seen that all these factors limit gene flow between the Aegean Sea and Levantine Sea populations and thus negatively affect populations by decreasing the intra and inter-population genetic diversity.
It was understood that conservation of biological diversity alone is not sufficient, but the levels of genetic variation of species and populations, as well as the variation processes of the populations, must also be known. Based on the results presented in this paper, it was concluded that hydrographic factors directly affect gene flow at larval stages and habitat fragmentations limit the gene flow of the poor-swimmer goby species in the adult period. Besides this, the ongoing genetic differentiation process in the Levantine populations caused by palaeo-geographic and palaeo-climatic conditions is still affected by today's hydrographic factors. Moreover, environmental pressures such as lessepsian invasion in the area, pollution and increasing seawater temperature make these populations fragile by decreasing the abundance of the populations.
Supplementary material
The supplementary material for this article can be found at https://doi.org/10.1017/S0025315421000199
Acknowledgements
This study is a part of the PhD thesis of D. Seyhan Öztürk. We thank the English tutor ‘Teacher Darryl’ from Cambly platform for the English revision.
Author contributions
D.S.Ö. and S.E. contributed to the design of this research and collected the samples. D.S.Ö. performed the laboratory work, conducted data analysis and wrote the manuscript.
Financial support
This study was funded by Izmir Katip Çelebi University Scientific Research Project Coordination Unit (D.S.Ö., grant number 2017-TDR-FEBE-0038) and TUBİTAK (S.E., grant number 112T924).
Data availability
The gene sequences are available in GenBank and can be found under the accession numbers MT181761–MT181840 and MT181989–MT182021. The data that support the findings of this study are available from the corresponding author upon reasonable request.


 Open access