


1. Introduction
The flow around permeable bluff bodies is commonly encountered in both natural and engineering systems. A notable natural example is the plumed diaspore of the dandelion seed, exhibiting long-distance dispersal capabilities enabled by its permeable disk-like pappus (Cummins et al. Reference Cummins, Seale, Macente, Certini, Mastropaolo, Viola and Nakayama2018). This diaspore has inspired the design of microflyers that are passively transported by the wind for applications such as environmental monitoring (Iyer et al. Reference Iyer, Gaensbauer, Daniel and Gollakota2022; Chen et al. Reference Chen, Valenzuela, Zhang, Yang, Wang and Feng2023; Yang et al. Reference Yang, Zhang, Berdin, Hu and Zeng2023). These filamentous flyers are commonly modelled as permeable disks, and understanding their wake dynamics is critical to inform their design.
The flow around and through permeable disks has been extensively investigated in the literature. There exists a permeability limit above which the bleed flow through results in a sheared flow without recirculation (Cummins et al. Reference Cummins, Viola, Mastropaolo and Nakayama2017; Steiros & Hultmark Reference Steiros and Hultmark2018; Steiros et al. Reference Steiros, Kokmanian, Bempedelis and Hultmark2020). This limiting permeability depends on the Reynolds number $\textit{Re}$
. Below this limit and at
$\textit{Re}$
. Below this limit and at $10 \lt \textit{Re} \lt 130$
, the wake is characterised by a steady, axisymmetric, toroidal vortex, known as the separated vortex ring (SVR) (Cummins et al. Reference Cummins, Viola, Mastropaolo and Nakayama2017; Ledda et al. Reference Ledda, Siconolfi, Viola, Camarri and Gallaire2019; Tang et al. Reference Tang, Xie, Yu, Li and Yu2021). At
$10 \lt \textit{Re} \lt 130$
, the wake is characterised by a steady, axisymmetric, toroidal vortex, known as the separated vortex ring (SVR) (Cummins et al. Reference Cummins, Viola, Mastropaolo and Nakayama2017; Ledda et al. Reference Ledda, Siconolfi, Viola, Camarri and Gallaire2019; Tang et al. Reference Tang, Xie, Yu, Li and Yu2021). At $\textit{Re}=O(10^3)$
and
$\textit{Re}=O(10^3)$
and $O(10^4)$
, a steady asymmetric SVR (Cummins et al. Reference Cummins, Seale, Macente, Certini, Mastropaolo, Viola and Nakayama2018) and an unsteady wake with vortex shedding (Liu et al. Reference Liu, Xie, Yao and Yang2017) occur, respectively. Previous research has primarily focused on two regimes: the low-
$O(10^4)$
, a steady asymmetric SVR (Cummins et al. Reference Cummins, Seale, Macente, Certini, Mastropaolo, Viola and Nakayama2018) and an unsteady wake with vortex shedding (Liu et al. Reference Liu, Xie, Yao and Yang2017) occur, respectively. Previous research has primarily focused on two regimes: the low- $\textit{Re}$
regime, where the wake remains steady, and the high-
$\textit{Re}$
regime, where the wake remains steady, and the high- $\textit{Re}$
regime, where unsteady and chaotic wake dynamics dominates. But the intermediate-
$\textit{Re}$
regime, where unsteady and chaotic wake dynamics dominates. But the intermediate- $\textit{Re}$
regime, where the wake undergoes a complex transition from steady to chaotic states, remains largely unexplored.
$\textit{Re}$
regime, where the wake undergoes a complex transition from steady to chaotic states, remains largely unexplored.
In contrast, the transition from steady to chaotic states in the wake of a solid disk has been well documented in the literature. The transition is controlled by two parameters: $\textit{Re}$
and the diameter-to-thickness aspect ratio
$\textit{Re}$
and the diameter-to-thickness aspect ratio $\chi$
. The transition is reported to be a five-step bifurcation for a thin disk (Gao et al. Reference Gao, Tao, Tian and Yang2018). In low-
$\chi$
. The transition is reported to be a five-step bifurcation for a thin disk (Gao et al. Reference Gao, Tao, Tian and Yang2018). In low- $\textit{Re}$
regimes with
$\textit{Re}$
regimes with $\chi =10$
, the wake is steady and axisymmetric, with the formation of a toroidal vortex (Shenoy & Kleinstreuer Reference Shenoy and Kleinstreuer2008). The first bifurcation occurs at
$\chi =10$
, the wake is steady and axisymmetric, with the formation of a toroidal vortex (Shenoy & Kleinstreuer Reference Shenoy and Kleinstreuer2008). The first bifurcation occurs at $\textit{Re}_{c_1}$
approximately 129.6 (Chrust, Bouchet & Dušek Reference Chrust, Bouchet and Dušek2010) and 135 (Shenoy & Kleinstreuer Reference Shenoy and Kleinstreuer2008), featured by the emergence of double-threaded axial vorticity and reflectional symmetry. A steady non-zero lift force arises in the symmetry plane, with its orientation determined by the initial conditions. This state is referred to as the steady state (Fabre, Auguste & Magnaudet Reference Fabre, Auguste and Magnaudet2008) or the ‘steady asymmetric state’ (Shenoy & Kleinstreuer Reference Shenoy and Kleinstreuer2008). The second bifurcation is Hopf-type, leading to a ‘three-dimensional flow with regular rotation’ (Shenoy & Kleinstreuer Reference Shenoy and Kleinstreuer2008) with the loss of reflectional symmetry. This regime is also known as ‘reflectional symmetry breaking’ (RSB) (Fabre et al. Reference Fabre, Auguste and Magnaudet2008), mixed mode with phase
$\textit{Re}_{c_1}$
approximately 129.6 (Chrust, Bouchet & Dušek Reference Chrust, Bouchet and Dušek2010) and 135 (Shenoy & Kleinstreuer Reference Shenoy and Kleinstreuer2008), featured by the emergence of double-threaded axial vorticity and reflectional symmetry. A steady non-zero lift force arises in the symmetry plane, with its orientation determined by the initial conditions. This state is referred to as the steady state (Fabre, Auguste & Magnaudet Reference Fabre, Auguste and Magnaudet2008) or the ‘steady asymmetric state’ (Shenoy & Kleinstreuer Reference Shenoy and Kleinstreuer2008). The second bifurcation is Hopf-type, leading to a ‘three-dimensional flow with regular rotation’ (Shenoy & Kleinstreuer Reference Shenoy and Kleinstreuer2008) with the loss of reflectional symmetry. This regime is also known as ‘reflectional symmetry breaking’ (RSB) (Fabre et al. Reference Fabre, Auguste and Magnaudet2008), mixed mode with phase $\pi$
(
$\pi$
( ${\text{MM}}_\pi$
) (Meliga, Chomaz & Sipp Reference Meliga, Chomaz and Sipp2009) and ‘yin–yang’ (Auguste, Fabre & Magnaudet Reference Auguste, Fabre and Magnaudet2010). The critical
${\text{MM}}_\pi$
) (Meliga, Chomaz & Sipp Reference Meliga, Chomaz and Sipp2009) and ‘yin–yang’ (Auguste, Fabre & Magnaudet Reference Auguste, Fabre and Magnaudet2010). The critical $\textit{Re}$
for Hopf bifurcation
$\textit{Re}$
for Hopf bifurcation $\textit{Re}_{c_2}$
is given as
$\textit{Re}_{c_2}$
is given as $\textit{Re}_{c_2}=125.6(1+\chi ^{-1})$
(Fernandes et al. Reference Fernandes, Risso, Ern and Magnaudet2007). As
$\textit{Re}_{c_2}=125.6(1+\chi ^{-1})$
(Fernandes et al. Reference Fernandes, Risso, Ern and Magnaudet2007). As $\textit{Re}$
increases further, the lift oscillation amplitude and its non-zero mean recesses gradually until reflectional symmetry is recovered. This regime, known as ‘standing wave’ (SW), is characterised by the unsteady flow with planar symmetry and zero lift force, also referred to as ‘zig–zag’ (Auguste et al. Reference Auguste, Fabre and Magnaudet2010). The threshold (
$\textit{Re}$
increases further, the lift oscillation amplitude and its non-zero mean recesses gradually until reflectional symmetry is recovered. This regime, known as ‘standing wave’ (SW), is characterised by the unsteady flow with planar symmetry and zero lift force, also referred to as ‘zig–zag’ (Auguste et al. Reference Auguste, Fabre and Magnaudet2010). The threshold ( $\textit{Re}_{c_3}$
) for the onset of the SW regime is reported between 154.4 (Chrust et al. Reference Chrust, Bouchet and Dušek2010) and 172 (Shenoy & Kleinstreuer Reference Shenoy and Kleinstreuer2008). Before the flow becomes fully chaotic, a quasi-periodic state with the recovery of symmetry and presence of a second frequency near one-third of the leading frequency of the previous state is reported. The boundary of the fourth bifurcation (
$\textit{Re}_{c_3}$
) for the onset of the SW regime is reported between 154.4 (Chrust et al. Reference Chrust, Bouchet and Dušek2010) and 172 (Shenoy & Kleinstreuer Reference Shenoy and Kleinstreuer2008). Before the flow becomes fully chaotic, a quasi-periodic state with the recovery of symmetry and presence of a second frequency near one-third of the leading frequency of the previous state is reported. The boundary of the fourth bifurcation ( $\textit{Re}_{c_4}$
), marking the loss of periodicity, is approximately 188.8 (Chrust et al. Reference Chrust, Bouchet and Dušek2010) and 280 (Shenoy & Kleinstreuer Reference Shenoy and Kleinstreuer2008). The transition between quasi-periodic and chaotic state occurs at
$\textit{Re}_{c_4}$
), marking the loss of periodicity, is approximately 188.8 (Chrust et al. Reference Chrust, Bouchet and Dušek2010) and 280 (Shenoy & Kleinstreuer Reference Shenoy and Kleinstreuer2008). The transition between quasi-periodic and chaotic state occurs at $\textit{Re}_{c_5}$
with the loss of both its periodicity and reflectional symmetry. Additional wake dynamics can be introduced by increasing the disk thickness. For a thicker disk with
$\textit{Re}_{c_5}$
with the loss of both its periodicity and reflectional symmetry. Additional wake dynamics can be introduced by increasing the disk thickness. For a thicker disk with $\chi =3$
, in addition to the flow state described above, two further bifurcations are reported: the ‘reflectional symmetry preserving’ or ‘zig-zig’ mode, characterised by reflectional symmetry and non-zero lift, and the ‘knit-knot’ mode with non-zero helicity (Auguste et al. Reference Auguste, Fabre and Magnaudet2010).
$\chi =3$
, in addition to the flow state described above, two further bifurcations are reported: the ‘reflectional symmetry preserving’ or ‘zig-zig’ mode, characterised by reflectional symmetry and non-zero lift, and the ‘knit-knot’ mode with non-zero helicity (Auguste et al. Reference Auguste, Fabre and Magnaudet2010).
For permeable disks, most studies regarding the wake stability have focused on the influence of porosity on the steady–unsteady transition, i.e. the onset of Hopf bifurcation. It has been shown that when porosity is sufficiently high to allow significant bleed flow, the formation of von Kármán vortex streets behind both two-dimensional perforated plates (Castro Reference Castro1971) and permeable rectangular cylinders (Ledda et al. Reference Ledda, Siconolfi, Viola, Gallaire and Camarri2018), arrays of cylinders (Nicolle & Eames Reference Nicolle and Eames2011; Zong & Nepf Reference Zong and Nepf2012) and three-dimensional permeable disks (Vagnoli et al. Reference Vagnoli, Zampogna, Camarri, Gallaire and Ledda2023) can be inhibited. The critical $\textit{Re}$
for the onset of Hopf bifurcation as a function of porosity has also been reported for porous disks (Cummins et al. Reference Cummins, Seale, Macente, Certini, Mastropaolo, Viola and Nakayama2018; Ledda et al. Reference Ledda, Siconolfi, Viola, Camarri and Gallaire2019).
$\textit{Re}$
for the onset of Hopf bifurcation as a function of porosity has also been reported for porous disks (Cummins et al. Reference Cummins, Seale, Macente, Certini, Mastropaolo, Viola and Nakayama2018; Ledda et al. Reference Ledda, Siconolfi, Viola, Camarri and Gallaire2019).
Permeable disks can be characterised by porosity, which is a geometrical feature of the disk, as well as by the Darcy number $Da$
, which is the non-dimensional permeability. Linear stability analysis shows that the critical Reynolds numbers of both oscillatory and non-oscillatory modes remain nearly constant over a wide range of
$Da$
, which is the non-dimensional permeability. Linear stability analysis shows that the critical Reynolds numbers of both oscillatory and non-oscillatory modes remain nearly constant over a wide range of $Da$
, then increase abruptly as
$Da$
, then increase abruptly as $Da$
approaches a critical value, beyond which the wake becomes steady (Vagnoli et al. Reference Vagnoli, Zampogna, Camarri, Gallaire and Ledda2023). Similar trends have also been reported for permeable rectangular cylinders (Ledda et al. Reference Ledda, Siconolfi, Viola, Gallaire and Camarri2018) and permeable spheres (Ciuti et al. Reference Ciuti, Zampogna, Gallaire, Camarri and Ledda2021). However, the critical
$Da$
approaches a critical value, beyond which the wake becomes steady (Vagnoli et al. Reference Vagnoli, Zampogna, Camarri, Gallaire and Ledda2023). Similar trends have also been reported for permeable rectangular cylinders (Ledda et al. Reference Ledda, Siconolfi, Viola, Gallaire and Camarri2018) and permeable spheres (Ciuti et al. Reference Ciuti, Zampogna, Gallaire, Camarri and Ledda2021). However, the critical $\textit{Re}{-}Da$
curve depends on the plate thickness (Zampogna & Gallaire Reference Zampogna and Gallaire2020; Ledda et al. Reference Ledda, Boujo, Camarri, Gallaire and Zampogna2021). In fact, the pressure drop across the permeable body scales linearly with the thickness. Accordingly, the curves of the critical
$\textit{Re}{-}Da$
curve depends on the plate thickness (Zampogna & Gallaire Reference Zampogna and Gallaire2020; Ledda et al. Reference Ledda, Boujo, Camarri, Gallaire and Zampogna2021). In fact, the pressure drop across the permeable body scales linearly with the thickness. Accordingly, the curves of the critical $\textit{Re}$
versus
$\textit{Re}$
versus $Da$
for the steady–unsteady transition boundaries of disks with different
$Da$
for the steady–unsteady transition boundaries of disks with different $\chi$
collapse when rescaled using an effective Darcy number
$\chi$
collapse when rescaled using an effective Darcy number $Da_{\textit{eff}}\equiv \chi\, Da$
. Comparable behaviour is observed for the critical
$Da_{\textit{eff}}\equiv \chi\, Da$
. Comparable behaviour is observed for the critical $\textit{Re}$
of the onset/suppression of a steady SVR for permeable disks with different
$\textit{Re}$
of the onset/suppression of a steady SVR for permeable disks with different $\chi$
(Tang et al. Reference Tang, Xie, Yu, Li and Yu2021). Overall, linear stability analysis identifies the symmetry breaking and the steady–unsteady boundary (Vagnoli et al. Reference Vagnoli, Zampogna, Camarri, Gallaire and Ledda2023), and numerical studies have described the onset and suppression of the steady SVR, including their boundaries (Cummins et al. Reference Cummins, Viola, Mastropaolo and Nakayama2017; Tang et al. Reference Tang, Xie, Yu, Li and Yu2021). However, the complete sequence of flow regimes and the associated transition pathways from steady to chaotic states remain unidentified.
$\chi$
(Tang et al. Reference Tang, Xie, Yu, Li and Yu2021). Overall, linear stability analysis identifies the symmetry breaking and the steady–unsteady boundary (Vagnoli et al. Reference Vagnoli, Zampogna, Camarri, Gallaire and Ledda2023), and numerical studies have described the onset and suppression of the steady SVR, including their boundaries (Cummins et al. Reference Cummins, Viola, Mastropaolo and Nakayama2017; Tang et al. Reference Tang, Xie, Yu, Li and Yu2021). However, the complete sequence of flow regimes and the associated transition pathways from steady to chaotic states remain unidentified.
Permeable disks with values of $\textit{Re}$
and
$\textit{Re}$
and $Da$
comparable to those where the wake turns from stable to chaotic are often good models of freely falling objects. For example, the filamentous pappus of the dandelion diaspore can be modelled as a permeable disk (Cummins et al. Reference Cummins, Seale, Macente, Certini, Mastropaolo, Viola and Nakayama2018). For freely falling bodies, the coupled interaction between wake dynamics and body motion can lead to bifurcation scenarios that differ from those of fixed configurations. Recent work has shown that permeability progressively filters out wake-dominated modes, and for sufficiently large permeability can alter the primary linear instability of the vertical path towards a non-oscillatory mode (Vagnoli et al. Reference Vagnoli, Zampogna, Camarri, Gallaire and Ledda2023). Nonetheless, characterising how permeability influences the transition from steady to unsteady flow regimes in a fixed-body configuration provides reference trends that may help to interpret permeability-induced changes in path instabilities and motion regimes observed for free-falling disks.
$Da$
comparable to those where the wake turns from stable to chaotic are often good models of freely falling objects. For example, the filamentous pappus of the dandelion diaspore can be modelled as a permeable disk (Cummins et al. Reference Cummins, Seale, Macente, Certini, Mastropaolo, Viola and Nakayama2018). For freely falling bodies, the coupled interaction between wake dynamics and body motion can lead to bifurcation scenarios that differ from those of fixed configurations. Recent work has shown that permeability progressively filters out wake-dominated modes, and for sufficiently large permeability can alter the primary linear instability of the vertical path towards a non-oscillatory mode (Vagnoli et al. Reference Vagnoli, Zampogna, Camarri, Gallaire and Ledda2023). Nonetheless, characterising how permeability influences the transition from steady to unsteady flow regimes in a fixed-body configuration provides reference trends that may help to interpret permeability-induced changes in path instabilities and motion regimes observed for free-falling disks.
In this study, extensive numerical simulations are performed to investigate the steady and unsteady wake behind permeable disks, aiming to answer the following three research questions. (1) What is the bifurcation sequence from steady to chaotic regimes for disks with different permeability? (2) What are the $\textit{Re}{-}Da$
boundaries for different bifurcations? (3) Does permeability give rise to previously undiscovered flow regimes, and if so, which characteristics do they have?
$\textit{Re}{-}Da$
boundaries for different bifurcations? (3) Does permeability give rise to previously undiscovered flow regimes, and if so, which characteristics do they have?
The rest of the paper is organised as follows. The numerical method is discussed in § 2, including the descriptions of the modelling method (§ 2.1), the numerical set-up (§ 2.2), and the validation of the model (§ 2.3). An overview of the wake structure of permeable disks is given in § 3, including the delayed transition route (§ 3.1), the characterisation of two newly discovered regimes (§§ 3.2 and 3.3), and the sensitivity to non-zero inertial resistance and thickness (§§ 3.4 and 3.5). Finally, the conclusions of the present study, together with its limitations and directions for future research, are summarised in § 4.
2. Methodology
We conduct numerical simulations on a stationary three-dimensional permeable disk with $\chi =10$
in a uniform flow stream with
$\chi =10$
in a uniform flow stream with $\textit{Re}$
ranging from 100 to 300, and non-dimensional permeability
$\textit{Re}$
ranging from 100 to 300, and non-dimensional permeability $Da$
ranging from
$Da$
ranging from $10^{-9}$
to
$10^{-9}$
to $10^{-3}$
. Here,
$10^{-3}$
. Here, $\textit{Re}\equiv {\hat u_{\infty }}\hat {d}/\hat {\nu }$
and
$\textit{Re}\equiv {\hat u_{\infty }}\hat {d}/\hat {\nu }$
and $Da\equiv \hat {K}/{\hat {d}}^2$
, where
$Da\equiv \hat {K}/{\hat {d}}^2$
, where $\hat u_{\infty }$
is the free-stream speed,
$\hat u_{\infty }$
is the free-stream speed, $\hat d$
is the disk diameter,
$\hat d$
is the disk diameter, $\hat {\nu }$
is the fluid kinematic viscosity, and
$\hat {\nu }$
is the fluid kinematic viscosity, and $\hat {K}$
is the permeability. The hat symbol denotes dimensional quantities. In the following sections, all quantities are non-dimensionalised using the fluid density
$\hat {K}$
is the permeability. The hat symbol denotes dimensional quantities. In the following sections, all quantities are non-dimensionalised using the fluid density $\hat \rho _f$
,
$\hat \rho _f$
, $\hat {u}_{\infty }$
and
$\hat {u}_{\infty }$
and $\hat {d}$
as the reference scales.
$\hat {d}$
as the reference scales.
2.1. Governing equations
We assume that the porous medium is homogeneous, rigid and fully saturated with the same single-phase fluid. Under this assumption, the continuity and the Darcy–Brinkman–Forchheimer equations (Darcy Reference Darcy1856; Brinkman Reference Brinkman1949; Joseph, Nield & Papanicolaou Reference Joseph, Nield and Papanicolaou1982), which are derived from the volume averaging theory (Vafai & Tien Reference Vafai and Tien1981; Whitaker Reference Whitaker1986, Reference Whitaker1996; Nithiarasu, Seetharamu & Sundararajan Reference Nithiarasu, Seetharamu and Sundararajan1997), are solved within the whole computational domain, including inside and around the disk. Their non-dimensional form is
 \begin{align} \boldsymbol{\nabla }\boldsymbol{\cdot }{\boldsymbol{u}} = 0, \end{align}
 \begin{align} \frac {1}{\epsilon }\frac {\partial {\boldsymbol{u}}}{\partial t}+\frac {1}{\epsilon ^{2}}\left ( {\boldsymbol{u}}\boldsymbol{\cdot }\boldsymbol{\nabla }\right ){\boldsymbol{u}} = -{\boldsymbol{\nabla }p} +\frac {1}{\epsilon\, \textit{Re}} {{\nabla} }^2{\boldsymbol{u}} -\frac {1}{Re\, Da}{\boldsymbol{u}}-\frac {C_F}{\sqrt {Da}}|u|\,u, \end{align}
where $\boldsymbol{u}$
is the velocity vector,
$\boldsymbol{u}$
is the velocity vector, $t$
is time,
$t$
is time, $p$
is the pressure,
$p$
is the pressure, $\epsilon$
is the porosity of the permeable disk, and
$\epsilon$
is the porosity of the permeable disk, and $C_{\!F}$
is a form drag coefficient. Specifically, in the permeable disk,
$C_{\!F}$
is a form drag coefficient. Specifically, in the permeable disk, $\epsilon$
is set to 0.95, and
$\epsilon$
is set to 0.95, and $Da$
is set to a value from
$Da$
is set to a value from $10^{-9}$
to
$10^{-9}$
to $10^{-3}$
for the different cases considered in this study. Conversely, in the clear fluid outside of the disk,
$10^{-3}$
for the different cases considered in this study. Conversely, in the clear fluid outside of the disk, $\epsilon$
is set to 1, and
$\epsilon$
is set to 1, and $Da$
is set to high value
$Da$
is set to high value $10^{12}$
, such that the Darcy term is negligible, and the Darcy–Brinkman equation simplifies into the incompressible Navier–Stokes equation for Newtonian fluids. In most simulations,
$10^{12}$
, such that the Darcy term is negligible, and the Darcy–Brinkman equation simplifies into the incompressible Navier–Stokes equation for Newtonian fluids. In most simulations, $C_{\!F}$
is set to 0 because the
$C_{\!F}$
is set to 0 because the $\textit{Re}$
values here considered are relatively low and the permeability is homogeneous. Therefore, it is reasonable to assume that the permeability will be mostly Darcy-type, with negligible inertial effects. However, the sensitivity of our findings with
$\textit{Re}$
values here considered are relatively low and the permeability is homogeneous. Therefore, it is reasonable to assume that the permeability will be mostly Darcy-type, with negligible inertial effects. However, the sensitivity of our findings with $C_{\!F}$
up to
$C_{\!F}$
up to $C_F=1$
is examined in § 3.4.
$C_F=1$
is examined in § 3.4.
2.2. Numerical set-up
The numerical simulations are performed using a self-developed porousPimpleFoam solver within the finite-volume-based open-source code OpenFOAM, which is implemented by incorporating porosity and permeability into the built-in incompressible transient pimpleFoam solver. The temporal discretisation employs a second-order Crank–Nicolson scheme with weighting factor 0.9, and second-order schemes are used also for the spatial discretisation. The PIMPLE algorithm, which combines the SIMPLE and PISO methods, is adopted with four outer and two inner corrector steps, and two non-orthogonality corrections to solve the momentum equation. The absolute error tolerance criteria for $\boldsymbol{u}$
and
$\boldsymbol{u}$
and $p$
are set to be smaller than
$p$
are set to be smaller than $10^{-8}$
and
$10^{-8}$
and $10^{-6}$
, respectively. Typical simulation run times are up to
$10^{-6}$
, respectively. Typical simulation run times are up to $t=1500$
, with fixed time step
$t=1500$
, with fixed time step $\delta _t=0.005$
and maximum Courant number approximately 0.7. Simulations are conducted using four nodes with 128 processors on ARCHER2 (UK) and EuroHPC JU’s LUMI-C (Finland).
$\delta _t=0.005$
and maximum Courant number approximately 0.7. Simulations are conducted using four nodes with 128 processors on ARCHER2 (UK) and EuroHPC JU’s LUMI-C (Finland).
( $a$
) Schematic of the computational domain (not to scale) and boundary conditions. Mesh of (
$a$
) Schematic of the computational domain (not to scale) and boundary conditions. Mesh of ( $b$
) the meridian section, (
$b$
) the meridian section, ( $c$
) the area around the disk (blue line), and (
$c$
) the area around the disk (blue line), and ( $d$
) the three-dimensional permeable disk.
$d$
) the three-dimensional permeable disk.

The schematic of the computational domain is presented in figure 1( $a$
). A permeable disk is placed within a cylindrical computational domain, extending
$a$
). A permeable disk is placed within a cylindrical computational domain, extending $L_u = 20$
upstream,
$L_u = 20$
upstream, $L_d = 60$
downstream, and
$L_d = 60$
downstream, and $40$
laterally. The boundary conditions for the numerical model are illustrated in figure 1(
$40$
laterally. The boundary conditions for the numerical model are illustrated in figure 1( $a$
). At the inlet (upstream surface), the velocity condition is
$a$
). At the inlet (upstream surface), the velocity condition is ${\boldsymbol{u}}=(1,0,0)$
, while at the outlet (downstream surface), the pressure is set to
${\boldsymbol{u}}=(1,0,0)$
, while at the outlet (downstream surface), the pressure is set to $p=0$
. Along the side edge, a slip condition is applied with
$p=0$
. Along the side edge, a slip condition is applied with ${\partial \boldsymbol{u}}/{\partial Z}=\textbf {0}$
. At the porous–fluid interface, a cyclic boundary condition is imposed to enforce periodic continuity of the flow field across the interface. The interface jump condition is not considered in this study, as its effect is known to be small within the
${\partial \boldsymbol{u}}/{\partial Z}=\textbf {0}$
. At the porous–fluid interface, a cyclic boundary condition is imposed to enforce periodic continuity of the flow field across the interface. The interface jump condition is not considered in this study, as its effect is known to be small within the $\textit{Re}$
range considered here (Chen et al. Reference Chen, Yu, Winoto and Low2008). In this work, the continuity of velocity and pressure is enforced at the interface, and the normal mass flux and transported quantities are conserved across it. The initial condition is a uniform flow on the whole domain with
$\textit{Re}$
range considered here (Chen et al. Reference Chen, Yu, Winoto and Low2008). In this work, the continuity of velocity and pressure is enforced at the interface, and the normal mass flux and transported quantities are conserved across it. The initial condition is a uniform flow on the whole domain with $\boldsymbol{u}=(1,0.01,0)$
and
$\boldsymbol{u}=(1,0.01,0)$
and $p=0$
. The open-source tool Salome is used to generate the grid (figures 1
$p=0$
. The open-source tool Salome is used to generate the grid (figures 1 $b$
–
$b$
– $d$
). The permeable disk is meshed with 68 cells radially, 300 circumferentially, and 10 in the thickness direction. The entire computational domain consists of approximately 15.6 million hexahedral elements.
$d$
). The permeable disk is meshed with 68 cells radially, 300 circumferentially, and 10 in the thickness direction. The entire computational domain consists of approximately 15.6 million hexahedral elements.
2.3. Validation
Validation is performed by comparing the critical $\textit{Re}$
and Strouhal number (
$\textit{Re}$
and Strouhal number ( $St\equiv \hat f \hat d/ \hat u_{\infty }$
, where
$St\equiv \hat f \hat d/ \hat u_{\infty }$
, where $\hat f$
is the frequency of the oscillation) of the lift coefficient at different bifurcations of effectively impermeable disks (
$\hat f$
is the frequency of the oscillation) of the lift coefficient at different bifurcations of effectively impermeable disks ( $Da=10^{-9}$
) with various
$Da=10^{-9}$
) with various $\chi$
values (table 1). Further validation is carried out by comparing the drag coefficient
$\chi$
values (table 1). Further validation is carried out by comparing the drag coefficient $C_D$
of disks over a range of
$C_D$
of disks over a range of $Da$
between
$Da$
between $10^{-9}$
and
$10^{-9}$
and $10^{-2}$
at
$10^{-2}$
at $\textit{Re}=30$
and
$\textit{Re}=30$
and $\textit{Re}=130$
, with results reported in the literature (figure 2). In addition, the
$\textit{Re}=130$
, with results reported in the literature (figure 2). In addition, the $\textit{Re}$
–
$\textit{Re}$
– $Da$
thresholds for steady–unsteady transitions obtained in the present study are compared with the stability curve reported by Vagnoli et al. (Reference Vagnoli, Zampogna, Camarri, Gallaire and Ledda2023) in § 3.5. Uncertainty quantification due to finite spatial and temporal resolution, as well as a sensitivity analysis to the finite domain size, are provided in Appendix A.
$Da$
thresholds for steady–unsteady transitions obtained in the present study are compared with the stability curve reported by Vagnoli et al. (Reference Vagnoli, Zampogna, Camarri, Gallaire and Ledda2023) in § 3.5. Uncertainty quantification due to finite spatial and temporal resolution, as well as a sensitivity analysis to the finite domain size, are provided in Appendix A.
Comparison of bifurcation $\textit{Re}$
thresholds and
$\textit{Re}$
thresholds and $St$
for impervious disks with different
$St$
for impervious disks with different $\chi$
from the literature.
$\chi$
from the literature.

Variation of drag coefficient as a function of $Da$
for
$Da$
for $\textit{Re}=30$
and 130.
$\textit{Re}=30$
and 130.

3. Results and discussion
An overview of the transition route from steady flow to the chaotic regime as $\textit{Re}$
and
$\textit{Re}$
and $Da$
increase is presented in this section. For different combinations of
$Da$
increase is presented in this section. For different combinations of $\textit{Re}$
and
$\textit{Re}$
and $Da$
, nine flow regimes are observed: steady axisymmetric, steady asymmetric, RSB (periodic), SW (periodic), quasi-periodic, chaotic, no recirculation, SVR breathing and the intermittency regimes (figure 3). The first six regimes are similar to those observed in the wake of solid disks and are discussed in § 3.1, while the latter three arise due to the permeability. Between these three regimes, one is the no recirculation regime, which appears in the wake of highly permeable disks (Cummins et al. Reference Cummins, Viola, Mastropaolo and Nakayama2017). The last two regimes due to permeability have not previously been reported in the wake of stationary impervious bluff bodies and are discussed in §§ 3.2 and 3.3. The sensitivity of the present results to non-zero inertial resistance and change in thickness is examined in §§ 3.4 and 3.5, respectively.
$Da$
, nine flow regimes are observed: steady axisymmetric, steady asymmetric, RSB (periodic), SW (periodic), quasi-periodic, chaotic, no recirculation, SVR breathing and the intermittency regimes (figure 3). The first six regimes are similar to those observed in the wake of solid disks and are discussed in § 3.1, while the latter three arise due to the permeability. Between these three regimes, one is the no recirculation regime, which appears in the wake of highly permeable disks (Cummins et al. Reference Cummins, Viola, Mastropaolo and Nakayama2017). The last two regimes due to permeability have not previously been reported in the wake of stationary impervious bluff bodies and are discussed in §§ 3.2 and 3.3. The sensitivity of the present results to non-zero inertial resistance and change in thickness is examined in §§ 3.4 and 3.5, respectively.
3.1. Delay in the transition route
In this subsection, we show that flow regimes similar to those of impervious bodies occur in the wake of permeable disks, but permeability delays each step along the transition pathway. At $Da\leq 8\times 10^{-5}$
and
$Da\leq 8\times 10^{-5}$
and $\textit{Re}\lt \textit{Re}_{c_2}$
, the wakes are steady, featuring the formation of steady axisymmetric or asymmetric SVR in the wake. Due to bleed flow, the recirculation regions are not attached to the disks’ rear surfaces. With increasing
$\textit{Re}\lt \textit{Re}_{c_2}$
, the wakes are steady, featuring the formation of steady axisymmetric or asymmetric SVR in the wake. Due to bleed flow, the recirculation regions are not attached to the disks’ rear surfaces. With increasing $\textit{Re}$
, the wake transitions through the same bifurcation sequence: steady asymmetric, RSB (periodic), SW (periodic), quasi-periodic and chaotic regimes. However, the
$\textit{Re}$
, the wake transitions through the same bifurcation sequence: steady asymmetric, RSB (periodic), SW (periodic), quasi-periodic and chaotic regimes. However, the $\textit{Re}$
boundary for each bifurcation is delayed, as the bleed flow increases with increasing
$\textit{Re}$
boundary for each bifurcation is delayed, as the bleed flow increases with increasing $Da$
, effectively reducing the nominal
$Da$
, effectively reducing the nominal $\textit{Re}$
.
$\textit{Re}$
.
Classification of the flow regimes behind a permeable disk. The red curve denotes the steady–unsteady boundary, while the grey and blue regions represent flows with and without a fixed plane of symmetry, respectively.

Isosurfaces of streamwise vorticity $\pm 0.1 u_{\infty }/d$
(red/blue) for (
$\pm 0.1 u_{\infty }/d$
(red/blue) for ( $a$
) the steady asymmetric regime, (
$a$
) the steady asymmetric regime, ( $b$
) the RSB regime and (
$b$
) the RSB regime and ( $c$
) the SW regime. Sample force diagrams and normalised PSD spectrum for (d,e,g) the RSB regime with
$c$
) the SW regime. Sample force diagrams and normalised PSD spectrum for (d,e,g) the RSB regime with $\textit{Re}=180$
and
$\textit{Re}=180$
and $Da=10^{-4}$
. (
$Da=10^{-4}$
. ( $f$
) Force diagram for the SW regime with
$f$
) Force diagram for the SW regime with $\textit{Re}=180$
and
$\textit{Re}=180$
and $Da=10^{-5}$
. (
$Da=10^{-5}$
. ( $h$
–
$h$
– $k$
) Temporal variation of
$k$
) Temporal variation of $C_y$
, force diagrams and normalised PSD spectrum for the quasi-periodic regime with
$C_y$
, force diagrams and normalised PSD spectrum for the quasi-periodic regime with $\textit{Re}=190$
and
$\textit{Re}=190$
and $Da=8\times 10^{-5}$
. (
$Da=8\times 10^{-5}$
. ( $l$
–
$l$
– $n$
) Temporal variation of
$n$
) Temporal variation of $C_{{\kern-0.5pt}x}$
, force diagram and wavelet spectrum of
$C_{{\kern-0.5pt}x}$
, force diagram and wavelet spectrum of $C_y$
for the chaotic regime with
$C_y$
for the chaotic regime with $\textit{Re}=300$
and
$\textit{Re}=300$
and $Da=10^{-5}$
, where
$Da=10^{-5}$
, where $|\psi |$
denotes the power amplitude.
$|\psi |$
denotes the power amplitude.

The steady-to-unsteady transition boundary for $Da\le 10^{-4}$
is assessed based on the decaying or amplification rate of the initial disturbance using the Stuart–Landau model (Thompson & Le Gal Reference Thompson and Le Gal2004; Rastan et al. Reference Rastan, Alam, Zhu and Ji2022). For larger
$Da\le 10^{-4}$
is assessed based on the decaying or amplification rate of the initial disturbance using the Stuart–Landau model (Thompson & Le Gal Reference Thompson and Le Gal2004; Rastan et al. Reference Rastan, Alam, Zhu and Ji2022). For larger $Da$
, where no periodic regimes are observed, the boundary is instead determined by examining the time series, along with force diagrams, frequency spectra and wavelet spectra. The flow regimes are determined by examining the temporal variation of the force coefficients in three directions
$Da$
, where no periodic regimes are observed, the boundary is instead determined by examining the time series, along with force diagrams, frequency spectra and wavelet spectra. The flow regimes are determined by examining the temporal variation of the force coefficients in three directions $(C_{{\kern-0.5pt}x}, C_y,C_z)=8(F_x, F_y,F_z)/\pi {u_{\infty }}^{2}d^2$
, the force diagram, the normalised power spectral density (PSD) and the wavelet spectrum.
$(C_{{\kern-0.5pt}x}, C_y,C_z)=8(F_x, F_y,F_z)/\pi {u_{\infty }}^{2}d^2$
, the force diagram, the normalised power spectral density (PSD) and the wavelet spectrum.
In steady regimes, force coefficients remain constant. In particular, lift coefficients ( $C_y$
and
$C_y$
and $C_z$
) are zero in a steady axisymmetric regime but non-zero in the asymmetric regime, which also exhibits double-threaded streamwise vorticity (figure 4
$C_z$
) are zero in a steady axisymmetric regime but non-zero in the asymmetric regime, which also exhibits double-threaded streamwise vorticity (figure 4 $a$
). The periodic regimes are characterised by the shedding of hairpin vortices (figures 4
$a$
). The periodic regimes are characterised by the shedding of hairpin vortices (figures 4 $b$
,
$b$
, $c$
), a closed limit cycle with a butterfly-shaped single-loop attractor in the force diagram (figure 4
$c$
), a closed limit cycle with a butterfly-shaped single-loop attractor in the force diagram (figure 4 $d$
), and a single peak in the PSD spectrum (figure 4
$d$
), and a single peak in the PSD spectrum (figure 4 $g$
). The oscillation of the lift occurs in the plane perpendicular to that selected by the initial condition. Based on the lift force characteristics, the periodic wake is further classified into RSB and SW regimes. The RSB regime is featured by the kinking of the axial vorticity (figure 4
$g$
). The oscillation of the lift occurs in the plane perpendicular to that selected by the initial condition. Based on the lift force characteristics, the periodic wake is further classified into RSB and SW regimes. The RSB regime is featured by the kinking of the axial vorticity (figure 4 $b$
) and a non-zero mean lift force (figure 4
$b$
) and a non-zero mean lift force (figure 4 $e$
). In contrast, in the SW regime, the plane of symmetry is recovered and the shedding of hairpin vortices is symmetrical, yielding zero net lift in both the
$e$
). In contrast, in the SW regime, the plane of symmetry is recovered and the shedding of hairpin vortices is symmetrical, yielding zero net lift in both the $y$
and
$y$
and $z$
directions (figure 4
$z$
directions (figure 4 $f$
). For the quasi-periodic regime (figure 4
$f$
). For the quasi-periodic regime (figure 4 $h$
), a limit torus forms (figure 4
$h$
), a limit torus forms (figure 4 $i$
), and two spectral peaks appear in the frequency domain (figure 4
$i$
), and two spectral peaks appear in the frequency domain (figure 4 $k$
). This state arises from the interaction between a low-frequency unsteady mode (Berger, Scholz & Schumm Reference Berger, Scholz and Schumm1990; Shenoy & Kleinstreuer Reference Shenoy and Kleinstreuer2008) and the vortex-shedding mode, which exhibit distinct
$k$
). This state arises from the interaction between a low-frequency unsteady mode (Berger, Scholz & Schumm Reference Berger, Scholz and Schumm1990; Shenoy & Kleinstreuer Reference Shenoy and Kleinstreuer2008) and the vortex-shedding mode, which exhibit distinct $St$
values that vary with both
$St$
values that vary with both $\textit{Re}$
and
$\textit{Re}$
and $Da$
. The planar symmetry is preserved, yielding a net zero lift force (figure 4
$Da$
. The planar symmetry is preserved, yielding a net zero lift force (figure 4 $j$
). In contrast, the flow field in the chaotic state displays no periodicity or plane of symmetry (figures 4
l,m), resulting in non-zero lift forces, and a broadband distribution in the frequency domain (figure 4
$j$
). In contrast, the flow field in the chaotic state displays no periodicity or plane of symmetry (figures 4
l,m), resulting in non-zero lift forces, and a broadband distribution in the frequency domain (figure 4 $n$
).
$n$
).
Permeability shows a strong stabilising effect for disks with high $Da$
. At
$Da$
. At $Da=2 \times 10^{-4}$
, the unsteady bifurcations are completely suppressed; the flow changes from a steady axisymmetric to an asymmetric state, then returns to an axisymmetric state with increasing
$Da=2 \times 10^{-4}$
, the unsteady bifurcations are completely suppressed; the flow changes from a steady axisymmetric to an asymmetric state, then returns to an axisymmetric state with increasing $\textit{Re}$
. For
$\textit{Re}$
. For $Da\ge 2.5 \times 10^{-4}$
, all bifurcations are suppressed, and the flow remains in the steady axisymmetric regime throughout the
$Da\ge 2.5 \times 10^{-4}$
, all bifurcations are suppressed, and the flow remains in the steady axisymmetric regime throughout the $\textit{Re}$
range explored in this research.
$\textit{Re}$
range explored in this research.
Interestingly, for disks with moderate permeability ( $Da=10^{-4}$
), the transition route is significantly modified. The RSB regime persists over a wider
$Da=10^{-4}$
), the transition route is significantly modified. The RSB regime persists over a wider $\textit{Re}$
range, whereas the SW regime diminishes. In addition, a newly discovered flow regime appears prior to the chaotic regime, replacing the quasi-periodic regime observed at lower permeabilities. For slightly higher permeability (
$\textit{Re}$
range, whereas the SW regime diminishes. In addition, a newly discovered flow regime appears prior to the chaotic regime, replacing the quasi-periodic regime observed at lower permeabilities. For slightly higher permeability ( $Da=1.5\times 10^{-4}$
), both the periodic and quasi-periodic regimes are suppressed, and a second new regime emerges before chaos. Detailed descriptions of these new regimes are given in the following subsections.
$Da=1.5\times 10^{-4}$
), both the periodic and quasi-periodic regimes are suppressed, and a second new regime emerges before chaos. Detailed descriptions of these new regimes are given in the following subsections.
3.2. The SVR breathing regime
A unique flow regime is observed around $Da \approx 10^{-4}$
and
$Da \approx 10^{-4}$
and $\textit{Re} \approx 200$
. In this regime, a combination of two distinct unsteady modes is detected. The first mode corresponds to the shedding of the hairpin vortex, as observed in the periodic regimes. The second mode is related to the slow variation in the shape of the near-wake recirculation regions. Key features of this regime are presented in figure 5 (see supplementary movie 1, is available at https://doi.org/10.1017/jfm.2026.11514.). The coefficient
$\textit{Re} \approx 200$
. In this regime, a combination of two distinct unsteady modes is detected. The first mode corresponds to the shedding of the hairpin vortex, as observed in the periodic regimes. The second mode is related to the slow variation in the shape of the near-wake recirculation regions. Key features of this regime are presented in figure 5 (see supplementary movie 1, is available at https://doi.org/10.1017/jfm.2026.11514.). The coefficient $C_y$
exhibits seven peaks (p1–p7) and troughs (t1–t7) (figures 5
$C_y$
exhibits seven peaks (p1–p7) and troughs (t1–t7) (figures 5 $b$
,
$b$
, $c$
), following the sequence p1 – t2 – p3 – t6 – p7 – t4 – p5 – t1 – p2 – t3 – p6 – t7 – p4 – t5. This slow variation has period
$c$
), following the sequence p1 – t2 – p3 – t6 – p7 – t4 – p5 – t1 – p2 – t3 – p6 – t7 – p4 – t5. This slow variation has period $T_B\approx 66.1$
. The PSD of
$T_B\approx 66.1$
. The PSD of $C_{{\kern-0.5pt}x}$
exhibits multiple peaks (figure 5
$C_{{\kern-0.5pt}x}$
exhibits multiple peaks (figure 5 $d$
), with the dominant one occurring at
$d$
), with the dominant one occurring at $St = 0.106$
, corresponding to hairpin vortex shedding. Additional peaks are observed at exactly one-seventh of the shedding frequency (
$St = 0.106$
, corresponding to hairpin vortex shedding. Additional peaks are observed at exactly one-seventh of the shedding frequency ( $St = 0.015$
), as well as at its second and third harmonics, which are associated with slow variations in the SVR. In contrast,
$St = 0.015$
), as well as at its second and third harmonics, which are associated with slow variations in the SVR. In contrast, $C_{{\kern-0.5pt}x}$
demonstrates periodicity
$C_{{\kern-0.5pt}x}$
demonstrates periodicity $0.5T_B$
and exhibits a single dominant peak at
$0.5T_B$
and exhibits a single dominant peak at $St = 0.03$
(figure 5
$St = 0.03$
(figure 5 $d$
). This low-frequency motion is attributed to the irregular azimuthal rotation of the vortex-shedding location (Shenoy & Kleinstreuer Reference Shenoy and Kleinstreuer2008) and the pumping motion of the recirculation region (Berger et al. Reference Berger, Scholz and Schumm1990), with
$d$
). This low-frequency motion is attributed to the irregular azimuthal rotation of the vortex-shedding location (Shenoy & Kleinstreuer Reference Shenoy and Kleinstreuer2008) and the pumping motion of the recirculation region (Berger et al. Reference Berger, Scholz and Schumm1990), with $St$
approximately 0.02 and 0.03 for impervious disks, respectively (Yang et al. Reference Yang, Liu, Wu, Liu and Zhang2015). It is noted that despite the presence of multiple peaks,
$St$
approximately 0.02 and 0.03 for impervious disks, respectively (Yang et al. Reference Yang, Liu, Wu, Liu and Zhang2015). It is noted that despite the presence of multiple peaks, $C_y$
remains symmetric about zero, indicating that the disk experiences a net-zero lift. The temporal variation of the near-wake recirculation regions within one period
$C_y$
remains symmetric about zero, indicating that the disk experiences a net-zero lift. The temporal variation of the near-wake recirculation regions within one period $T_B$
is examined by plotting the loci of zero streamwise velocity in the
$T_B$
is examined by plotting the loci of zero streamwise velocity in the $x$
–
$x$
– $y$
plane, as shown in figure 5(
$y$
plane, as shown in figure 5( $e$
), which clearly shows the ‘breathing’ process of the SVR. Because this behaviour occurs over relatively narrow ranges of
$e$
), which clearly shows the ‘breathing’ process of the SVR. Because this behaviour occurs over relatively narrow ranges of $\textit{Re}$
and
$\textit{Re}$
and $Da$
, the two frequencies remain relatively unchanged, maintaining the same 1/7 ratio for all cases examined within this regime.
$Da$
, the two frequencies remain relatively unchanged, maintaining the same 1/7 ratio for all cases examined within this regime.
The SVR breathing regime for $Da=10^{-4}$
and
$Da=10^{-4}$
and $\textit{Re}=200$
. Temporal variation of (
$\textit{Re}=200$
. Temporal variation of ( $a$
)
$a$
) $C_{{\kern-0.5pt}x}$
and (
$C_{{\kern-0.5pt}x}$
and ( $b$
)
$b$
) $C_y$
. (
$C_y$
. ( $c$
) The
$c$
) The $C_{{\kern-0.5pt}x}$
–
$C_{{\kern-0.5pt}x}$
– $C_y$
force diagram. (
$C_y$
force diagram. ( $d$
) The PSD analysis for
$d$
) The PSD analysis for $C_{{\kern-0.5pt}x}$
and
$C_{{\kern-0.5pt}x}$
and $C_y$
. (
$C_y$
. ( $e$
) Loci of zero streamwise velocity in the
$e$
) Loci of zero streamwise velocity in the $x$
–
$x$
– $y$
plane over one period of
$y$
plane over one period of $T_B$
. (
$T_B$
. ( $f$
) The SPOD coefficient
$f$
) The SPOD coefficient $A_m$
of the first five modes. Spatial structures of the (
$A_m$
of the first five modes. Spatial structures of the ( $g$
)
$g$
) $u$
and (
$u$
and ( $h$
)
$h$
) $v$
velocity components of selected SPOD modes (modes 1, 3 and 4).
$v$
velocity components of selected SPOD modes (modes 1, 3 and 4).

A spectral proper orthogonal decomposition (SPOD) analysis is performed on the velocity field. The first five SPOD modes collectively capture more than 85 % of the total kinetic energy, representing the dominant coherent structures in the flow (figure 5 $f$
). Specifically, modes 1 and 2 exhibit a dominant peak at
$f$
). Specifically, modes 1 and 2 exhibit a dominant peak at $St = 0.106$
, with mode 2 phase-shifted relative to mode 1. Modes 3 and 5 show a dominant frequency at
$St = 0.106$
, with mode 2 phase-shifted relative to mode 1. Modes 3 and 5 show a dominant frequency at $St = 0.030$
, which is identical to that of
$St = 0.030$
, which is identical to that of $C_{{\kern-0.5pt}x}$
. Mode 4 displays multiple peaks at
$C_{{\kern-0.5pt}x}$
. Mode 4 displays multiple peaks at $St = 0.015$
, 0.045, 0.076 and 0.136, which correspond to the 1st, 3rd, 5th and 9th harmonics of the SVR breathing process. Mode 1 exhibits a strong periodic signature associated with the shedding of hairpin vortices, while modes 3 and 4 represent the low-frequency unsteadiness (figures 5
$St = 0.015$
, 0.045, 0.076 and 0.136, which correspond to the 1st, 3rd, 5th and 9th harmonics of the SVR breathing process. Mode 1 exhibits a strong periodic signature associated with the shedding of hairpin vortices, while modes 3 and 4 represent the low-frequency unsteadiness (figures 5 $g$
,
$g$
, $h$
). These two dominant structures correspond closely to the oscillatory and non-oscillatory unsteady modes identified by the linear stability analyses (Vagnoli et al. Reference Vagnoli, Zampogna, Camarri, Gallaire and Ledda2023).
$h$
). These two dominant structures correspond closely to the oscillatory and non-oscillatory unsteady modes identified by the linear stability analyses (Vagnoli et al. Reference Vagnoli, Zampogna, Camarri, Gallaire and Ledda2023).
The emergence of the SVR breathing regime is attributed to a perfect subharmonic lock-in between the $m=0$
mode associated with the low-frequency unsteadiness and the
$m=0$
mode associated with the low-frequency unsteadiness and the $m=1$
mode (vortex shedding), where
$m=1$
mode (vortex shedding), where $m$
denotes the spatial wavenumber. These two modes are also observed for the quasi-periodic regimes of impervious bluff bodies (Shenoy & Kleinstreuer Reference Shenoy and Kleinstreuer2008) and permeable disks (Vagnoli et al. Reference Vagnoli, Zampogna, Camarri, Gallaire and Ledda2023). From this perspective, the new regime is a unique quasi-periodic state with recovered periodicity due to the subharmonic lock-in phenomena. Such lock-in has previously been observed for an impervious thick disk (Auguste et al. Reference Auguste, Fabre and Magnaudet2010) and a sphere (Bouchet, Mebarek & Dušek Reference Bouchet, Mebarek and Dušek2006), but not for a thin disk with
$m$
denotes the spatial wavenumber. These two modes are also observed for the quasi-periodic regimes of impervious bluff bodies (Shenoy & Kleinstreuer Reference Shenoy and Kleinstreuer2008) and permeable disks (Vagnoli et al. Reference Vagnoli, Zampogna, Camarri, Gallaire and Ledda2023). From this perspective, the new regime is a unique quasi-periodic state with recovered periodicity due to the subharmonic lock-in phenomena. Such lock-in has previously been observed for an impervious thick disk (Auguste et al. Reference Auguste, Fabre and Magnaudet2010) and a sphere (Bouchet, Mebarek & Dušek Reference Bouchet, Mebarek and Dušek2006), but not for a thin disk with $\chi \ge 6$
. As the disk permeability increases, the shedding frequency decreases: it drops from 0.116 to 0.105 as
$\chi \ge 6$
. As the disk permeability increases, the shedding frequency decreases: it drops from 0.116 to 0.105 as $Da$
decreases from
$Da$
decreases from $10^{-9}$
to
$10^{-9}$
to $10^{-4}$
at
$10^{-4}$
at $\textit{Re}=200$
, bringing it into a subharmonic resonance with the
$\textit{Re}=200$
, bringing it into a subharmonic resonance with the $m=0$
mode, forming a fixed 1 : 7 frequency ratio. This frequency alignment allows nonlinear mode coupling to synchronise the two modes, resulting in a single-loop limit cycle and the flow regaining spatio-temporal symmetry.
$m=0$
mode, forming a fixed 1 : 7 frequency ratio. This frequency alignment allows nonlinear mode coupling to synchronise the two modes, resulting in a single-loop limit cycle and the flow regaining spatio-temporal symmetry.
3.3. The intermittency regime
The ‘intermittency regime’ is observed for $Da \approx 1.5\times 10^{-4}$
and
$Da \approx 1.5\times 10^{-4}$
and $\textit{Re} \approx 200$
. In this regime, the wake alternates irregularly between two periodic modes (mode A and mode B), which possess orthogonal planes of symmetry (figures 6
$\textit{Re} \approx 200$
. In this regime, the wake alternates irregularly between two periodic modes (mode A and mode B), which possess orthogonal planes of symmetry (figures 6 $a$
–
$a$
– $d$
, see supplementary movie 2), identical oscillation amplitudes, and dynamics resembling the SW regime observed in bluff-body wakes and for permeable disks at lower
$d$
, see supplementary movie 2), identical oscillation amplitudes, and dynamics resembling the SW regime observed in bluff-body wakes and for permeable disks at lower $Da$
and
$Da$
and $\textit{Re}$
. Both modes A and B evolve through three distinct phases (figures 6
$\textit{Re}$
. Both modes A and B evolve through three distinct phases (figures 6 $e$
–
$e$
– $g$
). For the representative case with
$g$
). For the representative case with $\textit{Re}=200$
and
$\textit{Re}=200$
and $Da=1.5\times 10^{-4}$
, during phase I for mode A, the instability develops in the
$Da=1.5\times 10^{-4}$
, during phase I for mode A, the instability develops in the $y$
direction. The corresponding force component
$y$
direction. The corresponding force component $C_y$
initially exhibits oscillations with exponentially growing amplitude, with the
$C_y$
initially exhibits oscillations with exponentially growing amplitude, with the $x$
–
$x$
– $z$
plane serving as the plane of symmetry. In phase II,
$z$
plane serving as the plane of symmetry. In phase II, $C_y$
reaches saturation, maintaining a constant amplitude, while
$C_y$
reaches saturation, maintaining a constant amplitude, while $C_z$
remains zero. In phase III,
$C_z$
remains zero. In phase III, $C_y$
decays exponentially, whereas
$C_y$
decays exponentially, whereas $C_z$
decreases to a finite threshold before it starts to oscillate. For mode B, the plane of symmetry switches to the
$C_z$
decreases to a finite threshold before it starts to oscillate. For mode B, the plane of symmetry switches to the $x$
–
$x$
– $y$
plane, orthogonal to that of mode A. The wake then evolves following a similar three-phase structure along this new symmetry plane. The variation of the lift force angle with respect to the
$y$
plane, orthogonal to that of mode A. The wake then evolves following a similar three-phase structure along this new symmetry plane. The variation of the lift force angle with respect to the $y$
axis (
$y$
axis ( $\theta$
in figure 6
$\theta$
in figure 6 $h$
) indicates the switching of the symmetry plane. Note that the symmetry plane observed in this regime is not necessarily aligned with the
$h$
) indicates the switching of the symmetry plane. Note that the symmetry plane observed in this regime is not necessarily aligned with the $x$
–
$x$
– $y$
or
$y$
or $x$
–
$x$
– $z$
planes of the mesh. For
$z$
planes of the mesh. For $Da = 1.5 \times 10^{-4}$
and
$Da = 1.5 \times 10^{-4}$
and $\textit{Re} = 210$
, the selected symmetry planes are oriented at
$\textit{Re} = 210$
, the selected symmetry planes are oriented at $60.5^{\circ }$
and
$60.5^{\circ }$
and $150.5^{\circ }$
relative to the
$150.5^{\circ }$
relative to the $x$
–
$x$
– $y$
plane (figure 6
$y$
plane (figure 6 $i$
), indicating that the observed switching dynamics are not artefacts of the mesh but are instead selected naturally by the flow. Mode switching occurs irregularly, with time intervals ranging from 500 to 600 convective times. This corresponds to the multiple low-frequency peaks observed in the PSD spectrum (figure 6
$i$
), indicating that the observed switching dynamics are not artefacts of the mesh but are instead selected naturally by the flow. Mode switching occurs irregularly, with time intervals ranging from 500 to 600 convective times. This corresponds to the multiple low-frequency peaks observed in the PSD spectrum (figure 6 $j$
), at approximately
$j$
), at approximately $St = 0.0017$
for
$St = 0.0017$
for $C_{{\kern-0.5pt}x}$
, and
$C_{{\kern-0.5pt}x}$
, and $St = 0.0009$
for
$St = 0.0009$
for $C_y$
.
$C_y$
.
The intermittency regime for $Da=1.5\times 10^{-4}$
and
$Da=1.5\times 10^{-4}$
and $\textit{Re}=200$
. Isosurfaces of streamwise vorticity
$\textit{Re}=200$
. Isosurfaces of streamwise vorticity $\pm 0.1 u_{\infty }/d$
(red/blue) for (
$\pm 0.1 u_{\infty }/d$
(red/blue) for ( $a$
,
$a$
, $b$
) mode A at
$b$
) mode A at $t=1900$
, and (
$t=1900$
, and ( $c$
,
$c$
, $d$
) mode B at
$d$
) mode B at $t=2400$
in the (
$t=2400$
in the ( $a$
,
$a$
, $c$
)
$c$
) $x$
–
$x$
– $y$
and (
$y$
and ( $b$
,
$b$
, $d$
)
$d$
) $x$
–
$x$
– $z$
planes. Temporal variation of (
$z$
planes. Temporal variation of ( $e$
)
$e$
) $C_{{\kern-0.5pt}x}$
, (
$C_{{\kern-0.5pt}x}$
, ( $f$
)
$f$
) $C_y$
and (
$C_y$
and ( $g$
)
$g$
) $C_z$
. Orientation
$C_z$
. Orientation $\theta$
of lift force with respect to the
$\theta$
of lift force with respect to the $y$
axis for
$y$
axis for $Da=1.5\times 10^{-4}$
with (
$Da=1.5\times 10^{-4}$
with ( $h$
)
$h$
) $\textit{Re}=200$
and (
$\textit{Re}=200$
and ( $i$
)
$i$
) $\textit{Re}=210$
. (
$\textit{Re}=210$
. ( $j$
) The normalised PSD of
$j$
) The normalised PSD of $C_{{\kern-0.5pt}x}$
and
$C_{{\kern-0.5pt}x}$
and $C_y$
.
$C_y$
.

The normalised vorticity magnitude around the edge of disks in the $x$
–
$x$
– $y$
plane for
$y$
plane for $Da=1.5\times 10^{-4}$
with
$Da=1.5\times 10^{-4}$
with $\textit{Re}$
values (
$\textit{Re}$
values ( $a$
)
$a$
) $160$
, (
$160$
, ( $b$
) 180 and (
$b$
) 180 and ( $c$
) 200.
$c$
) 200.

To further analyse the origin of the observed mode switching, we examine the vorticity field near the disk edge. Its intensity decreases with increasing $\textit{Re}$
(figure 7), with the peak value of the normalised vorticity magnitude dropping from 25.1 at
$\textit{Re}$
(figure 7), with the peak value of the normalised vorticity magnitude dropping from 25.1 at $\textit{Re}=160$
to 23.7 at
$\textit{Re}=160$
to 23.7 at $\textit{Re}=200$
, indicating a progressive weakening of the separated shear layers induced by the bleed flow through the disk. Because vortex shedding in bluff-body wakes results from the roll-up of these shear layers into coherent vortical structures, this reduction in vorticity may limit the growth and coherence of the shed vortices, and reduce the energy available to sustain stable harmonic oscillations. The wake possesses two degenerate azimuthal modes (
$\textit{Re}=200$
, indicating a progressive weakening of the separated shear layers induced by the bleed flow through the disk. Because vortex shedding in bluff-body wakes results from the roll-up of these shear layers into coherent vortical structures, this reduction in vorticity may limit the growth and coherence of the shed vortices, and reduce the energy available to sustain stable harmonic oscillations. The wake possesses two degenerate azimuthal modes ( $m=\pm 1$
) oriented along orthogonal planes, each extracting energy from the mean shear along its own plane. As the energy available to one mode decreases, its oscillation may decay while the competing mode grows. Future studies could investigate whether this alternating competition between the two modes underlies the intermittent switching of the wake between modes A and B, as suggested by these results.
$m=\pm 1$
) oriented along orthogonal planes, each extracting energy from the mean shear along its own plane. As the energy available to one mode decreases, its oscillation may decay while the competing mode grows. Future studies could investigate whether this alternating competition between the two modes underlies the intermittent switching of the wake between modes A and B, as suggested by these results.
3.4. Sensitivity to non-zero inertial resistance
In the present work, we neglect inertial (Forchheimer) resistance and adopt a Darcy–Brinkman formulation as the macroscopic model for the permeable disk. This choice is motivated by the relatively low $\textit{Re}$
considered, for which inertial effects within the porous medium are likely to be weak. Nonetheless, here we investigate the sensitivity of the newly identified boundaries with the inertial resistance.
$\textit{Re}$
considered, for which inertial effects within the porous medium are likely to be weak. Nonetheless, here we investigate the sensitivity of the newly identified boundaries with the inertial resistance.
At $Da=10^{-9}$
, the disk is effectively impervious, with minimal flow through. Under these conditions, increasing
$Da=10^{-9}$
, the disk is effectively impervious, with minimal flow through. Under these conditions, increasing $C_{\!F}$
from 0 to 1 results in no differences in the total drag (figure 8
$C_{\!F}$
from 0 to 1 results in no differences in the total drag (figure 8 $a$
). At
$a$
). At $Da=10^{-4}$
, where the new SVR breathing regime has been identified, both the planar symmetry and periodicity are preserved when
$Da=10^{-4}$
, where the new SVR breathing regime has been identified, both the planar symmetry and periodicity are preserved when $C_{\!F}$
is increased from 0 to 0.05. The flow remains in the SVR breathing regime. Conversely, for
$C_{\!F}$
is increased from 0 to 0.05. The flow remains in the SVR breathing regime. Conversely, for $C_{\!F}$
from 0.1 to 0.4, the wake that featured in the SVR breathing regime at
$C_{\!F}$
from 0.1 to 0.4, the wake that featured in the SVR breathing regime at $C_F=0$
now shows a quasi-periodic regime (figure 8
$C_F=0$
now shows a quasi-periodic regime (figure 8 $b$
). Therefore, the transition from SVR breathing to quasi-periodic regime can be achieved either by increasing
$b$
). Therefore, the transition from SVR breathing to quasi-periodic regime can be achieved either by increasing $Da$
with
$Da$
with $C_F=0$
, or by increasing
$C_F=0$
, or by increasing $C_{\!F}$
with a constant
$C_{\!F}$
with a constant $Da$
. This suggests that the transition is driven by the increased flow resistance rather than the type of resistance. The characteristic bleed-flow velocity is approximately
$Da$
. This suggests that the transition is driven by the increased flow resistance rather than the type of resistance. The characteristic bleed-flow velocity is approximately $10\,\%$
of the free-stream velocity. Substituting this value into the Forchheimer contribution with
$10\,\%$
of the free-stream velocity. Substituting this value into the Forchheimer contribution with $C_F=0.1$
yields a correction of only approximately
$C_F=0.1$
yields a correction of only approximately $2\,\%$
of the total drag, which seems to be sufficient to change the flow regime. While these results suggest that the additional inertial resistance only shifts the boundary between the different flow regimes, the bifurcation sequence might change at sufficiently high
$2\,\%$
of the total drag, which seems to be sufficient to change the flow regime. While these results suggest that the additional inertial resistance only shifts the boundary between the different flow regimes, the bifurcation sequence might change at sufficiently high $C_{\!F}$
.
$C_{\!F}$
.
( $a$
) The time history of the drag coefficient for
$a$
) The time history of the drag coefficient for $Da=10^{-9}$
and
$Da=10^{-9}$
and $\textit{Re}=150$
with various
$\textit{Re}=150$
with various $C_{\!F}$
. (
$C_{\!F}$
. ( $b$
) The
$b$
) The $C_{{\kern-0.5pt}x}$
–
$C_{{\kern-0.5pt}x}$
– $C_y$
diagrams for
$C_y$
diagrams for $Da=10^{-4}$
and
$Da=10^{-4}$
and $\textit{Re}=200$
with various
$\textit{Re}=200$
with various $C_{\!F}$
.
$C_{\!F}$
.

3.5. Effect of aspect ratio
In the present work, we consider only disks with $\chi = 10$
. To assess how changes in aspect ratio affect the wake transition, the steady–unsteady transition boundary obtained in the present study is compared with the stability curve reported by Vagnoli et al. (Reference Vagnoli, Zampogna, Camarri, Gallaire and Ledda2023) (figure 9
$\chi = 10$
. To assess how changes in aspect ratio affect the wake transition, the steady–unsteady transition boundary obtained in the present study is compared with the stability curve reported by Vagnoli et al. (Reference Vagnoli, Zampogna, Camarri, Gallaire and Ledda2023) (figure 9 $a$
). The
$a$
). The $Da$
value is rescaled using
$Da$
value is rescaled using $Da_{\textit{eff}}\equiv \chi\, Da$
to account for the effect of finite thickness and enable a more meaningful comparison. A noticeable gap appears between the two curves. However, the critical
$Da_{\textit{eff}}\equiv \chi\, Da$
to account for the effect of finite thickness and enable a more meaningful comparison. A noticeable gap appears between the two curves. However, the critical $\textit{Re}$
is also identified for
$\textit{Re}$
is also identified for $\chi =20$
through simulations with
$\chi =20$
through simulations with $Da=5\times 10^{-6}$
(
$Da=5\times 10^{-6}$
( $Da_{\textit{eff}}=10^{-4}$
) and
$Da_{\textit{eff}}=10^{-4}$
) and $\textit{Re}$
ranging from 130 to 150 to find the location where the growth rate of instability vanishes. This additional point lies within the interval between the curve with
$\textit{Re}$
ranging from 130 to 150 to find the location where the growth rate of instability vanishes. This additional point lies within the interval between the curve with $\chi =10$
and that with vanishing thickness Vagnoli et al. (Reference Vagnoli, Zampogna, Camarri, Gallaire and Ledda2023). The shifted transition boundary is therefore attributed to the finite thickness of the disk. These results suggest that reducing the thickness towards the infinitesimal limit might progressively shift the stability curve towards the boundary predicted by the linear stability analysis using the homogenisation theory.
$\chi =10$
and that with vanishing thickness Vagnoli et al. (Reference Vagnoli, Zampogna, Camarri, Gallaire and Ledda2023). The shifted transition boundary is therefore attributed to the finite thickness of the disk. These results suggest that reducing the thickness towards the infinitesimal limit might progressively shift the stability curve towards the boundary predicted by the linear stability analysis using the homogenisation theory.
( $a$
) The
$a$
) The $\textit{Re}$
–
$\textit{Re}$
– $Da_{\textit{eff}}$
boundary of steady and unsteady transition. The
$Da_{\textit{eff}}$
boundary of steady and unsteady transition. The $C_{{\kern-0.5pt}x}$
–
$C_{{\kern-0.5pt}x}$
– $C_y$
diagrams for
$C_y$
diagrams for $\textit{Re}=200$
and
$\textit{Re}=200$
and $Da_{\textit{eff}}=10^{-3}$
with various aspect ratios: (
$Da_{\textit{eff}}=10^{-3}$
with various aspect ratios: ( $b$
)
$b$
) $\chi =5$
and
$\chi =5$
and $Da=2\times 10^{-4}$
, (
$Da=2\times 10^{-4}$
, ( $c$
)
$c$
) $\chi =10$
and
$\chi =10$
and $Da=10^{-4}$
, (
$Da=10^{-4}$
, ( $d$
)
$d$
) $\chi =20$
and
$\chi =20$
and $Da=5\times 10^{-5}$
.
$Da=5\times 10^{-5}$
.

Next, we examine whether the thickness affects the existence of the newly identified regime, and whether the boundaries remain unchanged for the same $Da_{\textit{eff}}$
. We consider
$Da_{\textit{eff}}$
. We consider $\textit{Re}=200$
and
$\textit{Re}=200$
and $Da=10^{-4}$
, where the wake features the SVR breathing regime. We tested additional cases with
$Da=10^{-4}$
, where the wake features the SVR breathing regime. We tested additional cases with $\chi = 5$
and
$\chi = 5$
and $\chi = 20$
while keeping the same
$\chi = 20$
while keeping the same $Da_{\textit{eff}}$
, i.e. at
$Da_{\textit{eff}}$
, i.e. at $Da = 2 \times 10^{-4}$
and
$Da = 2 \times 10^{-4}$
and $5 \times 10^{-5}$
, respectively. For
$5 \times 10^{-5}$
, respectively. For $\chi = 5$
, the system behaves similarly to the
$\chi = 5$
, the system behaves similarly to the $\chi = 10$
case, with a similar closed-loop attractor exhibiting seven local maxima and minima in the force diagram and with the periodicity preserved (figure 9
$\chi = 10$
case, with a similar closed-loop attractor exhibiting seven local maxima and minima in the force diagram and with the periodicity preserved (figure 9 $b$
). In contrast, the
$b$
). In contrast, the $\chi = 20$
case exhibits more quasi-periodic behaviour. In addition,
$\chi = 20$
case exhibits more quasi-periodic behaviour. In addition, $C_y$
is compressed into a smaller range while the mean value of
$C_y$
is compressed into a smaller range while the mean value of $C_{{\kern-0.5pt}x}$
increases (figure 9
$C_{{\kern-0.5pt}x}$
increases (figure 9 $d$
).
$d$
).
Based on these observations, we infer that the newly observed regime is not confined to a single value of $\chi$
. However, variations in
$\chi$
. However, variations in $\chi$
modify the
$\chi$
modify the $\textit{Re}{-}Da$
boundaries between different flow regimes. Furthermore, these boundaries do not collapse by rescaling the permeability with
$\textit{Re}{-}Da$
boundaries between different flow regimes. Furthermore, these boundaries do not collapse by rescaling the permeability with $Da_{\textit{eff}}$
. Finally, for much thicker disks, changes in thickness may significantly alter the bifurcation structure of disk wakes, as increasing thickness is known to introduce additional unsteady flow regimes for impervious disks (Auguste et al. Reference Auguste, Fabre and Magnaudet2010). Consequently, the present results may not remain valid for substantially larger values of
$Da_{\textit{eff}}$
. Finally, for much thicker disks, changes in thickness may significantly alter the bifurcation structure of disk wakes, as increasing thickness is known to introduce additional unsteady flow regimes for impervious disks (Auguste et al. Reference Auguste, Fabre and Magnaudet2010). Consequently, the present results may not remain valid for substantially larger values of $\chi$
.
$\chi$
.
4. Conclusion
We numerically investigate the wake stability of three-dimensional permeable disks over Reynolds number ( $\textit{Re}$
) range 100–300 and Darcy number (
$\textit{Re}$
) range 100–300 and Darcy number ( $Da$
) range
$Da$
) range $10^{-9}$
–
$10^{-9}$
– $10^{-3}$
, using a self-developed porousPimpleFoam solver within OpenFOAM. We discover that for disks with low permeability (
$10^{-3}$
, using a self-developed porousPimpleFoam solver within OpenFOAM. We discover that for disks with low permeability ( $Da\le 8\times 10^{-5}$
), the dynamical transition route follows the same bifurcation sequence as for impervious disks: steady axisymmetric, steady asymmetric, periodic, quasi-periodic and chaotic regimes, with the critical
$Da\le 8\times 10^{-5}$
), the dynamical transition route follows the same bifurcation sequence as for impervious disks: steady axisymmetric, steady asymmetric, periodic, quasi-periodic and chaotic regimes, with the critical $\textit{Re}$
for all bifurcations increasing with decreasing
$\textit{Re}$
for all bifurcations increasing with decreasing $Da$
. In contrast, for disks with high permeability (
$Da$
. In contrast, for disks with high permeability ( $Da\ge 2\times 10^{-4}$
), all unsteady bifurcations are suppressed, and the wake remains in steady regimes throughout the
$Da\ge 2\times 10^{-4}$
), all unsteady bifurcations are suppressed, and the wake remains in steady regimes throughout the $\textit{Re}$
range considered. At intermediate
$\textit{Re}$
range considered. At intermediate $Da$
, permeability gives rise to two previously unreported flow regimes in the wake of bluff bodies. The first, referred to as the ‘SVR breathing regime’, appears at
$Da$
, permeability gives rise to two previously unreported flow regimes in the wake of bluff bodies. The first, referred to as the ‘SVR breathing regime’, appears at $Da\approx 10^{-4}$
and
$Da\approx 10^{-4}$
and $\textit{Re}\approx 200$
. It consists of a superposition of two distinct unsteady dynamics: a primary mode associated with hairpin vortex shedding, and a secondary mode linked to slow variations of the SVR, with frequency one-seventh of the shedding frequency. The emergence of this regime is attributed to the subharmonic lock-in between the low-frequency unsteadiness and the vortex shedding. The second, the ‘intermittency regime’, occurs at
$\textit{Re}\approx 200$
. It consists of a superposition of two distinct unsteady dynamics: a primary mode associated with hairpin vortex shedding, and a secondary mode linked to slow variations of the SVR, with frequency one-seventh of the shedding frequency. The emergence of this regime is attributed to the subharmonic lock-in between the low-frequency unsteadiness and the vortex shedding. The second, the ‘intermittency regime’, occurs at $Da\approx 1.5\times 10^{-4}$
and
$Da\approx 1.5\times 10^{-4}$
and $\textit{Re}\approx 200$
, in which the wake alternates irregularly between two periodic modes with orthogonal planes of symmetry. The reduction in near-edge vorticity induced by the bleed flow through the disk indicates a weakening of the separated shear layers, which may limit the growth of shed vortices, and reduce the energy available to sustain stable harmonic oscillations. Therefore, the coexistence of two degenerate azimuthal modes that compete for energy extracted from the mean shear suggests a possible mechanism for the observed intermittent switching.
$\textit{Re}\approx 200$
, in which the wake alternates irregularly between two periodic modes with orthogonal planes of symmetry. The reduction in near-edge vorticity induced by the bleed flow through the disk indicates a weakening of the separated shear layers, which may limit the growth of shed vortices, and reduce the energy available to sustain stable harmonic oscillations. Therefore, the coexistence of two degenerate azimuthal modes that compete for energy extracted from the mean shear suggests a possible mechanism for the observed intermittent switching.
The newly discovered regime has been shown to be resilient to changes in $C_{\!F}$
up to 0.05 and within a range of aspect ratios
$C_{\!F}$
up to 0.05 and within a range of aspect ratios $5\lt \chi \lt 20$
. However, this has been verified only over a very limited parameter space, and further research is needed to investigate the effects of inertial resistance and disk thickness on wake dynamics and transition sequences. A further limitation of the present study is that it does not systematically examine the transition pathways between the identified flow regimes or their possible interconnections. Since all simulations were initiated from the same impulsive start, the potential existence of hysteresis could not be assessed, and how the newly identified regime connects to the others remains unresolved and is left for future work. Finally, the present study is limited to a stationary permeable disk, so the reported bifurcation behaviour cannot be directly extrapolated to freely falling disks.
$5\lt \chi \lt 20$
. However, this has been verified only over a very limited parameter space, and further research is needed to investigate the effects of inertial resistance and disk thickness on wake dynamics and transition sequences. A further limitation of the present study is that it does not systematically examine the transition pathways between the identified flow regimes or their possible interconnections. Since all simulations were initiated from the same impulsive start, the potential existence of hysteresis could not be assessed, and how the newly identified regime connects to the others remains unresolved and is left for future work. Finally, the present study is limited to a stationary permeable disk, so the reported bifurcation behaviour cannot be directly extrapolated to freely falling disks.
Overall, these findings demonstrate that permeability can fundamentally alter wake dynamics and introduce new wake structures that do not occur on impervious disks.
Supplementary movies
Supplementary movies are available at https://doi.org/10.1017/jfm.2026.11514.
Acknowledgements
The authors would like to express their sincere gratitude to Dr Ahmet Gungor for his continuous support and valuable suggestions throughout the course of this work. This work received funds from the European Research Council via the Consolidator Grant ‘Dandidrone’ (101001499). The scholarship of D.H. is funded by the EPSRC Centre for Doctoral Training in Wind and Marine Energy Systems and Structures (EP/S023801/1). This work used the ARCHER2 UK National Supercomputing Service (https://www.archer2.ac.uk) and the EuroHPC JU’s LUMI-C supercomputer (https://lumi-supercomputer.eu), hosted in Finland, through EuroHPC Extreme Access call (EHPC-EXT-2024E02-101) for the simulations.
Declaration of interests
The authors report no conflict of interest.
Data availability statement
Data underpinning this work are available at https://doi.org/10.7488/ds/8106.
Appendix A. Verification
The numerical uncertainty due to the finite grid and time resolution and modelling error due to finite domain size on the $C_D$
and
$C_D$
and $St$
of the drag oscillation are estimated following the guideline process proposed by Viola, Bot & Riotte (Reference Viola, Bot and Riotte2013). This method was originally developed for yacht sail aerodynamics, but it has been adopted for a wide range of applications, including the flow around the pappus of the dandelion diaspore (Cummins et al. Reference Cummins, Seale, Macente, Certini, Mastropaolo, Viola and Nakayama2018), permeable plates (Bose, Bruce & Viola Reference Bose, Bruce and Viola2025) and disks (Cummins et al. Reference Cummins, Viola, Mastropaolo and Nakayama2017).
$St$
of the drag oscillation are estimated following the guideline process proposed by Viola, Bot & Riotte (Reference Viola, Bot and Riotte2013). This method was originally developed for yacht sail aerodynamics, but it has been adopted for a wide range of applications, including the flow around the pappus of the dandelion diaspore (Cummins et al. Reference Cummins, Seale, Macente, Certini, Mastropaolo, Viola and Nakayama2018), permeable plates (Bose, Bruce & Viola Reference Bose, Bruce and Viola2025) and disks (Cummins et al. Reference Cummins, Viola, Mastropaolo and Nakayama2017).
Four grid resolutions, four time step sizes, and four domain sizes are examined. The four grid sizes, denoted G1–G4, respectively, are defined such that the base grid G2 contains $n=300$
grid points in the circumferential direction of the disk. Grids G1, G3 and G4 are obtained by scaling this resolution by factors
$n=300$
grid points in the circumferential direction of the disk. Grids G1, G3 and G4 are obtained by scaling this resolution by factors $1/\sqrt {2}$
,
$1/\sqrt {2}$
, $\sqrt {2}$
and
$\sqrt {2}$
and $2$
, respectively. Four time step sizes T1–T4, respectively, are uniformly varied, with
$2$
, respectively. Four time step sizes T1–T4, respectively, are uniformly varied, with $\delta _t$
ranging between
$\delta _t$
ranging between $0.00025$
and
$0.00025$
and $0.001$
. Four computational domain sizes D1–D4, respectively, are also considered, with
$0.001$
. Four computational domain sizes D1–D4, respectively, are also considered, with $L_u$
ranging from 25 to 10. The local grid spacing is kept identical for all domains. The base settings are T2, D2 and G2, which are used in the simulations in the rest of the study. The relative sources of errors (
$L_u$
ranging from 25 to 10. The local grid spacing is kept identical for all domains. The base settings are T2, D2 and G2, which are used in the simulations in the rest of the study. The relative sources of errors ( $h$
) associated with the grid, domain and time scales are normalised using a base configuration and defined as
$h$
) associated with the grid, domain and time scales are normalised using a base configuration and defined as $h_{g} = (n/n_{{base}})^{-1}$
,
$h_{g} = (n/n_{{base}})^{-1}$
, $h_{t} =(\delta _ t/{\delta _ t}_{{base}})$
and
$h_{t} =(\delta _ t/{\delta _ t}_{{base}})$
and $h_{d} = (L_{u}/{L_u}_{{base}})^{-1}$
. In the limit as
$h_{d} = (L_{u}/{L_u}_{{base}})^{-1}$
. In the limit as $h\rightarrow 0$
, the corresponding contribution to the numerical and modelling error vanishes.
$h\rightarrow 0$
, the corresponding contribution to the numerical and modelling error vanishes.
The Strouhal number as a function of ( $a$
) the relative domain size and (
$a$
) the relative domain size and ( $b$
) the relative time step. (
$b$
) the relative time step. ( $c$
) The drag coefficient as a function of the relative grid size.
$c$
) The drag coefficient as a function of the relative grid size.

We estimate the modelling error and numerical uncertainty for $C_D$
at
$C_D$
at $\textit{Re}=130$
and
$\textit{Re}=130$
and $Da=10^{-6}$
, where the wake is steady (case 1), and those for
$Da=10^{-6}$
, where the wake is steady (case 1), and those for $C_D$
and
$C_D$
and $St$
at
$St$
at $\textit{Re}=150$
and
$\textit{Re}=150$
and $Da=10^{-9}$
, where the wake is unsteady (case 2). Let
$Da=10^{-9}$
, where the wake is unsteady (case 2). Let $\phi$
be the relative change in
$\phi$
be the relative change in $C_D$
or
$C_D$
or $St$
compared to the base value, i.e.
$St$
compared to the base value, i.e. $\phi _{C_D}=C_D/C_{D_{{base}}}$
and
$\phi _{C_D}=C_D/C_{D_{{base}}}$
and $\phi _{St}=St/St_{{base}}$
. We study the trends of
$\phi _{St}=St/St_{{base}}$
. We study the trends of $\phi _{C_D}$
and
$\phi _{C_D}$
and $\phi _{St}$
with
$\phi _{St}$
with $h$
, and we extrapolate their values for
$h$
, and we extrapolate their values for $h \to 0$
(Roache Reference Roache1998). We do so by fitting the results with
$h \to 0$
(Roache Reference Roache1998). We do so by fitting the results with
 \begin{equation} \phi (h) = c h^{q} + \phi _0, \end{equation}
where $c$
and
$c$
and $q$
are coefficients determined using the least squares method. The extrapolated value
$q$
are coefficients determined using the least squares method. The extrapolated value $\phi _0$
for
$\phi _0$
for $h\rightarrow 0$
is the expected true value.
$h\rightarrow 0$
is the expected true value.
The relative modelling error is computed as $\delta =1-\phi _0$
. The uncertainty
$\delta =1-\phi _0$
. The uncertainty $U_{\phi }$
is computed based on the order of convergence
$U_{\phi }$
is computed based on the order of convergence $q$
. For
$q$
. For $q\gt 0.95$
(e.g. figures 10
$q\gt 0.95$
(e.g. figures 10 $a$
,
$a$
, $b$
), the uncertainty in the computation of
$b$
), the uncertainty in the computation of $\phi$
within a 95 % confidence level is (Viola et al. Reference Viola, Bot and Riotte2013)
$\phi$
within a 95 % confidence level is (Viola et al. Reference Viola, Bot and Riotte2013)
 \begin{equation} U_{\phi } = 1.25\delta + \sigma , \end{equation}
where $\sigma$
is the standard deviation of the fit. When
$\sigma$
is the standard deviation of the fit. When $0.05 \le q \lt 0.95$
(e.g. figure 10
$0.05 \le q \lt 0.95$
(e.g. figure 10 $c$
), the uncertainty is
$c$
), the uncertainty is
 \begin{equation} U_{\phi } = 1.5\varDelta _{\phi } + \sigma , \end{equation}
where
 \begin{equation} \varDelta _{\phi }=\frac {\phi _{{max}}-\phi _{{min}}}{{1-{h_{{min}}}/{h_{{max}}}}}. \end{equation}
Here, $\phi _{{max}}$
and
$\phi _{{max}}$
and $\phi _{{min}}$
, and
$\phi _{{min}}$
, and $h_{{max}}$
and
$h_{{max}}$
and $h_{{min}}$
, are the extremes of the
$h_{{min}}$
, are the extremes of the $\phi$
and
$\phi$
and $h$
values among all four simulations. The modelling errors
$h$
values among all four simulations. The modelling errors $\delta _{C_D}$
and
$\delta _{C_D}$
and $\delta _{St}$
due to the finite domain size, and the numerical uncertainties
$\delta _{St}$
due to the finite domain size, and the numerical uncertainties $U_{C_D}$
and
$U_{C_D}$
and $U_{St}$
due to finite grid and time resolution, are summarised in tables 2 to 4.
$U_{St}$
due to finite grid and time resolution, are summarised in tables 2 to 4.
Modelling error due to the finite domain size for the drag coefficient and Strouhal number.

Appendix B. Determination of the critical $\textit{Re}$
for steady–unsteady transition
$\textit{Re}$
for steady–unsteady transition

The steady–unsteady transition boundary for permeable disks with $Da\le 10^{-4}$
is assessed using the Stuart–Landau model (Thompson & Le Gal Reference Thompson and Le Gal2004; Rastan et al. Reference Rastan, Alam, Zhu and Ji2022). To determine the critical Reynolds number corresponding to the onset of a Hopf bifurcation (
$Da\le 10^{-4}$
is assessed using the Stuart–Landau model (Thompson & Le Gal Reference Thompson and Le Gal2004; Rastan et al. Reference Rastan, Alam, Zhu and Ji2022). To determine the critical Reynolds number corresponding to the onset of a Hopf bifurcation ( $\textit{Re}_{c_2}$
), time series of the lift force coefficient component
$\textit{Re}_{c_2}$
), time series of the lift force coefficient component $C_z$
are obtained at several Reynolds numbers near the expected transition. The mean value of
$C_z$
are obtained at several Reynolds numbers near the expected transition. The mean value of $C_z$
(
$C_z$
( $\langle C_z \rangle$
) is subtracted to isolate the fluctuating component (
$\langle C_z \rangle$
) is subtracted to isolate the fluctuating component ( $C_{z}^{\prime }$
) associated with the instability. The envelope
$C_{z}^{\prime }$
) associated with the instability. The envelope $A$
of the fluctuation amplitude is extracted, and its natural logarithm,
$A$
of the fluctuation amplitude is extracted, and its natural logarithm, $\ln(A)$
, is plotted as a function of time. During the early linear growth phase, characteristic of the initial stages of a Hopf bifurcation,
$\ln(A)$
, is plotted as a function of time. During the early linear growth phase, characteristic of the initial stages of a Hopf bifurcation, $\ln(A)$
exhibits a linear dependence on time, with the slope providing the temporal growth rate
$\ln(A)$
exhibits a linear dependence on time, with the slope providing the temporal growth rate $\sigma$
(figure 11
$\sigma$
(figure 11 $c$
). This growth rate is directly related to the instability of the base flow, as described by the Stuart–Landau model, which captures the evolution of weakly nonlinear oscillations near the bifurcation point (Thompson & Le Gal Reference Thompson and Le Gal2004). By repeating this procedure across different
$c$
). This growth rate is directly related to the instability of the base flow, as described by the Stuart–Landau model, which captures the evolution of weakly nonlinear oscillations near the bifurcation point (Thompson & Le Gal Reference Thompson and Le Gal2004). By repeating this procedure across different $\textit{Re}$
and plotting
$\textit{Re}$
and plotting $\sigma$
as a function of
$\sigma$
as a function of $\textit{Re}$
,
$\textit{Re}$
, $\textit{Re}_{c_2}$
is determined by interpolating the curve to find the point where
$\textit{Re}_{c_2}$
is determined by interpolating the curve to find the point where $\sigma =0$
(figure 11
$\sigma =0$
(figure 11 $d$
), marking the threshold of the Hopf bifurcation.
$d$
), marking the threshold of the Hopf bifurcation.
Numerical error and uncertainty due to finite grid size for the drag coefficient and Strouhal number.

Numerical error and uncertainty due to time step size for the drag coefficient and Strouhal number.

( $a$
) Time history of
$a$
) Time history of $C_z$
for
$C_z$
for $\textit{Re}=145$
and
$\textit{Re}=145$
and $Da=10^{-9}$
together with its mean value
$Da=10^{-9}$
together with its mean value $\langle C_z \rangle$
. (
$\langle C_z \rangle$
. ( $b$
) The fluctuation
$b$
) The fluctuation $C_z'$
and its envelope amplitude. (
$C_z'$
and its envelope amplitude. ( $c$
) Plot of
$c$
) Plot of $\ln (A)$
. (
$\ln (A)$
. ( $d$
) The linear growth rate as functions of
$d$
) The linear growth rate as functions of $\textit{Re}$
for
$\textit{Re}$
for $Da=10^{-9}$
.
$Da=10^{-9}$
.


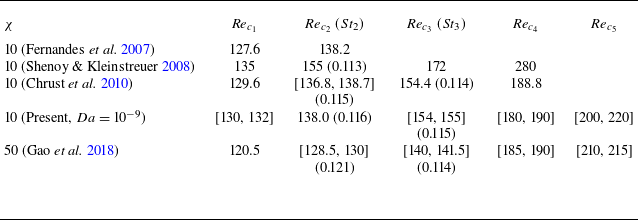


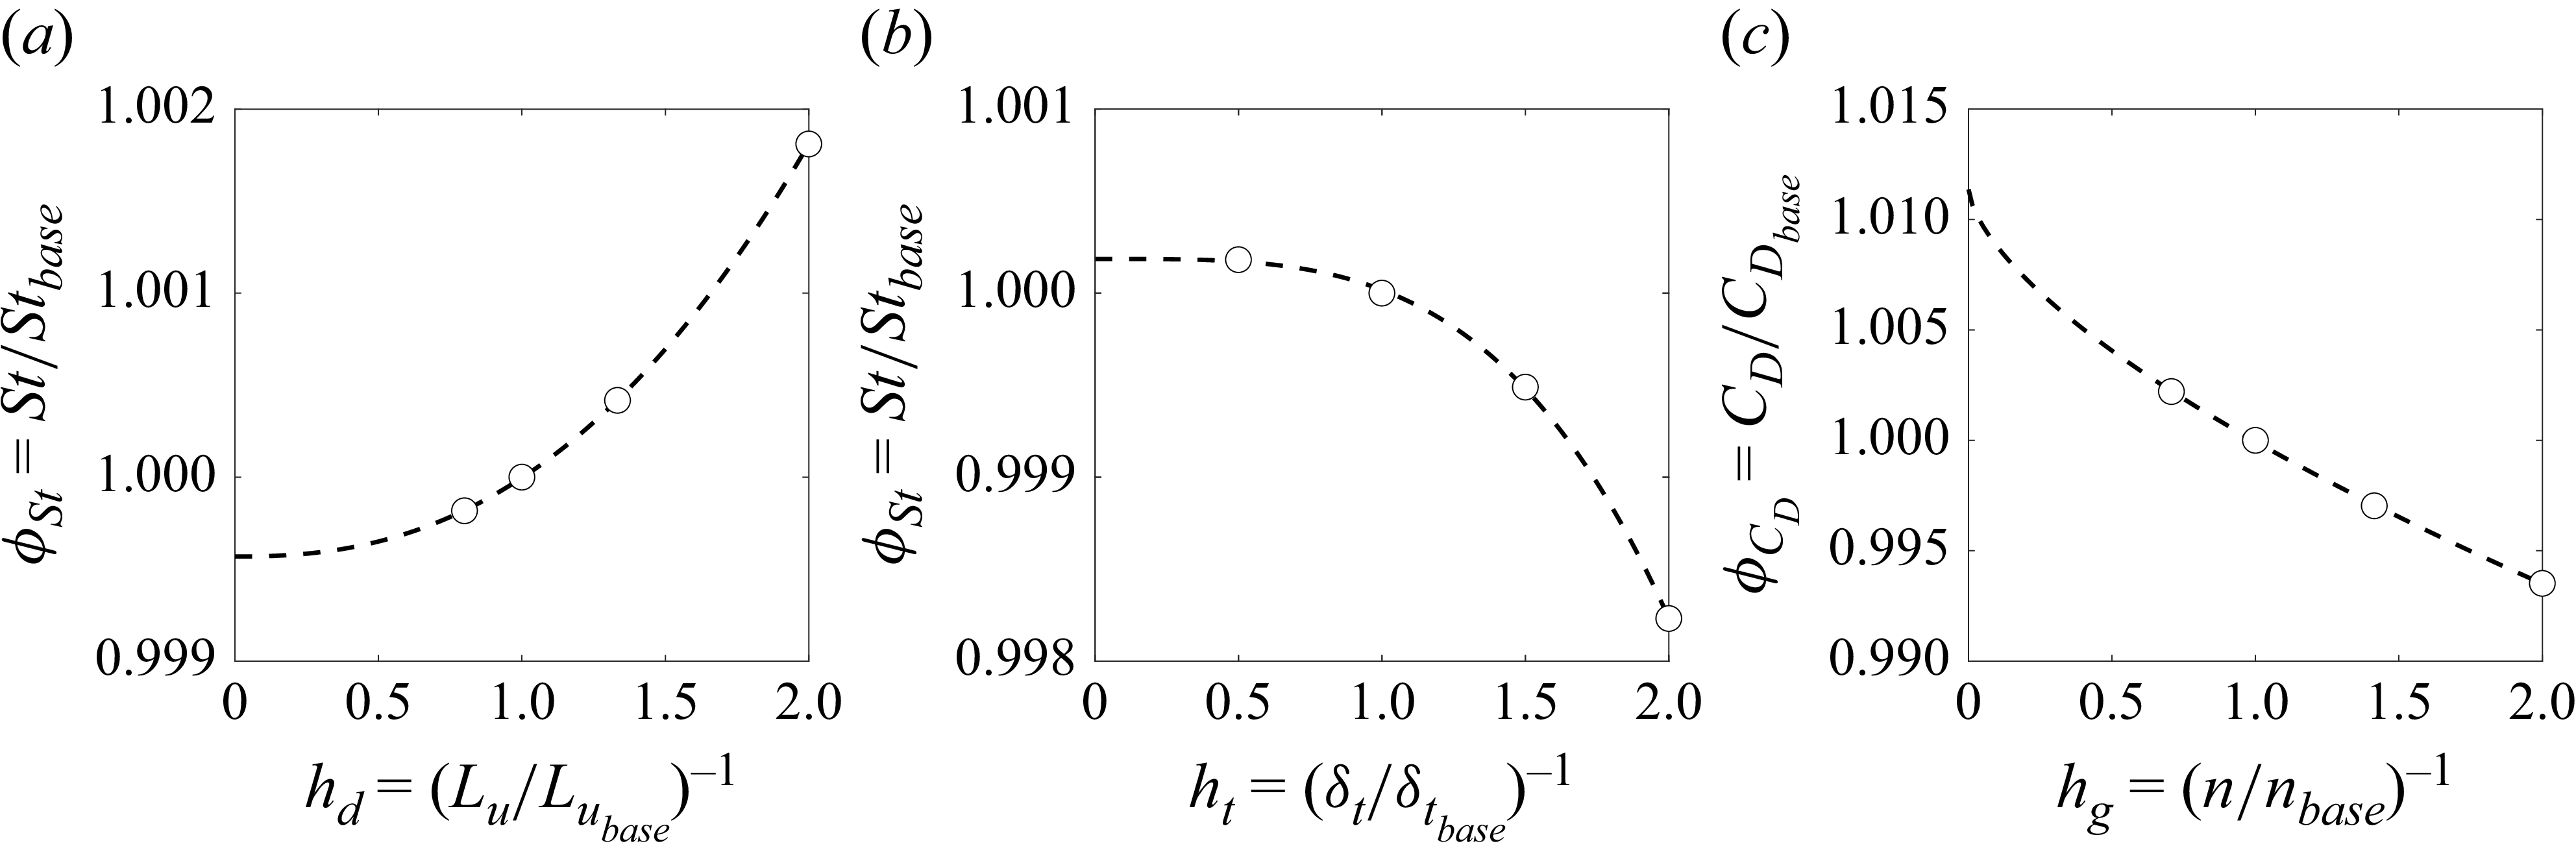


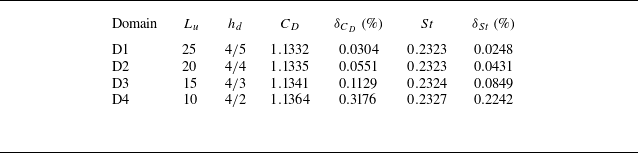
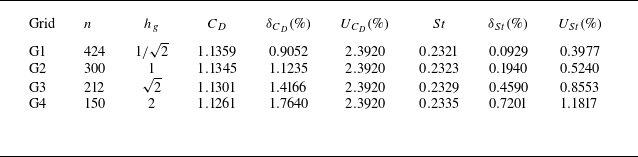
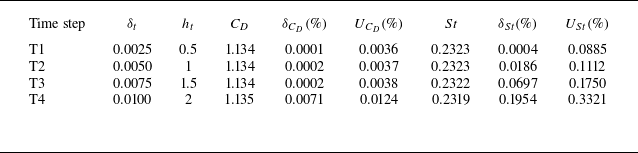


 Open access