


1. Introduction
The Himalayan region extends over eight countries across Asia (Afghanistan, Bangladesh, Bhutan, China, India, Myanmar, Nepal and Pakistan) and is home to the world’s largest ice volume outside the polar regions (Bolch, Reference Bolch2012). These are often called the ‘Water Tower of Asia’, emphasizing their immense importance as a freshwater resource (Immerzeel, Reference Immerzeel2020). The meltwater from Himalayan glaciers plays a crucial role in supporting hydropower generation, irrigation and the essential needs of the human population and natural ecosystems (Pritchard, Reference Pritchard2019; Immerzeel, Reference Immerzeel2020; Li, Reference Li2022). However, over the past few decades, these glaciers have experienced substantial mass loss (Kaab and others, Reference Kaab, Berthier, Nuth, Gardelle and Arnaud2012). Due to the high elevation and challenging terrain of the Himalayas, scientific studies in this region are limited, resulting in gaps in our understanding of various factors including atmospheric conditions, energy fluxes, glacier–atmosphere interaction and glacier dynamics (Mayewski and others, Reference Mayewski, Perry, Matthews and Birkel2020). In particular, calibration and validation of model studies are scarce and filling these knowledge gaps would reduce uncertainty in climate change projections.
The Himalayan region has complex climatic conditions due to the influences of the Indian Summer Monsoon (ISM) system and Western Disturbances (WD), which cause variability in meteorological conditions over the area (Bolch, Reference Bolch2012; Hock and others, Reference Hock and Pörtner2019; Azam, Reference Azam2021). In addition, the heterogeneous changes in glacier mass balance are driven primarily by mechanisms associated with altitude-dependent warming, surrounding topography, land–atmospheric interactions and seasonal to interannual variation in atmospheric circulations on a large or regional scale (Kulkarni, Reference Kulkarni2007; Pepin, Reference Pepin2022; Nair and others, Reference Nair, Usha and Suresh Babu2023). The higher temperature increases the fraction of solid to liquid precipitation and reduces accumulation (Wang and others, Reference Wang, Zhang, Wang, Sun and Li2013). Further, it intensifies the melt and lengthens the ablation season duration (Arndt and Schneider, Reference Arndt and Schneider2023). Rising snowlines expose more glacier ice, reducing surface albedo and leading to further melt through snow-albedo feedback (Bolch, Reference Bolch2012). Warming can also alter meltwater refreezing, retention, surface roughness and glacier flow dynamics (Sakai and Fujita, Reference Sakai and Fujita2017). All these processes interact to change glacier surface energy balance (SEB) and surface mass balance (SMB). Therefore, it is essential to understand the response of glaciers to atmospheric forcing using hydrometeorological observations and numerical models.
To adequately capture the full SEB and SMB, a distributed physically based model incorporating spatial variability in meteorological conditions and surface properties is required (Hock and Holmgren, Reference Hock and Holmgren2005). Ablation processes are governed by the SEB, consisting of radiative fluxes (net shortwave and longwave radiation), turbulent fluxes (latent and sensible heat), latent heat flux from rain and heat conduction into the snow/ice. The heterogeneity of glaciers and their surrounding topography creates significant spatial variability in meteorological variables, leading to complex patterns in energy and mass fluxes (Yu, Reference Yu2013; Brun, Reference Brun2019; Patel, Reference Patel2021). Physically based model studies have demonstrated the importance of implementing distributed approaches to capture the substantial variations in SMB across glaciers (Reijmer and others, Reference Reijmer, van den Broeke, Fettweis, Ettema and Stap2012). The Western Himalaya, particularly the Chandra Basin in the upper Indus Basin, is an important region for studying glaciers, as it contains several glaciers that are experiencing significant mass loss (Gardelle and others, Reference Gardelle, Berthier, Arnaud and Kaab2013; Vijay and Braun, Reference Vijay and Braun2016; Sharma and others, Reference Sharma, Patel, Singh, Meloth, Ravindra, Goel, Ravindra and Chattopadhyay2020; Patel, Reference Patel2021; Pratap, Reference Pratap2023). However, only a few studies from this region have high-resolution data focusing on the variability of meteorological parameters and energy fluxes, limiting our understanding of glacier–atmosphere interactions.
In this study, we have investigated and quantified the distributed SEB and SMB of the upper Chandra Basin glaciers for 7 hydrological years from 2015 to 2022 to understand how glacier SMB is affected by climatic (meteorological variability) and non-climatic (topographic characteristics) factors. In this study, we apply the COSIPY model (COupled Snowpack and Ice SEB and mass-balance model in PYthon) (Sauter and others, Reference Sauter, Arndt and Schneider2020) to simulate the SEB and SMB of selected glaciers. There are four automatic weather stations (AWS) located within the study area which are in close proximity to the glaciers, one AWS is situated on the glacier, while the other three are located within ∼3 km distance. The data obtained from these AWS are used to extrapolate the hourly meteorological variables across the glacier surface, combined with a resampled digital elevation model (DEM), to derive the spatial distribution of SEB and SMB. Furthermore, the model is calibrated using in situ point SMB measurements and then validated over Sutri Dhaka Glacier and Samudra Tapu Glacier. Sources of uncertainty related to meteorological forcing, model parameters and surface characteristics are quantified through Monte Carlo analysis. Furthermore, we analysed both climatic and non-climatic factors influencing the SMB of glaciers in the study region. The sensitivity of glacier SMB to climatic variations is crucial, and therefore, we conducted perturbation experiments to assess the impacts of changes in air temperature and precipitation.
2. Study area
The Chandra Basin is one of the major sub-basins of the Chenab River within the Indus River system, which is located in the central crystalline axis of the Pir Panjal range in Lahaul-Spiti, Himachal Pradesh, India (Fig. 1). The Chandra River originates from the southern slopes of the Baralacha Pass and flows for ∼125 km through the basin before joining the Bhaga River at Tandi (Fig. 1). The Chandra Basin covers a geographical area of 2446 km2. The elevation ranges from 2800 to 6592 m a.s.l. and the mean slope is ∼26°. It has 211 glaciers, covering an area of 631 km2 (∼26% of the total basin area) (Fig. 1). The basin is located within the transition zone between monsoon and arid climate and experiences the ISM during summer (July–September) and the Northern Hemisphere Mid Latitude WD during winter (December–April) (Bookhagen and Burbank, Reference Bookhagen and Burbank2010). However, ∼60–80% of the annual precipitation occurs during the winter mainly in the form of snowfall, whereas the remaining 20–40% falls during the summer monsoon season (Koul and Ganjoo, Reference Koul and Ganjoo2010; Oulkar, Reference Oulkar2022).
Location map (a) of the study region in the western Himalaya, (b) the Chandra Basin with selected glaciers (pink colour) and (c) elevation gradient of the selected glaciers. The red star represents automatic weather stations (AWS); Himansh Base Camp (HBC, 4052 m a.s.l.), Sutri Dhaka Glacier (SDG, 4864 m a.s.l.), Samudra Tapu Glacier (STG, 4513 m a.s.l.) and Baralacha Pass (BLP, 4904 m a.s.l.).

The Chandra Basin glaciers have large differences in size, surface characteristics and orientation/aspect (Fig. 1b). A significant variability in the SEB, particularly the net shortwave radiation within the basin, is caused by both non-climatic and climatic parameters (Patel, Reference Patel2021; Oulkar, Reference Oulkar2022). Therefore, we have categorized the glaciers in the upper Chandra Basin based on the orientation and size of the glaciers (Fig. 1c). The selected glaciers in the upper Chandra Basin are mostly oriented towards the northeast, south and southwest, which has been valuable for conducting orientation analysis. In contrast, the remaining glaciers exhibit substantial variation in orientation, and including these glaciers would have increased the computational time and complexity of the analysis. The selected glaciers cover an area of ∼298 km2, ∼47% of the total glacierized area of the Chandra Basin. In the present study, we have considered only those glaciers which cover an area ≥1 km2, a criterion employed to mitigate uncertainties and ensure a more precise examination of the glacier SEB and SMB. In addition, all these selected glaciers are debris-free glaciers and partially covered with debris over the lower ablation zone. Within the catchment of this study region, we have four AWS installed to monitor the hydrometeorological conditions (Fig. 1 and Fig. S1 in the Supplementary). One AWS is situated on the glacier, while the other three are located within a distance of 3 km. The study area covers 18 glaciers in the upper Chandra Basin which also include benchmark glaciers such as Samudra Tapu and Sutri Dhaka. We have in situ SMB measurements for Sutri Dhaka Glacier and Samudra Tapu Glacier from 2015 to 2022 (Fig. S3 in the Supplementary). These in situ observations are used to validate and estimate the uncertainty of modelled SMB. This will significantly strengthen the effectiveness of the SEB and SMB model simulation and offer a fast and efficient method to evaluate the model performance.
3. Data collection and methodology
3.1. Meteorological data
The locations and elevations of each AWS are provided in Figure S1 and Table S1. The AWS network includes various meteorological sensors connected to Campbell CR1000 and CR1000X data loggers stored within watertight enclosures. The sensor specifications, accuracy and meteorological variables are detailed in Table 1. The sensors collect data at intervals of 10 min, 30 min and daily, which are stored by the data logger and retrieved during field expeditions. The quality control checks applied to the AWS data include a range test to identify values outside acceptable ranges, an internal consistency test, a time series consistency test to detect sudden jumps or spikes in the data and a spatial consistency test, which involves cross-referencing data with nearby stations to ensure data consistency (Estévez and others, Reference Estévez, Gavilán and Giráldez2011). Additionally, outliers were identified using statistical analysis, such as detecting values beyond 3 SD from the mean (Estévez and others, Reference Estévez, Gavilán and Giráldez2011).
List of the AWS sensors and parameters used in the study

To estimate the SEB and SMB of the glaciers in the upper Chandra Basin, we used hourly meteorological data from the Himansh Base Camp (HBC) AWS located at 4052 m elevation. The HBC has the longest data from October 2015 to September 2022 with only minor data gaps owing to power cuts compared to other AWS (Table S1 in the Supplementary). To fill the data gap, we have used hourly data which has a spatial resolution of 0.1° × 0.1°, obtained from the European Centre for Medium-Range Weather Forecasts reanalysis (ERA5-land: https://cds.climate.copernicus.eu/cdsapp#!/dataset/reanalysis-era5-land?tab=overview) (Hersbach, Reference Hersbach2020) at the nearest surface grid points of HBC AWS using bias correction. The bias correction method involved fine-tuning the ERA5-l and reanalysis data using a linear regression model to align with the observed data from the HBC AWS (Maraun and Widmann, Reference Maraun and Widmann2018). We calculated the bias by comparing the reanalysis data with the observed data during overlapping periods and applied a correction factor based on the SD. This statistical adjustment ensured that the corrected data closely matched the characteristics of the observed data, improving the accuracy of the gap-filled data. Cloud cover over the study area is estimated using the method from Van den Broeke and others (Reference Van den Broeke, Reijmer, Van As and Boot2006). This method calculates cloud cover as a fraction between 0 and 1 based on net longwave radiation and air temperature measurements.
To simulate the SEB and SMB of the selected glaciers, we use a 100 m resolution DEM derived from the 30 m ASTER GDEM V2 dataset. The ASTER GDEM V2 data are obtained from the Earth Remote Sensing Data Analysis Centre (ERSDAC) (Tachikawa, Reference Tachikawa2011). The lapse rate/vertical gradient is highly sensitive to surface characteristics and local microclimate, and thus significant variations are expected in the extrapolated data. To ensure accurate distributed data, we have partitioned the selected upper Chandra Basin glaciers into four zones: CB1, CB2, CB3 and CB4 (Fig. S2 in the Supplementary). This division is based on the proximity of these zones to four installed AWS (HBC, STG-Samudra Tapu Glacier, SDG-Sutri Dhaka Glacier and BLP-Baralacha Pass) (Fig. S2 in the Supplementary). Meteorological data obtained from these AWS are utilized to estimate lapse rates for the corresponding zones, thereby representing the vertical gradients of air temperature and relative humidity (Table S1 in the Supplementary). Lapse rates are computed on a mean annual basis by regression of the AWS data against station elevation for the common observation period of AWS data. The lapse rates are then applied to extrapolate the point HBC AWS data to the entire DEM based on the elevation at each 100 m grid cell to obtain distributed SEB and SMB of the glaciers (Table 2). The precipitation and air pressure gradient data used in this analysis are obtained from previous study by Oulkar (Reference Oulkar2022). These distributed meteorological data are used as inputs to the SEB model to simulate hourly SMB for the 7 hydrological years.
Details of model parameters (altitudinal gradient/lapse rates) and extrapolation methods
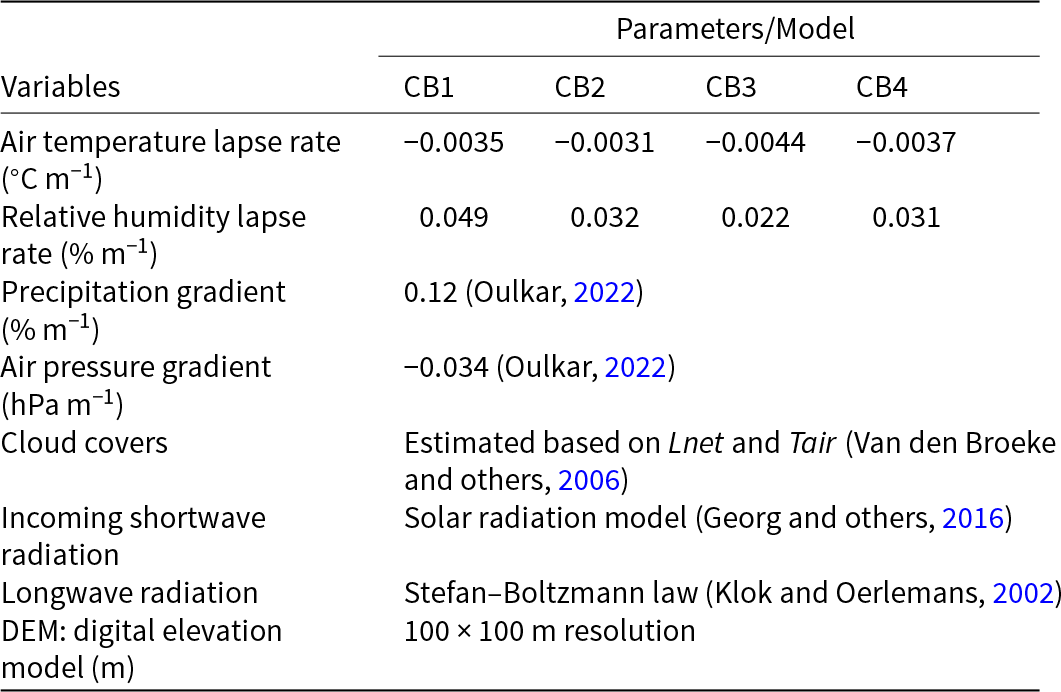
Details of CB1, CB2, CB3 and CB4 are given in Fig. S2 in the Supplementary. The air temperature and relative humidity lapse rates are computed for the common observation period from October 2020 to September 2022 using data from all AWS.
3.2. Methodology
We have used the COSIPY model, which is an open-source (https://github.com/cryotools/cosipy), physically based model that simulates the SEB, SMB and subsurface processes for glaciers (Sauter and others, Reference Sauter, Arndt and Schneider2020). The model is based on energy and mass conservation and estimates of SEB and SMB. It combines a SEB model with a multilayer snow and ice model to calculate energy fluxes, subsurface processes and SMB at a given resolution (Huintjes, Reference Huintjes2015; Sauter and others, Reference Sauter, Arndt and Schneider2020). For the present study, the model is forced with HBC AWS hourly observations of incoming shortwave radiation, incoming longwave radiation, air temperature, total precipitation, relative humidity, surface pressure, wind speed and cloud cover fraction during 2015–22.
3.2.1. SEB model
Hourly HBC AWS data and 100 m DEM are used for the COSIPY model to derive the spatial distribution of SEB and SMB of the upper Chandra Basin. The total surface energy flux (Wm−2) at the glacier surface is calculated within the COSIPY model at each time step (hourly) for each grid based on the principle of energy conservation (Oerlemans, Reference Oerlemans2001):
 \begin{equation}Q = {\text{ }}{S_{\text{in}}}\left( {1 - \alpha } \right) + {L_{{\text{in}}}} + {L_{{\text{out}}}} + {H_{{\text{se}}}} + {H_{{\text{la}}}} + {Q_{\text{G}}}\end{equation}
 where  $Q$ is the total energy available for melt, ${S_{{\text{in}}}}$ is the incoming shortwave radiation, $\alpha $ is the surface albedo, ${L_{\text{in}}}$ is the incoming longwave radiation, ${L_{\text{out}}}$ is the outgoing longwave radiation, ${H_{\text{se}}}$ is the turbulent sensible heat flux, ${H_{\text{la}}}$ is the turbulent latent heat flux and ${Q_{\text{G}}}$ is the ground heat flux. The heat flux resulting from liquid precipitation has a negligible effect; therefore, it is not considered in the model (Huintjes, Reference Huintjes2015; Sauter and others, Reference Sauter, Arndt and Schneider2020; Oulkar, Reference Oulkar2022). The sign convention for the energy flux terms is that the positive values represent an energy gain from the surface, while negative values represent an energy loss from the surface. Here, $Q$ is determined through an iteration using a Newton–Raphson optimization scheme to solve the SEB equation (Sauter and others, Reference Sauter, Arndt and Schneider2020). The surface temperature is the primary variable associated with the energy fluxes. If the resultant surface temperature exceeds 0°C, the excess energy is available for melt ( $Q$ > 0) and the surface temperature is reset to 0°C.
The  ${S_{\text{in}}}$ is modelled using the approach of Georg and others (Reference Georg, Albin, Georg, Katharina, Enrico and Peng2016) which accounts for the effects of topographic shading, slope and aspect on the solar radiation received at the glacier surface. The decrease of ${S_{\text{in}}}$ through the snowpack is computed using an exponential extinction function based on depth, with separate coefficients for snow and ice (Sauter and others, Reference Sauter, Arndt and Schneider2020). The surface $\alpha $ is calculated as a function of snowfall, snow depth, snow age and ice albedo following Oerlemans and Knap (Reference Oerlemans and Knap1998). The albedo decreases exponentially from fresh snow to firn albedo over a period of 6 days (Huintjes, Reference Huintjes2015; Sauter and others, Reference Sauter, Arndt and Schneider2020). The surface albedo parameters in our model are set based on the values determined by Molg and Scherer (Reference Molg and Scherer2012). The Stefan–Boltzmann law is used to estimate the modelled $L_{\text{out}}$ (Klok and Oerlemans, Reference Klok and Oerlemans2002). The turbulent heat fluxes (sensible and latent) are computed using the bulk aerodynamic method with stability corrections, based on measurements of air temperature, humidity and wind speed at 2 m above the surface (Oerlemans, Reference Oerlemans2001). Stability corrections for stratification are included based on the bulk Richardson number. The surface roughness length for momentum, heat and moisture transfer evolve from fresh snow to ice values based on time or snow depth (Sauter and others, Reference Sauter, Arndt and Schneider2020). The $Q_{\text{G}}$ is comprised of heat conduction fluxes combined with fluxes from the portion of shortwave radiation that penetrates the snowpack/ice.
The values of site-specific parameters within the model are taken from previous studies (Klok and Oerlemans, Reference Klok and Oerlemans2002; Huintjes, Reference Huintjes2015; Oulkar, Reference Oulkar2022) for SEB and SMB simulations at the upper Chandra Basin glaciers. The air temperature and relative humidity lapse rates are estimated within the present study, while precipitation and air pressure gradients are adopted from Oulkar (Reference Oulkar2022) (Table 2). Further, the subsurface density profile is initialized on 1 October with constant densities of 870 kg m−3 for glacier ice and 490 kg m−3 for snow, based on values used in previous studies (Oulkar, Reference Oulkar2022; Pratap and others, Reference Pratap, Sharma, Patel, Singh, Gaddam, Oulkar and Thamban2019).
3.2.2. SMB model
The SMB is estimated as follows:
 \begin{equation}{\text{SMB}} = {\text{Ab}} + {\text{Ac}} + {\text{Aci}} + {\text{Abi}}\end{equation}
where Ab is the surface ablation from melt and sublimation, Ac is an accumulation from snowfall and deposition, Aci is the internal accumulation from refreezing and Abi is the internal ablation from subsurface melt. Solid precipitation (snowfall) contributes directly to accumulation. Liquid precipitation (rainfall) and meltwater percolate through the snowpack following a tipping bucket approach based on the liquid water holding capacity (Sauter and others, Reference Sauter, Arndt and Schneider2020). Refreezing occurs when snow temperature is below 0°C and liquid water is present from rainfall or melt. Excess meltwater that reaches the bottom of the snowpack contributes to runoff. The model uses a dynamic mesh with variable layering to represent the vertical profile of snow and ice properties, including temperature, density, liquid water content and ice fraction (Sauter and others, Reference Sauter, Arndt and Schneider2020). Layer thickness adapts over time, with thinner layers near the surface and increasing thickness with depth. For more information, the COSIPY model is described in detail by Sauter and others (Reference Sauter, Arndt and Schneider2020), including the parametrizations, underlying physical principles, model structure and optimization approach.
3.2.3. Model uncertainty assessment
The uncertainty in the model output comes from different sources, such as measurements of meteorological variables, uncertainty of energy fluxes, model parameters, threshold values, etc. Therefore, to assess model uncertainty, we perform 500 Monte Carlo simulations varying model parameters and thresholds by 10% and meteorological inputs within measurement uncertainty ranges, following van der Veen (Reference van der Veen2002) and Machguth and others (Reference Machguth, Purves, Oerlemans, Hoelzle and Paul2008). Model uncertainty is quantified by running the repeated simulations at all observed point locations on Samudra Tapu Glacier and Sutri Dhaka Glacier (Fig. S3 in the Supplementary). The mean SMB of 500 Monte Carlo simulations is within the uncertainty range of the corresponding in situ values. Based on the results of the 500 simulations compared against the observed SMB, there is a well match between the uncertainty range and observed SMB (Fig. S4 in the Supplementary). This uncertainty range is determined by calculating the SD of the SMB results. The SD captures the spread in SMB estimates from the 500 simulations. With a normal distribution of results, ∼68% of simulations are within ±1σ. Therefore, the ±25% uncertainty range represents ∼±1σ of the SMB results from the simulations.
4. Results and discussion
4.1. Climatic setting
Figure 2 shows the observed daily mean values of air temperature, surface temperature, relative humidity, wind speed, cloud cover, air pressure, incoming shortwave and incoming longwave radiation over the upper Chandra Basin glaciers for the study period from October 2015 to September 2022. These meteorological variables show substantial temporal variation and distinct patterns over the study period. The daily mean air temperature ranges from −25.48°C to 15.67°C with a mean annual value of 1.67°C (Fig. 2a). The daily mean relative humidity ranges from 16% to 99%, with a mean annual value of 60% (Fig. 2b). The daily mean wind speed ranges from 0 to 9.84 m s−1 with a mean annual value of 4.57 m s−1 (Fig. 2c). The daily mean incoming shortwave radiation ranges from 37 to 400 Wm−2 with a mean annual value of 237 Wm−2 (Fig. 2d). The incoming longwave radiation ranges from 139 to 344 Wm−2 with a mean annual value of 243 Wm−2 (Fig. 2e). The daily mean pressure ranges from 597 to 636 hPa (Fig. 2f). The cloud cover shows strong monthly variation (Fig. 2g). This significant variability in meteorological variables can be attributed to the semi-arid climate conditions prevailing in the area (Bookhagen and Burbank, Reference Bookhagen and Burbank2010). During the summer, warm and humid air is brought into the region, causing temperatures to rise (Oulkar, Reference Oulkar2022). Consequently, the higher humidity levels also contribute to the warmer climate during this period. In contrast, during the winter, the monsoon winds subside, and the WB becomes active, leading to a drop in temperatures and an increase in cloud cover (Fig. 2a, g). The combined influence of these factors results in the observed variations in the Chandra Basin climate. The variation of temperatures, radiations, wind and moisture throughout the year can affect the ablation and accumulation rates of the glaciers, leading to changes in their overall SMB.
Observed daily mean values of (a) air temperature ( ${T_{air}}$, °C), (b) relative humidity (RH, %), (c) wind speed (m s−1), (d) incoming shortwave radiation ( $S{W_{in}}$, Wm−2), (e) incoming longwave radiation ( $L{W_{in}}$, Wm−2), (f) pressure (hPa), and (g) cloud cover over the Chandra Basin glaciers at the site HBC AWS for study period from October 2015 to September 2022.

4.2. Distributed surface energy fluxes
The distributed energy fluxes over 7 hydrological years (2015–22), including mean net shortwave ( $S{W_{\text{net}}}$) and longwave ( $L{W_{\text{net}}}$) radiation, mean turbulent heat fluxes ( ${H_{\text{se}}}$ and ${H_{\text{la}}}$) and mean ground heat flux ( ${Q_{\text{g}}}$), are shown in Fig. 3. The mean $S{W_{\text{net}}}$ ranges from 30 to 130 Wm−2 (Fig. 3a) and varies with altitude. Specifically, the $S{W_{\text{net}}}$ values decrease with increasing altitude, primarily due to the higher albedo over the accumulation zone. The $S{W_{\text{net}}}$ is the largest energy source, with higher values in the ablation zone compared to the accumulation zone. This reflects the lower albedo and greater absorbed solar radiation at lower elevations. $S{W_{\text{net}}}$ shows strong seasonal variation, with peak value during the ablation season when incoming solar radiation is at a maximum. The mean $L{W_{\text{net}}}$ varied from −106 to −84 Wm−2 and decreased with the altitude (Fig. 3b). This variation can be attributed to the influence of temperature and relative humidity as a function of altitude (Oulkar, Reference Oulkar2022). The $L{W_{\text{net}}}$ is negative across the region, indicating radiative cooling. More negative values are found at higher altitudes, likely due to colder temperatures. The turbulent heat flux ${H_{{\text{se}}}}$ (0–38 Wm−2) and ${H_{\text{la}}}$ (−78 to −21 Wm−2) shows strong spatial variation (Fig. 3c, d). The turbulent heat fluxes of ${H_{\text{se}}}$ and ${H_{\text{la}}}$, shows maximum values at lower elevations due to the presence of large gradients in surface temperature and water vapour pressure. As altitude increases, the turbulent heat fluxes decrease (Fig. 3c, d). The magnitude of ${Q_{\text{g}}}$ heat flux is small compared to the other energy components and varied from −44 to −7 Wm−2 (Fig. 3e).
Distributed mean surface energy fluxes for the glaciers of the upper Chandra Basin for the period from October 2015 to September 2022. (a)  $S{W_{\text{net}}}$ is net shortwave radiation (Wm−2), (b) $L{W_{\text{net}}}$ is net longwave radiation (Wm−2), (c) ${H_{\text{se}}}$ is sensible heat flux (Wm−2), (d) ${H_{\text{la}}}$ is latent heat flux (Wm−2), (e) ${Q_{\text{g}}}$ is ground heat flux (Wm−2) and (f) annual contribution of each energy flux in percentage.

The surface energy flux components show a strong seasonality, with net shortwave and longwave radiation being the dominant energy flux in the ablation season (May–September). In contrast, sensible and latent heat flux dominate in the accumulation season (October–April). The annual energy flux analysis showed that the net shortwave radiation contributed 58% to the total surface energy fluxes, followed by net longwave radiation at 25%, sensible heat at 8%, latent heat at 6% and ground heat flux at 3% (Fig. 3f). These observations are consistent with previous studies on Himalayan glaciers in this region (Azam, Reference Azam2014b; Patel, Reference Patel2021; Oulkar, Reference Oulkar2022). Also, the altitude dependence and seasonal variations match previous observations on high mountain glaciers (Nair and others, Reference Nair, Usha and Suresh Babu2023).
4.3. Mass balance
4.3.1. Mean mass balance
Figure 4 shows the changes in the SMB of the upper Chandra Basin over 7 hydrological years from 2015 to 2022. The annual SMB ranges from −0.89 to 0.10 m w.e., indicating an overall trend of negative SMB. The estimated mean SMB of upper Chandra Basin glaciers is −0.51 ± 0.28 m w.e. a−1 with a cumulative mass balance of −3.54 m w.e. during the last 7 years. Overall, the modelled mean SMB for 7 hydrological years is consistent with the SMB reported by various studies within the Chandra Basin (Table 3). However, a positive SMB is observed for the hydrological year 2018/19. This could be attributed to higher accumulation driven by an extreme snowfall event in 2018 that covered most of the Lahaul–Spiti district (Pratap, Reference Pratap2023). However, this does not change the overall trend of glacier mass balance, driven by long-term climate change. The modelled result agrees with the general trend of decreasing SMB over time, indicating that the upper Chandra Basin is experiencing glacier mass loss.
Mean annual mass balance of upper Chandra Basin for 7 hydrological years from October 2015 to September 2022. The red bar is modelled mean mass balance for 7 years, the purple box is previously studied mean mass balance within Chandra Basin (Table 3), and the red line shows the cumulative mass balance.

Various methods of mean mass balance for Chandra Basin glaciers
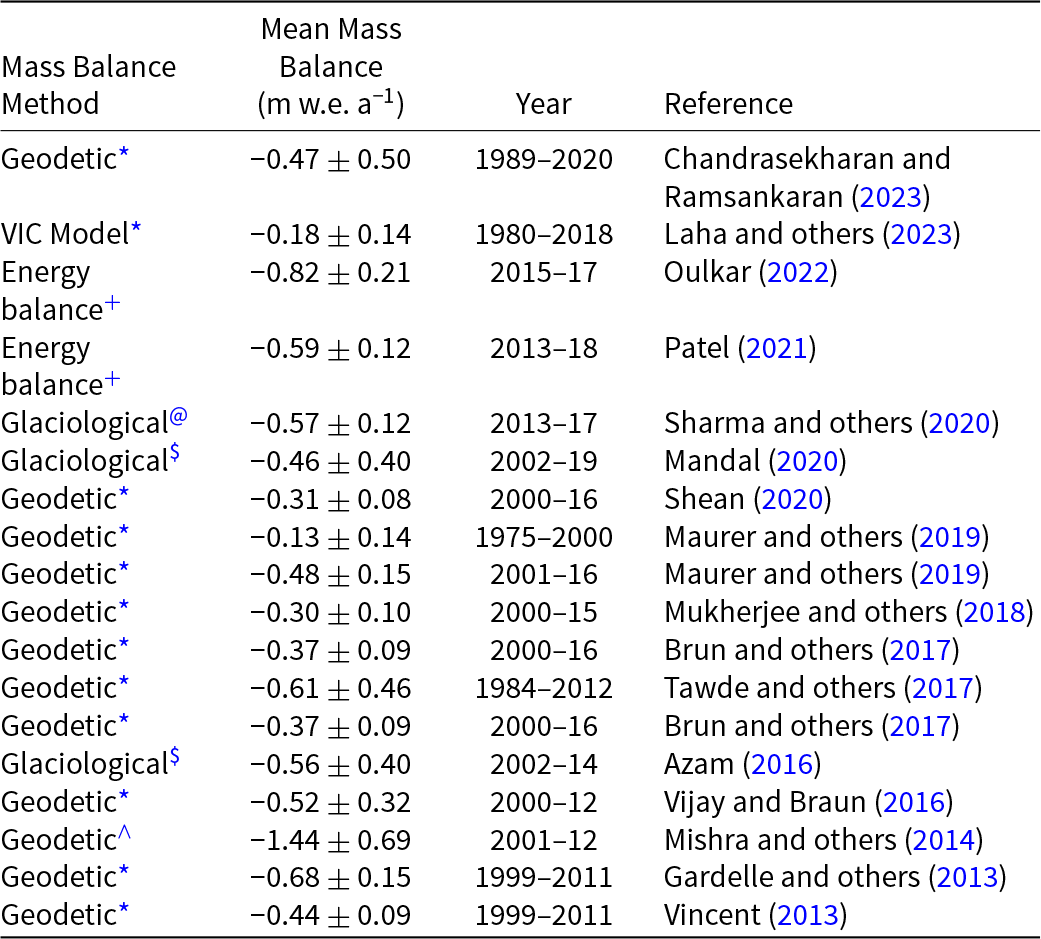
Region:
* Chandra Basin, +Sutri Dhaka, #Eight glaciers, @Five glaciers, $Chhota Shigri, ^Hampta.
4.3.2. Distributed mass balance
Figure 5 highlights the variability of glacier SMB across upper Chandra Basin and shows the glaciers experiencing mass loss in the ablation zone. This study shows spatial variability in SMB, with lower values in the high-elevation areas of the glaciers and higher values in the lower elevation. This spatial variability can be attributed to several factors, including differences in glacier geometry, aspect and shading effects (Yu, Reference Yu2013; Brun, Reference Brun2019; Olson and Rupper, Reference Olson and Rupper2019; Kumar, Reference Kumar2021; Wang, Reference Wang2022). Along with meteorological parameters, other variables like precipitation distribution, snowdrift effect, albedo differences and streamflow can also contribute to the spatial SMB variability (Yang, Reference Yang2013; Brun, Reference Brun2015).
(a) Digital elevation model (DEM) and (b) distributed mean surface mass balance for the glaciers of the upper Chandra Basin for the period from October 2015 to September 2022. The yellow line indicates the equilibrium line altitude (ELA).

4.4. Non-climatic parameters and mass-balance spatial variability
The upper Chandra Basin has varying topography, including differences in elevation, size, aspect, orientation and slope, as detailed in Table S2. Higher elevations (>5500 m a.s.l.) have lower temperatures, humidity, air pressure and different precipitation patterns (Bhattacharya, Reference Bhattacharya2023). This leads to more positive or balanced SMB at and above median elevations but increasing negative SMB at lower elevations (Fig. 5a and Table S2 in the Supplementary). For example, glaciers in the study area lost 31% of its SMB within the 4700–5400 m a.s.l. elevation range and remaining SMB loss over lower elevation. Furthermore, higher elevations receive more solid precipitation due to colder temperatures, resulting in more accumulation (Bhattacharya, Reference Bhattacharya2023). However, meteorological conditions can vary at different elevations at particular seasons, such as the onset or end of summer when snowfall may occur in upper accumulation zones while melt continues in lower ablation zones (Cuffey and Paterson, Reference Cuffey and Paterson2010). The size and shape of a glacier influence its SMB by affecting accumulation and ablation patterns. For example, the larger Samudra Tapu Glacier had a more negative SMB compared to a smaller glacier (Fig. 5b). Figure 5 depicts that the glaciers with more extensive area coverage at higher elevations are likely to accumulate more mass from solid precipitation, while glaciers with greater area at lower elevations may experience higher ablation rates due to warmer temperatures (Racoviteanu and others, Reference Racoviteanu, Arnaud, Williams and Manley2015).
Furthermore, our results indicate that southeast, south, southwest and west-facing aspects correspond to the zones with the highest average rates of ablation in the study area (Figs. 5b and 6a). This is likely due to the effects of topographic shading on spatial variability in SMB. Glaciers on northeast-facing slopes receive less direct solar radiation, and experience reduced ablation compared to southwest-facing glaciers (Figs. 5b and 6a), which is consistent with findings by Olson and Rupper (Reference Olson and Rupper2019). Mountain shadows can partially cover glaciers, limiting sunlight exposure and reducing melting, which is in agreement with previous studies (Klok and Oerlemans, Reference Klok and Oerlemans2002; Wang, Reference Wang2022). Topographic shading directly alters the radiation budget at the glacier surface by obstructing incoming solar radiation (Olson and Rupper, Reference Olson and Rupper2019; Wang, Reference Wang2022; Zhang and others, Reference Zhang, Li, Chang, Luo, Wang and Cheng2024). Our results indicate that topographic shading plays a crucial role in controlling SEB and SMB estimates.
The upper Chandra Basin map showing (a) aspect, (b) slope.

The slope of selected glaciers in the upper Chandra Basin ranges from 1° to 57° with a mean of 15° (Fig. 6b and Table S2 in the Supplementary). However, the majority of the glacier area in the study region has a gentle slope of 12–20° (Fig. 6b and Table S2 in the Supplementary). These moderate-slope zones, comprising most of the glacier area, experience the highest melting rates, agreeing with other findings (Fischer and others, Reference Fischer, Huss and Hoelzle2015; Rabatel and others, Reference Rabatel, Dedieu and Vincent2016; Kumar, Reference Kumar2021). In the lower ablation zone of a glacier, the slope is gentle, resulting in a low-temperature gradient in most parts of the Himalaya (Zhang and others, Reference Zhang, Gu, Hu, Xu and Zhao2022). Consequently, this area experiences higher rates of melting. In contrast, the accumulation zone of the glacier has a steeper slope, leading to a higher temperature gradient and lower rates of melting across the High Mountain Asia glaciers (Zhang and others, Reference Zhang, Gu, Hu, Xu and Zhao2022). The steep slopes in upper accumulation zones are less susceptible to regional mass loss (Fischer and others, Reference Fischer, Huss and Hoelzle2015; Rabatel and others, Reference Rabatel, Dedieu and Vincent2016; Davaze and others, Reference Davaze, Rabatel, Dufour, Hugonnet and Arnaud2020; Kumar, Reference Kumar2021). More gentle slopes correlate with more negative SMB over lower ablation zones, as also reported by Davaze and others (Reference Davaze, Rabatel, Dufour, Hugonnet and Arnaud2020) for glaciers in the European Alps.
We find that the aspect, slope, size and elevation of the glacier contribute towards the spatial variability of SMB within the study region, consistent with previous studies that have examined the complex relationship between topography and glacier melt dynamics.
4.5. Glaciers mass-balance sensitivity to climatic conditions
Variations in air temperature and precipitation play pivotal roles in driving glacier SMB changes, as explored through simulations conducted to investigate their impact on the SMB of the Sutri Dhaka Glacier (Oulkar, Reference Oulkar2022). Therefore, to evaluate the climate sensitivity of the upper Chandra Basin glacier SMB, perturbation experiments of air temperature and precipitation are performed. During these simulations, other pertinent variables (incoming shortwave radiation, incoming longwave radiation, relative humidity, surface pressure, wind speed and cloud cover) remained constant. Additionally, a coupled parameter perturbation approach is employed, wherein alterations in both air temperature and precipitation are simultaneously introduced as forcings to the model. This approach mainly sought to address the extent to which changes in precipitation could compensate for the additional loss of glacier mass attributed to a 1°C increase in air temperature.
To simulate temperature variations, we changed the air temperature by a step of 0.5°C from −2°C to +2°C while keeping other input parameters constant (Fig. 7). The results show that a temperature increase of 1°C led to a 64% reduction in the total SMB (an increase in mass loss from mean SMB). In contrast, a temperature decrease of 1°C resulted in a 51% increase in the SMB (a decrease in mass loss) (Fig. 7). Moreover, when the temperature is increased by 2°C, the total SMB decreases by 136%. In contrast, a temperature decrease of 2°C led to a 90% increase in the total SMB. Similarly, we conducted the simulations to explore the effects of precipitation changes using eight scenarios, where the precipitation is adjusted in 10% increments from −40% to +40%. Increasing the precipitation by 20% resulted in a 32% increase in the total SMB, while a 20% decrease led to a 25% reduction in the total SMB. Notably, at a 40% increase in precipitation, the total SMB exhibited a slightly less negative equivalent to a 60% increase in glacier SMB.
Sensitivity of mass balance in the upper Chandra Basin glaciers to air temperature and precipitation changes.

Further, the temperature and precipitation have different elevation gradient, indicating that temperature and precipitation have different effects on glacier SMB (Fig. 7). Notably, augmenting precipitation yields a slightly positive effect compared to reducing precipitation (Fig. 7). Across the upper Chandra Basin, the mass-balance sensitivity for air temperature and precipitation change is −0.29 m w.e. a−1 °C−1 and 0.14 m w.e. a−1 (10%)−1, respectively. However, the impact of temperature changes on glacier SMB is more pronounced than that of precipitation changes, as the temperature shows a steeper gradient in comparison to the precipitation (Fig. 7). This is consistent with the findings of previous studies that have shown that temperature is the dominant factor controlling glacier SMB globally (Azam, Reference Azam2018; Singh and others, Reference Singh, Kumar and Dimri2018; Fugger, Reference Fugger2022). However, precipitation can still influence glacier SMB by affecting the amount and type of precipitation, snowpack density, albedo and run-off. Furthermore, it is observed that higher air temperatures accelerated the rate of glacier mass loss, while the compensatory effect of increased precipitation for change in glacier SMB is gradually limited (Fig. 7). Our findings reveal that a 42% increase in precipitation is necessary to counteract the additional mass loss resulting from a 1°C increase in air temperature for the upper Chandra Basin glaciers.
5. Conclusions
We investigated the distributed SEB and SMB of glaciers in the upper Chandra Basin of the western Himalaya, using a physically based COSIPY model, to estimate energy fluxes and SMB for the Chandra Basin glaciers for 7 hydrological years from 2015 to 2022. Meteorological data from HBC AWS and bias-corrected ERA5 data are employed as input for the model, and the parameters are calibrated using in situ observations. The study addressed uncertainties inherent in the modelling processes through a Monte Carlo simulation approach. The study highlighted the strong seasonality of energy fluxes, with net radiation being the dominant energy flux during summer months, while sensible and latent heat fluxes dominated in the winter. The results also revealed the spatial variability in energy fluxes and SMB across the glaciers within the upper Chandra Basin, highlighting the additional influence of factors like glacier geometry, shading effects, local topography and orientations/aspects. The estimated SMB of the upper Chandra Basin glaciers indicated an overall negative mean annual SMB of −0.51 ± 0.28 m w.e. a−1 over the 7 year period. This underscored the impact of climate change on glacier mass loss in the region. Our study demonstrated that the glacier SMB is highly sensitive to changes in air temperature and precipitation, with even small temperature variations causing significant shifts in the SMB. The findings reveal that a 42% increase in precipitation is necessary to counteract the additional mass loss resulting from a 1°C increase in air temperature in the region. The comparison of model results with other SMB studies indicated consistency with the model output and validated the accuracy of the model employed. Our study offers a well-constrained distributed energy and mass balance of glaciers in the upper Chandra Basin and can be used to better understand the impacts of climate variability on the SMB of Himalayan glaciers.
Supplementary material
The supplementary material for this article can be found at 10.1017/aog.2024.46.
Data availability statement
The data used in this analysis are freely available at the National Centre for Polar and Ocean Research (NCPOR) data repository. Himansh Base Camp (HBC) AWS data is available at https://data.ncpor.res.in/static/datasets/him/1_himansh_station_aws_4052.xlsx and point mass balance for Sutri Dhaka and Samudra Tapu Glacier is available at https://data.ncpor.res.in/static/datasets/him/2_Glaciological_Mass_Balance_2015_22.xlsx.
Acknowledgements
We are thankful to National Centre for Polar and Ocean Research (NCPOR) for supporting the research at NCPOR. We are thankful to our field support team who were involved in our field trips. This is NCPOR contribution number J-43/2024-25.
Author contributions
SNO, PS and MT defined the objectives and designed the study. SNO, PS, BP, LKP and ATS collected the automatic weather station and in situ mass-balance data. SNO conducted an analysis and wrote the article, with contributions from PS, SL, BP and MT. All authors contributed to the discussion of the article.
Funding statement
We thank the Ministry of Earth Sciences for financial support through the project “PACER—Cryosphere and Climate.”
Competing interests
The authors declare no competing interests.


 Open access