


INTRODUCTION
The current modifications in the Arctic due to climate change are strongly impacting the precipitation and freezing regimes (Granskog and others, Reference Granskog2017). The sea-ice extent is decreasing (Meier and others, Reference Meier2014; Perovich and others, Reference Perovich2016) and sea ice is also getting overall thinner (Giles and others, Reference Giles, Laxon and Ridout2008; Kwok and Cunningham, Reference Kwok and Cunningham2015; Lindsay and Schweiger, Reference Lindsay and Schweiger2015). The increase of snowfall (Bintanja and Selten, Reference Bintanja and Selten2014) can be expected to prevent the early growth of sea ice, limiting energy transfer from the ocean (Massom and others, Reference Massom2001). Related to both atmospheric and oceanic forcing, sea ice represents a good indicator of climate variability.
In situ fieldwork required to monitor these changes Arctic-wide is extremely challenging, expensive and may appear impossible to achieve. In this context, satellite remote sensing represents a great alternative to fieldwork, offering dense coverage, high temporal resolution and independence from local conditions. In particular, polarimetric synthetic aperture radar (SAR) has already demonstrated its potential in retrieving information on sea-ice conditions (Nghiem and Bertoia, Reference Nghiem and Bertoia2001; Isleifson and others, Reference Isleifson, Hwang, Barber, Scharien and Shafai2010; Moen and others, Reference Moen2013; Fors and others, Reference Fors, Brekke, Gerland, Doulgeris and Beckers2016; Ressel and others, Reference Ressel, Singha, Lehner, Rösel and Spreen2016; Johansson and others, Reference Johansson2017). Although remote sensing provides promising results, fieldwork remains mandatory for the calibration and the validation of the data acquired by airborne and spaceborne sensors.
This study investigates the potential offered by hand-held GPS devices as a tool for the validation of the remote sensing of fjord ice in Kongsfjorden, Svalbard. Hand-held GPS devices offer a cheap, light and easy-to-deploy solution for mapping fjord ice features. The accuracy of these devices is constantly improving and already presents a satisfactory accuracy for the purpose of the study.
The positioning precision advertised by the manufacturer is better than 15 m for older devices (Garmin, 2006) and better than 10 m (Garmin, 2011) for the more recent models. Zandbergen and Barbeau (Reference Zandbergen and Barbeau2011) demonstrated that such precision can also be achieved with simple smartphone GPS, and dedicated hand-held devices reach higher precision (down to 5 m).
Kongsfjorden appears to be an appropriate site for fjord ice studies. Since 2003, the Norwegian Polar Institute (NPI) has carried out annual monitoring of the ice extent and ice thickness in the fjord (Gerland and Renner, Reference Gerland and Renner2007). Therefore, the area is now well documented. In addition, the research base Sverdrup station of NPI in Ny Ålesund, located on the southern shore of the fjord, provides all logistic needs for running fieldwork campaigns.
DATA AND METHODS
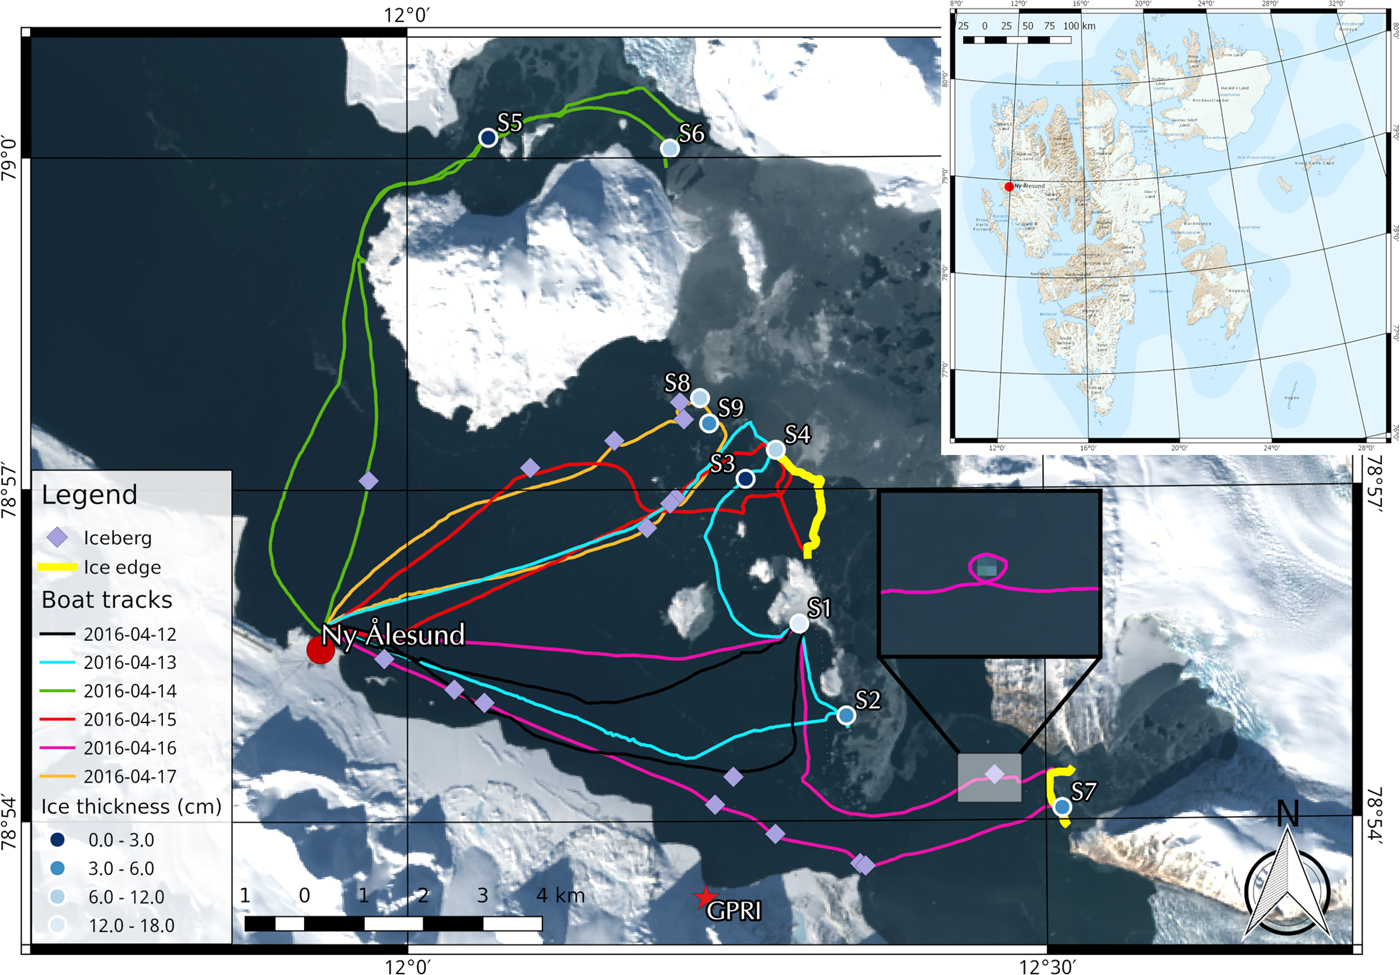
The data presented in this study have been collected during the annual fjord ice monitoring campaign of NPI in Kongsfjorden, Svalbard (11–18 April 2016). During this campaign, the sea-ice team has been out in the field 6 days (from the 12–17 April) and performed measurements at nine different ice stations, with revisits of station S1 and S4 (Fig. 1). During this period, remote-sensing data have also been acquired by a ground-based radar, and satellite radar scenes have been ordered.
Satellite map of Kongsfjorden with the boat tracks and the ice stations. The dots representing the different ice stations are coloured according to the ice thickness measured (from dark blue for the thinnest to white for the thickest). The figure also presents the 17 icebergs located using the GPS tracks (purple diamonds), the ice edges (yellow lines) and the ground-based radar (GPRI) position (red star). The zoom box presents an iceberg circled with the boat track and visible in the Landsat 8 scene. Background: USGS/NASA Landsat 8 (16 April 2016)
In situ data
The sea-ice situation in Kongsfjorden during the time of the campaign was dominated by thin young ice. Slightly thicker fast ice could be found around the Lovén Islands (ice station S1, Fig. 1). This ice was covered with a thin layer of snow (between 1 and 2 cm). The snow was very salty (salinity 37.7, to be compared with the local surface sea water salinity 33.9). The ice thickness, as measured during the ice stations from coring and thickness drillings boreholes, ranges from 1.8 to 18.5 cm. Table 1 presents the average values of ice thickness, freeboard and snow thickness for each ice station.
Mean sea-ice thickness, freeboard and snow thickness measured for all ice stations. S1b, S1c represent the two revisits at the ice station S1. S4b represents the revisit at the ice station S4

The overall ice conditions remained fairly stable during the week. During the revisit of station S1 on the 16 April (previous visits on the 12th and 13th), we noted an erosion of 40 m of the edge and a slight thickening (between 0.5 and 1 cm) of the ice. This ice growth could not be noted at station S4 (first visit the 13 April, revisit the 15 April).
A small boat has been used to travel in the fjord and to access the sea ice. A hand-held GPS was used to continuously track the position of the boat (spatial sampling, 20 m). This allowing us to locate specific features in the fjord, such as icebergs and growlers (even if growlers and bergy-bits were widely dominant in the fjord, for simplicity we will generically call them icebergs) or ice edge. Although this study was not the main goal of the fieldwork campaign, we took the chance to achieve this feature localisation as a proof of concept for future fieldwork.
Ice edge localisation
After the sampling on two different ice stations (stations S4 and S7, Fig. 1), we took advantage of the GPS tracking to record the ice edge of the nearby thin ice. To achieve this, we simply drove the boat along the ice edge while the GPS was recording. The time of beginning and end of the track have been noted to isolate this specific part of the track during the postprocessing. It took 18 min to track the edge near the ice station S4 (between 15.04 and 15.22 UTC) and 19 min for the ice edge near ice station S7 (between 11.23 and 11.42 UTC). The ice characteristics from the ice station at the beginning of the track are used as reference. Significant features on the ice surface (small ridges, trapped growlers, frost flowers, etc.) were documented by photography along the track. These photographs can provide valuable information in the later comparison of the tracked ice edge and the remote-sensing data.
Iceberg localisation
Any iceberg encountered while moving towards the sea-ice stations was circled with the boat. The loop recorded in the track is then isolated in postprocessing of the data. The centroid of the loop is calculated and assumed to be the centroid of the iceberg. During the circling of the iceberg, numerous photographs were also taken to document the shape and size of the icebergs. The photographs are synchronised in time with the GPS and geocoded using the GPS track. The photogrammetric processing of the pictures has not yet been investigated any further.
Remote-sensing data
For the present study, two quad-polarisation high-resolution (fine quad-pol) Radarsat-2 (RS-2) scenes have been acquired and overlap with the ice edge tracking (on the 15–16 April). RS-2 is a Canadian C-band (5.405 GHz) SAR satellite with full polarimetric capacities. The fine quad-pol acquisition mode provides 25 by 25 km scenes with a nominal spatial resolution of 12 m. The two selected scenes were acquired within a short time delay compared with fieldwork data:
• the 15 April at 15.39 UTC (ascending orbit), 28 min after the end of the edge tracking near station S4;
• the 16 April at 15.10 UTC (ascending orbit), 3 h and 28 min after the end of the edge tracking near station S7.
The time differences between the mapping of icebergs and the RS-2 acquisitions vary from few minutes to more than a day. In most cases, this difference is a matter of hours. These time delays allow us to assess whether the icebergs are grounded or not. If an iceberg has not moved during this time interval, it can be assumed as grounded.
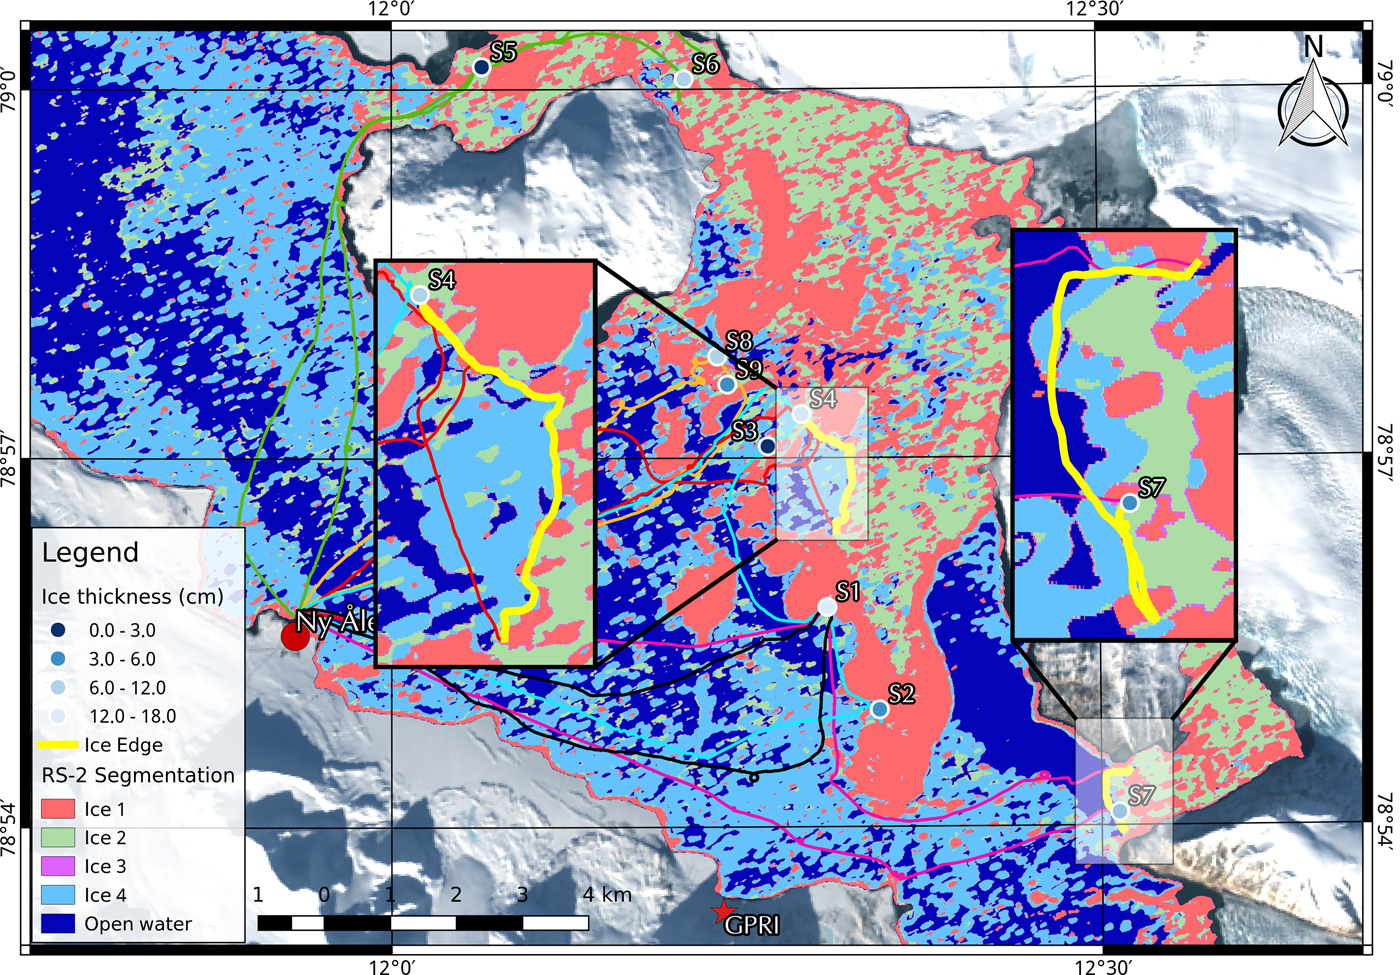
The scenes have been processed using a segmentation algorithm developed by UiT, the Arctic University of Norway (Doulgeris and Eltoft, Reference Doulgeris and Eltoft2009; Doulgeris, Reference Doulgeris2013). We choose a smoothing window of 17 × 17 pixels to ensure a fair balance between speckle reduction and small feature conservation. The number of segments can be adjusted by modifying the algorithm parameters (see Doulgeris (Reference Doulgeris2013) for more detail on the algorithm parameterisation). In this case, the compromise has been made between speckle filtering and feature conservation. The segmentation algorithm separated the RS-2 scenes into five different segments. The segmented scenes are then geocoded and imported into a mapping software, QGIS, where they are vectorised to be compared with the edges from GPS data. Figure 2 presents the segmentation result for the RS-2 scene from the 15 April. The segments are labelled from 1 to 5 by the algorithm and, by using an expert analysis from the knowledge of the field, we could assign each segment to a physical ice class.
Segmentation result of the RS-2 scene from the 15 April compared with the ice edge tracks (yellow lines). Sea ice is segmented in four segments. Ice 1 represents the thicker ice and icebergs. Ice 2 represents the thinner ice. Ice 3 is a boundary artefact generated by the smoothing of the scene. Ice 4 covers both open water, frazil and brash. Land mask background: USGS/NASA Landsat 8 (16 April)
During this period, a few optical satellite scenes (Landsat 8) have also been acquired over Kongsfjorden (Fig. 1). Three scenes are of particular interest. A first scene was acquired just 1 hour after a trip where we tracked the ice edge on 16 April. The second and third are from 3 days before, on 13 April, and 2 days later, on 18 April. These two scenes are of interest to monitor the changes in the ice conditions before and after the campaign took place.
Additionally, a ground-based radar, Gamma Portable Radar Interferometer (GPRI), had been set up on a hill, close to the shore below Botnbreen (radar position: 78°53.306′N 12°14.014′E, Fig. 1). The GPRI is a Ku-band (17.2 GHz) real-aperture radar system with 2 m-long antennas rotating about a vertical axis. It has been operational between the 15 April, starting at 13.15 UTC, and the 19 April at 08.00 UTC. It conducted one sweep every 3 min with only one interruption of 4 h in the early morning of the 16 April. The spatial resolution was 0.75 m in range and 8 m in azimuth at 1 km (increasing with distance).
RESULTS
During the 6 days with in situ fieldwork, a total of 17 icebergs and two ice edges have been mapped by GPS (Fig. 1). For both icebergs and ice edges, some features could also be identified in the satellite acquisitions.
Segmentation
The segmentation provides contrasting results. Open water not only appears partially identified in one segment, but also appears in the same segment as thinner sea ice (segment Ice 4 in Fig. 2). The segment Ice 4 therefore covers open water, brash and frazil ice. These results can be explained by wind-generated waves and ripples, increasing the backscattering coefficient of water to the point of being similar to the thin ice brightness. Also, five segments are rather few, and no doubt mix some of the most similar segments under these limitations. However, an increase of segments did not give better results, and more segments actually presented more mixing, often produced numerical errors, and was predominantly influenced by the speckle. In these cases, even though the ice edge could still be identified on maps by expert analysis, the mixed segments would make any further study impossible. Improving the algorithm was beyond the scope of this study, so we decided to keep the number of segments limited to have an overall satisfactory ice–water segmentation.
Most of the sea ice appears in two segments (segment Ices 1 and 2). The first class (segment Ice 1) represents thicker ice (sea ice above 6 cm) and snow-covered ice. Icebergs are also included in this class. The second ice class (segment Ice 2) represents younger thinner ice (sea ice under 6 cm). Finally, the segment Ice 3 appears to be a boundary artefact of the segment Ice 2, most likely caused by the smoothing of the original scene.
For the comparison between the ice edge track and the segmentation, these last three segments (Ices 1, 2 and 3) are considered as one Ice class. The mixed segment Ice 4 is merged with the open water class.
Ice edge
The ice edge detection gives contrasting results on the segmented RS-2 scene (Fig. 2). Near the ice station S4, the recorded edge fits the segmentation results. The average distance between the track points and the Ice class edge is 18 m (with a standard deviation (std dev.) of 13 m). In contrast, near the ice station S7, the recorded edge does not fully correspond to the segmentation results presented in Figure 2. The overall track presents an average distance of 47 m (with a std dev. of 44 m) from the Ice class.
The first significant difference between these two areas is the ice thickness. The ice sampled at the station S4 (9 cm) is almost double the thickness of the ice sampled at station S7 (5 cm). These point measurements may not be fully representative of the local variation of the ice thickness, but during the tracking of the edge, no significant changes in ice aspects have been noted. Therefore, we assumed the two stations are representative of the area surrounding the tracked ice edges.
Another hypothesis regarding the difference between classification and ground data is that the difference resulted from surface wetness and possible flooding of the sea ice. Some brash and irregular sea-ice surface zones are also reported in the area surrounding station S7. The backscattered signal would be strongly affected by sea water on the ice surface and the surface roughness. The field notes indicate that the surface of the ice was wet. We measured a zero freeboard at station S7, indicating that the ice can be easily flooded. The wetness of the surface may also come from the permeability of the ice.
A break-up of the ice can also be considered to explain this difference between the tracked ice edge and the radar segmentation. Although the time difference between the tracking and the satellite acquisition was relatively small (3 h and 28 min, the thin ice could have broken up because of tidal or wind induced waves or even the boat movement. This erosion of the ice can be observed between the Landsat 8 scenes acquired on the 16 and 18 April (Fig. 3).
Comparison of the tracked ice edge (yellow line) and the ice condition at the entrance of Raudvika, around ice station S7 (blue dots), as seen from Landsat 8 between (a) the 16 April (day of the track recording, acquisition time 12.47 UTC, 55 min after the end of the edge tracking) and (b) the 18 April.

Ice movements can also be observed in the area using the images acquired by the GPRI. In particular, on the 16 April, between 14.30 UTC and the RS-2 acquisition time (15.10 UTC), a northward displacement appears in the tracked edge area (Fig. 4). A plume, to the west of the tracked edge, can be seen moving northward between Figures 4b, c. And around the northwestern corner of the ice edge the ice situation is changing between the different images (Figs 4f–h). Therefore the ice edge tracked could be the edge of an ice floe, which broke up and drifted away shortly after the tracking. Finally, we can notice the consistency of the southern part of the track with the ice edge, as seen by the GPRI, and the stability of the edge between the tracking time (Fig. 4d) and the RS-2 satellite acquisition (Fig. 4e)
Ice edge (yellow line) near ice station S7 (blue dot) against GPRI on the 16 April. The three first images show (a) the acquisition to the time of the end of edge tracking (11.42 UTC), (b) an intermediate acquisition (14.30 UTC) when a plume of drifting ice (red arrows) can be seen to the west of the ice edge, and (c) close to the time of RS-2 acquisition (1 min before, 15.09 UTC). Panel (c) also presents a second ice plume (blue ellipse) becoming visible after being compacted by the currents and/or the wind. The first two zoom boxes present the southern part of the tracked ice edge at (d) 11.42 UTC and (e) 15.09 UTC, where the edge in the radar fits the track. The three last pictures present a zoom on the northwestern corner of the ice edge, at (f) 11.42 UTC, (g) 14.30 UTC and (h) 15.09 UTC, where the erosion of the ice can be seen.

.
Near station S4, the northern part of the track appears to go through the ice (Fig. 2). In this case, two phenomena can be taken into account. First, some broken thin ice and frazil were present nearby the edge we tracked. This ice could have drifted closer to the edge during the time between the fieldwork and the RS-2 satellite acquisition. Second, the incidence angle of the scenes (32° in near range to 34° in far range for the 15 April) are known to provide a low signal-to-noise ratio on thin ice (Partington and others, Reference Partington2010). The combination of the proximity of ice, the low signal-to-noise ratio and the speckle filtering covering approximately 85 m on the ground have smoothed the segments to the point where two separated areas can be connected.
Icebergs
Some of the icebergs mapped from the boat could be also identified on the RS-2 scenes, Landsat 8 scenes and the GPRI images (Fig. 5).
Three suspected grounded icebergs located with the boat track (pink line) west of ice station S7 and the tracked ice edge (yellow line) as seen by (a) Radarsat-2 (polarisation HV, 16 April, 15.10 UTC), on the top, (b) Landsat 8 (16 April, 12.47 UTC), in the middle, and (c) GPRI (16 April, 11.42 UTC) at the bottom.
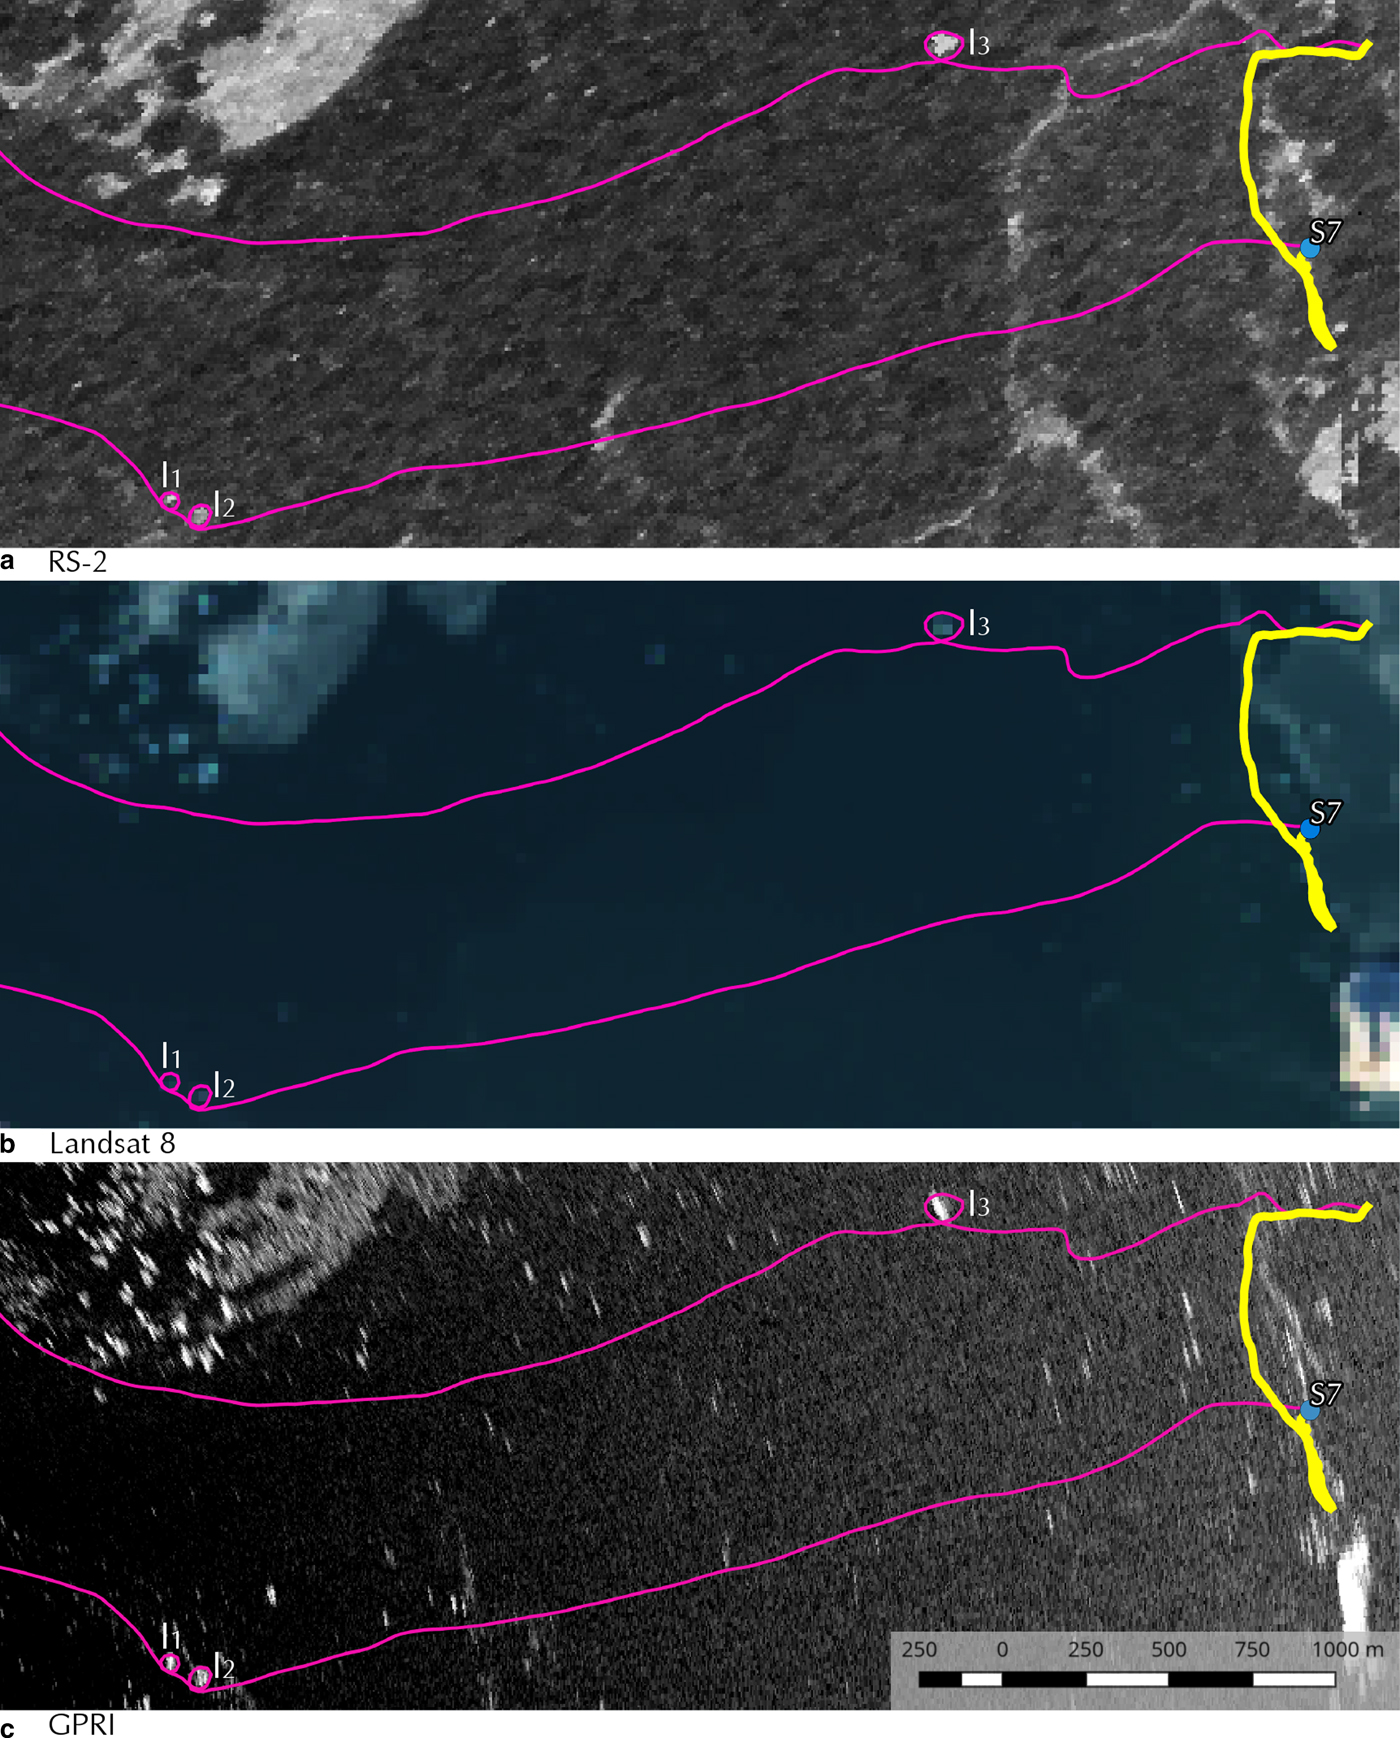
In all the cases, we can only identify with certainty the grounded icebergs. The floating icebergs obviously drift during the time interval between the GPS localisation and the satellite acquisition. It is only with the help of the GPRI, which produces an image every 3 min, that we can follow the drift of non-grounded icebergs.
The segmentation algorithm also manages to isolate a few icebergs. However, the algorithm, with the configuration we used for thin ice segmentation, does not discriminate icebergs from sea ice, although different settings may do so. We are able to identify the icebergs only thanks to the field expertise and the GPS track. We did not investigate any further the iceberg identification in the satellite scenes. The main purpose of this iceberg localisation procedure was to provide ground truth to another ongoing study (Akbari and others, Reference Akbari, Brekke, Doulgeris, Storvold and Silvertsen2016a,Reference Akbari, Doulgeris and Brekkeb).
Discussion
The results of this campaign have revealed the potential of tracking devices to monitor sea ice and small icebergs. The relative stability in time of grounded icebergs and fast ice presents a major advantage for this technique. The comparison of the GPS tracks with the remote-sensing acquisitions is eased when the features have not moved in the meantime. The comparison between the two ice edges and the radar segmentation showed the importance of thoroughly documenting the ice surface and the ice and water situation around the boat. Documenting traces of flooding, changes in surface roughness, cracks or surrounding frazil ice in the water while in the field appears important to ease the interpretation the segmentation results afterwards. It can allow the monitoring of changes such as fast ice edge erosion, for example. It can also reveal limits of the remote-sensing techniques such as mixed classes.
Drifting ice and icebergs are obviously more challenging for the proposed protocol. But in a short time span between tracking and satellite acquisition, it can be possible to trace back the icebergs location. For drifting ice, this proposed protocol can also prove itself useful to monitor the refreezing of leads, for example. Significant features such as the lead edge, or a drifting station, can be references to trace back the drift between the tracking and the satellite acquisition. The GPRI also brings significant information regarding break-up of floes or drifting ice and icebergs (e.g. drift speed and direction). The regularity of the acquisitions represents a significant advantage to fill the gaps between in situ fieldwork and satellite acquisitions over sea ice, and it allows a better understanding of the differences between the two.
The boat itself could generate breaking of the ice by inducing stress in the ice sheets from the waves it generates. This can be prevented by moving slowly when navigating close to thinnest ice or obviously weakened ice (melting or wavy conditions). We did not witness any break-up when looking back on our path during the fieldwork, but we recommend that caution should be taken and signs of disturbance be documented.
The precision of the ice edge track is also a key question. As mentioned earlier, the GPS itself provides a precision of the points comparable or better than the Radarsat-2 pixels. But as the GPS is in the boat, it cannot be precisely on the ice edge. The position of the GPS inside the boat and the distance of the boat itself to the edge also introduces uncertainties. The boat used during this campaign was a small polarcirkel open workboat. This boat is 6 m long × 2 m wide, and the GPS was in the front part of the boat. We can approximate the position of the GPS in the boat 1 m from the sides and 1–2 m from the front. So, the main source of uncertainties in the track comes from the distance of the boat to the ice edge. We did not have a precise measurement for this distance, but we estimated it as 5–10 m. To compare the ice edge track and the radar edge, we then need to take into account the three main uncertainties sources: the boat distance from the edge (5 ± 5 m), the GPS precision ( ± 5 m) and the radar pixel (12 m), while we assume that the geocoding location error is negligible.
Finally, the present field study has been conducted in early spring conditions. In melting conditions, the tracking of the edge can be affected by the rapid erosion or breaking of the ice. Melt-ponds or puddles on the ice surface also affect the backscattered radar signal. Therefore it may be more challenging to apply this protocol in these conditions. However, it can be used to monitor the retreat of the ice, by comparing the GPS track and the satellite images or repeating the GPS track one or a few days later.
CONCLUSIONS
The sea-ice monitoring spring campaign 2016 in Kongsfjorden has been a unique opportunity to combine multiple sea-ice monitoring techniques at a local scale. The overlap of the different measurement techniques allows us to cross-validate the various measurements. We have chosen to focus the present study on the potential offered by hand-held GPS devices to locate different features in the fjord. A total of 17 icebergs have been located precisely and two ice edge sections have been tracked. The dynamic context of the fjord has shown to be an important factor to take into account, in particular for the ice edges.
The ice edge localisation has presented contrasting results. These results have enlightened several issues not anticipated during the field work. In particular, a thoroughly detailed description of the ice at the tracked edge is necessary. But documenting the surrounding area appears also important to prevent discrepancies between the fieldwork and the satellite acquisitions. Variation of the thickness of the ice, as well as any changes in the surface roughness (air bubbles, slick ice, snow, flooding, frost flowers, etc.) should be documented as precisely as possible to improve the interpretation of the results. Particular attention should be given to the open water side of the edge. Thin ice forming or drifting close by the edge can modify the backscattering signal received by the satellite.
Non-grounded icebergs are, of course, expected to move, but within a reasonably limited time delay between the localisation and the satellite acquisition they can easily be tracked. Beside providing valuable information for validation of remote-sensing products, their localisations can provide a map of smaller grounded icebergs undetectable by remote-sensing techniques. The GPRI also brings valuable information to fill the gaps and follow the drift of the icebergs between the time of their GPS localisation and the satellite acquisitions.
The hand-held GPS devices have shown their ability to accurately locate icebergs and ice edges in the fjord. Added to the field expertise, it represents a cost and time effective device to track features such as icebergs and ice edges. To a certain extent it also expands and validates the representativeness of a point measurement, an ice station, to a wider area, as long as no significant changes are noted during the tracking. Future work can gain from this test campaign and will allow a significant improvement of the observation protocols. This protocol, in complement to existing methods, will lead to better interpretation of remote-sensing products and a further validation of thin ice and small iceberg radar responses.
ACKNOWLEDGMENTS
We are grateful for logistic support from the Sverdrup Station personnel of the Norwegian Polar Institute (NPI). This research is funded by ‘CIRFA’ (Center for Integrated Remote Sensing and Forecasting for Arctic operations) partners and the Research Council of Norway (CIRFA SFI grant no. 237906), ‘Arctic EO’ (Arctic Earth Observation and Surveillance Technologies, grant no. 195143/O50), the Fram Centre project ‘Mapping Sea Ice Characteristics relevant for Arctic Coastal Systems’ in the Fram Centre Fjord and Coast Flagship, the Fram Centre project ‘Ground-based radar measurements of sea ice, icebergs and growlers’ and the long-term monitoring of Arctic sea ice project (NPI). Radarsat-2 data weres provided by NSC/KSAT under the Norwegian-Canadian Radarsat agreement 2016.


 Open access

