

Recent debates in this journal (Bergeron-Boutin et al. Reference Bergeron-Boutin, Carey, Helmke and Rau2024; Knutsen et al. Reference Knutsen, Marquardt, Seim, Coppedge, Edgell, Medzihorsky, Pemstein, Teorell, Gerring and Lindberg2024; Little and Meng Reference Little and Meng2023, Reference Little and Meng2024) raised concerns about the importance of expert assessments in political science research—and the potential of biases in the aggregation of those assessments. This problem is hardly new or unique to academic research. In particular, when it comes to closed political settings (e.g., authoritarian regimes), government officials, foreign companies, and the public traditionally have relied on country experts to inform them about what actually is going on behind closed doors.
It is thus remarkable how little information most organizations that rely on such expert assessments provide to the users of their indices and how little recent research there is on experts of specific countries and regimes. Who, for instance, are the China Hands and Russia Watchers, whose interpretation of obscure “party speak,” appearances or non-appearances of party leaders, and palace rumors helps us to understand what some of the most powerful nations in this world are “up to”?
This article is the first contemporary attempt to describe the community of “China Watchers” as a whole—and not only the group of experts based in the United States or working in academia. This is not a simple task. As McCourt (Reference McCourt2024) noted in the only recent evaluation of the US-based China Watcher community, it has ballooned to multiple thousands of members and has become polarized. Moreover, whereas the community has become more international, Ash, Shambaugh, and Takagi’s (Reference Ash, Shambaugh and Takagi2007, 246) observation made 18 years ago—that the different national communities remain relatively separated and that there is a “lack of international interaction among China specialists [in] Australia, Asia, Europe, Japan, and North America”—remains to some degree true. In addition, the field has become methodologically fragmented (O’Brien Reference O’Brien2011) and research on Chinese politics is no longer published in a few, specialized venues. Furthermore, as McCourt (Reference McCourt2022a, 73) stated: “American China Watchers no longer need a degree from one of a handful of top China or Asian Studies programs to participate but can transfer many different forms of knowledge into recognized insights.” Identifying the members of this fragmented community, therefore, is far from straightforward.
Previous efforts to establish an authoritative list focused on scholars whose research appears in important English-language academic journals and conferences (Greitens and Truex Reference Greitens and Truex2020) or interviewed a sample of experts based mainly in the United States (McCourt Reference McCourt2022a, Reference McCourt2022b). One contribution of this article therefore is to establish such a list that includes China Watchers outside of academic institutions and the English-speaking world. We established this list by leveraging a snowball survey in which experts suggest other experts to approach.
This method identifies experts through a principled process of other-ascription, allowing the community to define its boundaries and determine the importance of its individual members in a bottom-up process, instead of the researchers imposing it by fiat. Establishing such a list and analyzing its members is important because there is evidence that it matters who are the members of this China Watcher community. Jacobs and Page (Reference Jacobs and Page2005) showed that experts are the second-most influential group affecting US foreign policy. More recently, McCourt (Reference McCourt2022b, 3) argued specifically that the changing composition of the China Watcher community has contributed substantially to the replacement of the long-standing “engagement” approach of the United States toward China with the tougher “strategic-competition” approach.
In describing this new composition of the China Watcher community, the article focuses particularly on the question of whether the composition of the community indicates biases or a lack of diversity—which often is summarized using terms including “echo chambers” and “group think.” We know that ordinary people and leaders can fall prey to biases, echo-chamber effects (Levy and Razin Reference Levy and Razin2019), and group think (Janis Reference Janis1972). If similar psychological and social patterns affect expert communities, then this threatens the validity of many seemingly “objective” measures based on aggregated expert opinions, such as transparency and democracy scores (Little and Meng Reference Little and Meng2023). It may also lead to disastrous policy mistakes even when the decision makers themselves do not engage in group think or a “march of folly” (Tuchman Reference Tuchman1984).
In the past, country and region specialists failed to anticipate important changes, including the fall of the Soviet Union (Remington Reference Remington1992; Rutland Reference Rutland1993, Reference Rutland2003), the Arab Spring (Gause Reference Gause2011), and the financial crisis that ended the “Asian Miracle” (Jones and Smith Reference Jones and Michael2001). Experts are likely to be more prone to these errors when the structure of the epistemic community (Haas Reference Haas1992) or discourse coalition (Hajer Reference Hajer, Fischer and Forester2002) hinders the flow of information among communities in the network (Burt Reference Burt1995). By examining the professional and educational background of the members of the China expert community, as well as their connections to one another, we provide indirect evidence of how diverse the China Watcher community is and whether its network and social structure might lend itself to echo-chamber biases.
We show, for instance, that this expert community is indeed diverse in terms of work institution, geographical region, educational background, and gender. However, the field continues to be populated by a large proportion of male academics working in the United States who attended the same group of (mostly US) universities for their postgraduate and doctoral studies. In particular, the most influential China Watchers are disproportionately US- and academia-based. There also is a tendency of experts in the United States and in academia to nominate and be nominated by one another, which suggests the potential for echo-chamber effects. Conversely, there also are clear changes happening in the community: younger cohorts of China Watchers in our database tend to be more diverse with regard to gender and educational background as well as, to some degree, geographic location.
…the most influential China Watchers are disproportionately US- and academia-based.
Because of the increasing difficulty of accessing information, the assessment of Chinese politics by the China Watcher community as a whole is likely to grow in influence over important business and policy decisions, such as whether companies should invest or stay in China and whether or how to prepare for China invading Taiwan. It also is possible that individual China Watchers may substitute independent, on-the-ground information with information gleaned from their peers’ assessments. Thus, society relies more heavily on a community of experts exactly at a time when it has become vastly more difficult to obtain an overview of who the members of this community are—which our research exactly provides.
METHODOLOGY
This section presents our sampling approach and discusses how we measure diversity and echo chambers.
Diversity and Echo Chambers
Echo chambers are discussed widely in academic and lay writing (Baumann et al. Reference Baumann, Lorenz-Spreen, Sokolov and Starnini2020; Cookson, Engelberg, and Mullins Reference Cookson, Engelberg and Mullins2023; Levy and Razin Reference Levy and Razin2019; Nguyen Reference Nguyen2020) and blamed for a variety of problems, particularly the political polarization of society and the spread of misinformation. They are situations in which individuals interact mainly or exclusively with those who hold similar opinions and rarely or never are exposed to information that contradicts their view—or, as the Cambridge Dictionary defines: “a situation in which people only hear opinions of one type, or opinions that are similar to their own.” This situation may come about by accident (Nguyen Reference Nguyen2020, 141) (i.e., “epistemic bubbles”) or be due to the active exclusion of alternative sources. Either way, echo chambers often are associated with the concept of “homophily” (McPherson, Smith-Lovin, and Cook Reference McPherson, Smith-Lovin and Cook2001), which is the idea that individuals are more likely to form ties with those who are similar to them. As Levy and Razin (Reference Levy and Razin2019) argued, this forms the “chamber” part of the echo chamber, which is the part investigated in this study.
With this in mind, we present evidence to answer three questions. First is the overall diversity of the field based on publicly available background information and differences among age cohorts. Is the claim that the China Watcher community is becoming more diverse borne out in our data? Second, we examine whether homophily may reinforce a lack of diversity in subcommunities in our nomination network (Interian et al. Reference Interian, Marzo, Mendoza and Ribeiro2022, 3130–32). If experts with a similar background—that is, from the same country, working in the same institution, and having attended the same universities—predominantly nominate one another, we might be concerned that any bias due to their similarity is further reinforced because they also tend to obtain their information from experts with a similar background. Third, we present evidence that US-based China Watchers do indeed also display homophily in terms of the policy advice provided.
Establishing a List of Experts
To establish a list of experts, we used a snowballing nomination process in which China Watchers nominate other individuals who they consider to be part of the China Watcher community. In other words, experts on Chinese national politics are those individuals who are considered by other experts to be experts.
The authors nominated 43 individuals as seed individuals.Footnote 1 We contacted these individuals first through regular mail using the university letterhead and followed up with invitation and reminder emails from our project account in the case of nonresponse. These were followed by a final, more personalized reminder sent from our own university email account. The message contained the respondent’s unique identification and a link to a short survey of six questions on Qualtrics.Footnote 2 The survey asked about their field of expertise, whether they considered themselves to be experts on contemporary Chinese politics or political elites, how often they consumed news on Chinese politics, and how confident they feel ranking the top 20 most influential actors in Chinese politics. We also asked them to indicate 10 to 20 (or more) names of other experts on Chinese contemporary politics. A research assistant then searched online for the nominees’ contact details and publicly available information about their gender, work place, and curriculum vitae (CV).
The first letters were mailed in June 2019, and we continue to receive a few new responses every month. Online appendix section D explains why we are confident that future entries will not change the main conclusions presented in this article. Specifically, we show that the most recent responses tend to nominate fewer new names and do not differ from those in the previous two to three waves in terms of gender, work place, and institution composition. Although the most recent waves contain new experts, particularly from less-covered regions (i.e., South America, Africa, and the Middle East), there nevertheless is a strong tendency to nominate the same top-nominated experts who were named in previous waves (see online appendix figure 19). In fact, there is less than a 10% turnover in the most-nominated China Watchers after the fourth wave, irrespective of whether we look at the top 10 or the top 500 (see online appendix figure 18).
RESULTS
This section presents the main descriptive results from our survey.
Gender, Work Place, and Institution
As of March 2024, our database contained 2,200 names, which is the result of 6,869 instances of one expert nominating another expert. For 2,107 of those nominated, we were able to identify a physical or email address, of which we have attempted to contact 2,099 so far.
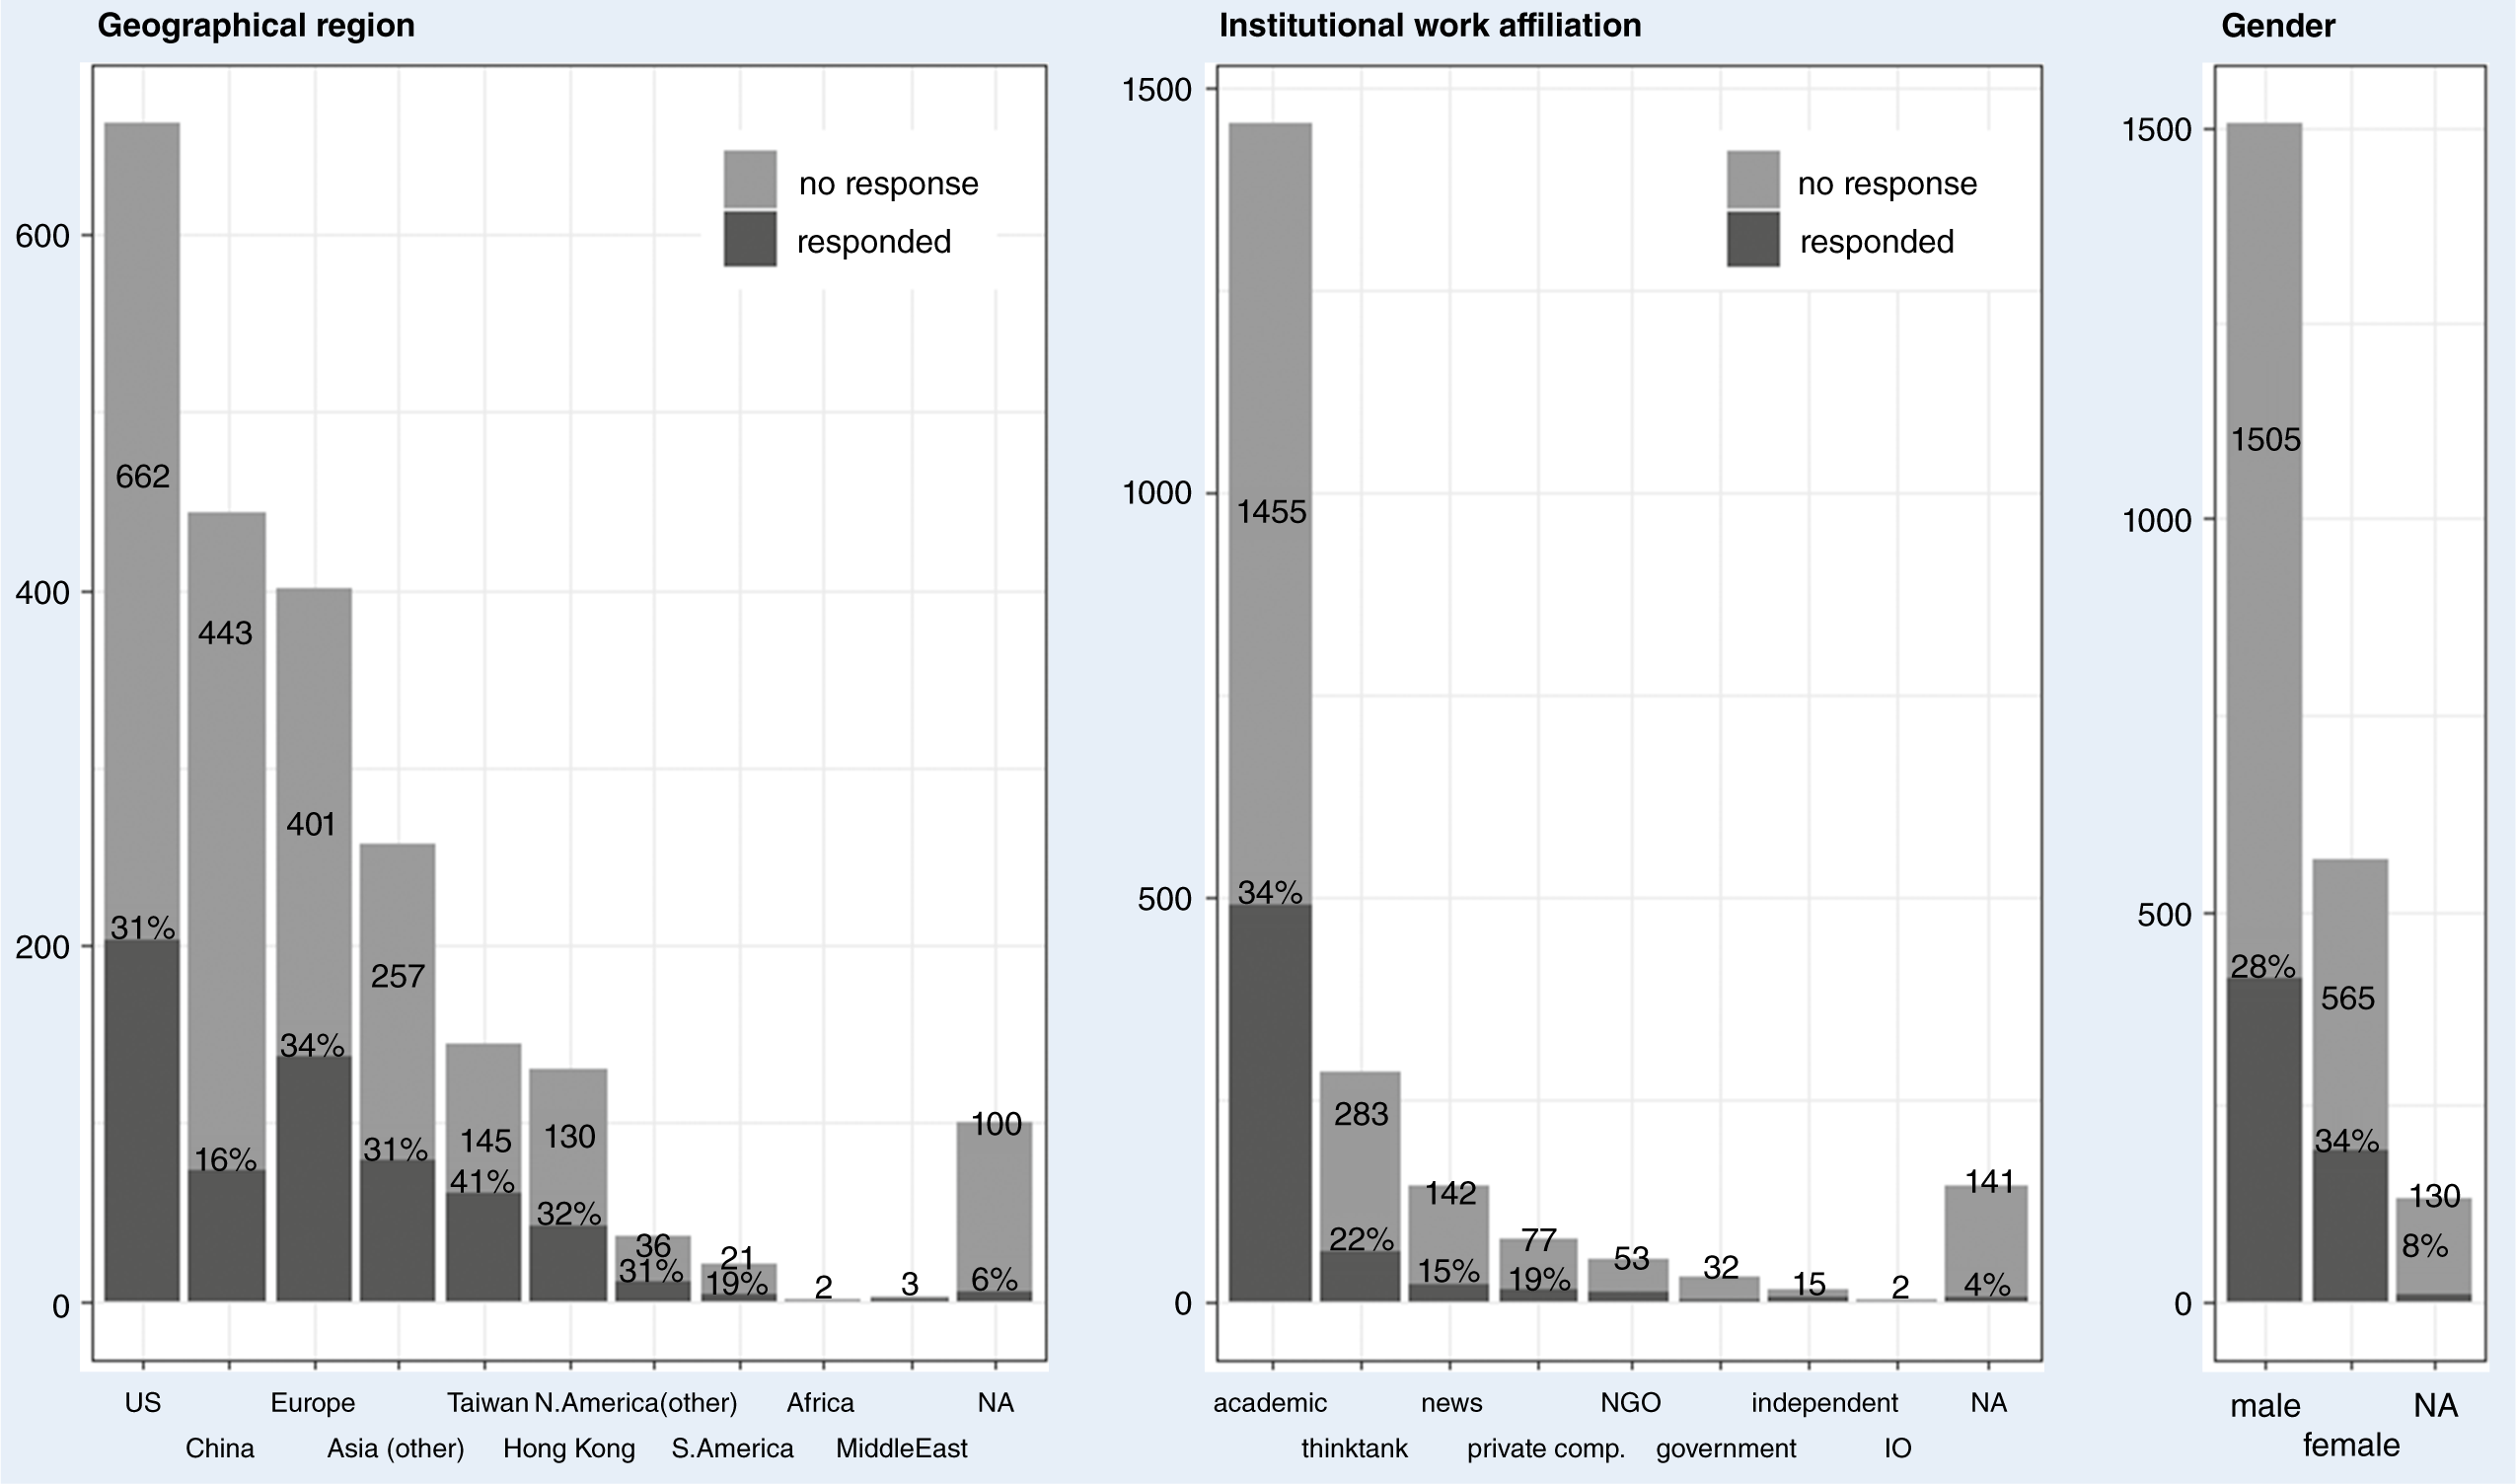
Of those contacted, 617 responded to our inquiry: 24 explicitly refused and the remainder completed the survey, resulting in a response rate of 29.3%. Women (response rate of 33.8%) and individuals working in academia (33.7%) were significantly more likely to complete the survey. China Watchers located in Taiwan also were more likely to complete the survey (41.4%); those located in Mainland China were less likely (16.5%).
Based on publicly available information, there appears to be a distinct gender imbalance in the China Watcher community: only 565 (25.7%) were women (shown on the at the bottom of figure 1). This is partly a cohort effect but also could be due to bias against considering women to be experts. We attempted to counteract this effect by adding a second, “dark-horse” nomination question that asked for experts “who are not the first that come to mind and that are less likely to be mentioned by other respondents.” Nominations to this question indeed were more likely to be female but nevertheless comprised only 31.5%.
Distribution of Gender (Right), Type of Work Institution (Middle), and Geographic Region (Left) of China Watchers in our Data
Numbers indicate the number of respondents in each category and percentages indicate the response rate in that category.

Our nominees overwhelmingly work for academic institutions (66.1%), followed by think tanks (12.9%) and the news media (6.5%). Individuals who work for non-governmental organizations (NGOs), the government, international organizations, or private companies (i.e., consulting firms or companies that need China expertise) or are independent bloggers and podcast hosts were relatively rare.
Approximately one third (30.1%) of our nominees worked in the United States, followed by 20.1% in Mainland China, 18.2% in Europe, 5.9% in Hong Kong, 6.6% in Taiwan, and 11.7% in other Asian countries. Furthermore, similar to Ash, Shambaugh, and Takagi (Reference Ash, Shambaugh and Takagi2007, 243), we found that in “Africa, the Middle East, and Latin America, the field of China Studies is still virtually nonexistent”—our database contains less than 1% from each of those regions. In general, the proportion of US-based academics is even larger among the most central China Watchers—that is, the 20 and 100 most-nominated individuals (see online appendix figures 9 and 10).
Our findings thus are decidedly mixed with regard to diversity. Despite the fact that we did not simply compile a list of authors of academic journal articles, participants of academic conferences on China, and scholars working in China Studies departments at major US universities, we nevertheless ended up with a China Watcher community in which a disproportionate proportion of individuals was male, academic, and based in the United States. Scholars may decide if this is surprising, given the US dominance of academic research in general. For some scholars, an interesting finding may be that four of the 10 most common PhD institutions attended by the community are outside of the United States. Either way, our study provides the community with a number arrived at through a principled process.
Educational Background and Age
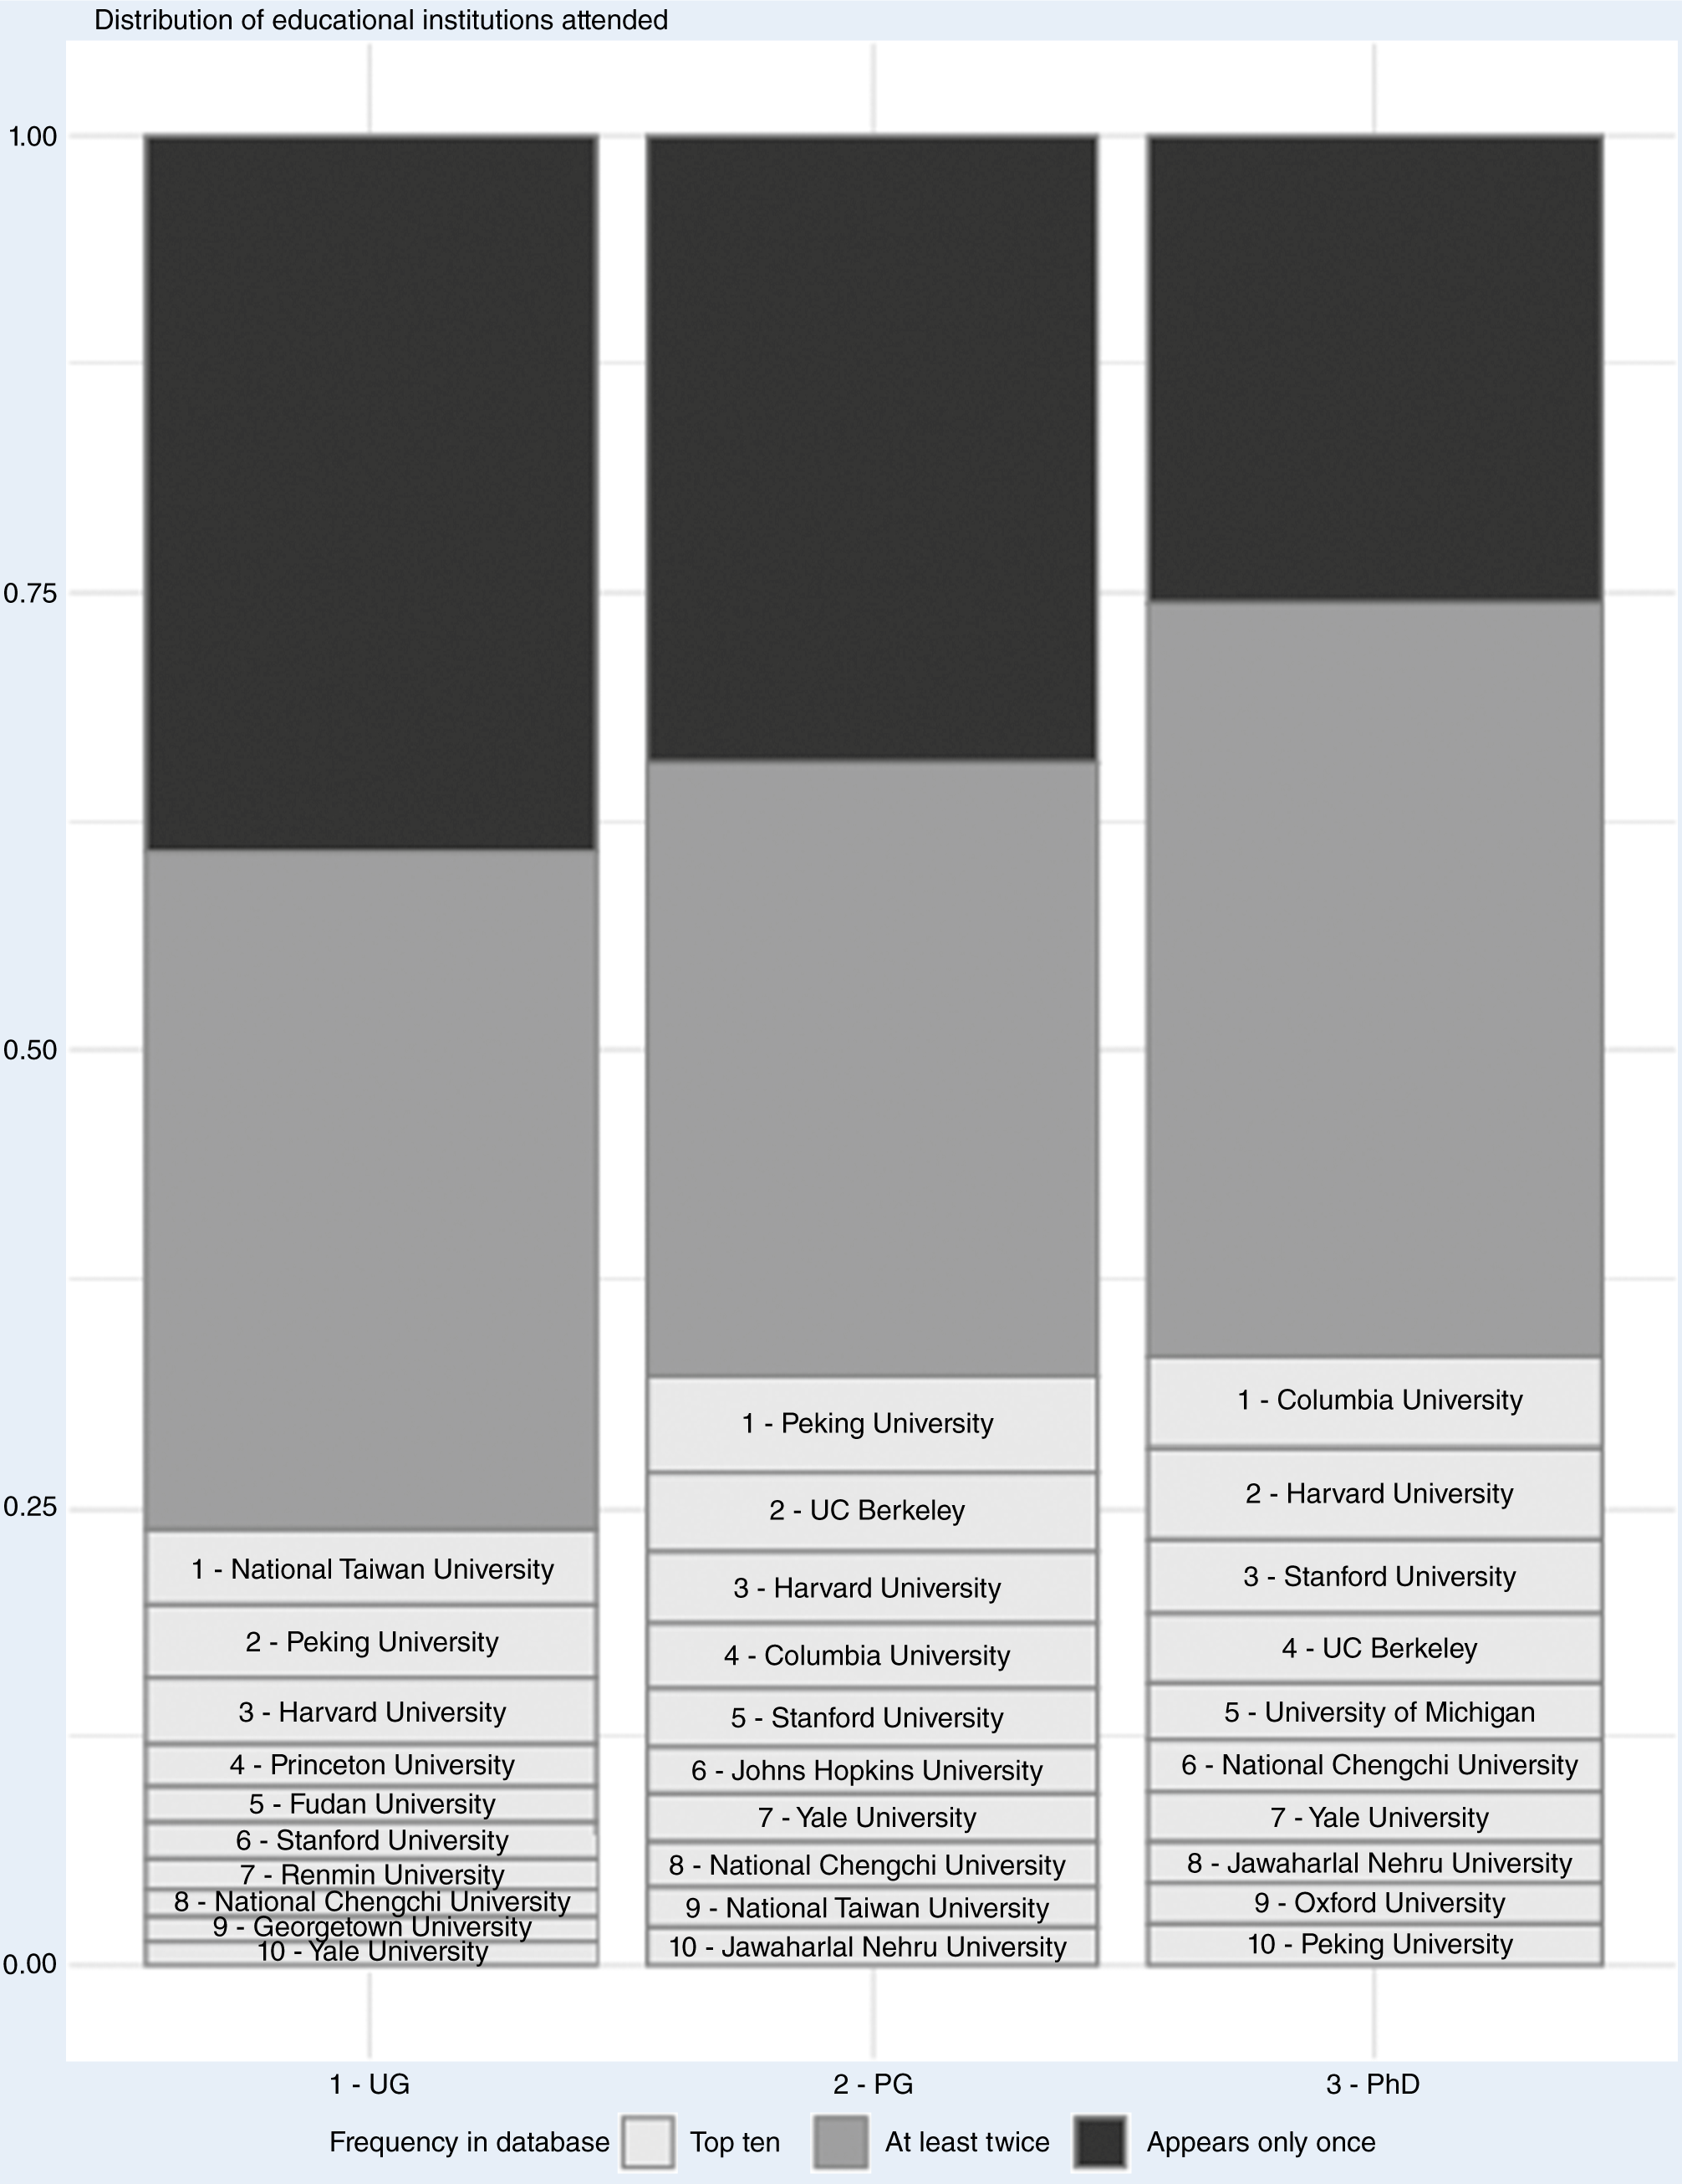
Ash, Shambaugh, and Takagi’s (Reference Ash, Shambaugh and Takagi2007, 243) observation that “university and research institutes are…no longer the only repository of expertise about China” well may be true—but academics continue to dominate our database. Moreover, even those who are working outside of academia often hold degrees from specific universities. Figure 2 presents the educational background of approximately a quarter of the experts for whom we were able to find this type of information. We again observed some diversity but approximately a third of the China Watchers studied at the top-10 most commonly attended universities for their graduate and PhD studies (shown in gray), many of which are located in United States. The skew toward the United States was more pronounced for higher degrees. For instance, 39.2% of experts hold an undergraduate degree from an institution that appears only once in the dataset, and only 25.4% hold a PhD degree from such an institution.
Educational Background of China Watchers in our Database
Top 10 universities (white) and distribution among institutions mentioned once (dark gray) or two to 12 times in the dataset (light gray). The length of the bar section is proportional to the number of China Watchers attending the specific institution(s).

Cohort Analysis
There is an apparent general consensus that the community of China Watchers and their output have changed dramatically in the past 40 years (McCourt Reference McCourt2022a, Reference McCourt2022b; O’Brien Reference O’Brien2011). We do not know what the list would have been if we had implemented this study before the opening of China or during the 1980s and 1990s; however, we examined different cohorts in our database to approximate the changes over the years.
Educational background information from public CVs allowed us to estimate the age of approximately 50% of our China Watchers (see online appendix figure 11). We then divided the experts into 10-year age brackets, except for the very young and the very old, for whom we had only a few observations.
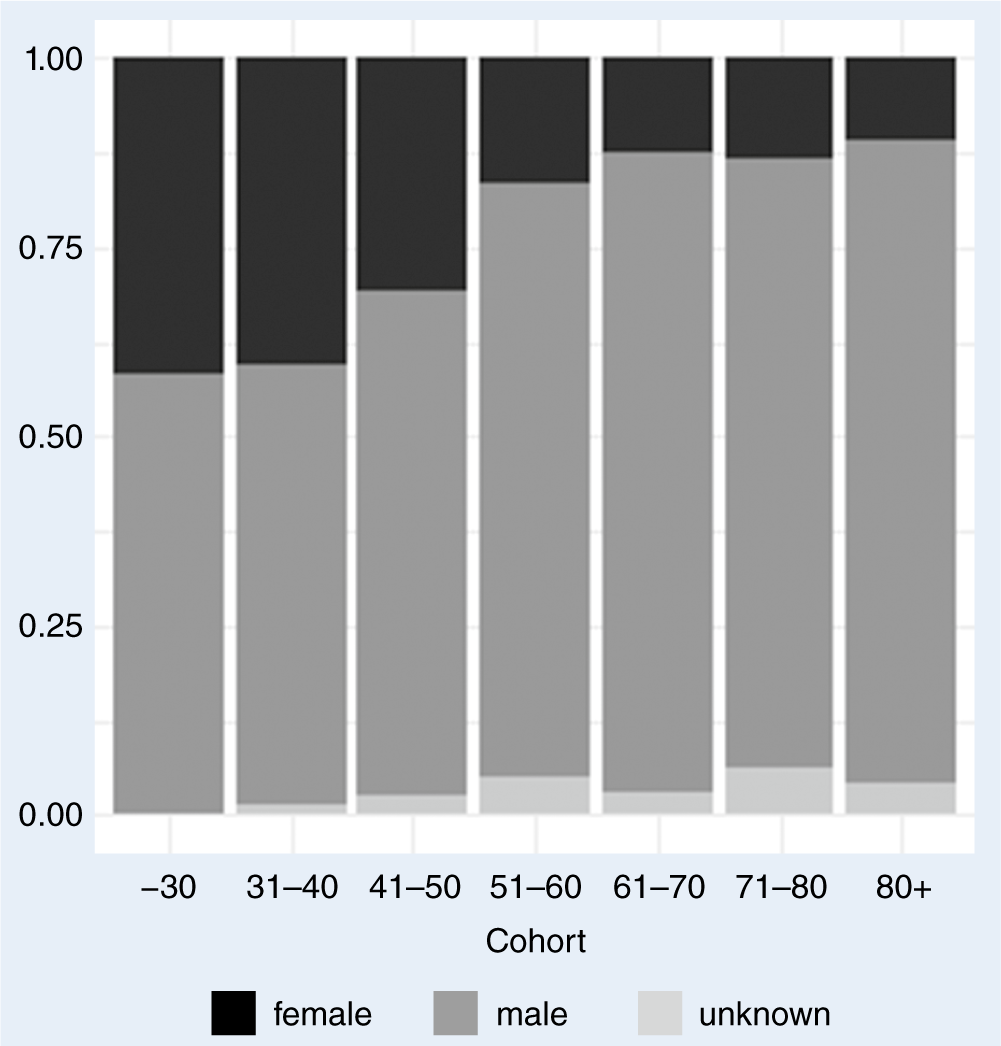
There were not many differences in terms of work places, and geographic location for the youngest cohorts was difficult to interpret because many were likely still in a non-permanent position. However, there was a tendency for older China Watchers to be based in the United States as opposed to Mainland China and Europe (see online appendix figure 12), and there was a slight increase in individuals working for think tanks after age 50 at the expense of other, nonacademic forms of employment. The changes with regard to gender composition, however, were very clear (figure 3): that is, the youngest cohorts were much closer to gender parity than their older peers—a phenomenon that is common in many countries and fields (Powell Reference Powell2018).
Gender Distribution of Different China Watcher Cohorts

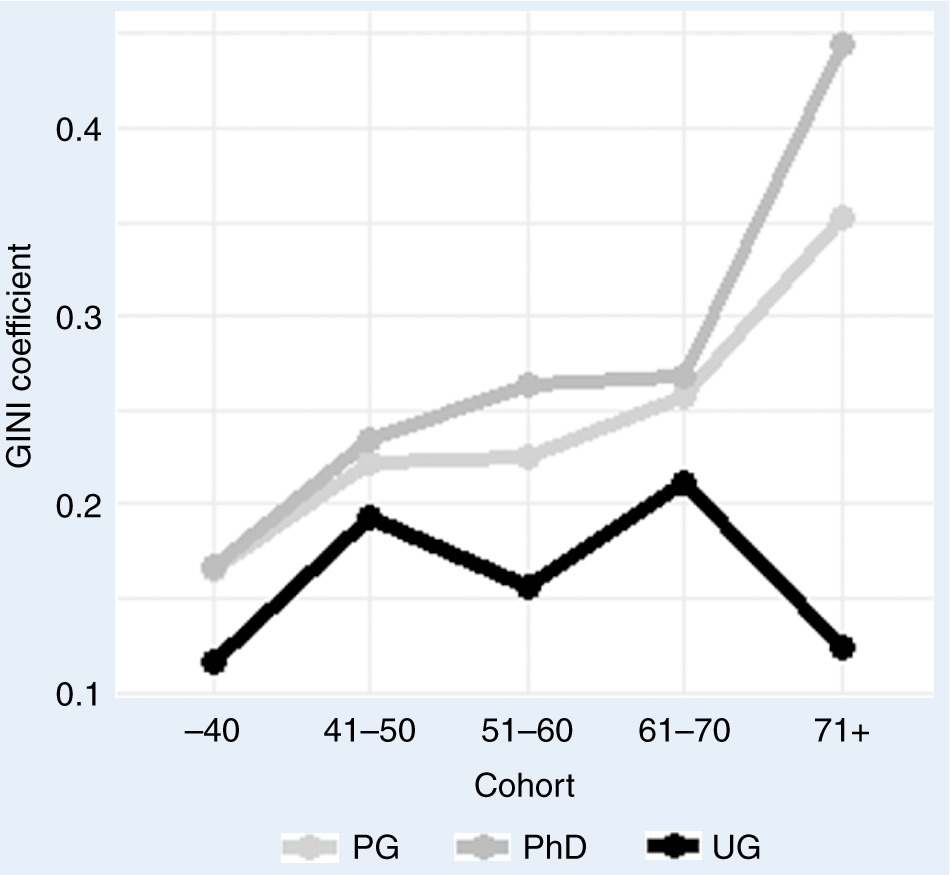
There also was increasing diversity in the educational background of the younger cohorts. We measured this using a Gini coefficient of how many individuals in each cohort attended the most common institution for their undergraduate, graduate, and PhD degrees.Footnote 3 Figure 4 confirms that there is less diversity in the higher levels of education—that is, the Gini coefficient for the undergraduate institutions was lower than that for the postgraduate and PhD institutions. The Gini coefficient also increased with the age cohorts—China Watchers in their 60s, 70s, and 80s were much more likely to have attended the same university for their PhD and graduate degrees than their younger colleagues.
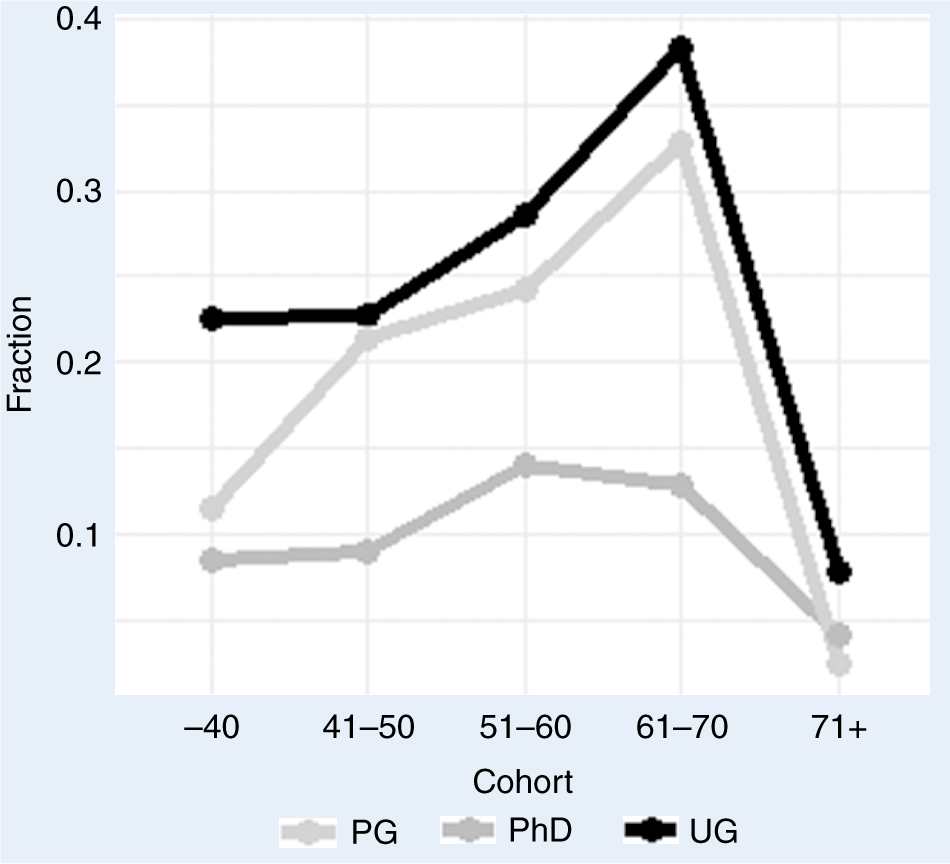
It is interesting to ask how much “China Watching” continues to be an occupation dominated by foreigners explaining China to the outside world or to what extent scholars who have grown up inside the system also are now part of this debate. Figure 5 explores this question by displaying the percentage of China Watchers with a degree from an institution in Mainland China. As in figure 2, the percentage decreases moving up the academic ladder, but the differences among cohorts was not that significant, hovering between 20% and 30% for undergraduate and graduate degrees for most of the sample. Only the China Watchers between ages 61 and 70 were somewhat more likely to hold such a degree (30% to 40%). The aggregation likely masks widely different educational trajectories; there may be younger foreign China experts who earned their (possibly second) master’s degree to gain experience in the country, whereas this opportunity was denied to the oldest cohort. Alternatively, there may be Chinese high school graduates who directly applied to US educational institutions, whereas others moved abroad after receiving their undergraduate or graduate degree at home.
Diversity in the Educational Background (Undergraduate, Postgraduate, and PhD-Degree Institution) of China Watcher Cohorts
Diversity is measured using the Gini coefficient: if all members of the cohort attended the same institution, the coefficient is 1; if everyone went to a different institution, the coefficient is 0.

Fraction of China Watchers With Degree from an Institution in Mainland China, by Cohort

Homophily in Socioeconomic Background
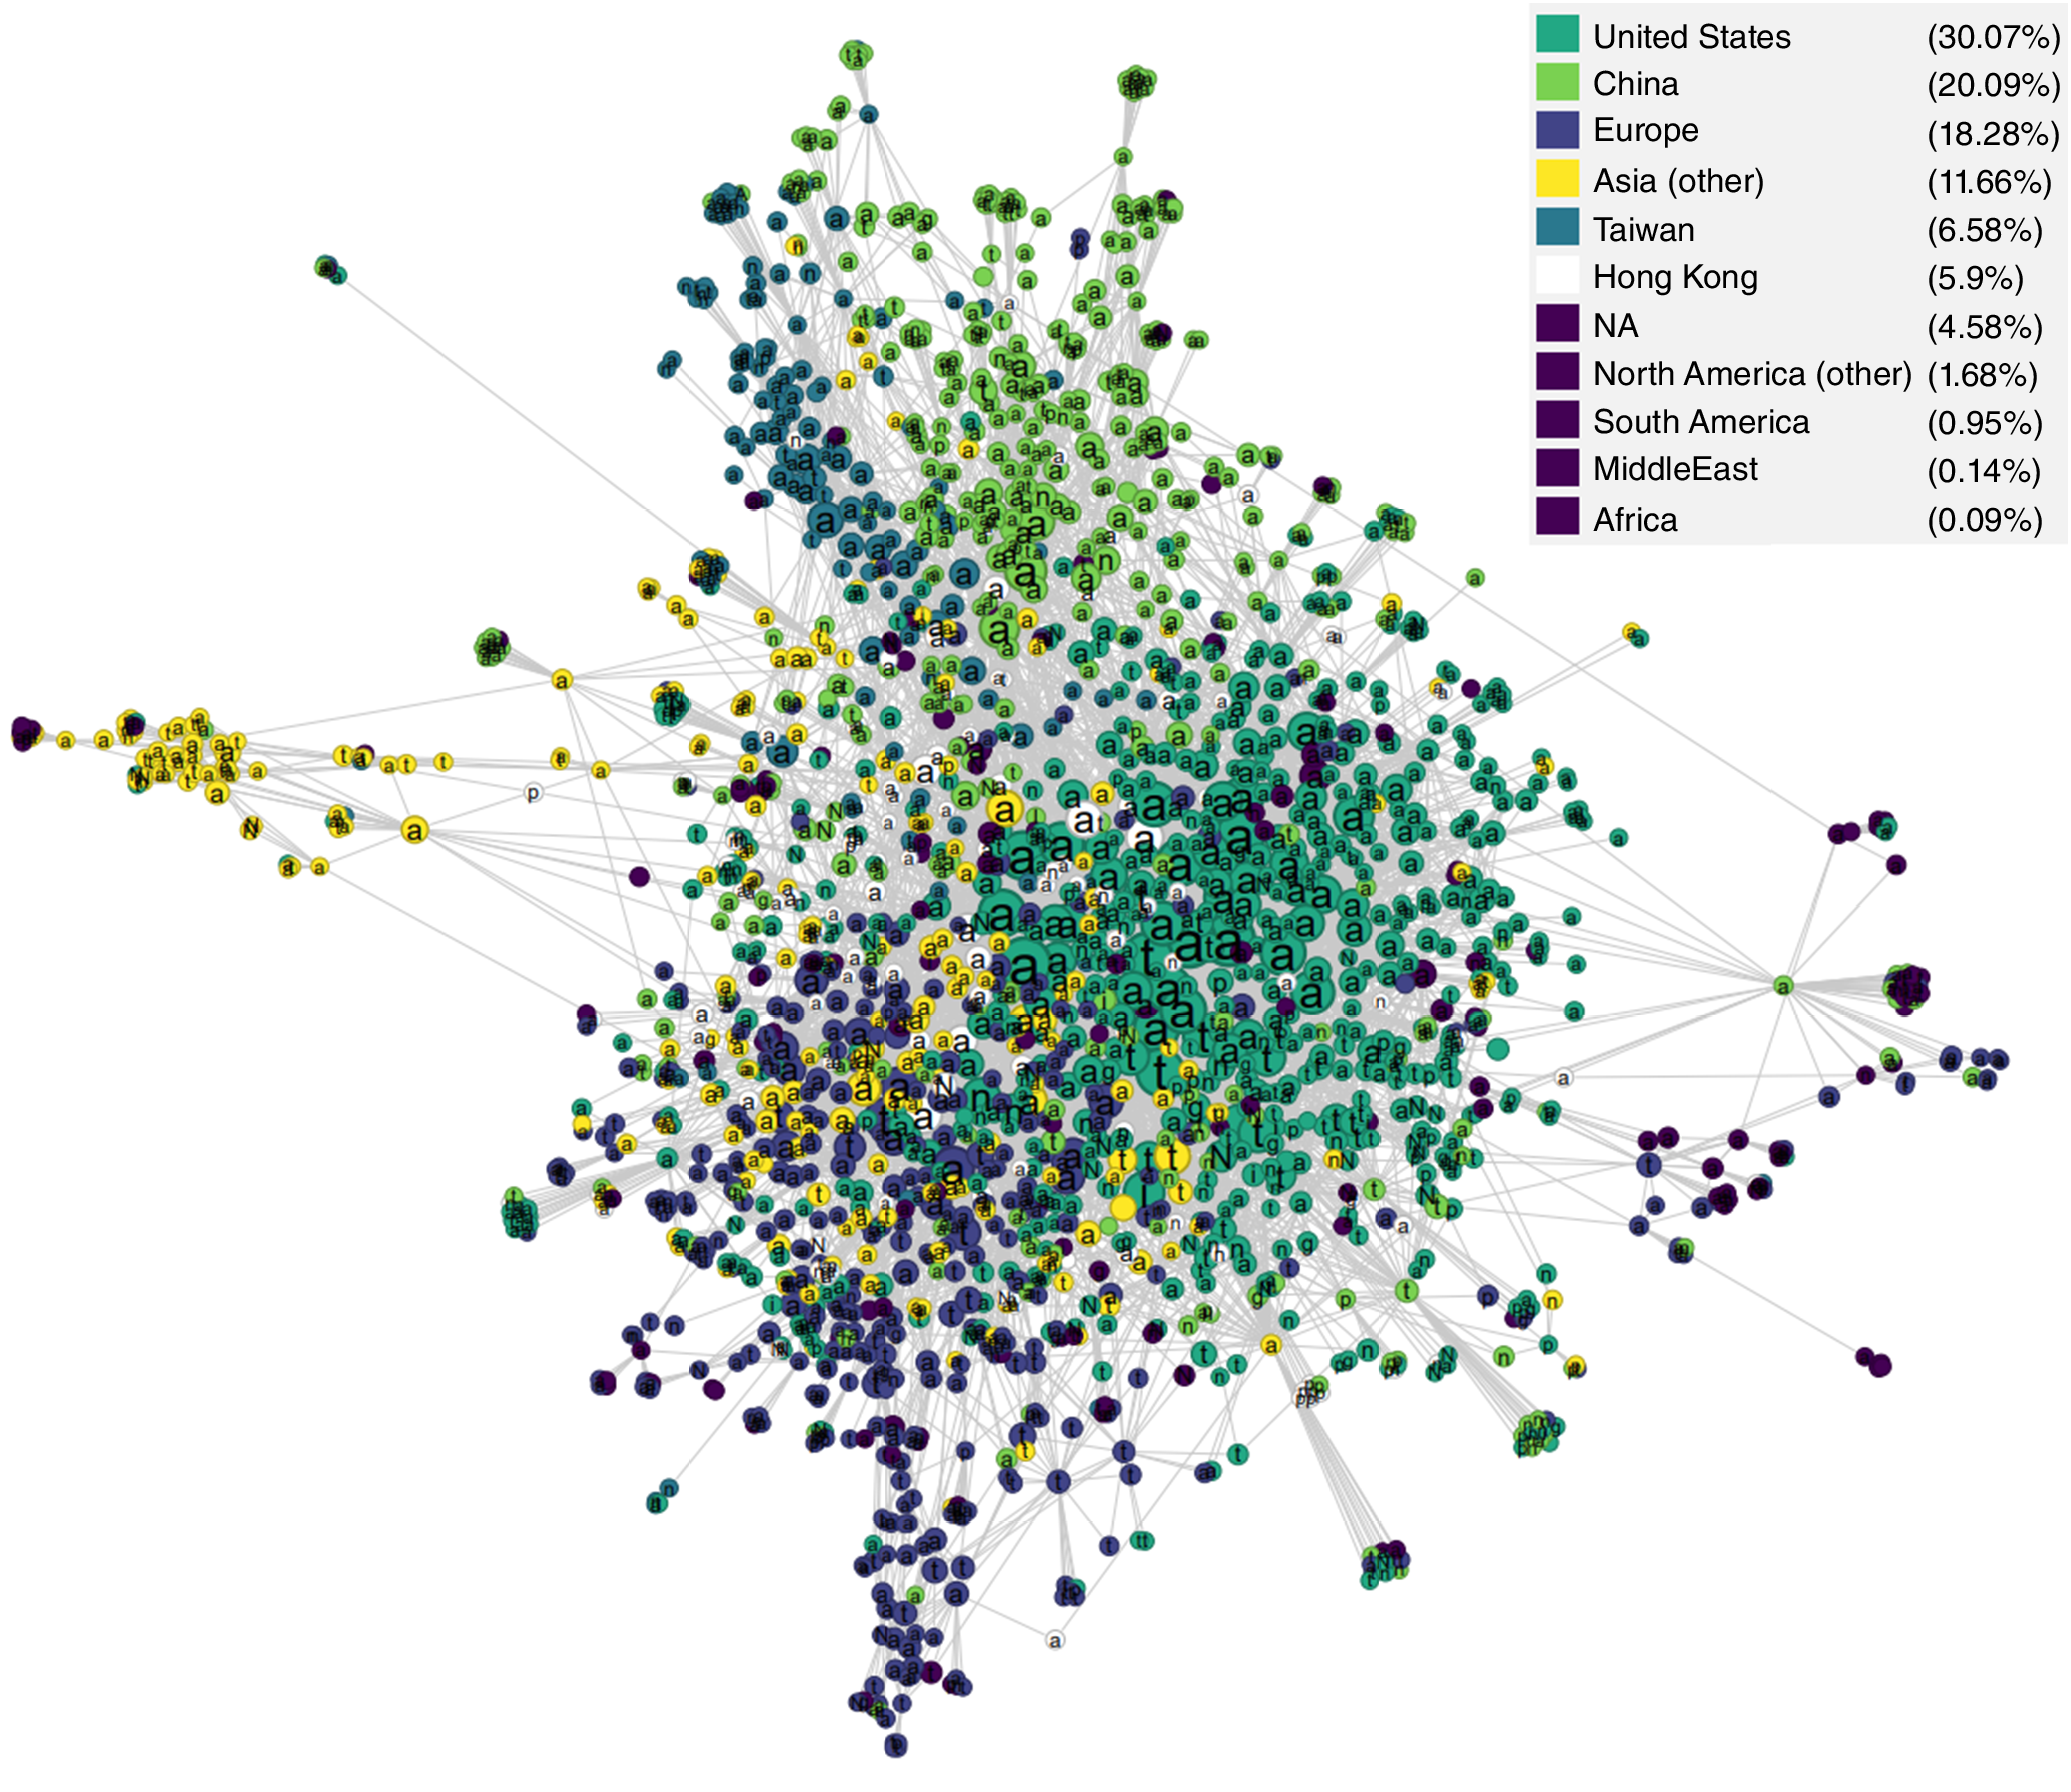
In addition to lack of diversity, we might be concerned about smaller echo chambers within the network. If experts with similar backgrounds mainly communicate with or nominate one another, creating structural holes in the network (Burt Reference Burt1995), this could lead to an echo-chamber effect within a network cluster. Figure 6 definitively suggests this possibility. In this visualization, each circle represents a China Watcher in our database, with the size of the circle proportional to the number of times the person has been nominated for the list by their peers. The letter in the circle indicates the type of institution for which the person works.
The Nomination Network of the China Watchers in our Database
The size of the node is proportional to indegree (i.e., the number of nominations), the color represents the geographical region of the work institution, and letters indicate the type of institution (i.e., a=academic, g=government, i=independent, n=news, N=NGO, p=private company, and t=think tank). Layout algorithm: Force Atlas 2 as implemented by Gephi.

The Force Atlas 2 algorithm (Jacomy et al. Reference Jacomy, Venturini, Heymann and Bastian2014) as implemented in Gephi places connected actors closer to one another, with groups of actors nominating one another thereby appearing as clusters. These clusters appear to be mostly based on geographical region. Clusters based on type of institution also exist but are less distinctive. (For an alternative visualization, see online appendix figure 20.)
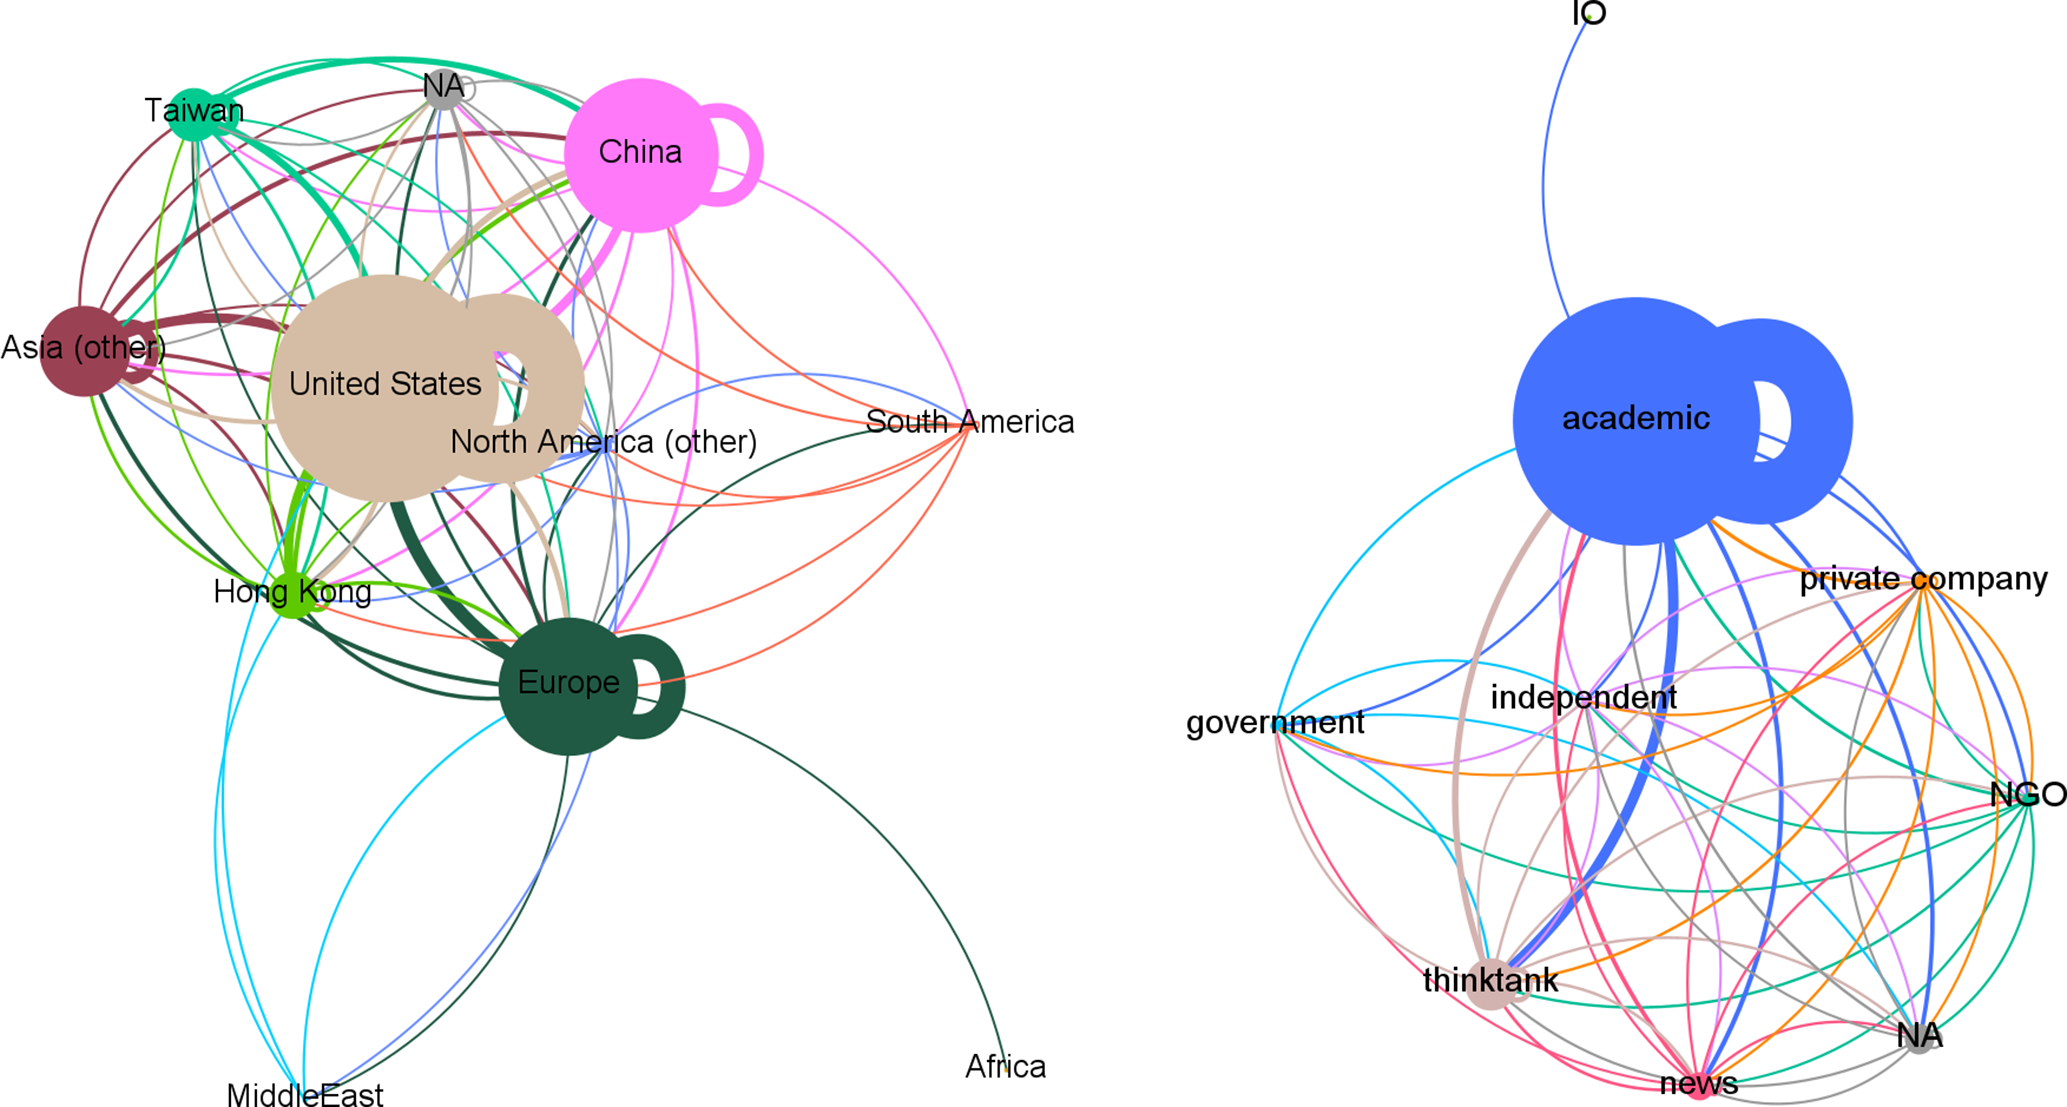
The centrality of the United States and academia is even more striking, as shown in figure 7, in which the nodes are collapsed by geographical region (left) and type of institution (right). Online appendix figures 13 and 14 present the corresponding adjacency matrix, with the cells indicating the percentage of nominations from a geographical region or type of institution in the row corresponding to it in the column. Experts from the largest regions tend to nominate within those regions, but the second-most common region nominated almost always is the United States. For instance, 78% of all experts nominated by US-based experts also work in the United States, whereas 51% of recommendations by China-based experts stay within that community and 31% are for US-based experts. With regard to institutions, academia has a similar dominating role and is always the most commonly nominated work place.
Experts from the largest regions tend to nominate within those regions, but the second-most common region nominated almost always is the United States.
Network of Experts in Geographical Region (Left) or Type of Institution (Right) Nominating One Another
The size of the nodes is proportional to the number of experts; the width of the arcs is proportional to the number of nominations; the color of the arcs corresponds to the sending node; and the arcs follow a clockwise direction. Layout algorithm: Force Atlas 2 as implemented by Gephi.

Homophily in Opinion
The results in the previous section indicate that China Watchers with similar socioeconomic backgrounds are more likely to nominate one another. However, do those connected to one another also think alike? We did not ask our respondents for an assessment of Chinese politics, and a proper answer to this question in any case would require a careful analysis of a diffusion process of opinion (e.g., through social media, blogs, and academic publicationsFootnote 4), which is beyond the scope of this article. However, in 2019, some of the US-based China Watchers signed open letters to the US government regarding its China policy—one published in the Washington Post (WaPo) and a second in the Journal of Political Risk (JPR) (McCourt Reference McCourt2024).Footnote 5 Of the 100 experts signing the “doveish” WaPo open letter, 43 appear in our dataset. Of the approximately 140 “hawkish” experts signing the JPR letter, 9 do. The limited overlap is due mostly to non-China experts who signed these letters—most scholars would consider Joseph Nye and Ian Bremmer (i.e., signatories of the WaPo letter) to be international relations instead of China specialists. The JPR open letter was signed by many current and former members of the US Army, as well as individuals whose credentials as China experts were not immediately obvious (e.g., one individual self-described as a “painter”).
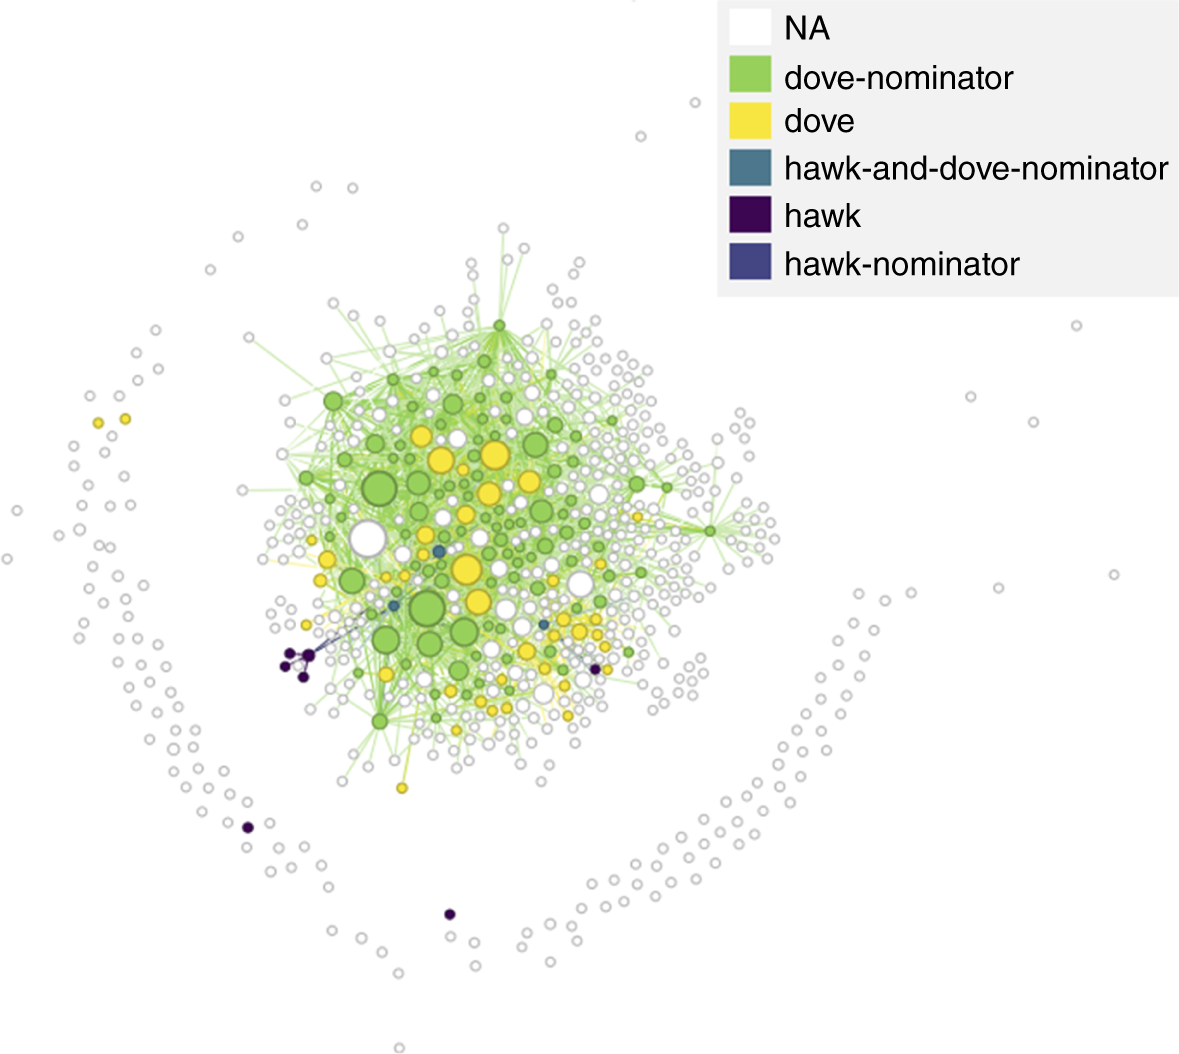
Figure 8 displays the nomination network of US-based China Watchers in our database, indicating whether they signed the WaPo (dove) or the JPR (hawk) open letter; whether they nominated someone who signed one of the two (dove or hawk nominator, respectively); or both or neither. This subnetwork contains numerous isolates, who are the experts that neither nominated nor were nominated by someone based in the United States. Two of the nine hawks were such isolates and the remaining seven form a tight cluster barely attached to the rest of the community (i.e., assortativity=+0.55). The signatories of the WaPo open letter, conversely, were not only more numerous; many also occupy central locations in this network and they have a (weak) tendency to nominate one another (assortativity=+0.10). This is further evidence of echo chambers, particularly within the more hawkish part of this community. However, without additional studies, it is impossible to determine whether this leads to biases.
Nomination Network of US-Based China Watchers
Colors indicate whether the expert signed the Washington Post (dove) or the Journal of Political Risk (hawk) open letter or nominated an expert who did. The size of the node is proportional to the number of nominations overall. Layout algorithm: Force Atlas 2 as implemented in Gephi.

How do we reconcile the marginal position of the hawks in this network with the failure of the “engagement” policy proposed by the doves (McCourt Reference McCourt2024, 3–14)? We suspect that McCourt may be correct in his analysis that the “engagers” have been marginalized in the policy debate. However, they nevertheless seem capable of policing the boundaries of the China-expert community, at least within the United States. Of the 16 individuals who nominated hawks, only four (one of which also was a hawk) were based in the United States, the others work in Asia or Europe. Thus, US respondents largely did not nominate those hawks when queried for experts on current Chinese domestic and international politics. The hawks may agree: only one responded affirmatively to the question of whether they considered themselves to be an expert on contemporary Chinese politics. Another respondent contacted us to state that they were an expert on international relations and the others simply did not complete the survey—perhaps because they had a similar self-image.
CONCLUSION
An analysis of publicly available data of 2,200 experts on Chinese politics worldwide, compiled through a bottom-up snowballing nomination process, reveals that this China Watcher community is globally connected and diverse but also continues to be dominated by male US-based academics. This may change in the future: younger cohorts in our database tended to be more diverse with regard to gender, educational background, and geography.
…younger cohorts in our database tended to be more diverse with regard to gender, educational background, and geography.
Nevertheless, the overall imbalance may be problematic because we also documented a fair level of homophily based on socioeconomic background. This means that experts are more likely to nominate other experts who have a similar background, which suggests that they may not be exposed to the full breadth of information available in the community. By focusing on the US-based subsample of this community and on their signing of two different open letters regarding US foreign policy toward China, we show that this homophily also extends to expressed public-policy preference. In ongoing research analyzing the Twitter/X activity of China Watchers, as well as a series of blog posts (Baranov et al. Reference Baranov, Costello, Deak, Dornschneider-Elkink, Keller, Kelly and Tung2024), we indeed found preliminary evidence of related opinion diffusion.
We plan to investigate the question of echo chambers and group think more carefully using a China Watcher panel survey in which we ask for ex post verifiable predictions and assessments of China’s current political and economic situation, as well as interactions with other China experts. Time-series analysis of these data and possible experimental components will allow us to identify whether such interactions influence China experts’ individual and aggregated conclusions and whether this influence results in a biased consensus.
SUPPLEMENTARY MATERIAL
To view supplementary material for this article, please visit http://doi.org/10.1017/S1049096525101200.
ACKNOWLEDGMENTS
The authors acknowledge the generous funding of the Hong Kong University of Science and Technology Institute for Emerging Market Studies and Taiwan’s National Science and Technology Council (NSTC 112-2410-H-002-110-MY2), as well as the diligent work of countless research assistants, including Urania Juan, Tin Tin Wu, Tara Hung, and Tammy Ting Yin Ng. The authors also thank the discussants and participants at the Swiss Political Science Association’s Annual Congress, the Economic Colloquium at the University of Bremen, the Institute of Communication and Media Studies at the University Bern, the German Institute for Global and Area Studies China Series, and the American Political Science Association China Mini-Conference for their excellent feedback on previous versions of the article.
DATA AVAILABILITY STATEMENT
Research documentation and data that support the findings of this study are openly available at the PS: Political Science & Politics Harvard Dataverse at https://doi.org/10.7910/DVN/DXBNOQ (Keller, Dornschneider-Elkink, and Tung Reference Keller, Dornschneider-Elkink and Tung2025). The editors granted an exception to the data policy for this article. The data and code necessary to produce all tables and figures are available; however, some data categories were aggregated or missing values introduced so that there are at least three individuals in any combination of expressions of the variables. This exception was granted to preserve the unidentifiability of individual subjects in the dataset.
CONFLICTS OF INTEREST
The authors declare that there are no ethical issues or conflicts of interest in this research.




 Open access

