


Impact Statement
The paper presents advanced methodological approaches and applications of state-of-the-art machine learning algorithms for data collection and mapping of agricultural crops widely used in the food and beauty industries, based on remote sensing data. These approaches use qualitative information about the physical properties of the Earth’s surface vegetation, which can appear on satellite and aerial images, and are intended to improve the efficiency of crop mapping, which is usually based on vegetation indices. The proposed methodology of data collection is based on the combined analysis of remote sensing data with statistical and environmental information and can be useful in particular for mapping crops in regions that differ from each other in geographical and environmental conditions.
1. Introduction
There is an extensive literature on methods for crop mapping and estimating yields of the most common and popular crops using remote sensing data over large territories with scarce ground truth data to calibrate models or validate generated maps (Wardlow et al., Reference Wardlow, Egbert and Kastens2007; Brinkhoff et al., Reference Brinkhoff, Vardanega and Robson2020; Zhong et al., Reference Zhong, Wang and Wu2015). Currently, methods for identifying agricultural fields often use knowledge about phenological phenomena, which are unique to a particular crop. PhenologyFootnote 1 is the study of sequential, periodic seasonal events in the life cycle of animal and plant species (such as flowering or leaf fall) and how these events are affected by seasonal and interannual changes in climate and habitat factors. Phenological information is reflected in differences between seasonal variation curves of vegetation indices, such as normalized sifference vegetation index (NDVI) or enhanced vegetation index (EVI), calculated using satellite time series data, and approaches to crop mapping on the basis of this information show quite a high efficiency. Previous studies have shown that such differences are clearly observed for winter and spring crops (Zhong et al., Reference Zhong, Wang and Wu2015; Masialeti et al., Reference Masialeti, Egbert and Wardlow2010; Belgiu and Csillik, Reference Belgiu and Csillik2018).
There are two features, representing phenological information, that are particularly useful for the accurate identification of certain crops. The first one is the crop calendar, the schedule of the crop growing season from the land preparation to crop establishment, maintenance, and harvest. This tool can be applied for the current season or for several consecutive seasons. The second feature is growing degree days (GDD), an important agroclimatic indicator characterizing the limits of favorable thermal conditions for the development of plants during the season. These two features are widely used to supplement information about the onset of a specific phenological phase, which is useful for more accurate identification of certain crops, especially between winter crops, as well as subsequent yield assessments. The most popular and commonly mapped vegetation cover objects in agricultural research are wheat, maize, sunflower, and rapeseedFootnote 2. For example, Roumenina et al. (Reference Roumenina, Atzberger, Vassilev, Dimitrov, Kamenova, Banov, Filchev and Jelev2015) used 100 and 300 m Proba-V data to identify 4 crops (wheat, sunflower, rapeseed, and maize) in Bulgaria; Potgieter et al. (Reference Potgieter, Apan, Dunn and Hammer2007) and Qiu et al. (Reference Qiu, Luo, Tang, Chen, Lu, Huang, Chen, Chen and Xu2017) used enhanced vegetation indices—EVI and EVI2—calculated from MODIS data, to detect fields of different winter crops in Australia and China respectively; Skakun et al. (Reference Skakun, Franch, Vermote, Roger, Becker-Reshef, Justice and Kussul2017) used the MODIS NDVI and GDD information time series to obtain apriori knowledge of wheat vegetation in Kansas (USA) and Ukraine, and to estimate yields.
By the end of the second decade of the 21st century, satellite monitoring and agricultural mapping capabilities had improved significantly with the launch of the Sentinel-1 and Sentinel-2 satellites. These satellites provide unique data in the optical and radar ranges, with average revisit rates of 3–6 days and a high resolution of 10 meters per pixel for optical imagery and 5 meters for radar imagery. These satellites were launched in 2015, allowing us to accumulate significant volumes of data. A large volume of data allows us to analyze the condition and assess the yield of the most important crops. Long time series of satellite imagery quantitatively describe seasonal and long-term changes of vegetation cover, providing rich information for comparative analysis of crop conditions across different years. Such a vast amount of imagery can also serve as training data for accurate yield estimates using ML methods.
At the same time, there is a number of difficulties that complicate the process of mapping agricultural crop fields, as well as many other types of vegetation cover, in an arbitrarily chosen territory for both past and current growing seasons. The most common problem is the lack of data or difficulty in collecting field data, such as information about the presence and characteristics of a specific crop at a particular time interval in a certain area. This can be combined with uncertainty related to annual crop rotation or the young age of trees. Annual crop rotation results in a limited time window and therefore a reduced number of cloud-free images suitable for mapping annual crops, which causes difficulty in accurately identifying crops for a particular year. New or young crop plantings often cannot be distinguished from other crops due to poorly developed vegetation. Collecting such data remains a laborious and expensive task, particularly in areas with poor transportation and road infrastructure. Therefore, the most important goals of land cover mapping are to improve the efficiency and cost of the field data collection phase and search for alternative sources of relevant information about crop growth in a specific region. Other difficulties are related to remote sensing data and arise from the lack of suitable cloud-free and very high-resolution images and the lack of research and statistical information related to the vegetation cover of the study area.
Despite the increasing volume of high-resolution remote sensing data and sources of detailed statistical information, there is a perceptible lack of highly specialized research on vegetation cover and agricultural crop mapping which takes into account not only vegetation indices but also traditional interpretation signs containing qualitative knowledge about the objects. These signs include features, representing spectral and spatial information: color, tone, shape, texture, and dimensions of objects (Jensen, Reference Jensen2007; Lillesand et al., Reference Lillesand, Kiefer and Chipman2015; Labutina, Reference Labutina2004; Gur’eva et al., Reference Gur’eva, Petrov and Sharkov1976). These features allow us to identify crops without additional data collection or to reduce its duration to a minimum.
The contributions of this work are three-fold. First, we explore how the physical characteristics of plants can appear in a satellite image in a natural color or other color band combinations, so that plantings of crops can be reliably identified. Second, we determine the potential range of industrial crops that can be identified on satellite images in different regions in addition to the most popular crops using interpretation signs of satellite images. Finally, we provide an assessment of how accurately crops of interest can be mapped using qualitative information, how it can supplement the methods, based on analysis of vegetation indices, and how efficient are advanced ML algorithms for the accurate mapping of the crops of our interest.
2. Materials and methods
2.1. Subjects of crop detection and mapping
In this work, we investigated several crops, which are widely used in food and beauty industries. We chose crops that belong to different families (Lamiaceae, Rosaceae, and Poaceae) and represent different plant life forms for mapping in order to define the main object interpretation signs and characteristics that contribute to confident identification of the places of cultivation of such crops. We consider lavender (Lavandula angustifolia) in Bulgaria and France, almonds (Prunus dulcis) in the USA and Australia, and winter barley (Hordeum vulgare) in Russia. These crops were selected due to their lower popularity and total area occupied, in comparison to the world’s most widespread or similar analogs.
2.2. Materials
In this paper, we used various sources of information facilitating the further process of identifying plantings of specific crops on satellite images. These sources included reports of state ministries of agriculture and commercial analytical organizations; research papers and cartographic materials; web publications about the cultivation of different crops in specific regions and areas occupied by each crop by administrative unit (Skakun et al., Reference Skakun, Franch, Vermote, Roger, Becker-Reshef, Justice and Kussul2017); the information about the shape and the average size of fields; the information about approximate annual period of flowering and typical harvest dates (Zipper, Reference Zipper2017).
We also used different sources of information, which helped us narrow down the search area of crop fields and plantings. Some of such sources included websites and addresses of organizations, specializing in the production and marketing of related agricultural products, and travel brochures. Other useful sources, that provided us the information about the shape, size, and colour of crop plantings in a given area and the timing of the beginning of different phenological phases in a specific year, were internet blogs; user photos, and videos (Wu et al., Reference Wu, Wu, Zhang, Zeng and Tian2021). For the search and validation of farms, fields, and plantings near settlements, we used Google Maps and other mapping services (Esri, Bing, Mapbox, OpenStreetMap) as well as the Google Street View service. For automatic detection of fields across larger areas, we used multitemporal satellite images of Sentinel-2 obtained from the EO Browser Footnote 3, covering Dobrich Province (Bulgaria), Provence (France), California (USA), Victoria (Australia), and Krasnodar Krai (Russian Federation) for some selected years between 2017 and 2022.
2.3. Data processing
All the information that helps to determine the presence of a specific crop in a particular area using satellite images can generally be attributed to two groups—information on the physical properties of an object (biometric: height and shape of plants, seasonal changes in their colors; shape and size of plantings) and statistical information (the area of the territory occupied by a specific plant species in this region and its dynamics; approximate harvest dates for different crops, etc.). Therefore, the appearance of the plant, the color, shape, and size of the fields are the primary characteristics that are reflected in the satellite image and contribute to the visual identification of agricultural fields and their distinction from natural vegetation, and at the same time, statistical data supplements this information, specifying the growing area and season periods for search fields.
The main visual feature that simplifies the task of identification of fields and plantings occupied by a particular crop on the satellite image is color, which is characterized by the appearance of the plant community, when the dominant plant defines it is color at a certain part of the season. Such visual appearance of the plant community during the flowering period is one of the most effective indicators that could be monitored using satellite images of medium and high resolution (John et al., Reference John, Ong, Theobald, Olden, Tan and HilleRisLambers2020). One of the efficient ways to accurately identify a crop can be to compare the spectral brightness values in the image and digital photographs in the R, G, and B bands of the visible or infrared ranges, taken in the field on dates close to each other or at identical time periods of different years with the same illumination conditions (the same time of day and weather) and by the same phenological phase of the crop, which together result in similar field colors in the satellite images. For more accurate analysis, it is best to choose images that cover the stages of flowering, wilting, harvesting, etc.
For more effective mapping of fields of a specific crop, it is important to understand the patterns of changing geographical and environmental conditions from area to area, which determine the phenology of each specific crop (Yang et al., Reference Yang, Ren, Tao, Ji, Liang, Ruane, Fisher, Liu, Sama, Li and Tian2020). It is also crucial to consider historical, cultural, and economic factors and agricultural traditions that determine the popularity of a particular crop in different regions or countries. These factors can be manifested in individual variations in the appearance and dimensions of plants, different sizes, shapes, structures, and colors of fields, as well as shifts in the timing of harvesting from region to region.
A promising approach to identifying perennial crops and distinguishing similar crops from each other can also be the analysis of differences in the color of plantings at different stages of plant development. On the one hand, satellite images that cover only the period when plants are juvenile, can make it difficult to identify such plantings; but on the other hand, when using time-series images over many years, makes it possible to evaluate how the color of plantings of different crops changes from year to year, which helps to distinguish similar crops from each other. Additionally, the graphs of annual changes and peak values of vegetation indices for several seasons can be analyzed. For example, Chen, Jin, and Brown used Landsat time-series data to determine the planting year and stage of development of almond trees based on the annual maximum values of the NDVI index (Chen et al., Reference Chen, Jin and Brown2019a).
2.4. Visual identification of lavender fields in Bulgaria
Using the proposed methodology, we collected data for three main crops: lavender, almonds, and barley. For the lavender identification task, we selected several growing areas in Bulgaria and France, the world’s leading countries in the cultivation of lavender for perfumery. The primary source of information about areas of lavender cultivation is a map, demonstrating spatial differences in the patterns of distribution of lavender fields. Using the maps of areas, where lavender is cultivated in Bulgaria (Figure 1), it is possible to find out which regions are leaders in lavender production and estimate the share of areas occupied by these fields in relation to the area of all agricultural land. It is also possible to analyze the temporal dynamics of field areas over several years, which will also be reflected in the time series of satellite images through the emergence of new fields or vice versa, rotating lavender with other crops. Therefore, statistical information is an important source of data for tracking changes in areas relative to other crops on spatial and time scales.
Areas (hectares) of lavender fields in Bulgaria in 2017 (A) and 2018 (B) according to the State Fund Agriculture and Ministry of Agriculture of Bulgaria (Vylkanov, Reference Vylkanov2018; InteliAgro, 2019).
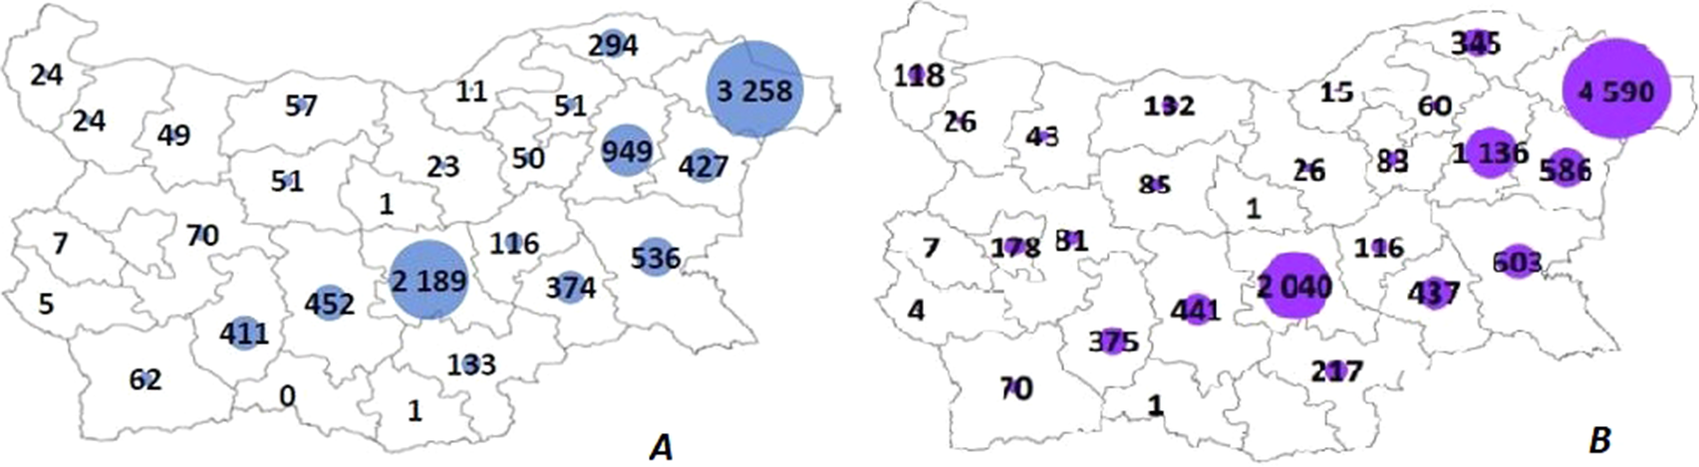
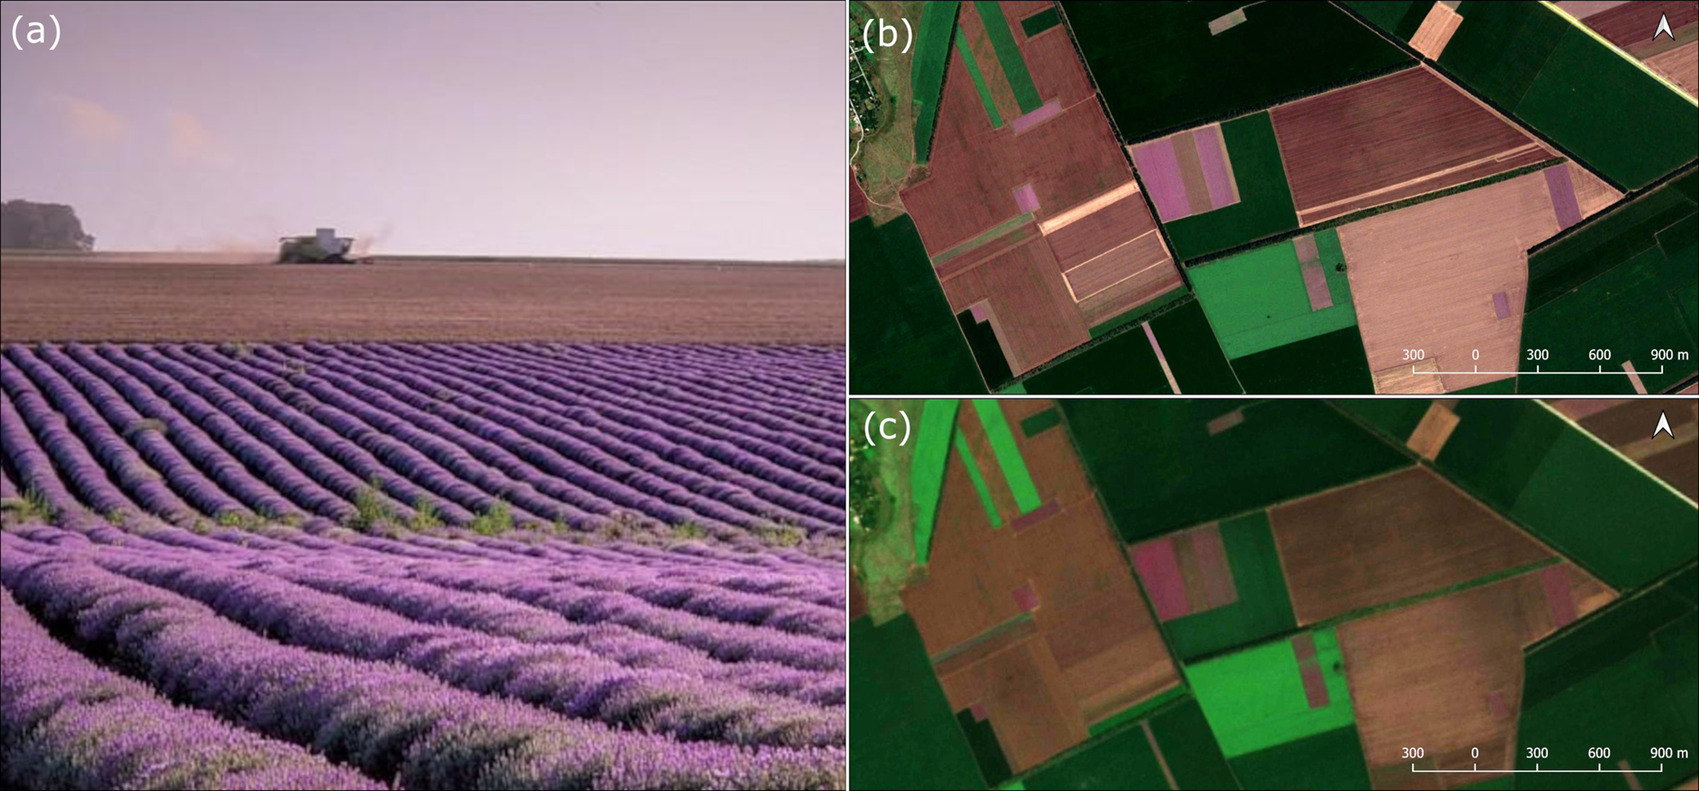
Figure 1 shows the leading region in Bulgaria in lavender cultivation in 2018: Dobrich Province, located in the north-east. In this region, the area of lavender growth increased by more than 1300 hectares within a year (about 30%), making up almost half of the total area under this crop in the country. Another large area of lavender production is Stara Zagora Province (central part), with 2040 ha of lavender fields. In this part, however, the area of lavender fields has decreased within a year by more than 100 ha. Knowing the total area occupied by lavender plantings in these areas in a particular year, we can find all fields in the satellite imagery and investigate how effective a particular feature is for their identification. At the same time, to search for new fields of lavender, to which the total area of plantings increases, as mentioned above, it is useful to determine the characteristics of young plants related to their size and shape, and how these features can appear on satellite images. In this case, to reliably identify new plantings, it could be helpful to use very high-resolution satellite imagery for small areas of the region to find some fine details such as row structure, row spacing and other features that are not visible in the lower resolution imagery. Figure 2a–2c shows the visual appearance of lavender fields in Bulgaria in photos and satellite images.
(a) Lavender field, Dobrich Province, Bulgaria. Photo: (Nedkova, Reference Nedkova2021), (b) lavender fields (purple colors), Dobrich Province, Bulgaria. Google Earth. 02.07.2020, (c) lavender fields (purple colors), Dobrich Province, Bulgaria. Sentinel-2 image, true colors. 26.06.2020
2.5. Visual identification of lavender fields in France
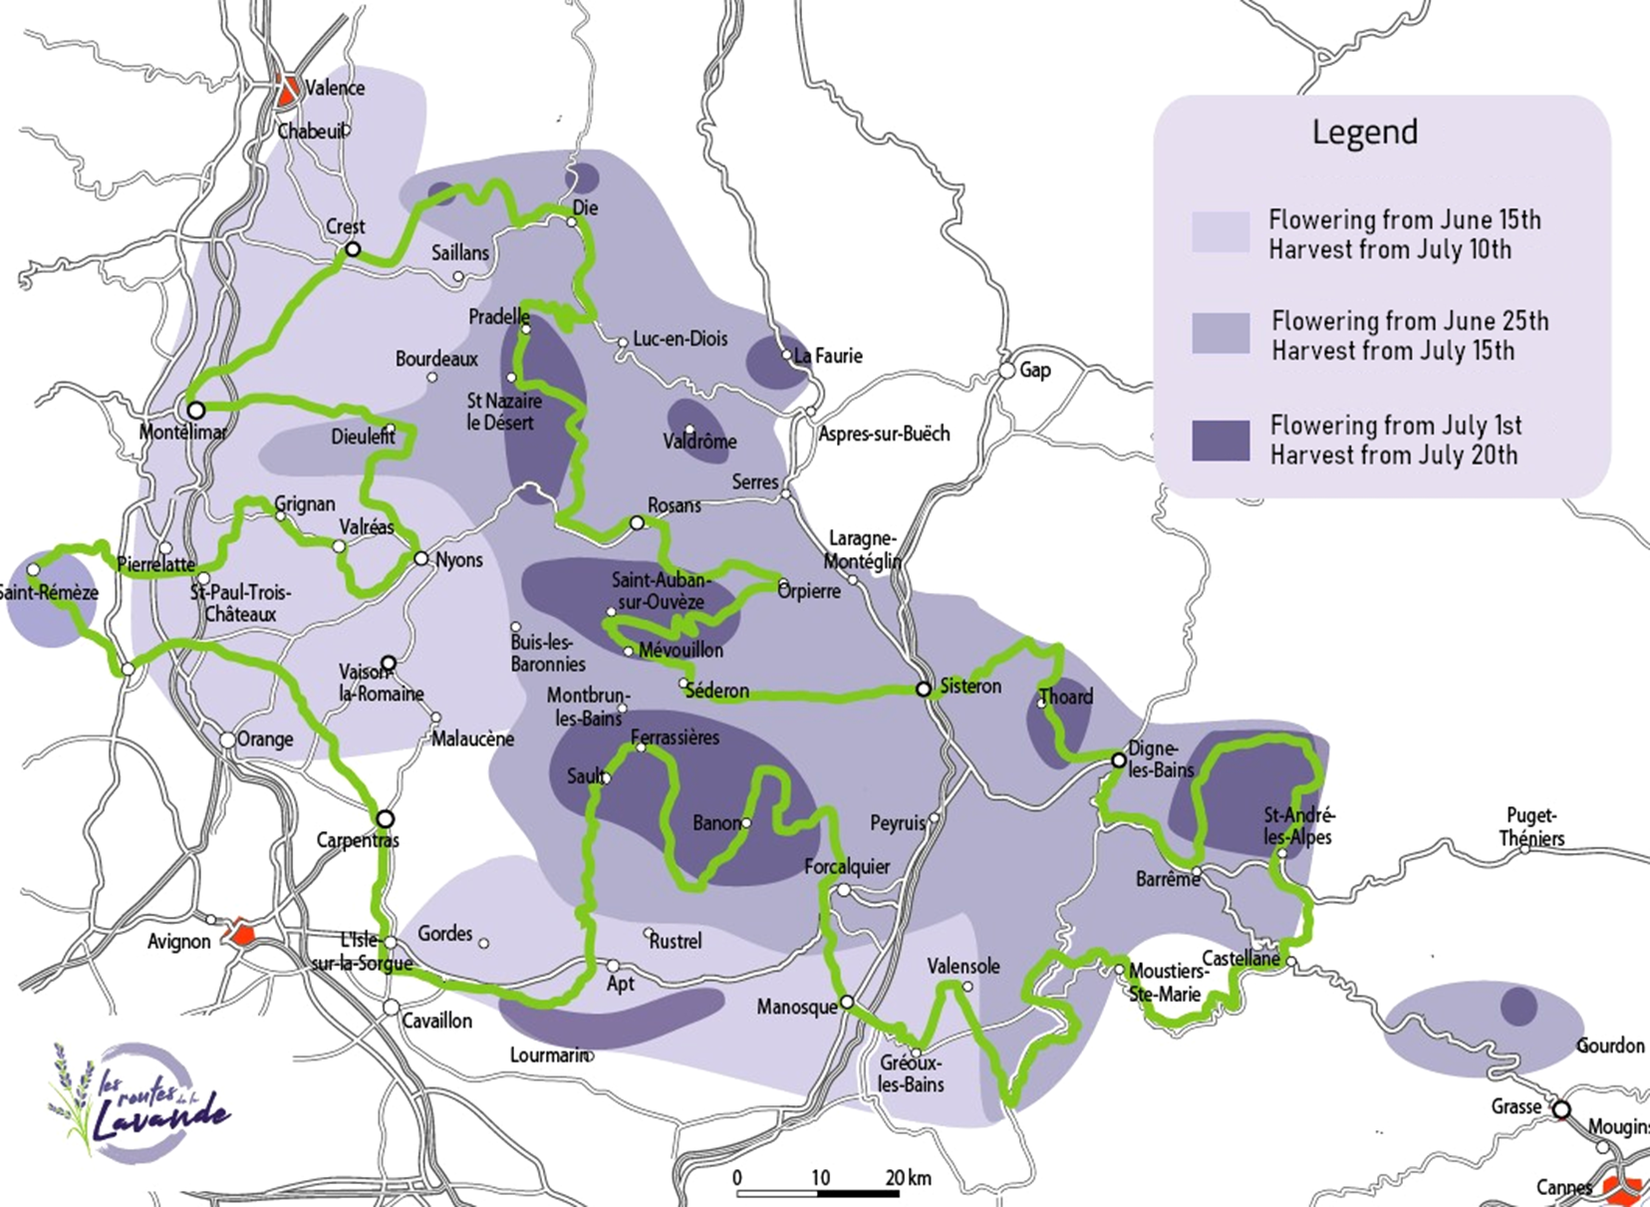
We used maps of tourist routes in lavender-growing areas in Provence to identify lavender fields in France (Figure 3), along with user photographs (Figure 4) and Google Street View, which were used to pinpoint the location of the fields on a high-resolution Google Earth base map.
Map of lavender fields in Provence, France by flowering dates (Bobrowski, Reference Bobrowskin.d.).
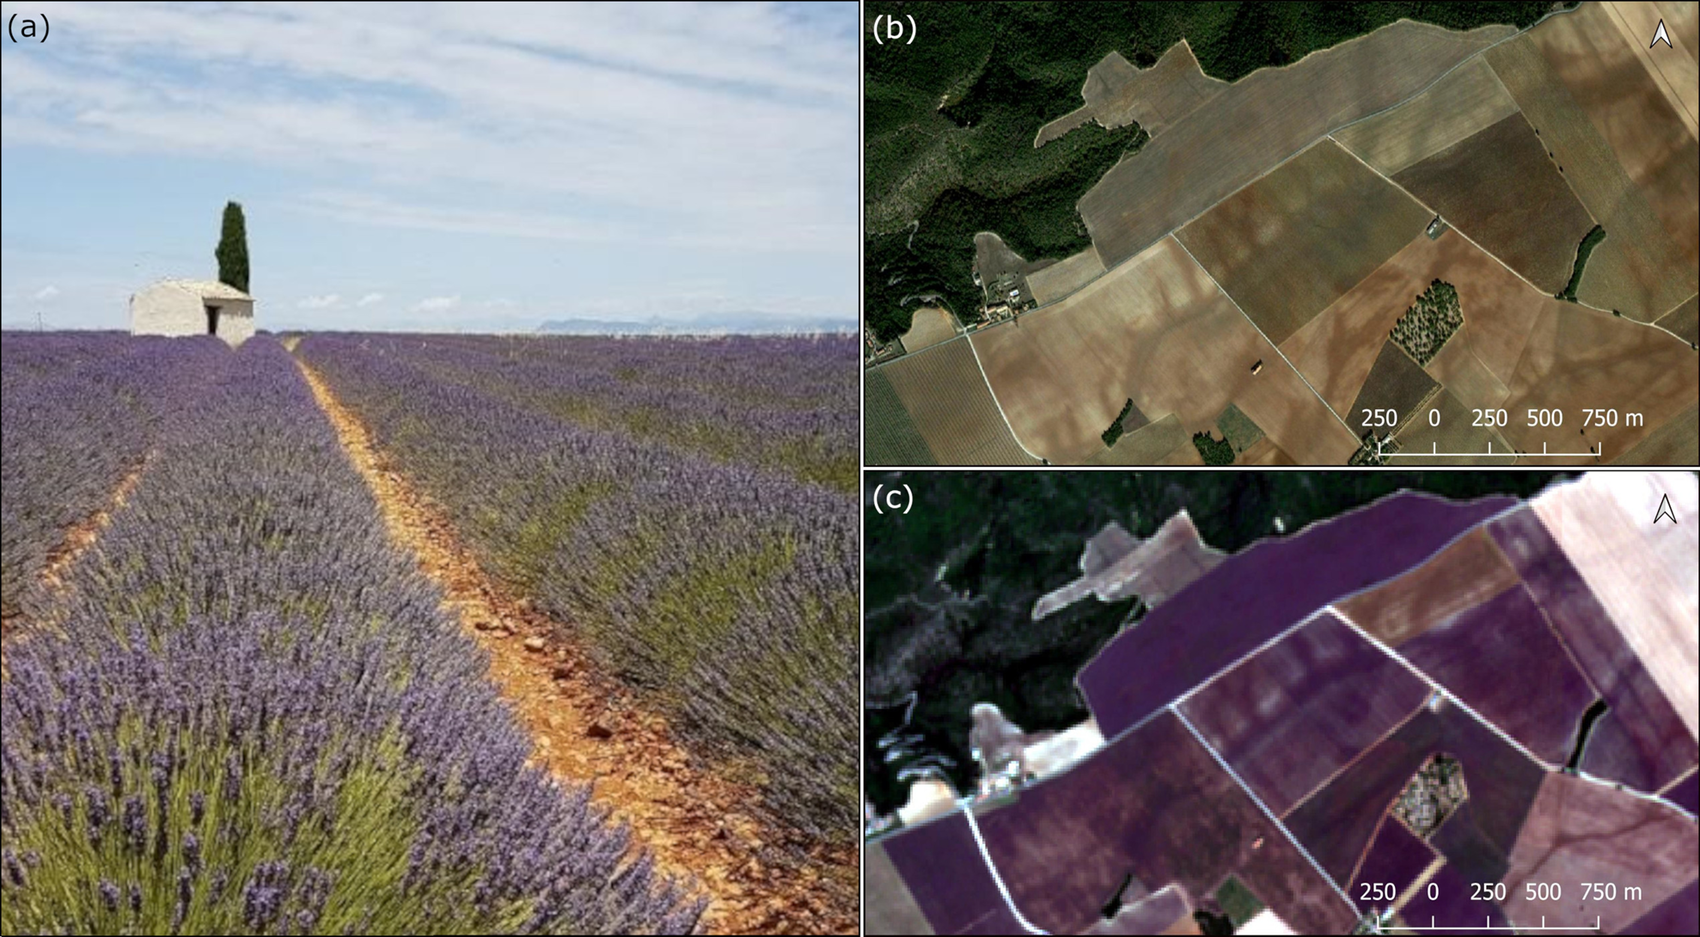
(a) Lavender field, Provence, France. Photo: Anton Gvozdikov, Google Earth, (b) lavender fields (dark-gray color), Provence, France. Google Earth. 03.05.2016, (c) lavender fields (purple color), Provence, France. Sentinel-2 image, true colors. 03.07.2020.
The colors of the lavender fields both in the photograph and in the satellite images of Bulgaria (Figures 2a–2c) are visually close to each other, which gives reason to interpret these fields with high accuracy as lavender. And although during the entire period of lavender flowering, the color of these fields changes from violet to purple, on some dates it is possible to find many similar areas. The average value of the color intensity according to the RGB color model, calculated in a 3 × 3 pixel cell, corresponding to a part of a lavender flower taken from one of the rows in the photograph, is 175, 179, and 170, respectively, which produces a magenta/purple color. In the Google image, the average R, G, and B values calculated on a randomly selected lavender field are 95, 73, 75, and in the Sentinel-2 image—100, 65, 65, that is, these values also make up very close shades of magenta.
The color of lavender fields in satellite images for France differs significantly from the color in photograph (see Figure 4a): for example, in the Sentinel-2 image, it is darker, with a predominance of violet shades, whereas in the Google image, it is lighter than on the Sentinel-2 (Figures 4b and 4c). The Google image clearly shows that the color of the fields is different and not uniform, with bare soil visible between the individual rows of lavender. In general, the prevalence of the “dirtier” violet colors of lavender fields in the Sentinel-2 image for France compared to the purple colors of the fields in Bulgaria can probably be attributed to the mixing of purple and green colors during the harvest season. This may be due to the local traditions of lavender cultivation, which manifests themselves in the selection of lavender varieties suitable for local climatic and soil conditions, as well as the larger average field size and possibly wider row spacings compared to those in Bulgaria (by simple GIS-based measurements, we found that the average area of an individual lavender field in the Dobrich Province of Bulgaria equals 3.6 ha, whereas in Provence the average area of the field is almost twice higher—6.9 ha).
2.6. Visual identification of almond orchards in the USA and Australia
We chose almonds as a second test crop to understand the problems of tree crop planting mapping. The location of the almond orchards was taken from advertisements and catalogs for the sale of the orchards in the United States.
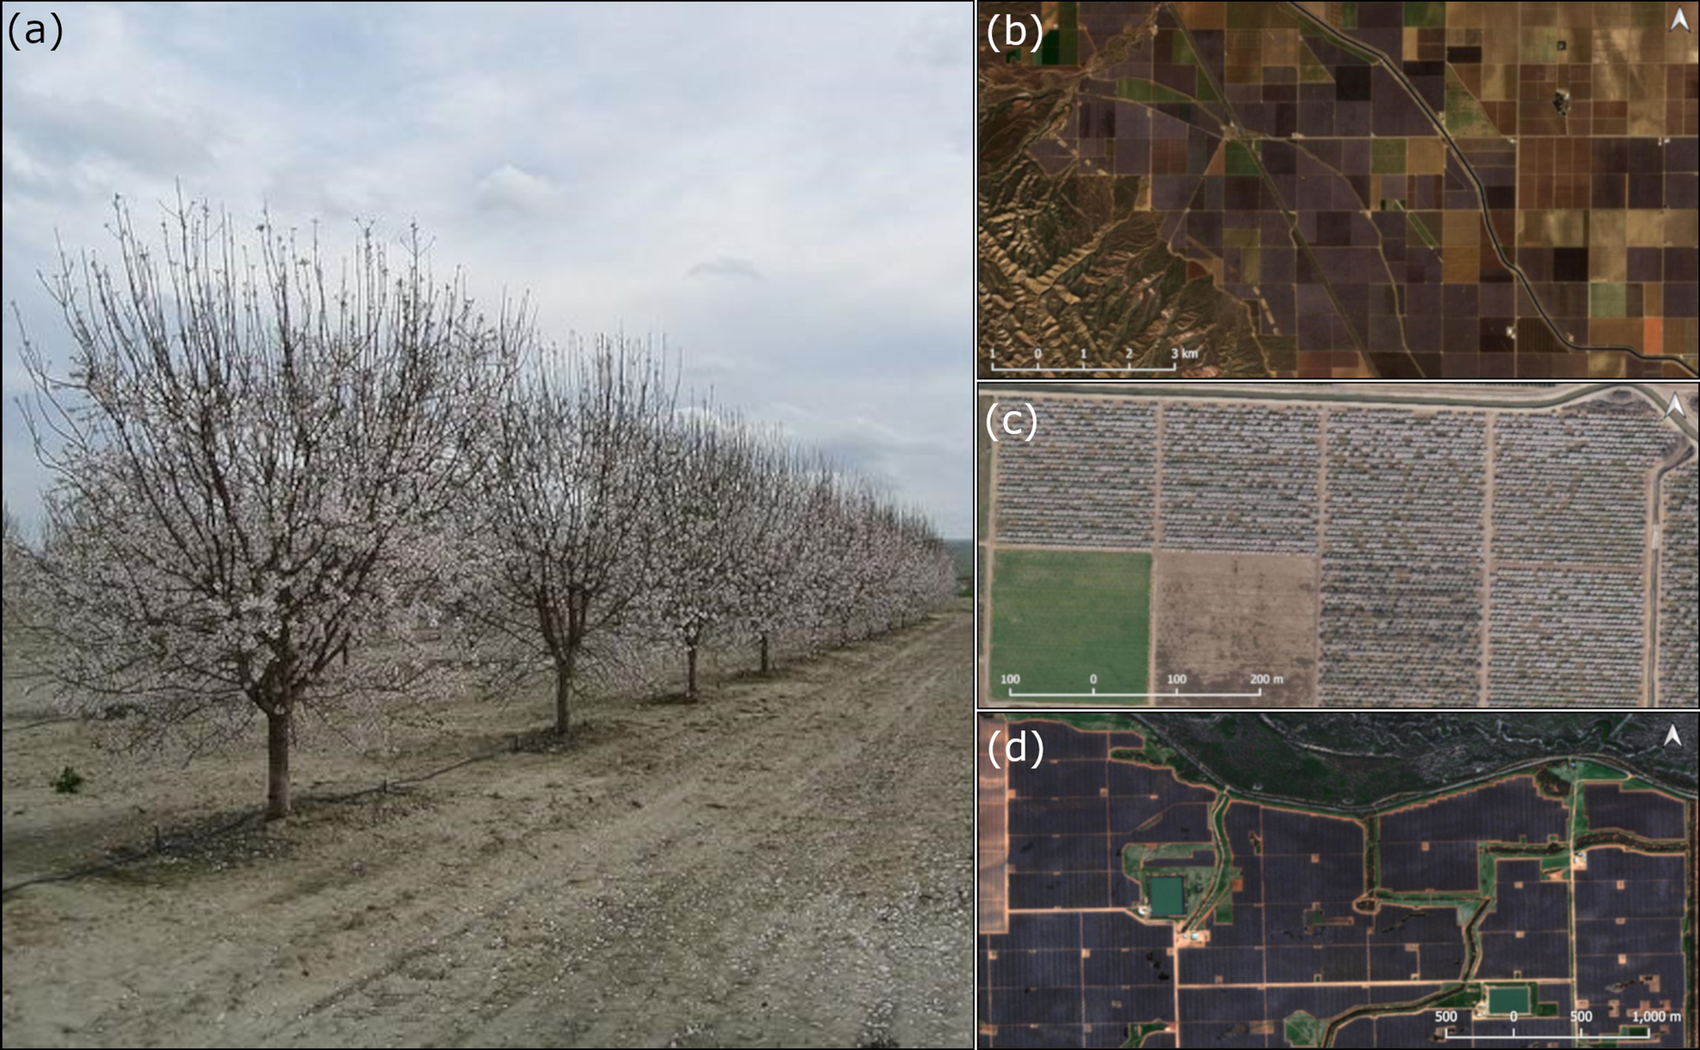
The color of almond orchards during the bloom period is visually similar to the color on the photograph (Figure 5a) and satellite images (Figures 5b and 5c). However, the color of blooming mature almond trees cannot be the only feature that allows the identification of almond orchards of all ages. Since almonds begin to bloom and bear fruit only a few years after they were planted, it is also necessary to search not only for mature trees but also for all new plantings of young trees using statistical information. That means that, by knowing the total area of almond plantings in any territory, we can try to find all plantings of both young and adult trees of all possible varieties. For example, the total area of bearing and non-bearing almonds in California in 2020 amounted to 1.6 million acres, while in the previous season (2019) it was 1.52 million acres (USDA, 2021), that is, it increased by 80,000 acres. At the same time, the area of non-bearing almonds has increased by more than 10,000 acres compared to 2019. The methodology for the identification of young non-bearing almond plantings implies the use of a different method based on the vegetation indices, which will be discussed in a special section of this paper. The approach mentioned above was also applied to the visual identification of almond orchards in Australia—the leading country in commercial almond production in the Southern Hemisphere (Austrade, 2022). This location was selected arbitrarily as an area for which the information about the exact locations of the several largest almond farms in the area, as well as photos of the orchards and dates of the approximate bloom period, was publicly available (Almond Board, Reference Board2023). Finding out the approximate timing of almond bloom in Australia (from late July to early September) made it possible to determine the area occupied by its orchards near the known places of its cultivation. The “striped” texture of the objects, which were identified in the image as crop plantings (Figure 5d), also helps to conclude that these objects are orchards. In general, the texture of the orchards allows easy manual and automated (with Machine Learning algorithms) identification on satellite imagery.
(a) A blooming almond orchard in California, USA. Photo: (Columbia Climate School, 2018), (b) blooming almond orchards in California (gray-brown color shades), USA. Sentinel-2 image, true colors. 16.02.2018, (c) blooming almond orchards in California, USA. Bing Maps, (d) blooming almond orchards in Victoria, Australia (dark violet and light violet color shades). Sentinel-2 image, true colors. 21.08.2022.
2.7. Visual identification of winter barley fields
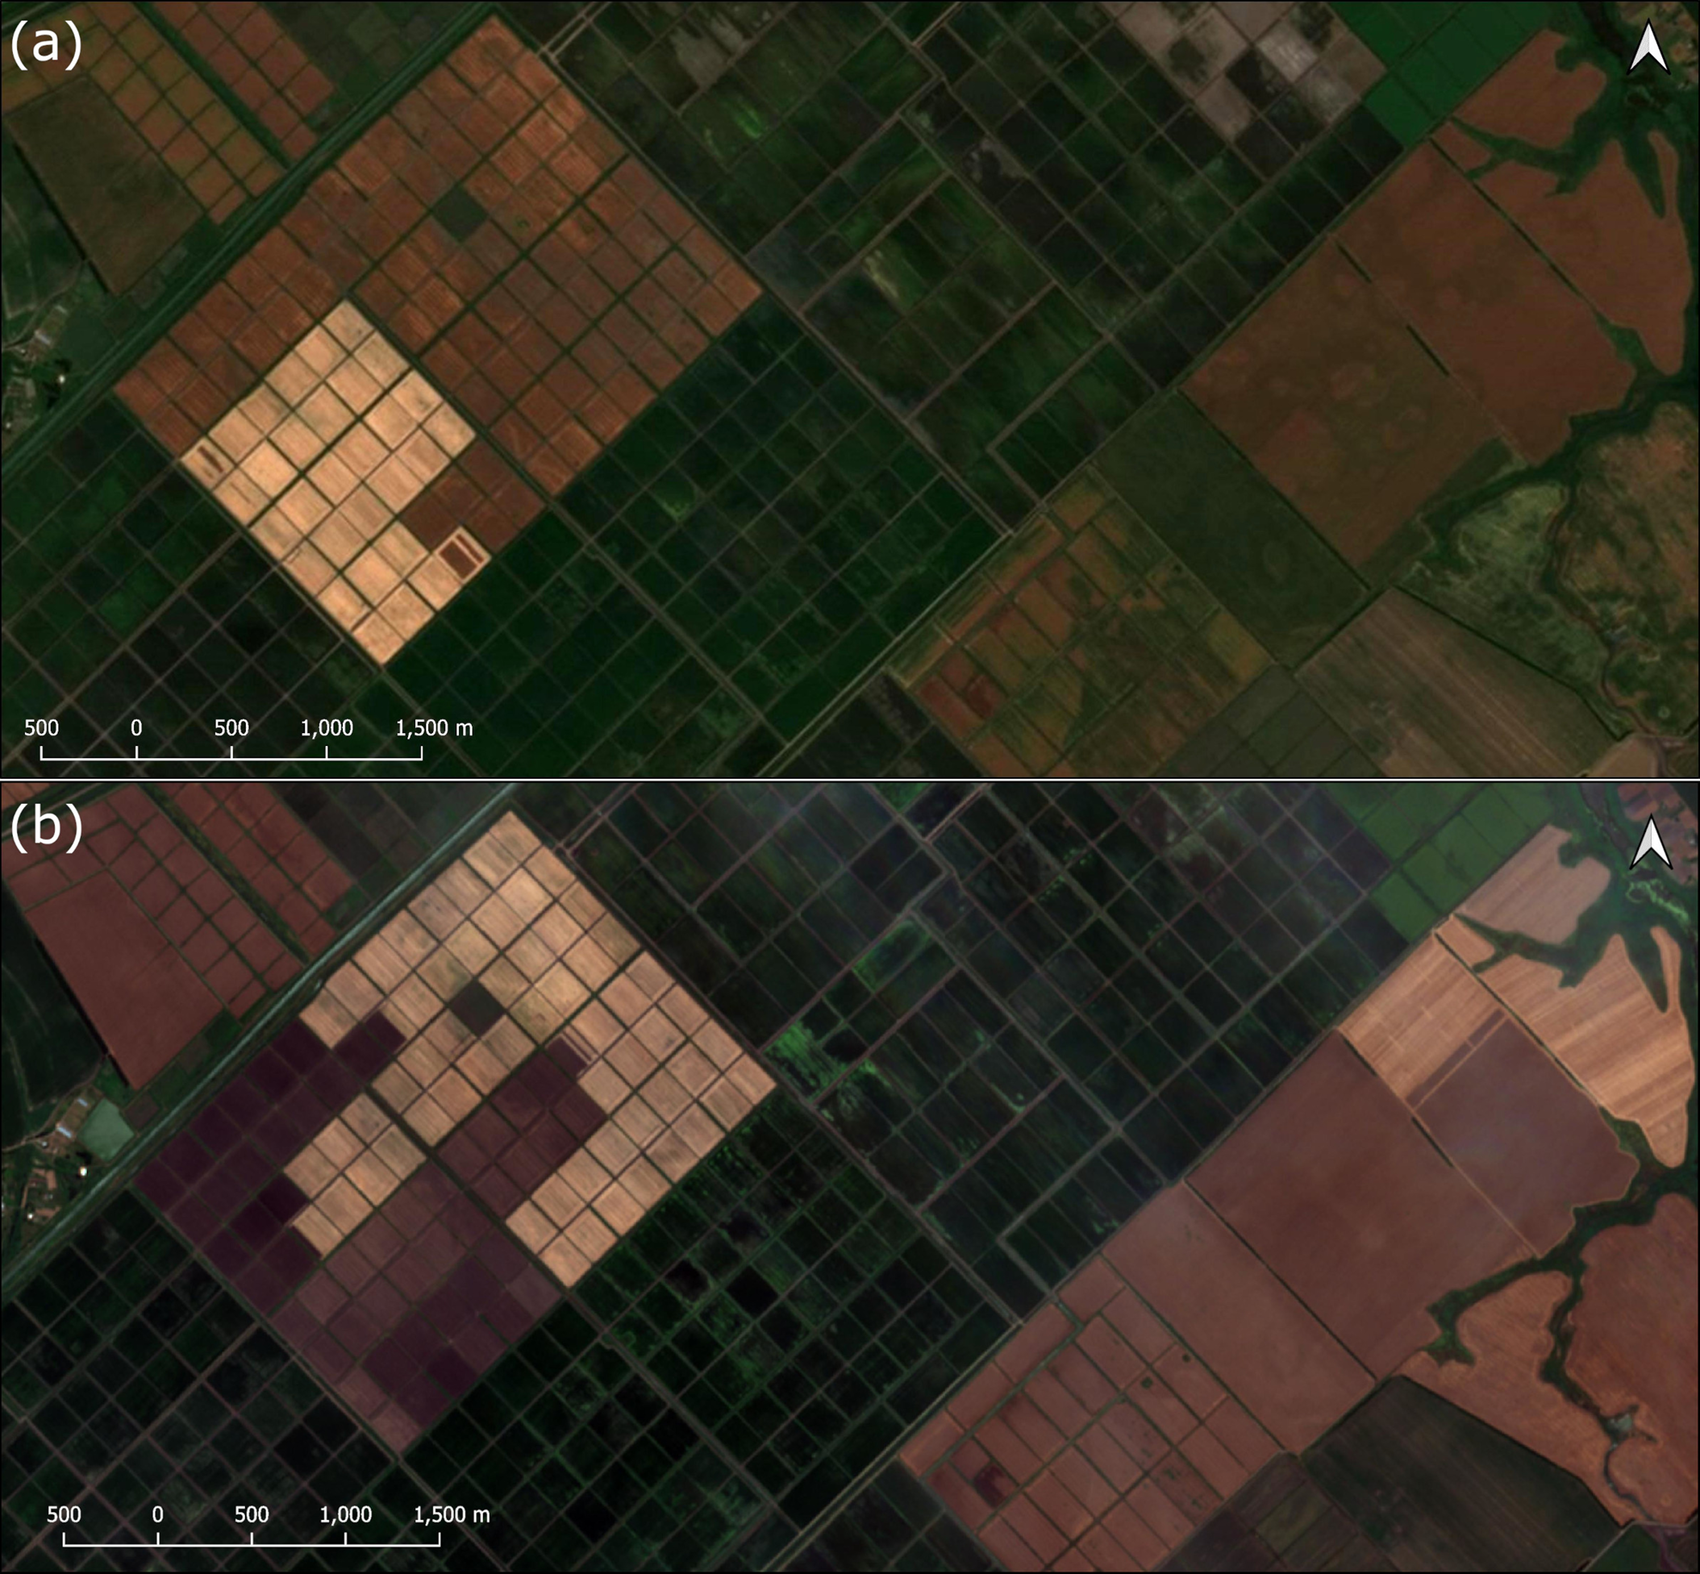
Our choice of winter crop type was winter barley: we analyzed the dynamics of harvested areas of winter barley during the 2018–2019 season in Krasnodar Krai, Russia. According to the dates of publication of articles in local online newspapers, the stages of the beginning, middle, and end of the harvest, as well as the area of the harvested areas on the corresponding dates, were quite clearly traced. For example, on 10.06.2019, the “VK Press news” agency announced the upcoming beginning of the barley harvest (Bezruk, Reference Bezruk2019), and on 28.06.2019, an article was published in “Yug Times”, which announced the completion of the barley harvest at 100% of the sown area (Yug Times, 2019), that is, 136,900 ha (see Table 1).
Dates of publications on the progress of the harvest in the Krasnodar Krai and the percentage of harvested fields of winter barley and wheat for a given date (% of the total area of crop fields and hectares)
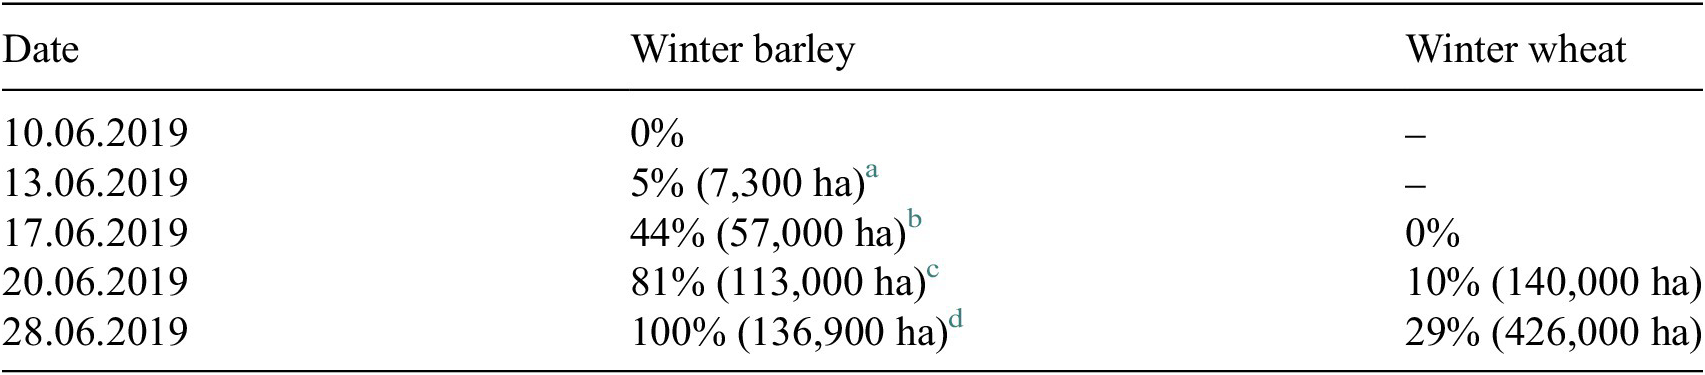
Figure 6a shows the beginning and Figure 6b shows the end of barley harvesting in the Krasnodar Krai in the second and third decades of June.
(a) Sentinel-2 satellite image, true colors. 15.06.2019. The harvesting of winter barley in the region started on 10.06-11.06.2019, the barley fields are in light and orange-brown color shades. Ripening wheat fields are shown in green-brown shades. Krasnodar Krai, Russia; (b) Sentinel-2 image, true colours. 28.06.2019. The harvesting of winter barley in the region is officially over and the fields are being prepared for the next season (left part of the image). Wheat harvesting continues, its fields have gray-brown shades. Krasnodar Krai, Russia.
To improve the efficiency of the considered approach, more frequent high-resolution time-series images are required, for example, on a daily basis. To increase the reliability of field detection, it is also necessary to have additional data on all varieties of barley grown in a given territory and the differences in their vegetation (growing degree days, precipitation requirements, etc.).
2.8. Additional steps. Auxiliary calculated vegetation indices
Often, plantings of the crop of interest need to be distinguished from the more important and popular crops. If it is a perennial crop, in order to distinguish it from annual crops it is necessary to determine the age of planting. In this case, there are often not enough single images, and it becomes necessary to detect fields using additional methods based on long time series of satellite imagery. Vegetation index analysis is one of the most commonly used approaches to solve the problem of distinguishing between crops.
When comparing the curves of vegetation indices, it is also necessary to take into account the ecological growing conditions of each crop and its individual varieties in a given territory, which is manifested in the difference in the dates of the onset of each subsequent phase of plant development, causing differences in the time of the beginning and end of the harvest. This data must be compared with statistical information, as well as with the percentage of the area occupied by the crop of interest versus the entire area of the region and “secondary” crop in the area (e.g., winter barley vs winter wheat), as well as the dynamics of the area of fields in different years. As an example, the average per field NDVI values, derived from Sentinel-2 images, were calculated for several almond orchards–for bearing (Figure 7a) and non-bearing orchards (Figure 7b).
(a) NDVI for bearing almonds’ orchard for the 2017–2020 period in California (source: EO Browser Sentinel-Hub), (b) NDVI for non-bearing almonds’ orchard in California for the 2017–2020 period (source: EO Browser Sentinel-Hub). The NDVI values for each date were calculated as the average of the index values for the entire field.
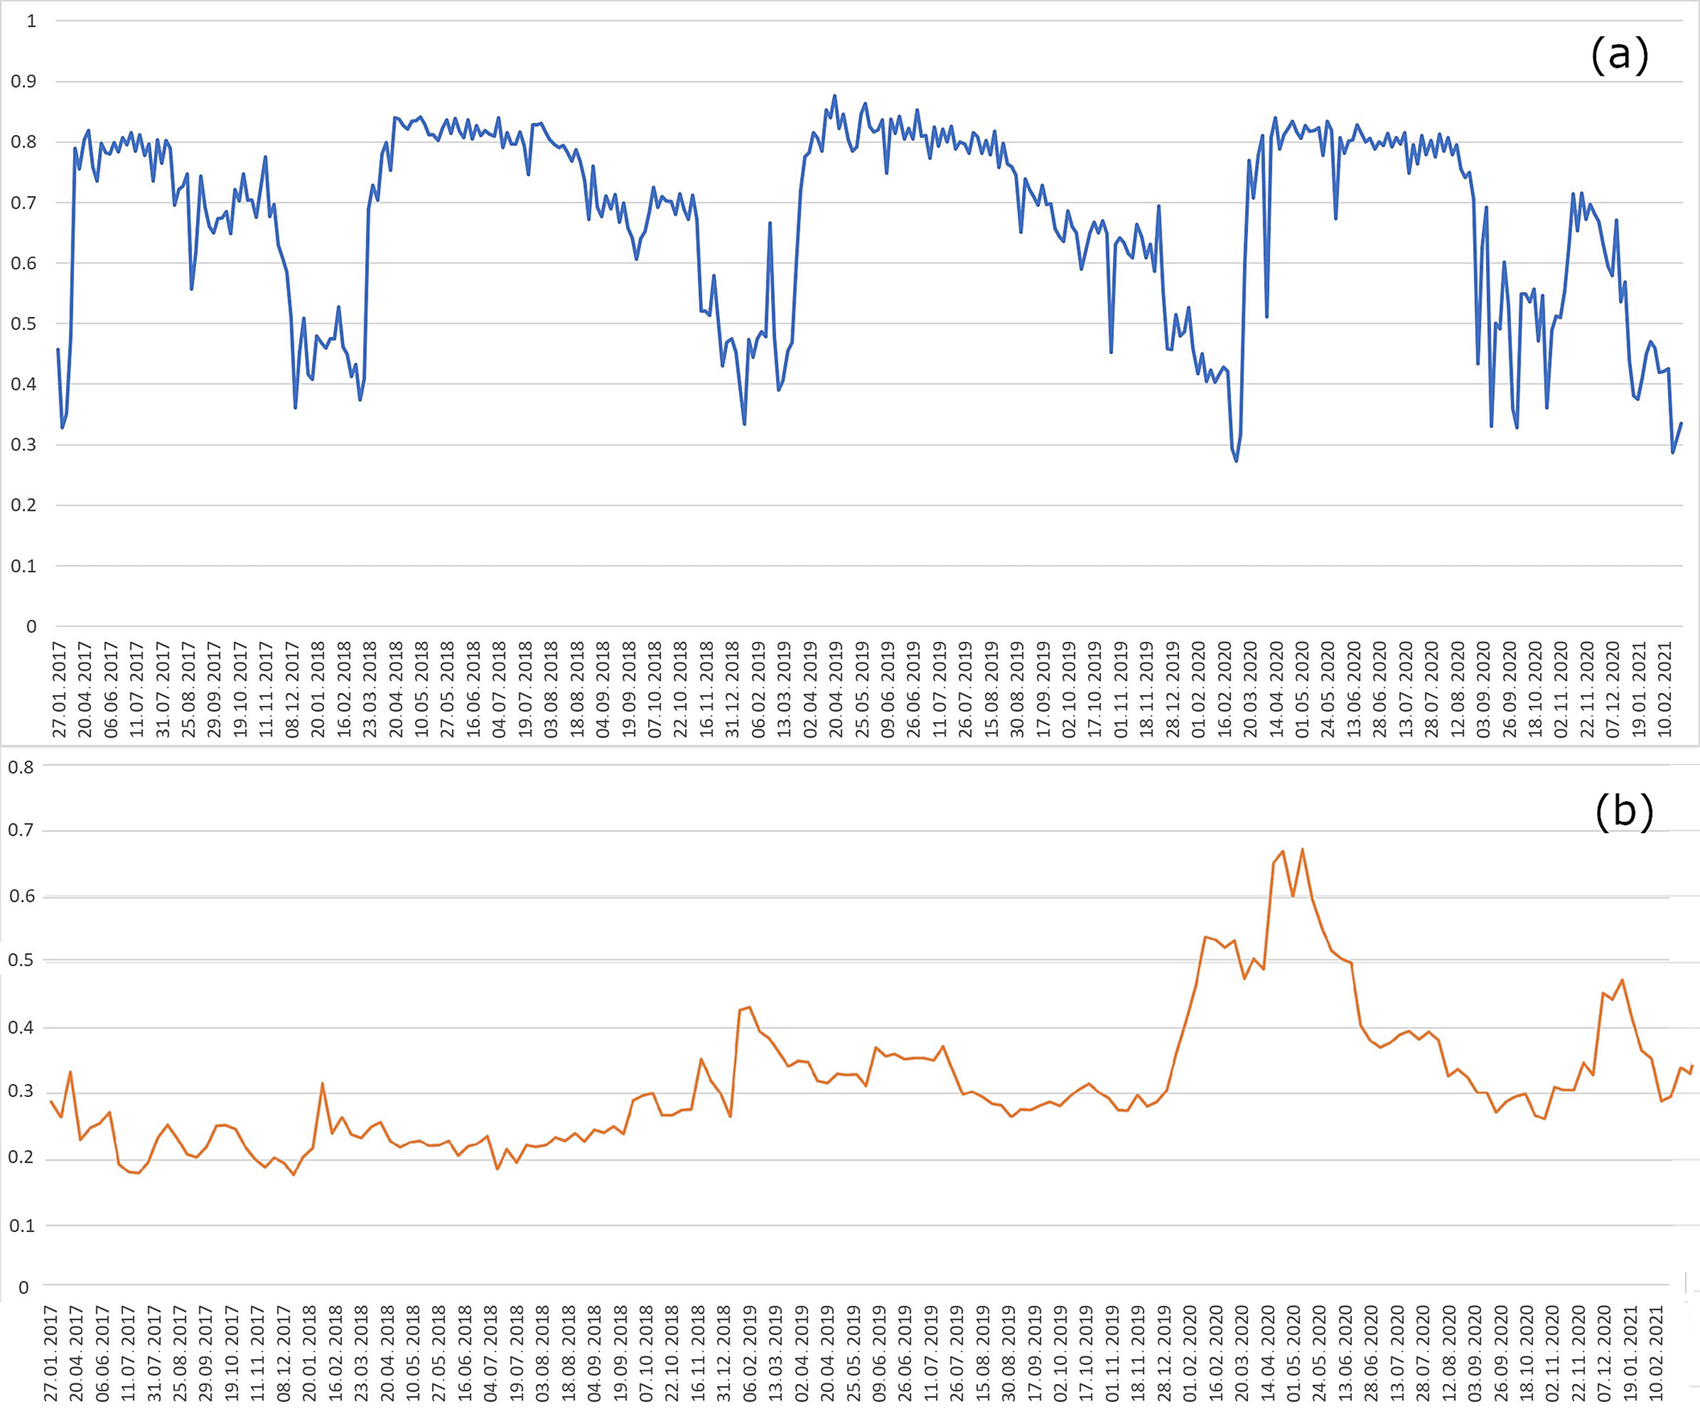
The graph in Figure 7a has a unique shape for bearing almond orchards, and the segments of the graph, in which the index has maximum and minimum absolute values, represent the dates of the onset of a particular annual phenological phase (for example, dormancy from November to February or blooming from February to mid-March).
If we look at the graph in Figure 7b, we can see that the maximum annual absolute values of NDVI on this orchard tend to increase each year from the smallest values (0.2–0.3) to about 0.7, which means that a tree perennial crop is growing in this field, the total biomass of trees tends to increase every year, which would be significantly different from the NDVI curves for fields of annual crops, on which there is a constant crop rotation, with an annual change in the shape of the curves. In general, to solve the problem of detecting fields of perennial crops, an important step is to search for areas where such changes have occurred, based on a clear change in the color of the field in the spring-summer period, which can occur due to the regular change of annual crops in the process of crop rotation or complete plowing of the field and planting of perennial crops. To distinguish the field of perennial crops from fields of similar crops, it is useful to use satellite images with a large number of spectral channels. For the detection of a specific annual crop growth stage or a phenological phase, more specialized indices are often used that can characterize the phenology of different crops. For example, Chen, Jin, and Brown used the enhanced bloom index to study the phenology of almonds in California (Chen et al., Reference Chen, Jin and Brown2019b).
3. Description of the dataset
The results of the proposed approach can be used on a large scale (e.g., an administrative unit or a country) as a set of training samples for one of the algorithms that use ML methods for automatic identification of the fields. Neural networks and, specifically, semantic segmentation methods are widely used for the task of automatic classification of satellite imagery (Mou et al., Reference Mou, Ghamisi and Zhu2017; Hong et al., Reference Hong, Han, Yao, Gao, Zhang, Plaza and Chanussot2022; He et al., Reference He, Zhou, Zhao, Zhang, Yao and Xue2022; Vaze et al., Reference Vaze, Foley, Seddiq, Unagaev and Efremova2020; Cai et al., Reference Cai, Guan, Peng, Wang, Seifert, Wardlow and Li2018). However, as we mentioned earlier, gathering a sufficient amount of data for image classification with neural networks is a time-consuming and laborious process. The method, proposed in this paper, allows fast and easy data collection for such tasks. To demonstrate the high performance of the proposed approaches we attempted to identify and map two industrial crops—lavender and almond in different geographic regions.
First, we visually identified all lavender fields in Bulgaria’s leading lavender cultivation region, Dobrich Province, in 2019. We mapped 7,734 hectares of lavender fields using cloud-free Sentinel-2 satellite images on two summer dates (26.06.2019 and 02.07.2019) on the basis of a “true color” band combination. We also checked the validity of the identified fields using Google, Esri, and Bing base maps. According to the publications, it was officially declared that the area occupied by lavender in Dobrich Province in 2019 was 7,223 ha (Agri.bg, 2019).
Second, we checked our approach for the identification of almond plantings in the United States. We visually identified and mapped 70,439 ha (173,943 acres) of almond orchards in the leading region by almond acreage in the USA—Kern County, CA—as of the 2018 year using cloud-free Sentinel-2 images on two dates (21.02.2018 and 08.03.2018). We checked the validity of the identified fields using Google, Esri, and Bing base maps. We compared the results of identification with the officially reported estimate, which was 65,269 ha (USDA, 2019) and with the USDA Cropland Data Layer for 2018. While the Cropland Data Layer is claimed to have very high user accuracy of identification of almond fields for California—97.2% (USDA, 2018), the proposed approach may provide slightly less accuracy, but it is based entirely on data that is publicly available.
The accuracy of the visual identification can be significantly increased if we use a set of very high-resolution images (e.g., WorldView-3) on a small patch of land with relatively uniform geographic conditions.
The collected dataset consists of two parts. The first part includes the vector GIS files, containing all lavender fields in Dobrich Province (Bulgaria) and in Valensole Commune (Provence, France) as well as all almond fields in Kern County (USA) and the fields on several large farms in Victoria (Australia) respectively. The second part consists of the fragments of Sentinel-2 images and binary masks of lavender and almond fields in the regions mentioned above.
After collecting the data, we conducted experiments with the automatic identification of lavender and almonds for other geographic regions: France and Australia respectively. For this task, we developed several ML models using the data obtained as the result of visual identification of fields (see Section 4.1).
4. Application and results
4.1. Semantic segmentation of lavender fields
This section briefly discusses the methods we used for automatic field segmentation and provides a comparison of these frameworks for the lavender and almond segmentation tasks.
We used the approach, proposed in Section 2.5 for ground-truth data collection of lavender field data. We downloaded the Sentinel-2 satellite images for the flowering period (June-July) over the entire province as described above. This imagery was used to create masks for the training and testing datasets (Figure 8A). We explored a variety of state-of-the-art models to perform a semantic segmentation task on the resulting dataset.
A - Sample data, prepared for the task of semantic segmentation of lavender fields in Bulgaria. Source: Sentinel-2. (a) original Sentinel-2 12-band stack image (true colors), (b) binary segmentation mask. B - Results of lavender segmentation in Bulgaria. (a) Random Forest, (b) U-Net, (c) ModSegNet, (d) UNet++, (e) ResUnet.
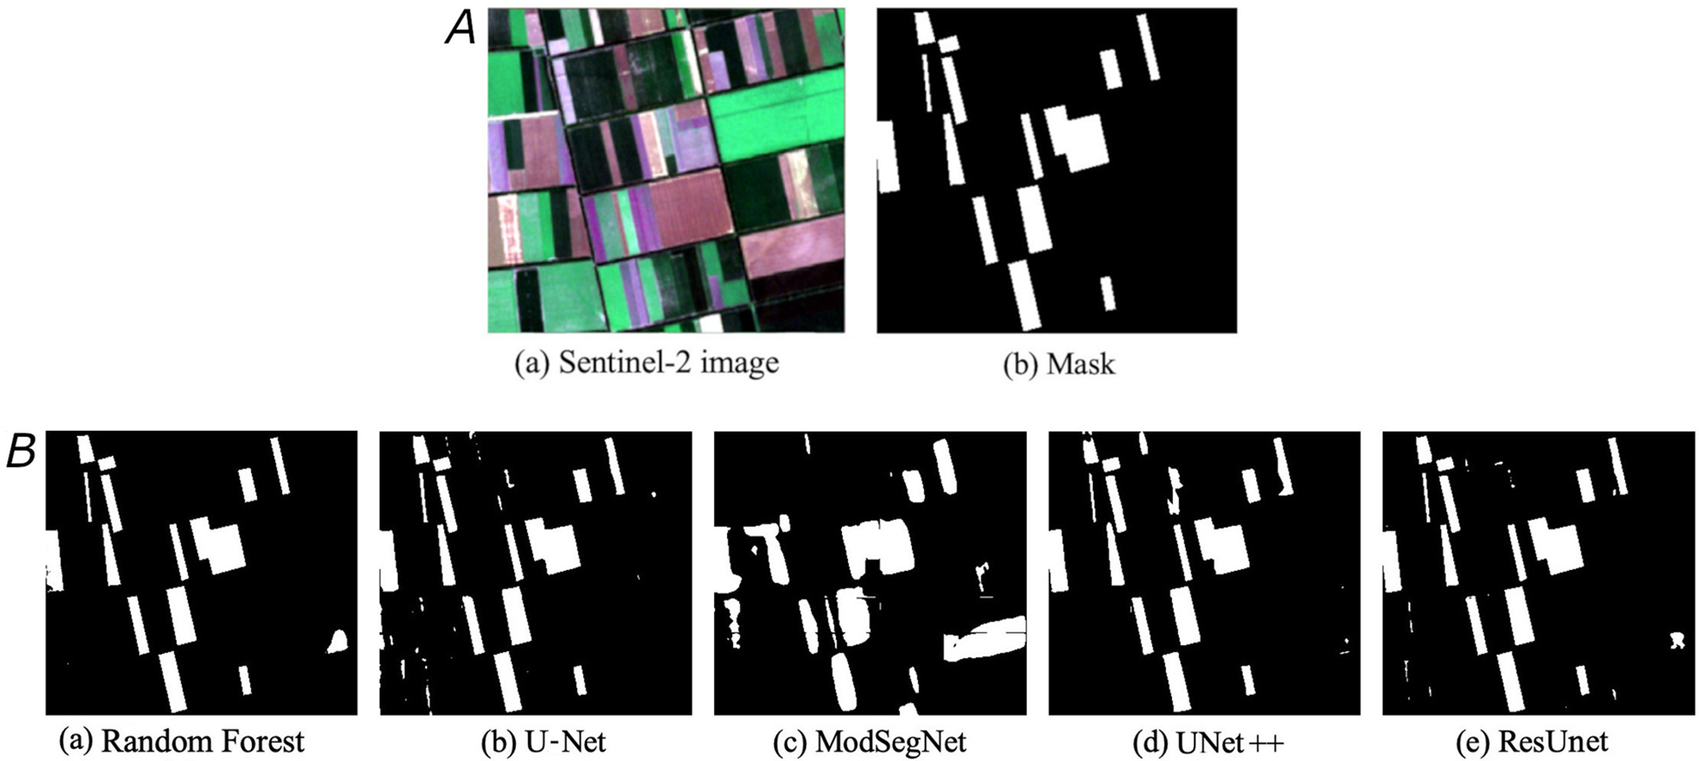
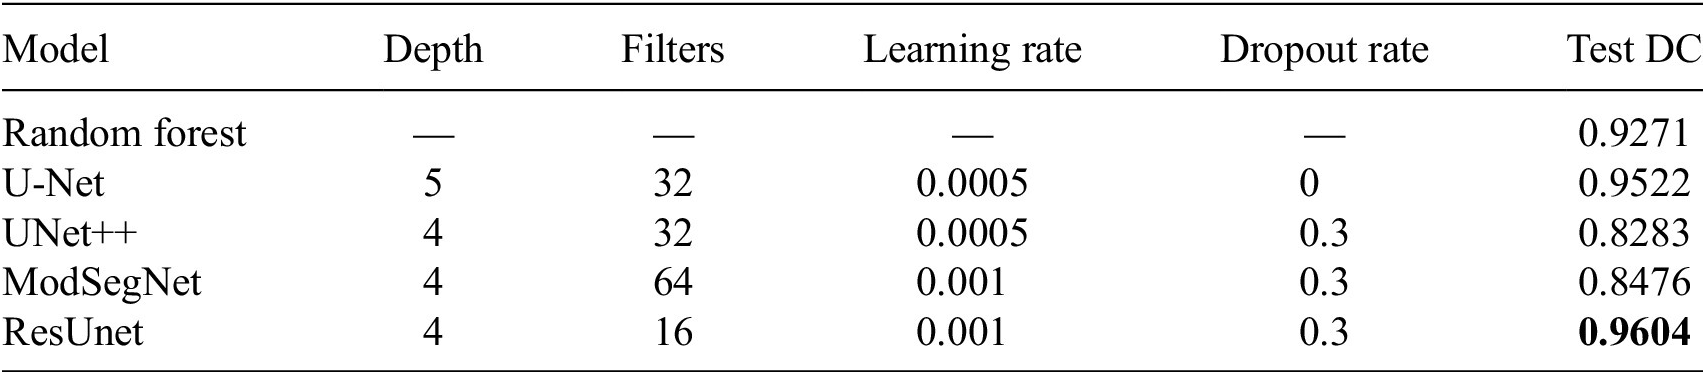
As the inputs of the U-Net model, we used 12 bands of Sentinel images, complemented with manually calculated vegetation indexes (in this case, we used the NDVI index, added as an additional layer to the input data). As a baseline method, we used Random Forest (Breiman, Reference Breiman2001). We explored the majority of the state-of-the-art semantic segmentation methods: U-Net (Ronneberger et al., Reference Ronneberger, Fischer, Brox, Navab, Hornegger, Wells and Frangi2015), UNet++ (Zhou et al., Reference Zhou, Rahman Siddiquee, Tajbakhsh and Liang2018), ResUnet (Zhang and Liu, Reference Zhang and Liu2017), and ModSegNet (Barros et al., Reference Barros, Conde, Gonçalves, Premebida, Monteiro, Ferreira and Nunes2022) models. We explored the range of parameters, including learning rates, number of filters, and dropout rates. Our experiments included various U-Net model hyperparameters: 16 or 32 filters, and various dropout rates. ResUnet uses key features of both U-Net and ResNet models, where deep U-shape architecture combines with residual connections, preventing the vanishing and exploding of the gradient. We tested several models with 16 or 32 filter numbers, 0.0005–0.001 learning rates, and a range of dropouts. While training U-Net models, we tested different numbers of filters (16/32), and dropout rates (0/0.3). Larger dropout or larger number of filters did not always provided higher dice scores. In ResUnet architectures, we also did not find the correlation between dice and the number of filters (16/32), or dropout (0/0.3) (Table 2). The results demonstrate that the differences between the applied models’ performance are relatively small. Visual assessment of models’ performance showed that many of the tested models can be used for land cover segmentation. The best-performing model for lavender segmentation with Dice coefficient 0.9604 was ResUnet on Sentinel-2A product.
Semantic segmentation results for lavender fields
Semantic segmentation results for almond fields

The Dice coefficient is defined as
 $$ \mathrm{DC}=\frac{2\mid A\cap B\mid }{\mid A\mid +\mid B\mid }, $$
where A is a set representing the ground truth and B represents the computed segmentation (Crum et al., Reference Crum, Camara and Hill2006). Both images (sets) are binary with values ‘0’ or ‘1’ at each of their pixels. In segmentation tasks, Dice Coeff (Dice loss = 1 − Dice Coeff) is used as a Loss function.
The segmentation results are displayed in Figure 8B.
4.2. Semantic segmentation of almond orchards
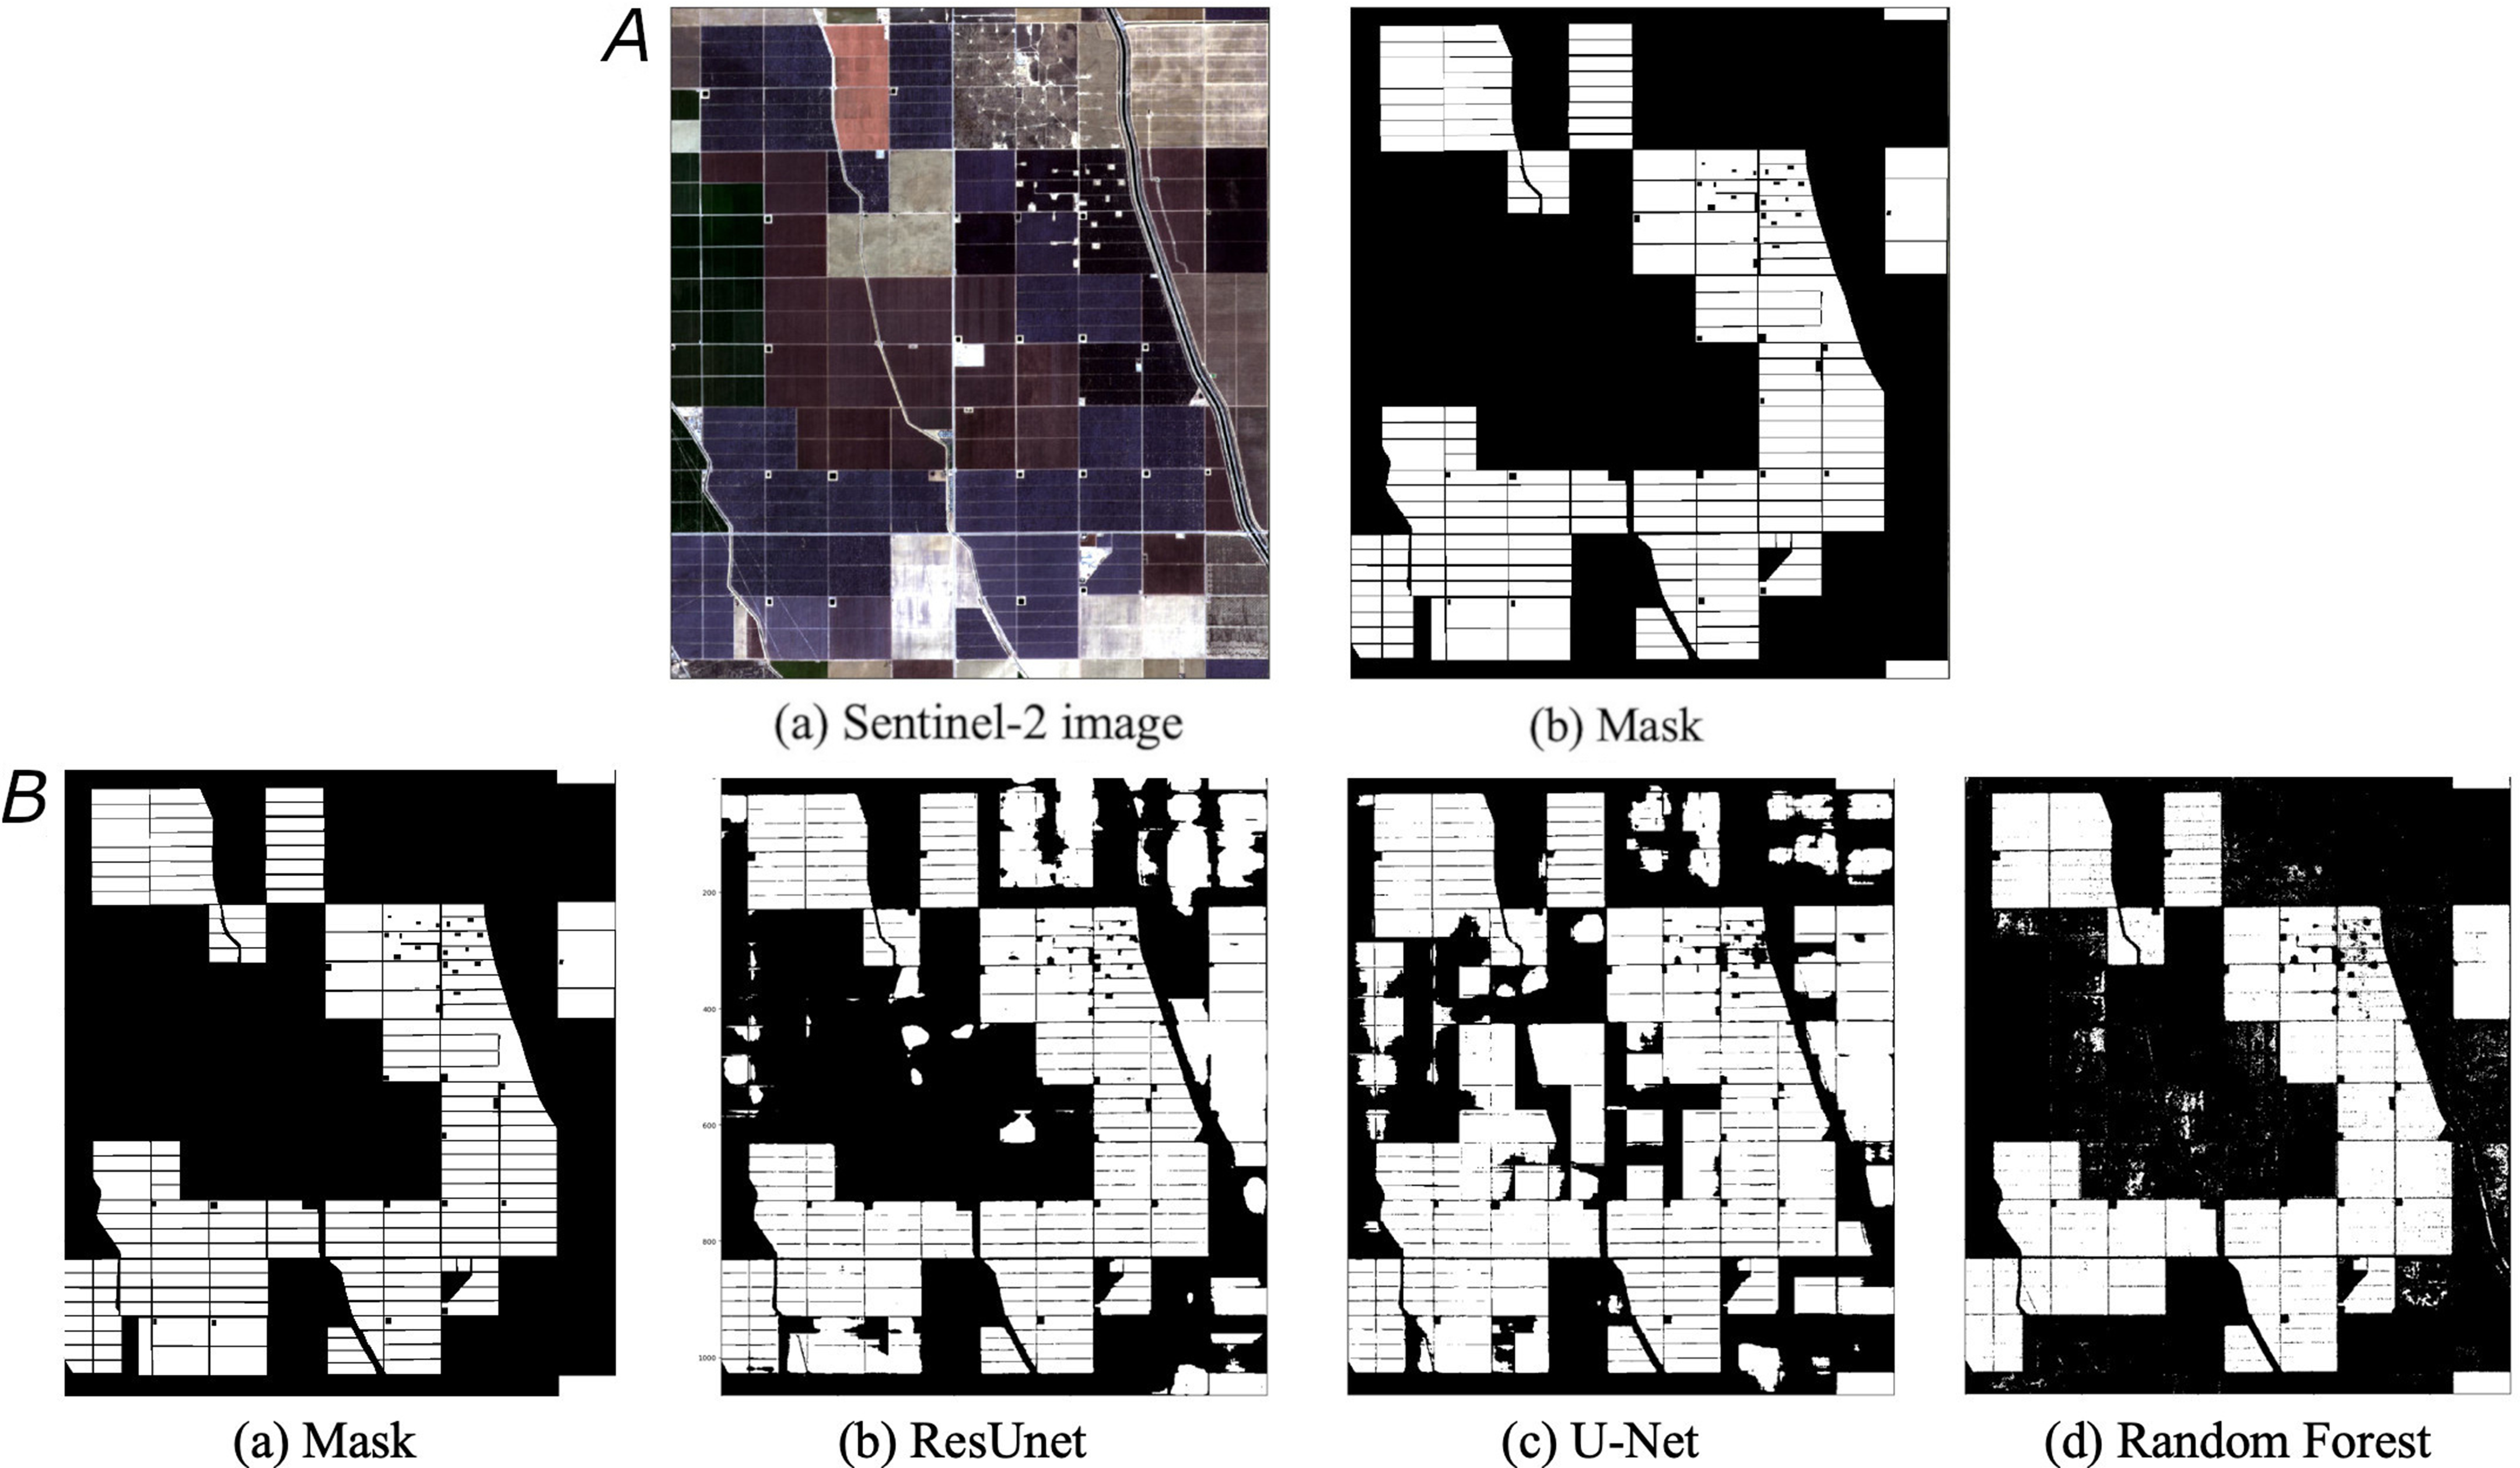
We used the approach, proposed in Section 2.6 for ground-truth data collection of almond orchard data. We downloaded Sentinel-2 satellite imagery for the bloom period (February–March) over the entire county. These images were used to create masks for the training and testing datasets (Figure 9A). For the almond orchard detection task, we used the models from the previous task. The best-performing models were U-Net and ResUnet. Similarly to the lavender segmentation task, we explored a range of parameters, including learning rates, dropout rates, the number of downsampling–upsampling stages, and various depths of U-Net models. The best-performing model for almond segmentation with Dice coefficient of 0.9549 was ResUnet and U-Net with Dice coefficient of 0.9487 (Figure 9B).
A—Sample data, prepared for the task of semantic segmentation of almond orchards in the United States. Source: Sentinel-2. (a) Original Sentinel-2 12-band stack image (true colors). (b) Binary segmentation mask. B—Almond fields segmentation task. We use random forest model (92% accuracy) as a baseline model. We further compare semantic segmentation methods with the baseline model: ResUnet, U-Net.
4.3. Transfer learning
We further evaluated the performance of pre-trained models on our dataset. We compared the performance of the random weight initialized model, pre-trained ResUnet model, and our adversarially trained ResUnet model on our dataset. Each model was trained for 30 epochs. The learning rate was set to 0.00001 for transfer learning experiments. We also compared the results to the predictions of the pre-trained models without fine-tuning. We provide the results for the best-performing models for almond fields in Table 4.
Transfer learning experiments
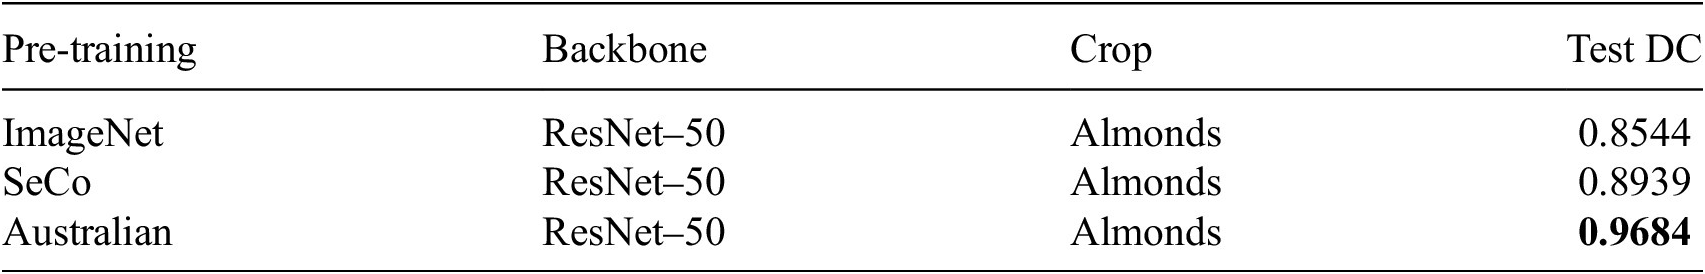
We conducted a few experiments with pre-trained models. In the first experiment, we initialized the model with the ResUnet model with ResNet-50 backbone, pre-trained on the ImageNet data (Deng et al., Reference Deng, Dong, Socher, Li, Li and Fei-Fei2009). In the second experiment, we used the same model, pre-trained on the SeCo dataset (Manas et al., Reference Manas, Lacoste, Giro-i Nieto, Vazquez and Rodriguez2021). Finally, we pre-trained the same model on a single crop on an Australian dataset. This model was trained on a large number of images (over 60000 patches) of another crop in South-East Australia.
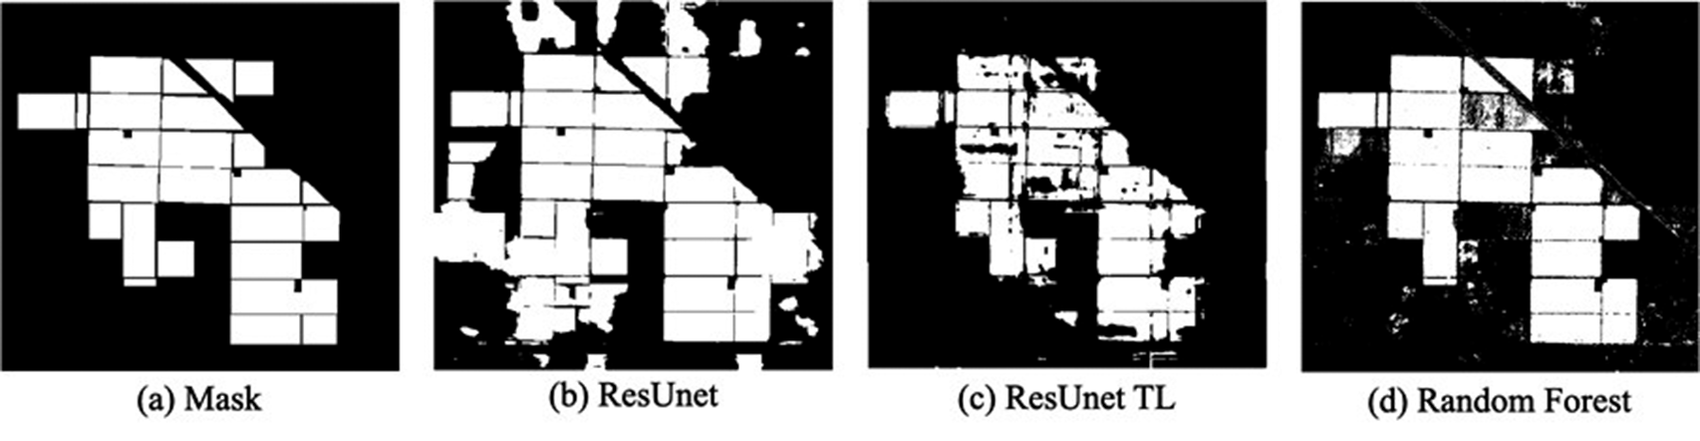
Our transfer learning experiments show there is a limited gain from using transferred models. The best performance increase after fine-tuning resulted in a gain of 1% accuracy (from 0.9549 to 0.9684), with ResUnet model, pre-trained on the Australian dataset. One explanation is that the pre-trained model must “unlearn” the priors that were only applicable to the Australian agricultural landscape and a different type of crop. The visual inspection of the results shows better detection of the field boundaries themselves with more false positives (Figure 10). Regardless, in general, the models, pre-trained on the Sentinel-2 imagery, outperform the model trained from random weight initialization, indicating that some degree of transfer learning was successful.
Almond fields segmentation task with transfer learning. The best-performing model is pre-trained on binary crop segmentation tasks in another region.
4.4. Additional considerations
The approach presented above is crop-specific and territory-specific. Multiple factors contribute to this restriction, including the size of the fields, availability of very high-resolution imagery, cloud cover, and difficulties in determining the flowering window and capturing the dates of sowing and harvest. It is also useful to perform primary crop categorization according to the difficulty of their detection: crops that are simple to detect (popular crops, large area and amount of data, and frequent field surveys); crops with medium detection difficulty (large set of statistical data and a small choice of available satellite images for key dates and vice versa); and crops that are difficult to detect (small size of fields, annual crops, lack of field and statistical data, and a small set of available images for the region of interest). In this regard, a very important stage is the collection of high-quality, significant, and reliable statistical information on the location and area of fields, including online information and data in different languages, as well as the organization of a convenient format for the exchange of such information between local residents and those conducting the research. It is also necessary to perform a primary analysis of the possibility of mapping crop fields based on very high-resolution images which are used by the most popular web mapping platforms.
For both lavender and almond orchards, we have performed an experiment, where we used a pre-trained best-performing model developed using lavender and almond plantings for Bulgaria and the USA, on the other region (France for lavender and Australia for almonds, respectively). From the literature, we know that this approach is not readily applicable in the majority of cases: pre-trained models are typically fine-tuned on the local labels to achieve the best performance in the new region (Kerner et al., Reference Kerner, Tseng, Becker-Reshef, Nakalembe, Barker, Munshell, Paliyam and Hosseini2020; Wang et al., Reference Wang, Waldner and Lobell2022). Similarly to the research conducted in the literature, we did not find promising results while running the lavender model on the France region, potentially due to the differences in atmospheric properties that change the color of lavender fields in satellite images. However, the almond classification performed reasonably well in Australia (potentially due to the similar climatic conditions between the two regions of choice: Figure 11). This result can be improved by fine-tuning the model on the small amount of the data from the new region (Wang et al., Reference Wang, Waldner and Lobell2022).
Results of the pre-trained model on a new region: ResUnet model results in Australia. Left: original Sentinel-2 12-band stack image (true colors); right: the results of semantic segmentation.

4.5. Directions for further research and open questions
In this paper, we discussed approaches providing essential information for accurately identifying various crop fields. However, these methods fall short in detecting specific crops of interest. Additional strategies include capturing images more frequently (e.g., daily) to determine phenological phases’ timing and selecting cloud-free images (Pan et al., Reference Pan, Huang, Zhou, Wang, Cheng, Zhang, Blackburn, Yan and Liu2015). Simultaneously using satellite images with different spectral ranges enhances identification accuracy (Haack et al., Reference Haack, Herold and Bechdol2000; Liu et al., Reference Liu, Ozdogan and Zhu2014).
Accurate data on seasonal plant development, considering environmental conditions, aids in distinguishing field, and planting characteristics (Wardlow et al., Reference Wardlow, Egbert and Kastens2007; Qiu et al., Reference Qiu, Luo, Tang, Chen, Lu, Huang, Chen, Chen and Xu2017; Yang et al., Reference Yang, Ren, Tao, Ji, Liang, Ruane, Fisher, Liu, Sama, Li and Tian2020) are some of the possible directions for future work. Searching for photos and videos aids in identifying specific crops in an area, especially for perennial crops (Wu et al., Reference Wu, Wu, Zhang, Zeng and Tian2021). Collaborating with organizations, exchanging information with local stakeholders, and utilizing statistical data contribute to accurate crop mapping (Laso Bayas et al., Reference Laso Bayas, See, Perger, Justice, Nakalembe, Dempewolf and Fritz2017; Skakun et al., Reference Skakun, Franch, Vermote, Roger, Becker-Reshef, Justice and Kussul2017; Zipper, Reference Zipper2017).
To help identify fields and plantings in areas with similar conditions, one might consider applying similar approaches to comparable regions and creating libraries of spectral and phenological curves, using data alongside hyperspectral imagery (Qiu et al., Reference Qiu, Luo, Tang, Chen, Lu, Huang, Chen, Chen and Xu2017; Skakun et al., Reference Skakun, Franch, Vermote, Roger, Becker-Reshef, Justice and Kussul2017; Nidamanuri et al., Reference Nidamanuri, Garg and Ghosh2007). A field verification stage assesses overall detection and identification reliability.
Specific questions regarding improving crop mapping accuracy on cloudy days, the efficiency of radar data versus optical data (Haack et al., Reference Haack, Herold and Bechdol2000; Skakun et al., Reference Skakun, Kussul, Shelestov, Lavreniuk and Kussul2016), and the real-time identification and yield estimation of less popular annual crops (Gao and Zhang, Reference Gao and Zhang2021; Vicente-Guijalba et al., Reference Vicente-Guijalba, Martinez-Marin and Lopez-Sanchez2015) are raised. Additionally, addressing the absence of scientific and statistical information on a territory and the lack of up-to-date high-resolution images requires further exploration (Wang et al., Reference Wang, Azzari and Lobell2019; Lin et al., Reference Lin, Zhong, Song, Dong, Lobell and Jin2022).
The rapid development of foundation models for remote sensing (Jakubik et al., Reference Jakubik, Roy, Phillips, Fraccaro, Godwin, Zadrozny, Szwarcman, Gomes, Nyirjesy and Edwards2023; Tuia et al., Reference Tuia, Schindler, Demir, Camps-Valls, Zhu, Kochupillai, Džeroski, van Rijn, Hoos and Del Frate2023) brings a new lens into the research in crop mapping. Although these models are typically able to classify only major crops, such as soybean, corn, maize, etc., they can be fine-tuned to achieve better results on regional data and rare crops. Foundation models are an important emerging class of ML models, which use very large ML models, are trained with extremely large and broad data sets, and require considerable computing resources during training. For example, in Jakubik et al. (Reference Jakubik, Roy, Phillips, Fraccaro, Godwin, Zadrozny, Szwarcman, Gomes, Nyirjesy and Edwards2023), the authors built a large-scale foundation model using satellite and remote sensing data, including the Harmonized Landsat and Sentinel-2 (HLS) data. This model was fine-tuned on a range of Earth observation tasks involving multi-temporal cloud gap imputation, flood mapping, wildfire scar segmentation, and multi-temporal crop segmentation. Such fine-tuning can be performed for various downstream tasks with small labeled datasets. The methodology, presented in this paper, can be used to gather the data for fine-tuning foundation models in the future.
5. Conclusion
The paper describes several methodological approaches to collecting the data and mapping the fields of crops from satellite images using phenological, geographic, ecological, and statistical information in addition to the traditional approaches based on vegetation indices. In the example of three crops (lavender, almond, and winter barley), it was shown that the color in the satellite image is an important feature that allows the identification of fields of the specific crop among other types of land cover, in particular in areas where similar and more popular crops are cultivated. Such data as statistical information (i.e., the area occupied by the crop fields or sown area in different years), the growing season, and the start and end dates of the harvest are of great importance for crop mapping. When used together with the color of the fields, they make it possible to visually distinguish the fields of the mapped crop from other vegetation cover types and fields of similar crops, and, in addition, they help to validate the accuracy of the mapping. To support our methodological considerations, we identified and mapped all lavender fields using satellite imagery in Bulgaria’s leading lavender cultivation region—Dobrich Province, and all almond orchards in one of the leading almond cultivation regions of the USA—Kern County, California.
Based on this data, we developed several advanced ML segmentation models and applied them for mapping lavender and almond crops in other regions, France and Australia. The obtained data about the color changes of the mapped crop fields during the growing season provides valuable information for searching the crop of interest in areas with similar geographic or environmental conditions, but different in terms of the availability of geographic data related to the mapping of the interested crop. We discovered that information about field color, statistical, geographic and environmental conditions, and long time-series data, such as curves of vegetation indices (e.g., seasonal and/or long-term changes in NDVI values), when used together, can significantly improve crop mapping accuracy; in addition, we identified a variety of other useful directions, approaches, and questions that can further improve the process of mapping the fields of the crop of interest. Conducted experiments demonstrate the principle feasibility of identifying and detecting represented crops visually and using ML algorithms for different regions of the world.
The methodology, presented in this paper, can be used for a variety of tasks, such as collecting fine-grained data for training small and medium-scale ML models, including all types of semantic segmentation tasks, and for fine-tuning large geospatial foundation models.
Author contribution
Data curation: I.K., N.E., A.U.; Software: I.K., N.E.; Visualization: I.K., N.E., A.U.; Methodology: N.E., A.U.; Supervision: N.E.; Writing – original draft: N.E., A.U.; Writing – review & editing: N.E.; Conceptualization: A.U.
Competing interest
The authors declare that they have no conflicts of interest.
Data availability statement
The statistical information about areas of lavender and almond crops in Bulgaria and the USA respectively is available online in reports from the State Fund Agriculture (Bulgaria) and USDA (see related references). The images, crop masks and the datasets of identified lavender and almond fields are available at https://doi.org/10.5281/zenodo.10675289. The code is available at https://github.com/burantiar/EDS_segmentation.
Ethics statement
The research meets all ethical guidelines, including adherence to the legal requirements of the study country.
Funding statement
This work received no specific grant from any funding agency, commercial or not-for-profit sectors.


 Open access