


It is generally agreed that obesity has reached epidemic proportions across the world, although there is still some argument about its extent and effects(1–Reference Basham and Luik3). The high level of obesity is a concern, as it, together with being overweight, is a risk factor for a number of serious chronic diseases and for reduced life span(Reference Allender and Rayner4, Reference Ogden, Yanovski and Carroll5). Data from the annual cross-sectional Health Survey for England (HSE) were used in the present study to describe recent age and time trends in obesity and overweight in England, to identify any variation in trends across the age range and investigate whether there were any signs of a change in the rate of increase.
Many epidemiological studies have investigated the prevalence of a condition with respect to variation in the age of subjects, the year (or ‘period’) in which it has been surveyed, and the ‘cohort’ (or birth year) of participants. A ‘period’ effect would be a population-wide change (e.g. rising availability over time of fast food), while a ‘cohort’ effect would be one that affected those born around the same time (e.g. a change in infant feeding practices). There have been many studies that have considered the role of age and period on obesity with age, but fewer have considered the role of cohort. While it is not possible to disentangle the separate effects of age, period and cohort, the present study also uses the HSE data to describe the patterns in obesity and overweight in subgroups born in different decades, and compares these with trends seen in two British cohort studies which recruited in the 1940s and 1950s(Reference Li, Hardy and Kuh6).
Methods
Data sources
The data analysed herein come from the core population samples from the HSE between 1991 and 2006. The HSE is a series of annual cross-sectional surveys that provides information on various aspects of the nation’s health. Households were identified using multistage sampling from a comprehensive listing of private households, in a geographically representative manner; all adults in a household were invited for interview. All these surveys have covered the adult population aged 16 years and above. A new sample of people was invited every year. Sociodemographic information and height and weight measurements were collected by standard procedures by trained interviewers at the homes of participants. Weight was measured using Soehnle, Seca and Tanita electronic scales. Participants were asked to remove any shoes or bulky clothing, and were not weighed if they were pregnant, unsteady on their feet or chair-bound. A single measurement was recorded to the nearest 100 g. Height was measured using a portable stadiometer with a sliding head plate, a base plate and three connecting rods marked with a metric measuring scale. One measurement was taken to the nearest millimetre.
The response rates varied across each survey but about 70 % agreed to an interview, and BMI was available on about 90 % of interviewees. Further details of the survey methodology and results are available in published reports and online(Reference Craig and Mindell7, Reference Craig and Mindell8). The data sets were downloaded from the UK Data Archive. Data weights were provided in all these data sets to reflect the sampling scheme for children. However, the only weights provided for adult participants in the core sample were a non-response weight from 2003 onwards. It was not possible to apply these consistently across all sixteen years, so the results have been calculated on unweighted data.
Some published data are used from two British cohort studies(Reference Li, Hardy and Kuh6). The 1946 National Cohort Study comprises a socially stratified sample of 5362 children from England, Wales and Scotland who were born in one week in March 1946. They have been followed up on a number of occasions from birth to 53 years(Reference Wadsworth, Kuh and Richards9). The 1958 British Birth Cohort Study followed over 17 000 children from England, Wales and Scotland who were born in one week in March 1958. They have been followed up on a number of occasions from birth to 43 years(Reference Power and Elliott10).
Statistical analysis
The analysis was restricted to adults aged 16–65 years, a range within which BMI generally rises with age. This restriction was because the aim of the research was to describe the time trends in subgroups of increasing obesity. In addition, any relationships in old age are complicated by the fact that those who survive longer are not typical of the general population.
The outcome measures used for the analyses were the binary measures of obesity (BMI ≥ 30·0 kg/m2) and overweight (BMI ≥ 25·0 kg/m2). International cut-off points of BMI for obesity and overweight as described by Cole et al. were used on those aged 16–17 years(Reference Cole, Bellizzi and Flegal11).
While it would be of interest to be able to investigate the role of age, birth cohort and survey period together, the relationship Cohort (Birth year) + Age = Period (Survey year) means that any model which includes these three factors can be fitted by infinitely many sets of parameter estimates (the non-identifiability problem)(Reference Holford12). Some linear combinations of parameters can be estimated (e.g. net drift), but there is difficulty in interpreting them. Given the structure of the data (a series of cross-sectional surveys done over a period of years much shorter than the age range covered), there is limited information available on any birth cohort effect. It was therefore decided to concentrate on fitting models including only age and period terms and their interactions. It is known that the prevalence of obesity/overweight rises over survey periods and with age (in this age range), but it is possible that the change between survey periods differed between ages, particularly if it is the differences between periods, rather than ratios, that are estimated.
The relationship between the prevalence of obesity/overweight with age and time period was fitted by generalized linear models with binomial errors and an identity link function, which allowed the prevalence (and differences between prevalence at different ages or periods) to be estimated from explanatory variables. Four separate models were fitted for the two outcome measures in both males and females, with the explanatory variables being 4-year period (1991/94, 1995/98, 1999/02, 2003/06), polynomial terms in age in years (linear, quadratic and cubic terms centred on 40 years to reduce co-linearity) and interactions between period and both linear and quadratic age terms; this allows the difference between periods to vary with age. The interaction terms were included only if they were significant at the 1 % significant level. More complex models including further fractional polynomial terms and interaction between period and cubic age terms were investigated, but not found to significantly improve the fit.
It is not particularly informative to report the model parameters. Instead, the fitted models are illustrated by plotting the estimated prevalence of obesity/overweight for each period and age, and by estimating the differences in prevalence between successive time periods with 95 % confidence intervals for these differences. These differences were estimated across all ages and for three different ages (20, 40 and 60 years) in models in which the interaction terms were significant. An estimate of the pattern of change in prevalence in obesity/overweight is given by subtracting the increase between periods 3 and 2 (1999/02 – 1995/98) from that between periods 4 and 3 (2003/06 – 1999/02). A positive value indicates that the increase in obesity/overweight is accelerating, while, if it is negative, this suggests the rate of increase has slowed recently.
The HSE yearly survey data were divided into subgroups born in different decades. These birth cohort subgroups were retained only if subjects were in the age range 16–65 years throughout the survey periods (1991–2006). This produced subgroups of adults who were born in the decades 1936–45, 1946–55, 1956–65 and 1966–75 in each survey year. These are called pseudo or synthetic birth cohorts, since they have been assembled from cross-sectional data: the pseudo cohort tracks the average experience of those born in a birth cohort, not the individual experience. Those born in 1936–45 had a mean age of 50 years in the 1991 survey, a mean age of 51 years in 1992, etc. The comparison between birth pseudo cohorts can only be partial. Given the relatively short time period over which data were collected (16 years) compared with the age range (16–65 years), it is only possible to compare different birth cohorts across short portions of the age range (e.g. those born in 1956–65 were aged between 26 and 50 years during survey years (1991–2006), while those born in 1946–55 were aged between 36 and 60 years during HSE survey years).
The prevalence of obesity and overweight was plotted against average age for each birth pseudo cohort in each survey year of the HSE. To facilitate the comparison between pseudo cohorts, the data were represented as smoothed curves using locally weighted regression(Reference Cleveland13). This was contrasted with the published results of the prevalence of obesity and overweight observed in two genuine cohort studies in Britain, whose participants were born in 1946 and 1958, and on whom data had been collected on five or six occasions between the ages of 15 or 16 and 53 years (1946 cohort only). All statistical analysis was done using the STATA statistical software package version 9 (Stata Corp., College Station, TX, USA).
Results
A total of 61 515 men and 69 733 women between the ages of 16 and 65 years are included in the analysis. When the analysis was restricted to those who had been born between 1936 and 1975 for the pseudo cohort analysis, there were data on 51 551 males and 58 802 females.
The estimated prevalence of obesity and overweight for men and women from the regression models are shown in Figs 1(a) and (b), for each age and 4-year time period. The prevalence of obesity and overweight has risen in both men and women in England over this time. Obesity is now at similar levels for males and females, but being overweight is still more common in males. It was found that linear and quadratic Age-by-Period interaction terms improved the fit in the Male Obesity model, only linear interactions were added for Female Overweight models, and no interaction terms were found to be a significant improvement for the Male Overweight and Female Obesity models. In all models, the prevalence of obesity and overweight increased with both age and survey period. However, the increase in obesity in men between periods was greater for older than younger males. The increase of overweight in women between survey periods varied slightly with age. However, except for obesity in males, there was relatively little variation across the age range in the average changes in the prevalence of obesity or overweight between time periods.
Prevalence of obesity (a) and overweight (b) by age and 4-year time periods ( , 1991/94;
  , 1995/98;
  , 1999/02;
  , 2003/06) in males (n 61 515) and females (n 69 733) aged 16–65 years participating in the annual Health Survey for England between 1991 and 2006
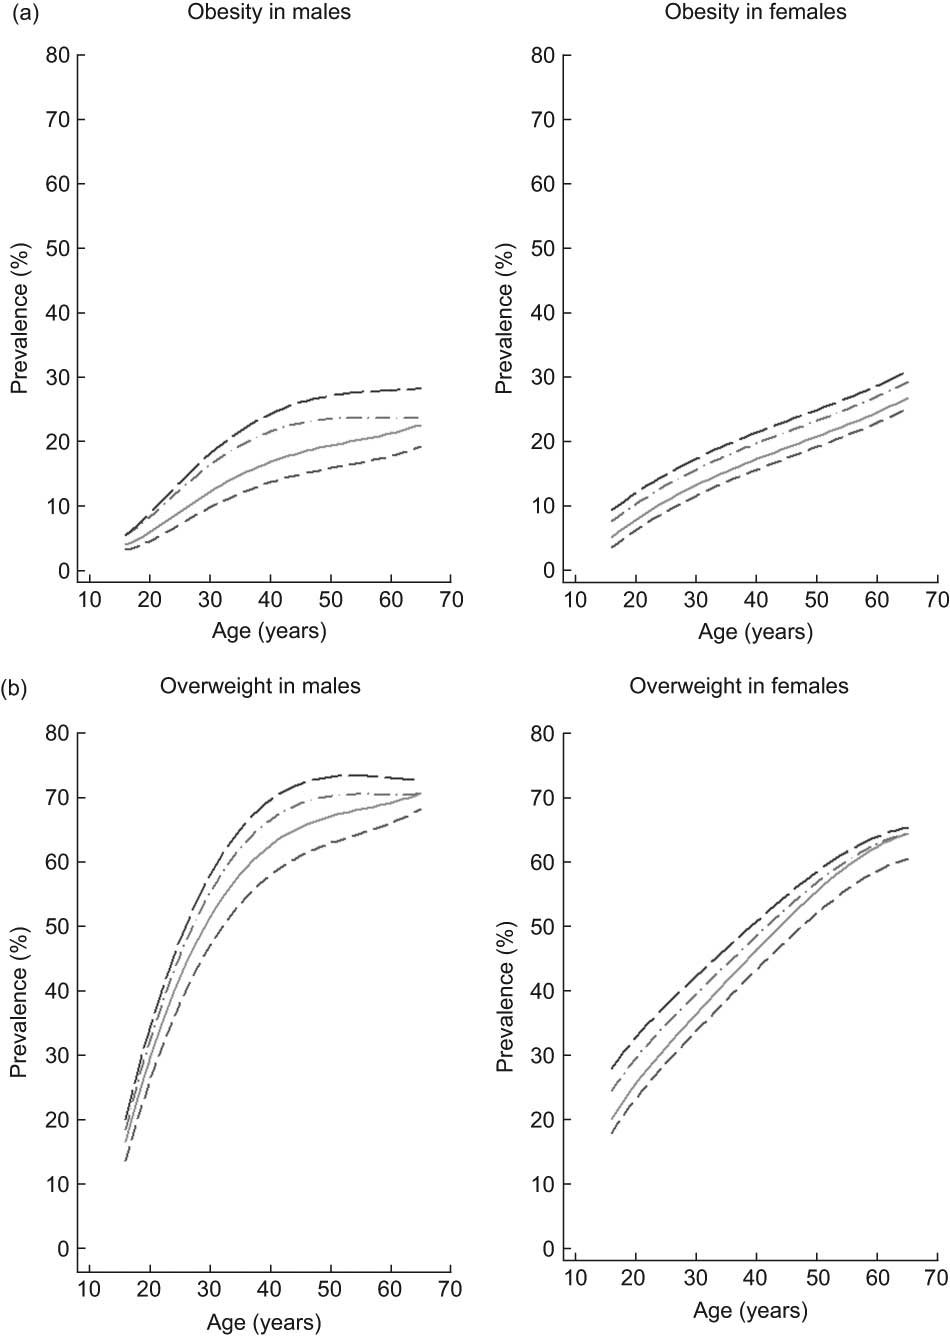
Table 1 reports the estimates of changes in prevalence of obesity and overweight between successive time periods with 95 % confidence intervals; these estimates are given at the ages of 20, 40 and 60 years if interaction terms were significant. It can be seen that, on average, obesity and overweight have increased in each successive time period. However, the rate of increase has slowed down: the increases between 1995/98 and 1999/02 were greater than those between 1999/02 and 2003/06. The only exception to this was in male obesity in those aged 60 years. When contrasts were made between the first and last periods (2003/06 v. 1991/94) it can be seen that, in males, there were similar rises in both obesity and overweight. The rises in both obesity and overweight between these periods were also similar in females, although slightly less than those in males. When the first and last 4-year periods were compared, male and female obesity in the 16–65 age group had risen by 8·2 % and 6·0 %, and male and female overweight had risen by 8·8 % and 7·4 %.
Estimated changes in prevalence (%) of obesity and overweight between successive 4-year time periods at three agesFootnote *, with 95 % confidence intervals
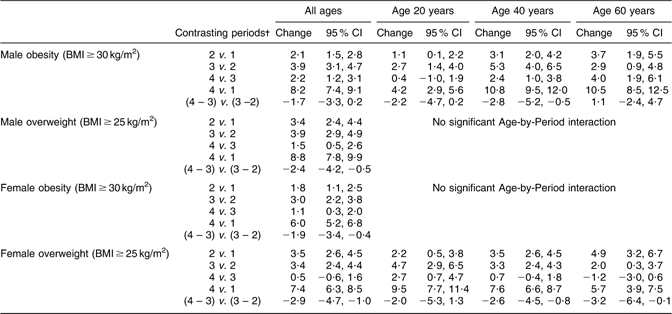
* Estimated from binomial regression models, separately for males and females, with terms including period, polynomial functions of age and interactions with period (interactions between period and linear and quadratic functions of age for Male Obesity, interactions between period and linear functions of age for Female Overweight, and no Age-by-Period interactions for Male Overweight and Female Obesity).
† Period 1 = 1991/94; period 2 = 1995/98; period 3 = 1999/02; period 4 = 2003/06.
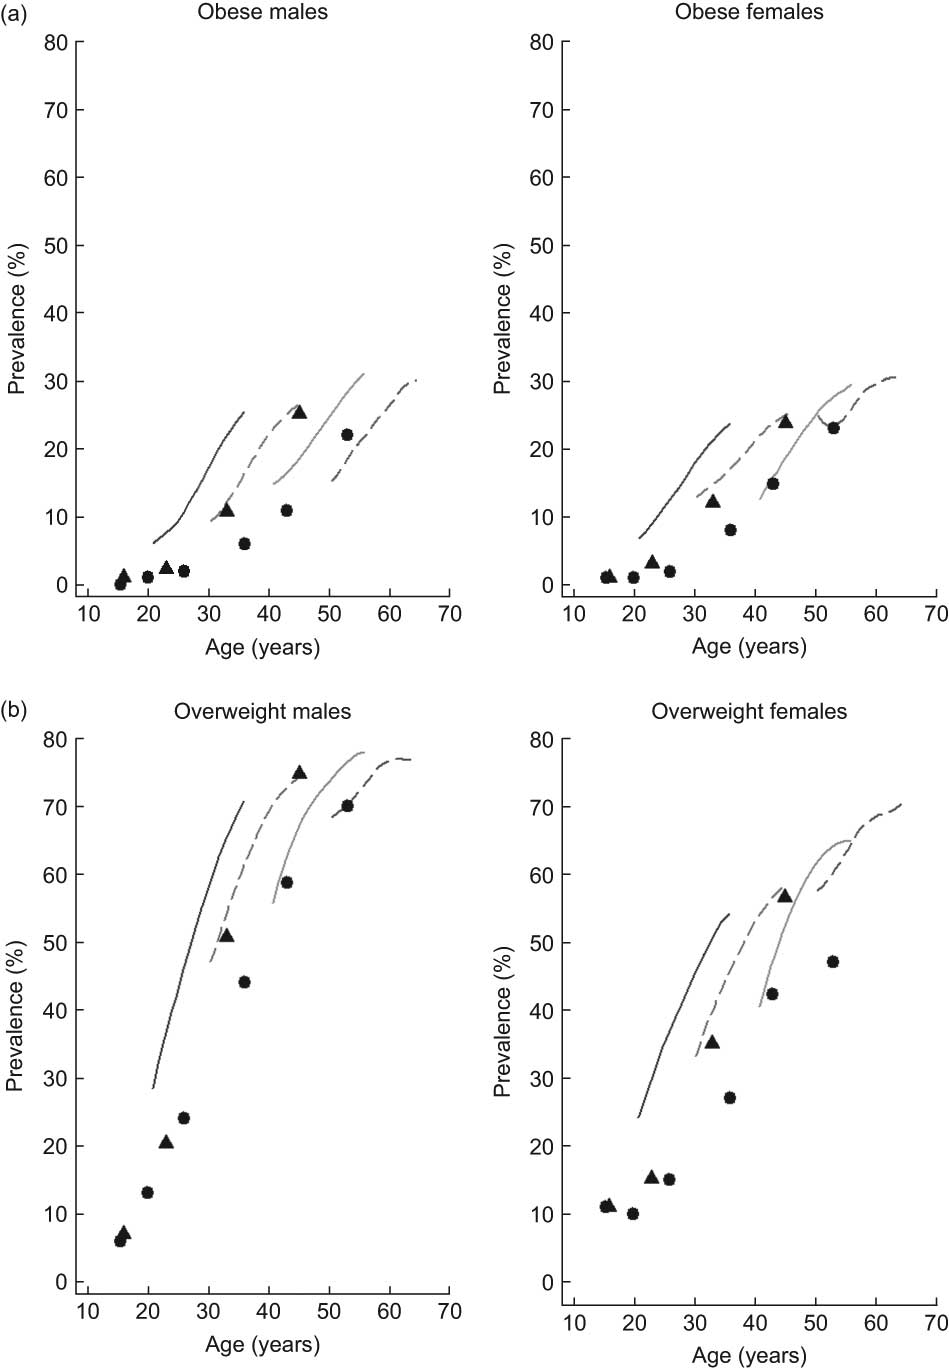
Figures 2(a) and (b) show the relationship between the prevalence of obesity and overweight and mean age for the two UK birth cohorts, and for each of the four 10-year pseudo birth cohorts constructed from the HSE surveys. The pseudo cohort curves overlap each other only over a restricted age range, but it can be seen that the prevalence is consistently higher in the cohorts born more recently for a given average age. For instance, the prevalence of male obesity was 24 % in the pseudo cohort born during 1966–75 in 2005 when their average age was 35 years, but was 13 % in the pseudo cohort born during 1956–65 in 1995 when their average age was also 35 years. As was reported in a recent comparison of the two British birth cohorts(Reference Li, Hardy and Kuh6), there was little difference between the two cohorts in early adulthood, but by middle age the prevalence of obesity and overweight was higher in the 1958 cohort. It can be seen that the two time points when data were collected on the 1958 cohort during 1991–2006 show close agreement with the results from the 1956–65 pseudo cohort. Since the birth year of the 1946 cohort lies on the boundary of two pseudo cohorts (1936–45 and 1946–55), the data points for the 1946 cohort would be expected to lie between these two pseudo cohort curves. This is the case, except for overweight females where the prevalence was lower in the birth cohort than both the pseudo cohorts: approximately 47 % of females were overweight in the 1946 cohort at the age of 53 years, compared with 60 % in the 1936–45 pseudo cohort and 63 % in the 1946–55 pseudo cohort.
Smoothed curves illustrating the prevalence of obesity (a) and overweight (b) by age and 10-year pseudo birth cohort ( , 1936–45;
  , 1946–55;
  , 1956–65;
  , 1966–75) in males (n 51 551) and females (n 58 802) aged 16–65 years participating in the annual Health Survey for England between 1991 and 2006, compared with two cohort studies (
 , 1946 National Cohort Study;
  , 1958 British Birth Cohort Study)
Discussion
The prevalence of obesity and overweight has risen in both men and women in England between 1991 and 2006. Obesity is now at similar levels for males and females, but being overweight is still more common in males. A rise in obesity and overweight has also occurred in a number of other countries over a similar time period(Reference Bendixen, Holst and Sørensen14–Reference Sassi, Devaux and Church19); the rise in England has been relatively large, although not as large as in the USA(Reference Butland, Jebb and Kopelman15). However, comparison of the changes between successive 4-year periods suggests that the rate of increase of both obesity and overweight in England has slowed down in men and women, the increase between the periods 1999/02 and 2003/06 being significantly less than that between 1995/98 and 1999/02. The rate of increase of excess weight prevalence has not been formally considered in many studies. An analysis of obesity trends in England over a slighter shorter time period used this to predict patterns in 2012(Reference Zaninotto, Head and Stamatakis20). They considered models in which the rate of change increased, decreased or stayed the same, and reported that a model in which the rate was accelerating was a slightly better fit, which is at variance with the results in the present analysis. However, they did note that the prevalence of obesity increased steadily in 2001–4 compared with the rapid increase between 1992 and 1999, and the present analysis has included two years of more recent data. In addition, a recent report using HSE data for children in the period 1993–2007 has found some evidence that the rate of growth in the prevalence of obesity and overweight is slowing down(Reference McPherson, Brown and Marsh21). Consideration of the rate of increase in other countries found that increases in body weight may be levelling off in Switzerland(Reference Faeh and Bopp22), and in women in the USA but not in men(Reference Ogden, Carroll and Curtin23), whereas it has been reported that the increase in obesity seems to be slowing down in French males since 2003(Reference Charles, Eschwege and Basdevant24). However, all these findings are tentative. The rate of increase in obesity and overweight may genuinely have begun to decline, or this may be random variation; only future data will tell.
When these trends were considered in relation to age, it was found that the rise in obesity and overweight over time is fairly similar across the age range, with the exception of obesity in males, where the rise has been less in younger than older males. It should be noted that these are absolute differences: percentage changes are higher in younger adults, since they start at a lower level. Previous studies did not always make formal comparisons of trends between ages or, if they did so, it was not in a comparable way to those in the present study. In an analysis of National Health Interview Survey in the USA, the rise in obesity/overweight over time was found to be greater in younger adults(Reference Cook and Daponte25). A study in Sweden found that the largest increases in obesity and overweight were in the youngest males and females(Reference Berg, Rosengren and Lappas26). However, logistic regression was used in both these studies, which would highlight age groups where the ratios of prevalence over time were high rather than differences.
When the relationship between prevalence of obesity and overweight and mean age for each of the 10-year pseudo birth cohorts was investigated in the present study, it was seen that the prevalence was higher in the cohorts born more recently, for a given average age. Other series of cross-sectional surveys have similar findings. Three studies have used the National Health Interview Survey and the National Health and Nutrition Examination Survey to investigate trends in adult obesity across pseudo birth cohorts in the USA over the periods 1976–2002 and 1982–2002(Reference Cook and Daponte25, Reference Leveille, Wee and Iezzoni27, Reference Reynolds and Himes28). They all found that those born more recently had a higher prevalence of obesity at comparable ages than those born earlier. Studies looking at the change in prevalence of obesity between pseudo cohorts in Switzerland between 1982 and 2007, in Demark during 1964 to 1994, and in Finland between 1972 and 1997 found that male obesity was higher in more recent birth cohorts at comparable ages, but this trend was seen only in women in Switzerland(Reference Heitmann, Stroger and Mikkelsen17, Reference Faeh and Bopp22, Reference Lahti-Koski, Jousilahti and Pietinen29).
Since it is not possible to separate out the effects of age, period and birth cohort, it is not possible to decide if there is a genuine birth cohort effect. Evidence from some cohort studies suggests there are periods in childhood that are critical for the development of adult obesity(Reference Dietz30, Reference Kuh and Ben-Shlomo31). It is therefore possible that those who experienced food scarcities, which were more common during and after World War II, may have a different prevalence of obesity at the same age as those born in later years, which is not just explained by diet and lifestyle in adulthood. A recent comparison of the trends in obesity and overweight from two UK birth cohort studies found that there was little difference between those born in 1946 and 1958 during childhood, but that those born in 1958 were increasingly more obese and overweight than those born in 1946 by middle age(Reference Li, Hardy and Kuh6). The early childhood diet of those born in 1946 will have been affected by rationing; however, any differences in diet were not reflected in obesity or overweight in childhood. This lack of difference in childhood in these two cohort studies suggests that the observed differences between the cohorts in adulthood were more likely to be due to diet and lifestyle than any birth cohort effect. The analysis of the pseudo cohorts in the present study suggests that this increase in adult obesity and overweight between birth cohorts has continued with those born around 1960 and 1970, in which people will have spent higher proportions of their lives in an ‘obesogenic’ environment.
The HSE is a high-quality data set, but the average response rate for BMI data is about 63 % and the possibility of response bias should be considered. The detailed methodological reports of the HSE compared the age and sex distribution of HSE participants with that from the national census(Reference Craig and Mindell8), and have found that women and older people have a slightly higher representation in the HSE. However, the census includes the subgroup living in institutions, which are not included in the HSE, and this makes it difficult to estimate the extent of any bias. Calibration weights have been used to produce non-response weights for adults in the HSE since 2003, but since this is only a small fraction of the period over which the current analysis was done, it would be inappropriate to apply them to only part of the data set in the present analysis of trends over time.
It is generally agreed that the fundamental causes of the worldwide obesity epidemic are sedentary lifestyles and high-fat energy-dense diets which have affected all age groups(1). The UK Government has recently started to consider how society might deliver a response to obesity in England over the coming decades(Reference Butland, Jebb and Kopelman15, 32). The present study has found that obesity and overweight are still rising in England across all ages, but there are some signs that the rate of increase is slowing. It is important that this is studied further, when more recent data become available. In addition, these findings should not be cause for complacency, since obesity and overweight prevalences are still unacceptably high.
Acknowledgements
Sources of funding: This research received no specific grant from any funding agency in the public, commercial or not-for-profit sectors. Conflict of interest declaration: The author declares no conflict of interest. Acknowledgements: Data from the Health Survey for England were used with permission of the UK Data Archive, University of Essex. Tom Chadwick and Elaine Stamp at Newcastle University performed early work in combining the yearly survey data sets. The National Centre for Social Research (NatCen) provided detailed information on weighting strategies.



