


Introduction
Bilingual speakers must cognitively accommodate between the grammars of their two languages during speech. Several factors, including proficiency, age, order of acquisition, and the relative dominance of each language, can affect the patterns of cross-language interactions (Birdsong, Reference Birdsong2001, Reference Birdsong2014). Empirically, the interplay of these factors can be observed through the mutual phonetic influences exerted between a bilingual’s two languages. One well-documented phenomenon is the influence of the first-acquired language (L1) on the second-acquired language (L2), which stems from the fact that L2 acquisition is “filtered” through L1 phonological knowledge (Best, Reference Best and Strange1995; Flege, Reference Flege and Strange1995). The phonology of an L2 can similarly influence that of an L1, especially in situations of long-term contact (Flege, Reference Flege1987; Sancier & Fowler, Reference Sancier and Fowler1997). Models of L2 phonological acquisition assume that the mechanisms and processes involved in learning the phonetic systems of both the L1 and L2 persist throughout an individual’s lifetime. The Speech Learning Model (Flege, Reference Flege and Strange1995; Flege & Bohn, Reference Flege, Bohn and Wayland2021) and the L2 Perceptual Assimilation Model (Best & Tyler, Reference Best, Tyler, Munro and Bohn2007) specifically propose that the development of L2 pronunciation is influenced by the perceived connections between sounds in a speaker’s L1 and L2. These models further suggest that L2 sounds that are similar to, but not the same as, those in the L1 pose particular challenges, as bilinguals may struggle to perceive the subtle differences that distinguish the L2 phones from their L1 counterparts.
In this paper, we examine cross-language phonetic interactions in an Afrikaans–Spanish bilingual community in Patagonia, Argentina. The members of this community are descendants of approximately 650 Afrikaans settlers who migrated from Africa to Argentina in the first decade of the 1900s (du Toit, Reference du Toit1995). Currently, the oldest bilinguals (typically older than 60) are third-generation speakers of Afrikaans who acquired this language from birth. They began learning Spanish as a second language when entering school, between childhood and late adolescence. According to conventional language-shift models (Fishman, Reference Fishman, Gumperz and Hymes1972, Reference Fishman1980), such third-generation speakers should have largely transitioned to the dominant language (Spanish) and should possess limited proficiency in their L1. Due to unique sociohistorical circumstances in the early decades after the original settlement, however, Afrikaans persisted longer in this community, offering an opportunity to investigate patterns of cross-language phonetic influences more than 120 years after the original settlement (Szpiech et al., Reference Szpiech, Shapero, Coetzee, García-Amaya, Alberto, Langland and Henriksen2020). As the current study demonstrates, these circumstances have brought about a diverse array of interaction patterns, enhancing our understanding of the complex nature of cross-language phonetic influence in bilingual grammars. Our study specifically presents an acoustic analysis of intervocalic plosives (i.e., /p t k b d (ɡ)/)Footnote 1 in Afrikaans and Spanish.
Background
Intervocalic plosives in Spanish and Afrikaans
Cross-linguistically, voiced and voiceless plosives are subject to weakening in intervocalic position (for typological reviews, see Gurevich, Reference Gurevich2004 and Kaplan, Reference Kaplan2010). This weakening ranges from being a regular phonological process in some languages to a gradient phonetic process in others (Bouavichith & Davidson, Reference Bouavichith and Davidson2013; Puggaard-Rode, Horslund, & Jørgensen, Reference Puggaard-Rode, Horslund and Jørgensen2022; Ringen & Kulikov, Reference Ringen and Kulikov2012). In this paper, we will assume that some degree of phonetic weakening is present in all languages, even if the extent of weakening and its exact phonetic realization may differ between languages (Keating, Reference Keating and Fromkin1985, Reference Keating1990). The term “lenition” will be used to refer to this weakening process, irrespective of whether it is realized as a grammaticalized phonological or gradient phonetic process.
Intervocalic lenition has been studies extensively in Spanish. Except in careful, emphatic speech (Hualde, Simonet, & Nadeu, Reference Hualde, Simonet and Nadeu2011, p. 304) and some Central American varieties (Canfield, Reference Canfield1981; Fernández, Reference Fernández1982), Spanish intervocalic voiced plosives are usually realized as approximants [β ð ɣ], without achieving full oral closure and with limited frication; in extreme cases, they may even undergo deletion (Hualde, Reference Hualde2013; Hualde et al., Reference Hualde, Simonet and Nadeu2011). The process applies equally to word-internal intervocalic plosives and word-initial plosives preceded by a vowel-final word (e.g., bola [ˈbola] ‘ball’; mi bola [miˈβola] ‘my ball’). The voiceless plosive phonemes /p t k/ in Spanish are also subject to intervocalic lenition, although this is better viewed as a gradient phonetic process. Voiceless plosives are realized with partial (sometimes total) voicing of the consonantal constriction, which may be accompanied by approximantization (Broś & Lipowska, Reference Broś and Lipowska2019). As a gradient process, there is more regional variation in /p t k/ lenition, which is documented in far fewer regional varieties than /b d ɡ/ lenition (Brós et al., Reference Broś, Żygis, Sikorski and Wołłejko2021; Nadeu & Hualde, Reference Nadeu and Hualde2015).
Only a small number of studies have investigated lenition in Argentine Spanish. Colantoni and Marinescu (Reference Colantoni, Marinescu and Ortega-Llebaria2010) report extensive lenition of voiced but limited lenition of voiceless plosives, in line with patterns observed in many other varieties of Spanish. Henriksen, Coetzee, García-Amaya, and Fischer (Reference Henriksen, Coetzee, García-Amaya and Fischer2021) focused on voiced plosives only and reported results that agree with those of Colantoni and Marinescu. Based on such results, we expect to find evidence of extensive phonologized lenition in the voiced plosives and limited gradient lenition in the voiceless plosives of the Patagonian–Spanish speakers in the current study.
Research on Afrikaans phonetics is more limited, and we therefore rely on general descriptive accounts of the language. It is first relevant to note that Afrikaans lacks the phonemic /ɡ/, so that its plosive inventory is smaller than that of Spanish, including /p t k/ as voiceless plosives but only /b d/ as voiced plosives (Coetzee, Reference Coetzee2014; Wissing, Reference Wissing2020). Neither standard descriptive grammars of Afrikaans (Donaldson, Reference Donaldson1993), nor descriptions of the phonology/phonetics of the language (De Villiers & Ponelis, Reference De Villiers and Ponelis1992; Wissing, Reference Wissing2020) mention the lenition of either voiced or voiceless plosives. Afrikaans therefore differs from Spanish in that its voiced plosives are not subject to a phonological process of lenition (e.g., dobbel [ˈdɔbəl] ‘gamble’; baken [ˈbɑːkən] ‘beacon’). We expect, however, that both voiced and voiceless intervocalic plosives in Afrikaans will be subject to gradient phonetic lenition, even if this lenition may be realized differently than in Spanish.
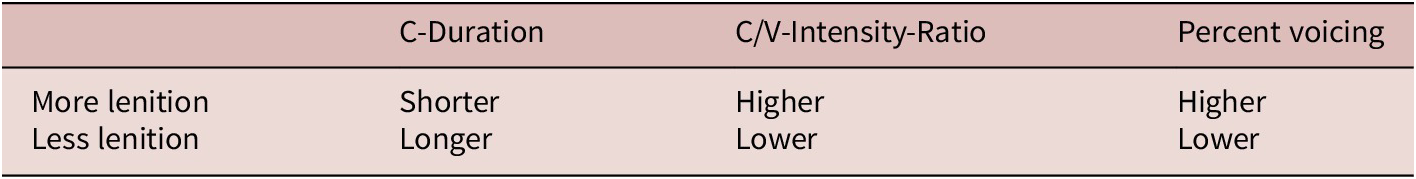
Given that intervocalic plosives are realized differently in Afrikaans and Spanish, we ask here how Afrikaans–Spanish bilinguals produce these phonemes in their two languages. To quantify the extent of cross-language phonetic influence, we use three acoustic measures that are often employed as indicators of lenition (cf., Broś, Żygis, Sikorski, & Wołłejko, Reference Broś, Żygis, Sikorski and Wołłejko2021; Cohen Priva & Gleason, Reference Cohen Priva and Gleason2020; Colantoni & Marinescu, Reference Colantoni, Marinescu and Ortega-Llebaria2010; Hualde et al., Reference Hualde, Simonet and Nadeu2011; etc.): Consonantal closure duration (C-Duration), C/V intensity ratio (C/V-Intensity-Ratio, the ratio of the minimum intensity value during the consonantal constriction to the maximum intensity during the following vowel), and the proportion of the consonantal constriction that is realized with voicing (Percent Voicing). More prototypical consonants tend to have longer constrictions and to be lower in intensity relative to following vowels (Bouavichith & Davidson, Reference Bouavichith and Davidson2013; Cohen Priva & Gleason, Reference Cohen Priva and Gleason2020), and we therefore interpret shorter C-Duration and higher C/V-Intensity-Ratio as evidence of increased lenition. For /p t k/, the closure is usually produced with a limited amount of voicing in the intervocalic position (so-called “voicing bleed”), with higher proportions of voicing being associated with more extensive lenition (Lewis, Reference Lewis2001). Table 1 summarizes how each of these measures corresponds to lenition.
Relation of acoustic measures to lenition

Bilingual phonetics
Bilingual speakers have to cognitively accommodate two languages, including the grammars of the languages and their separate (even if related) phonological inventories. Of particular interest to the current paper is how such speakers handle the sometimes subtle differences between the realization of what, at an abstract level, is the same phoneme in their two languages. One common pattern is that the first-acquired language (L1) exerts influence on the second (L2), which is explained by the hypothesis that L2 speech sounds are “filtered” through the previously acquired L1 categories (e.g., Flege, Reference Flege and Strange1995). L1 phonological categories are acquired early in life, with most details consolidated during the first year after birth (Jusczyk, Friederici, Wessels, Svenkerud, & Jusczyk, Reference Jusczyk, Friederici, Wessels, Svenkerud and Jusczyk1993), impeding speakers’ ability to develop new categories associated with an L2 later in life (Best, Reference Best, Goodman and Nusbaum1994). Relatedly, L1 categories are themselves vulnerable to L2 influence. This is particularly true in situations of prolonged, intense exposure to the L2 that can cause the L1 to evolve over time, and result in L1 categories drifting towards and even merging with L2 categories (Bergmann, Nota, Sprenger, & Schmid, Reference Bergmann, Nota, Sprenger and Schmid2016).
A special case of prolonged and intense bilingualism is observed in so-called heritage-language communities (Montrul, Reference Montrul2016). Although there is significant variation in the linguistic ecologies of heritage-language speakers (see, e.g., Benmamoun, Montrul, & Polinsky, Reference Benmamoun, Montrul and Polinsky2013a), a standard definition would classify heritage speakers as sequential or simultaneous bilinguals who grow up speaking two languages. The minority (heritage) language is the most common language used by caretakers at home and the dominant language during early childhood. As individuals start to engage with members of the surrounding community, usually around early childhood when they start school, the majority (nonheritage) language often becomes their dominant language (Benmamoun, Montrul, & Polinsky Reference Benmamoun, Montrul and Polinsky2013b). Adult heritage speakers thus typically become strong speakers of the majority language, with relatively weaker capacities in the heritage language. As reviewed by Chang (Reference Chang, Montrul and Polinsky2021), this relative dominance of the majority of L2 in heritage speakers often results in their L2 influencing the phonetic categories of their heritage L1. At the same time, however, there is evidence for the persistence of L1, even among speakers who appear to have undergone substantial L1 attrition and concomitant shift to an L2 (Choi, Broersma, & Cutler, Reference Choi, Broersma and Cutler2017).
The specific communicative context in which bilingual speakers find themselves can also result in differential levels of activation of the grammars of their two languages. Grosjean (Reference Grosjean and Nicol2001, Reference Grosjean2008; also Grosjean & Miller, Reference Grosjean and Miller1994) proposes the so-called “Language Mode Framework” in which bilingual speakers are conceptualized as moving along a continuum between two mostly “unilingual” endpoints (where one of the two languages is maximally active and the other maximally suppressed) and intermediate bilingual modes (where both languages are activated). When a bilingual speaker interacts with an interlocutor who speaks only one of their two languages, the bilingual would move towards a unilingual endpoint of the continuum and maximally suppress the language not shared by the interlocutor. When communicating with another bilingual speaker, however, both languages can be activated simultaneously, and the bilinguals may even engage in code-switching practices. Since bilinguals can move along this continuum based on the communicative context, their two languages can manifest differential levels of influence, potentially resulting in different cross-language interference patterns between their languages (Antoniou, Best, Tyler, & Kroos, Reference Antoniou, Best, Tyler and Kroos2011; Henriksen et al., Reference Henriksen, Coetzee, García-Amaya and Fischer2021; Olson, Reference Olson2016).
It is also possible that the influence between a speaker’s two languages may fluctuate across different aspects of bilingual grammar. In their study of the realization of /b d/ in the Afrikaans and Spanish of the Patagonian bilinguals, Henriksen et al. (Reference Henriksen, Coetzee, García-Amaya and Fischer2021) found evidence for the L1 Afrikaans of the speakers influencing their L2 Spanish, but not for the inverse. In a different study of the same bilingual community, however, Henriksen, García-Amaya, Coetzee, and Wissing (Reference Henriksen, García-Amaya, Coetzee, Wissing, Martínez-Gil and Colina2019; see also Coetzee, García-Amaya, & Henriksen, Reference Coetzee, García-Amaya, Henriksen, Carstens and Bosman2024) found evidence for influence in the other direction, reporting that the durational difference between phonemically long and short vowels in the Afrikaans of the bilingual speakers is reduced relative to the speech of comparison Afrikaans speakers from South Africa, most likely due to influence from Spanish.
The Afrikaans–Spanish bilingual community in Patagonia, Argentina
The current study focuses on an Afrikaans–Spanish bilingual community residing in the central Patagonian Chubut province within Argentina. This community comprises descendants of approximately 650 Afrikaans-speaking settlers who migrated from the southern tip of Africa (modern-day South Africa) to Patagonia between 1902 and 1906. Upon their arrival in Patagonia, the community settled around the coastal village of Comodoro Rivadavia and the village of Sarmiento about 100 miles inland (see Figure 1). At the time of settlement, the Patagonian region was sparsely populated, with the result that the community was able to maintain their Afrikaans cultural and linguistic practices with limited impact from Argentine culture and the Spanish language (Coetzee et al., Reference Coetzee, García-Amaya, Henriksen, Carstens and Bosman2024; Szpiech et al., Reference Szpiech, Shapero, Coetzee, García-Amaya, Alberto, Langland and Henriksen2020). Consequently, this community was functionally Afrikaans monolingual for the first four to five decades after the initial settlement in Patagonia.
Left panel: South America with the location of Argentina marked in darker shading. Right panel: Argentina, with the Chubut province marked in darker shading. Comodoro Rivadavia and Sarmiento are the sites of the original South African settlement and where most members of the Afrikaans community are concentrated today.

The early perseverance of Afrikaans resulted in the community shifting to the majority language (Spanish) one generation later than what is typical in immigrant communities (Fishman, Reference Fishman, Gumperz and Hymes1972, Reference Fishman1980), with the consequence that Afrikaans is still spoken by the oldest community members today, more than 120 years after the original settlement. The gradual shift from Afrikaans to Spanish only started in the 1950s when larger numbers of Spanish speakers moved to the region due to the development of the local oil industry (Szpiech et al., Reference Szpiech, Shapero, Coetzee, García-Amaya, Alberto, Langland and Henriksen2020). Today, the settlers’ descendants are still concentrated around Comodoro Rivadavia and Sarmiento. Although the community has maintained a strong Afrikaans cultural identity, linguistically they have shifted to Spanish. Therefore, it is only the oldest, third-generation members who have maintained communicative abilities in Afrikaans (in addition to acquiring Spanish). The exact number of Afrikaans–Spanish speakers in the community is difficult to estimate, but there were likely no more than 40 at the time of our data collection in 2018.
Although there are many ways in which the Patagonian community shares characteristics with heritage-speaker communities (see discussion in the Bilingual phonetics section), Coetzee et al. (Reference Coetzee, García-Amaya, Henriksen, Carstens and Bosman2024) point out that there are important differences between the linguistic ecology of this community and typical heritage communities. On the one hand, similar to a typical heritage-language community, the Patagonian bilinguals communicated almost exclusively in their L1 (Afrikaans) during early childhood and shifted to the majority use of their L2 (Spanish) later in life. On the other hand, they started learning their L2 later in life than is typical for heritage communities, and maintained fairly high levels of proficiency in their L1, even as they shifted to majority Spanish usage upon integration into Argentine society (Coetzee et al., Reference Coetzee, García-Amaya, Henriksen, Carstens and Bosman2024; García-Amaya, Reference García-Amaya2022; Szpiech et al., Reference Szpiech, Shapero, Coetzee, García-Amaya, Alberto, Langland and Henriksen2020). These bilingual speakers therefore also resemble typical late L2 learners due to the limited opportunities for sustained L2 contact, at least during the early stages of acquisition (e.g., Amengual, Reference Amengual2017).
Research questions and hypotheses
In the research questions and hypotheses below, we refer to Afrikaans and Spanish “comparison speakers”—these are Afrikaans speakers who do not speak Spanish, and Spanish speakers who do not speak Afrikaans, respectively, and who can therefore serve as reference points for the patterns observed in the speech of the Patagonian bilinguals. Our research questions are informed, on the one hand, by the Afrikaans and Spanish literature that leads us to hypothesize that these two languages should pattern differently with regard to the lenition of intervocalic plosives (Intervocalic plosives in Spanish and Afrikaans section), and on the other hand, by the literature on bilingual phonetics demonstrating complex patterns of influence between a bilingual’s two languages (Bilingual phonetics section). We state the hypotheses in terms of the three acoustic measures of lenition (see Table 1). Hypotheses 1 and 2 involve between-language comparisons, whereas Hypotheses 3a and 3b involve within-language comparisons.
Research Question 1: Do the Spanish comparison speakers (S-Comp) show more evidence for intervocalic lenition than the Afrikaans comparison speakers (A-Comp) for /p t k/ and /b d (ɡ)/?
Hypothesis 1: (H1): Spanish comparison speakers will show more evidence of lenition than Afrikaans comparison speakers: (i) C-Duration: A-Comp > S-Comp; (ii) C/V-Intensity-Ratio: A-Comp < S-Comp; (iii) Percent Voicing (for /p t k/ only): A-Comp < S-Comp.Footnote 2
Research Question 2: Do the Afrikaans–Spanish bilingual speakers produce separate or merged phonetic realizations for each of /p t k/ and /b d (ɡ)/ when speaking Afrikaans (A-Bil) and Spanish (S-Bil)?
Hypothesis 2: (H2, separate Afrikaans and Spanish categories): The Afrikaans–Spanish bilingual speakers will produce intervocalic plosives as more Spanish-like when speaking Spanish (more lenition), but as more Afrikaans-like when speaking Afrikaans (less lenition): (i) C-Duration: A-Bil > S-Bil; (ii) C/V-Intensity-Ratio: A-Bil < S-Bil; (iii) Percent Voicing (for /p t k/ only): A-Bil < S-Bil.
Research question 3: Do the two languages of the Afrikaans–Spanish bilingual speakers influence each other? That is, to what extent are their realizations of intervocalic plosives intermediate between those of the comparison groups?
Hypothesis 3a: (H3a, L1-to-L2 influence): The Afrikaans of the bilingual speakers influences the realization of their intervocalic plosives in Spanish, which will thus be less lenited than those of the Spanish comparisons: (i) C-Duration: S-Bil > S-Comp; (ii) C/V-Intensity-Ratio: S-Bil < S-Comp; (iii) Percent Voicing (for /p t k/ only): S-Bil < S-Comp.
Hypothesis 3b: (H3b, L2-to-L1 influence): The Spanish of the bilingual speakers influences the realization of their intervocalic plosives in Afrikaans, which will be thus more lenited than those of the Afrikaans comparisons: (i) C-Duration: A-Comp > A-Bil; (ii) C/V-Intensity-Ratio: A-Comp < A-Bil; (iii) Percent Voicing (for /p t k/ only): A-Comp < A-Bil.
Methods
Participants and data collection
The data for this project come from 49 sociolinguistic interviews conducted with 35 speakers: 14 Afrikaans–Spanish bilinguals (9 female, 5 male); 10 Spanish comparison speakers from Patagonia (5 female, 5 male); and 11 Afrikaans comparison speakers from Potchefstroom, South Africa (4 female, 7 male).Footnote 3 Interviews were structured as informal sociolinguistic interviews, covering a range of topics, including family life, the community’s cultural practices and history, linguistic ideologies, etc. Although we aimed to cover the same broad themes in all interviews, the informal nature of this method means that individual interviews differed to some extent in both content and structure. Interviews were typically conducted in the participants’ homes, or some other quiet space of the participants’ choice. The bilinguals were interviewed separately in both Afrikaans and Spanish, and the comparison speakers were interviewed once in each of their respective native languages. All Spanish interviews were conducted by the same native speaker of Spanish, while two different native speakers of Afrikaans conducted the Afrikaans interviews in Argentina and South Africa, respectively. The interviewers in Patagonia (the first and third authors) shared only one language with the bilinguals (Afrikaans or Spanish, respectively) so these interviews were conducted in what would be classified as a “unilingual” context per Grosjean (Reference Grosjean2008). Other than occasional metalinguistic commentary regarding the other language, there was little to no code-switching between Afrikaans and Spanish in these interviews. The average duration of all interviews was 36 minutes and 51 seconds.
The mean ages for the groups were: for the bilingual speakers, 71.4 (range= 55–82, SD= 7.7); for the Spanish-comparison speakers, 51.8 (range= 38–64, SD= 8.4); and for the Afrikaans-comparison speakers, 71.5 (range= 65–81, SD= 7.1). The age range for the bilingual speakers and the Afrikaans-comparison speakers were hence comparable, while the Spanish-comparison speakers were younger than the other two groups. Although we are not aware of evidence to suggest generational differences in the production of Patagonian–Spanish plosives, previous research demonstrates that cognitive changes in aging may affect speech production (Horton, Spieler, & Shriberg, Reference Horton, Spieler and Shriberg2010). We therefore included speakers’ birth years as a control variable in the first iteration of model fitting in the statistical analysis.
Particularly relevant here is the study by Henriksen et al. (Reference Henriksen, Coetzee, García-Amaya and Fischer2021) who report on the lenition of intervocalic voiced plosives in the same speech community that is the focus of the current study. While the present study can be viewed as partially replicating Henriksen et al.’s work, there are notable differences between the two studies, making the current study a substantial expansion of Henriksen et al.’s research. First, regarding empirical scope, the inclusion of voiceless plosives in the current study means that its coverage of lenition is broader than that of Henriksen et al. who focused on voiced plosives only. Additionally, that study reported the speech of the bilingual Afrikaans–Spanish speakers exclusively, so that it could not compare the speech of the bilinguals with that of respective comparison groups. The most important difference between the current study and that of Henriksen et al., however, relates to the sociocommunicative contexts in which the data were collected. Henriksen et al. collected their data through a carefully controlled experiment in which the bilinguals were asked to read sentences that simulated various unilingual and code-switching situations. Data for the current study, however, come from informal sociolinguistic interviews and are therefore reflective of how the participants use language in more naturalistic settings. We do not consider either approach as being better than the other and instead see them as answering different, even if related, questions. We return to a comparison of the results of the current study to those of Henriksen et al. in the How do Spanish and Afrikaans influence each other in the speech of bilingual speakers? (H3a and H3b) section.
Data labeling and acoustic analysis
We extracted all occurrences of intervocalic phonological /p t k b d (ɡ)/ from the Afrikaans and Spanish interviews (see Table 2 for relevant examples). Since Afrikaans lacks /ɡ/, there are no such tokens from the Afrikaans interviews. The target plosives were extracted irrespective of their position in the word, meaning that word-initial, word-medial, and word-final plosives were included.Footnote 4 For word-initial and word-final plosives, we excluded tokens where a pause intervened between the target plosive and the preceding vowel (for initial plosives) or following vowel (for final plosives). For the Spanish data, we excluded instances of /b d ɡ/ that appeared to have undergone complete lenition, meaning there was no acoustic evidence indicating the presence of the target phoneme. In total, we included 32,644 tokens in the analysis (see Table 3).
Examples of words extracted for analysis. No examples of /ɡ/ are included for Afrikaans since Afrikaans does not have the phoneme /ɡ/. Additionally, due to the application of final devoicing, there are also no examples of word-final /b d/ in Afrikaans. Spanish syllable structure does not allow word-final plosives, resulting in no Spanish examples for this word-position.

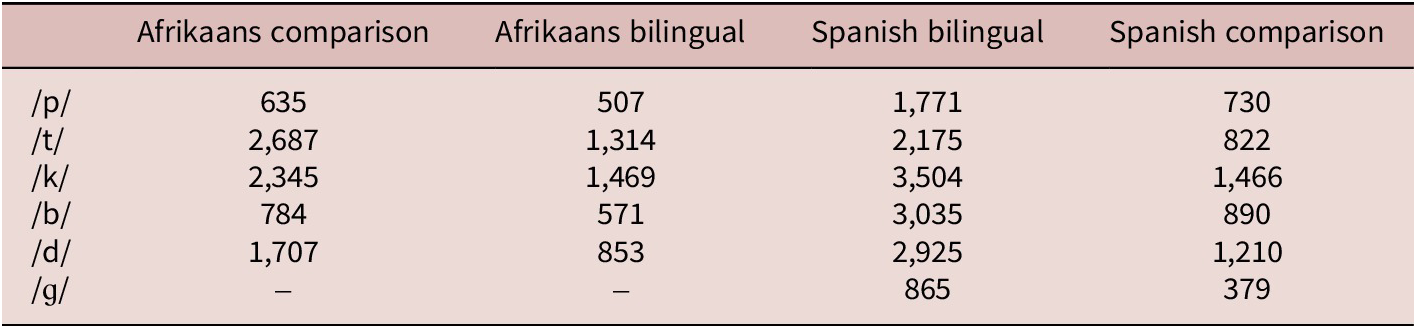
Number of tokens included in the analysis, grouped according to phoneme and speaker group.

The recordings were analyzed in Praat (Boersma & Weenink, Reference Boersma and Weenink2023), with acoustic labeling of the target sounds based on simultaneous inspection of waveforms and wide-band spectrograms. For all plosives (voiced and voiceless), we marked the consonantal constriction. We labeled the onset of the constriction at the zero crossing that coincided with the cessation of formant structure from the preceding vowel (paying specific attention to attenuation of F2) and a pronounced decrease in the amplitude of the signal. For those tokens that contained a release burst, the offset of the consonantal constriction was marked as the moment of the burst itself. Some tokens (especially for /b d ɡ/) often lacked a release burst, and for such tokens the offset of the constriction was marked as the beginning of periodic oscillation clearly associated with the following vowel (Nadeu & Hualde, Reference Nadeu and Hualde2015). For the voiceless plosives /p t k/ we additionally marked the portion of the closure realized with voicing. We marked as voiced the portion of the consonantal constriction (if any) characterized by clear vocal pulses identifiable on the waveform and a low-frequency “voicing band” on the spectrogram. Figures 2 and 3 provide examples of intervocalic /b p/ from Spanish and Afrikaans comparison speakers.
Top panel: /abu/-segment of Spanish word abuela [abuela] ‘grandmother’. Bottom panel: /ipo/-segment of Spanish word tipo /tipo/ ‘guy’.

Top panel: /ɔbə/-segment of Afrikaans word bobbejaan /bɔbəjɑːn/ ‘baboon’. Bottom panel: /ɑpə/-segment of Afrikaans word aartappel /ɑːrtɑpəl/ ‘potato’.

For each token, we extracted the duration of the constriction, the minimum intensity during the constriction, and the maximum intensity during the following vowel. For the voiceless plosives we additionally extracted the duration of the constriction realized with voicing. Using this acoustic information, we calculated the three measures of C-Duration, C/V-Intensity-Ratio, and Percent Voicing (see the Intervocalic plosives in Spanish and Afrikaans section).Footnote 5
Statistical analysis
C-Duration, C/V-Intensity-Ratio, and Percent Voicing (for /p t k/ only) were the dependent variables in the analysis.Footnote 6 We fitted linear mixed-effects models to the C-Duration and C/V-Intensity-Ratio outcome variables using the “lmerTest” package (Kuznetsova, Brockhoff, & Christensen, Reference Kuznetsova, Brockhoff and Christensen2017) in R, version 4.3.1 (R Core Team, 2023). During model building, we checked the model assumptions, such as the normality of residuals and random effects, as well as the linearity of continuous predictors. To better meet the normality assumptions, the C-Duration values were log-transformed. For Percent Voicing, we treated the outcome as a continuous variable between zero and one and thus fitted a Beta regression model using the “glmmTMB” package (Brooks et al., Reference Brooks, Kristensen, Van Benthem, Magnusson, Berg, Nielsen and Bolker2017).
As fixed factors in all models, we included GROUP (S-Comp, S-Bil, A-Bil, A-Comp), PHONEME (/p/, /t/, /k/, /b/, /d/, /ɡ/) and their two-way interaction. We included this interaction based on previous research demonstrating that lenition does not apply uniformly across all phonemes in Spanish (Broś & Lipowska, Reference Broś and Lipowska2019; Hualde et al., Reference Hualde, Simonet and Nadeu2011). We additionally added STRESS (stressed, unstressed), WORD POSITION (initial, medial, final), V1 FRONTNESS (front, central, back), V2 FRONTNESS (front, central, back), V1 HEIGHT, and V2 HEIGHT (low, mid, high) as control variables due to the role they can play in plosive lenition. For example, longer consonants are more likely to occur in stressed than in unstressed syllables (Hualde et al., Reference Hualde, Simonet and Nadeu2011). Finally, we included BIRTH YEAR as a control variable for each speaker. The effects of all significant covariates are presented in Figures 1–16 in the Supplementary Materials.
For random effects, we included a random intercept for SPEAKER to account for within-speaker dependencies in all models. Further, we included by-SPEAKER random slopes for all possible fixed-effect variables in the models, following Barr, Levy, Scheepers, and Tily (Reference Barr, Levy, Scheepers and Tily2013). If these maximum models did not converge, we removed by-SPEAKER random slope effects, one at a time, starting with the effect having the smallest estimated variance. For C/V-Intensity-Ratio, we found the maximum model to converge. For C-Duration, the first converging model included only WORD POSITION as a by-SPEAKER random slope. For Percent Voicing, the converging model included WORD POSITION and PHONEME as by-SPEAKER random slopes.
For fixed-effects selection, we followed the top-down strategy with all potential effects in the model and sequentially removed all nonsignificant effects, starting with the highest order interaction (see West, Welch, & Galecki, Reference West, Welch and Galecki2014, p. 39). In the C-Duration and C/V-Intensity-Ratio models, we only removed BIRTH YEAR, as all other terms returned a significant result. For Percent Voicing, only V1 FRONTNESS was removed.
Since we performed sociolinguistic interviews, we could not experimentally control for all factors that may influence the realization of plosives but that are not directly relevant to the current research and hypotheses (e.g., sentential prominence, lexical stress, position in word, identity of surrounding vowels, speech rate, speaker sex and age, age of acquisition). Importantly, because our data come from informal interviews, the specific tokens included here can be viewed as a random sample, reducing the risk of skewed results due to uncontrolled biases in the data. Although we controlled for some item-specific (lexical stress, vowel identity, word position) and speaker-specific (age) characteristics, and although we assume that the data represent a random sample, unobserved heterogeneity among speakers might still influence our results.
We computed type III F-statistics for the predictor variables of interest and their interactions for the linear mixed models (C-Duration, C/V-Intensity-Ratio) and Chi-square statistics for the Beta regression model (Percent Voicing). As a measure of effect size, we computed marginal R2, the percentage of variance explained by the reported variable adjusted for the other predictors in the model, using the R package “r2glmm” (Jaeger, Edwards, Das & Sen, Reference Jaeger, Edwards, Das and Sen2017; Jaeger et al., Reference Jaeger2017). To facilitate model-based inference regarding the fixed effects, we computed model-predicted means based on the fitted models using the R package “ggeffects” (Lüdecke, Reference Lüdecke2018). Finally, we performed 54 targeted pairwise tests based on the aforementioned hypotheses using the R package “multcomp” (Hothorn, Bretz, & Westfall, Reference Hothorn, Bretz and Westfall2008). For each of these 54 tests, we report the corresponding t-value, p-value, and a measure of effect size (eff), following Westfall, Kenny, and Judd (Reference Westfall, Kenny and Judd2014). Tables 1 through 3 of the Supplementary Materials order the pairwise comparisons based on effect size, from highest to lowest. For all pairwise tests, we maintain a corrected alpha level of .05/54 = .0009.
Results
Consonant duration
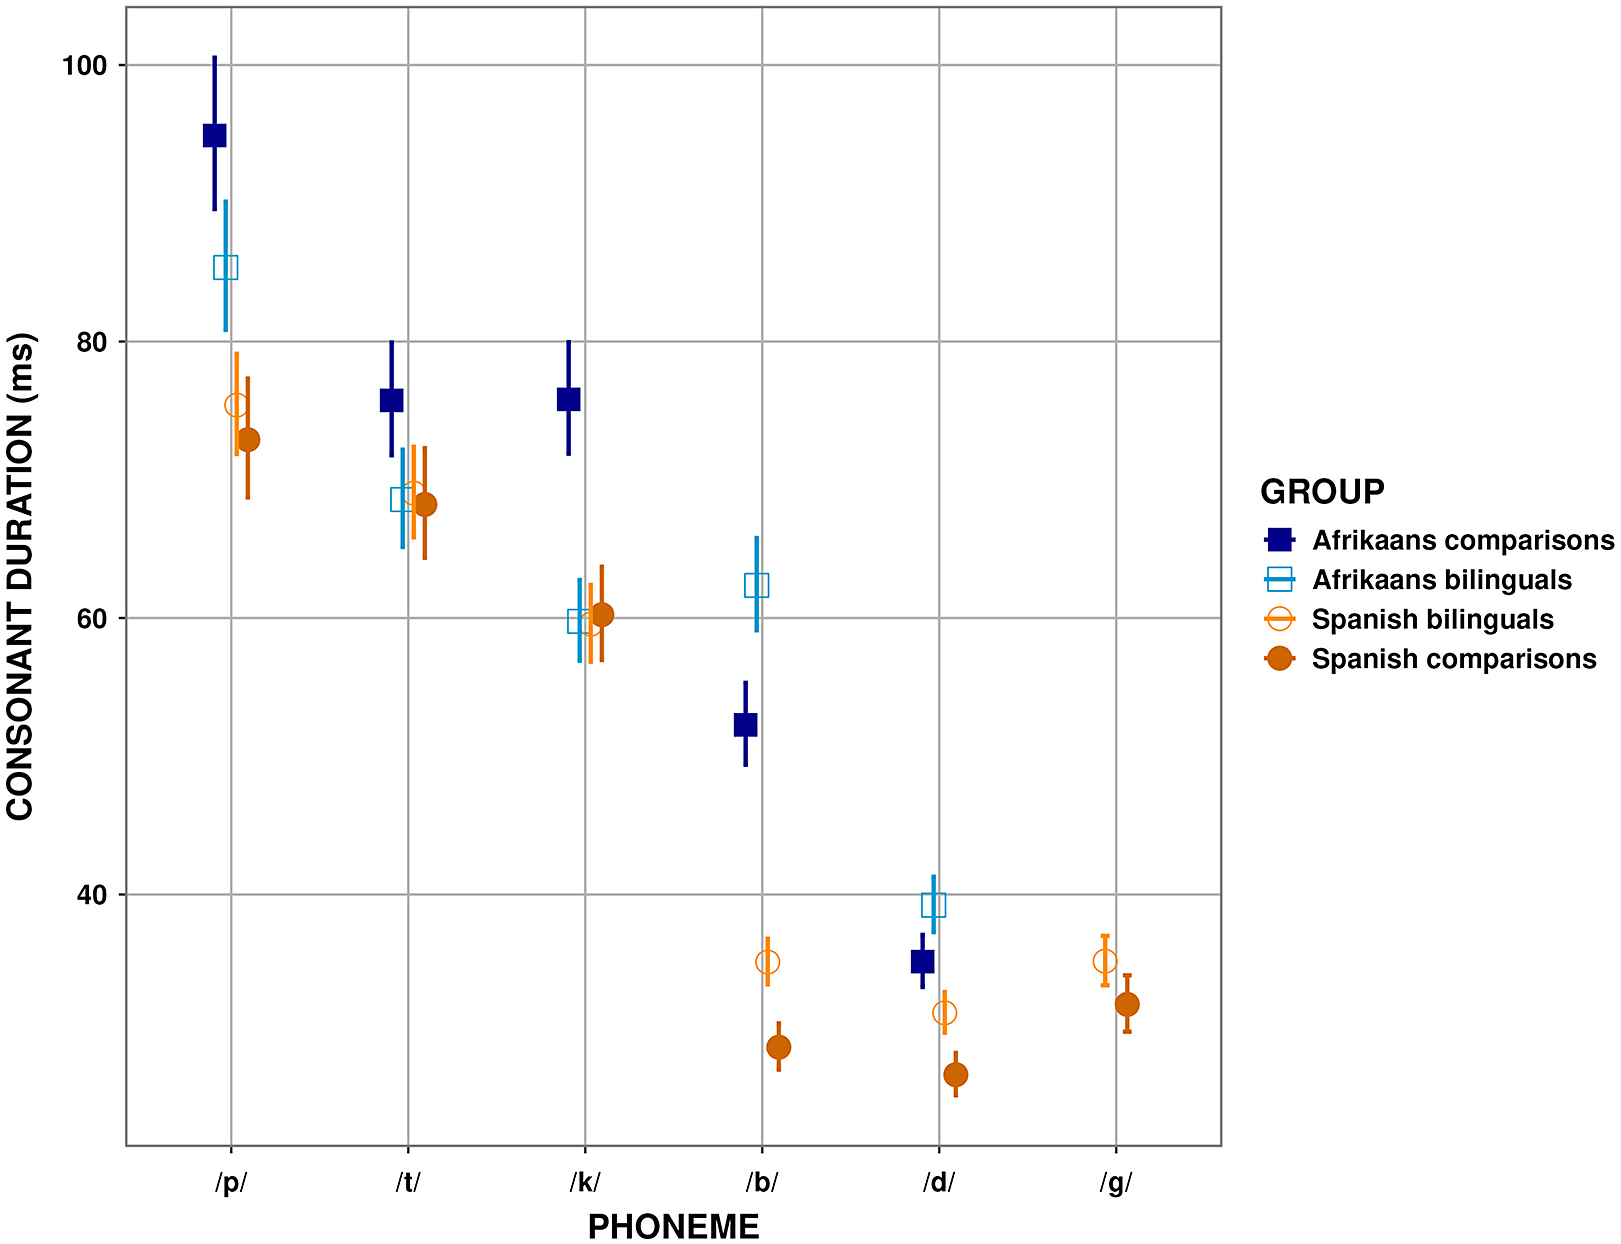
We interpret lower C-Duration values as evidence of greater lenition. For this outcome, we uncovered a significant effect for the two-way interaction GROUP * PHONEME (F(13, 30.540) = 140.34, p < .001, marginal R2 = .05). Table 4 summarizes the results for each phoneme with respect to the study’s hypotheses, and Figure 4 shows the corresponding model-predicted means and confidence intervals.
Results for C-Duration in relation to the hypotheses. A checkmark indicates that the p-value of the test was below the corrected alpha level of .0009. An “X” symbol indicates that a particular comparison did not reach significance in the expected direction per the hypothesis. A dash indicates a cell where the comparison was not possible due to the fact that Afrikaans lacks the phoneme /ɡ/. Table 1 in the Supplementary Materials contains detailed results of the performed t-tests, including t-values, p-values, and effect sizes.

Model-predicted means for each GROUP per PHONEME for the outcome CONSONANT DURATION. Error bars mark the 95% confidence intervals around each predicted mean value.

Regarding H1 (comparing the two comparison groups), the results in the first row of Table 4 offer near-consistent support for this hypothesis. For /p k b d/, the comparison groups show significant differences, with the Afrikaans comparisons having higher C-Duration values (cf. Figure 4). Additionally, the difference for /t/ is in the expected direction, but is not at the level of significance.
For H2 (comparing the bilinguals in their two languages), the results in row 2 of Table 4 show a less consistent pattern. As corroborated through Figure 4, the bilingual speakers produced /p b d/ on average with significantly higher C-Duration values in Afrikaans than in Spanish, indicating that they kept the realization of these plosives separate in their two languages. For the phonemes /t k/, however, we did not find evidence for a mean difference in C-Duration between the bilinguals’ Afrikaans and Spanish data, suggesting a possible cross-language merger in the realizations of these sounds.
Regarding H3a (comparing the two Spanish-speaking groups; row 3 of Table 4), we again find mixed results. In terms of the potential influence of L1 Afrikaans on L2 Spanish, the bilinguals produced Spanish /b d/ with significantly higher C-Duration values, compared to the Spanish comparison speakers. These findings suggest L1-to-L2 influence. For /p t k/, however, we did not find significant differences between the two Spanish-speaking groups, which suggests a lack of L1-to-L2 influence. The same pattern was found for /ɡ/ (no significant difference between the comparison and bilingual speakers). Importantly, since Afrikaans lacks /ɡ/, no competing Afrikaans sound could interfere with the production of this sound in the Spanish of the bilingual speakers.
Finally, for H3b (comparing the two Afrikaans-speaking groups; row 4 of Table 4), we found limited support regarding the possible influence of L2 Spanish on L1 Afrikaans. Even though, in agreement with H3b, the Afrikaans comparison speakers have on average longer C-Duration values for /p t k/ than the bilinguals in Afrikaans (Figure 4), this difference reached significance for /k/ only. The data trend for /b d/ was unexpected such that the mean C-Duration values were higher for the bilinguals than for the comparison speakers, suggesting an even lesser degree of lenition in the bilinguals’ Afrikaans. These longer closures in bilingual Afrikaans are difficult to explain, but minimally we can conclude that there is no evidence that the bilinguals’ Afrikaans voiced plosives are impacted by Spanish (we therefore do not include a “✓” symbol for /b d/ in row 4 of Table 4).
C/V intensity ratio
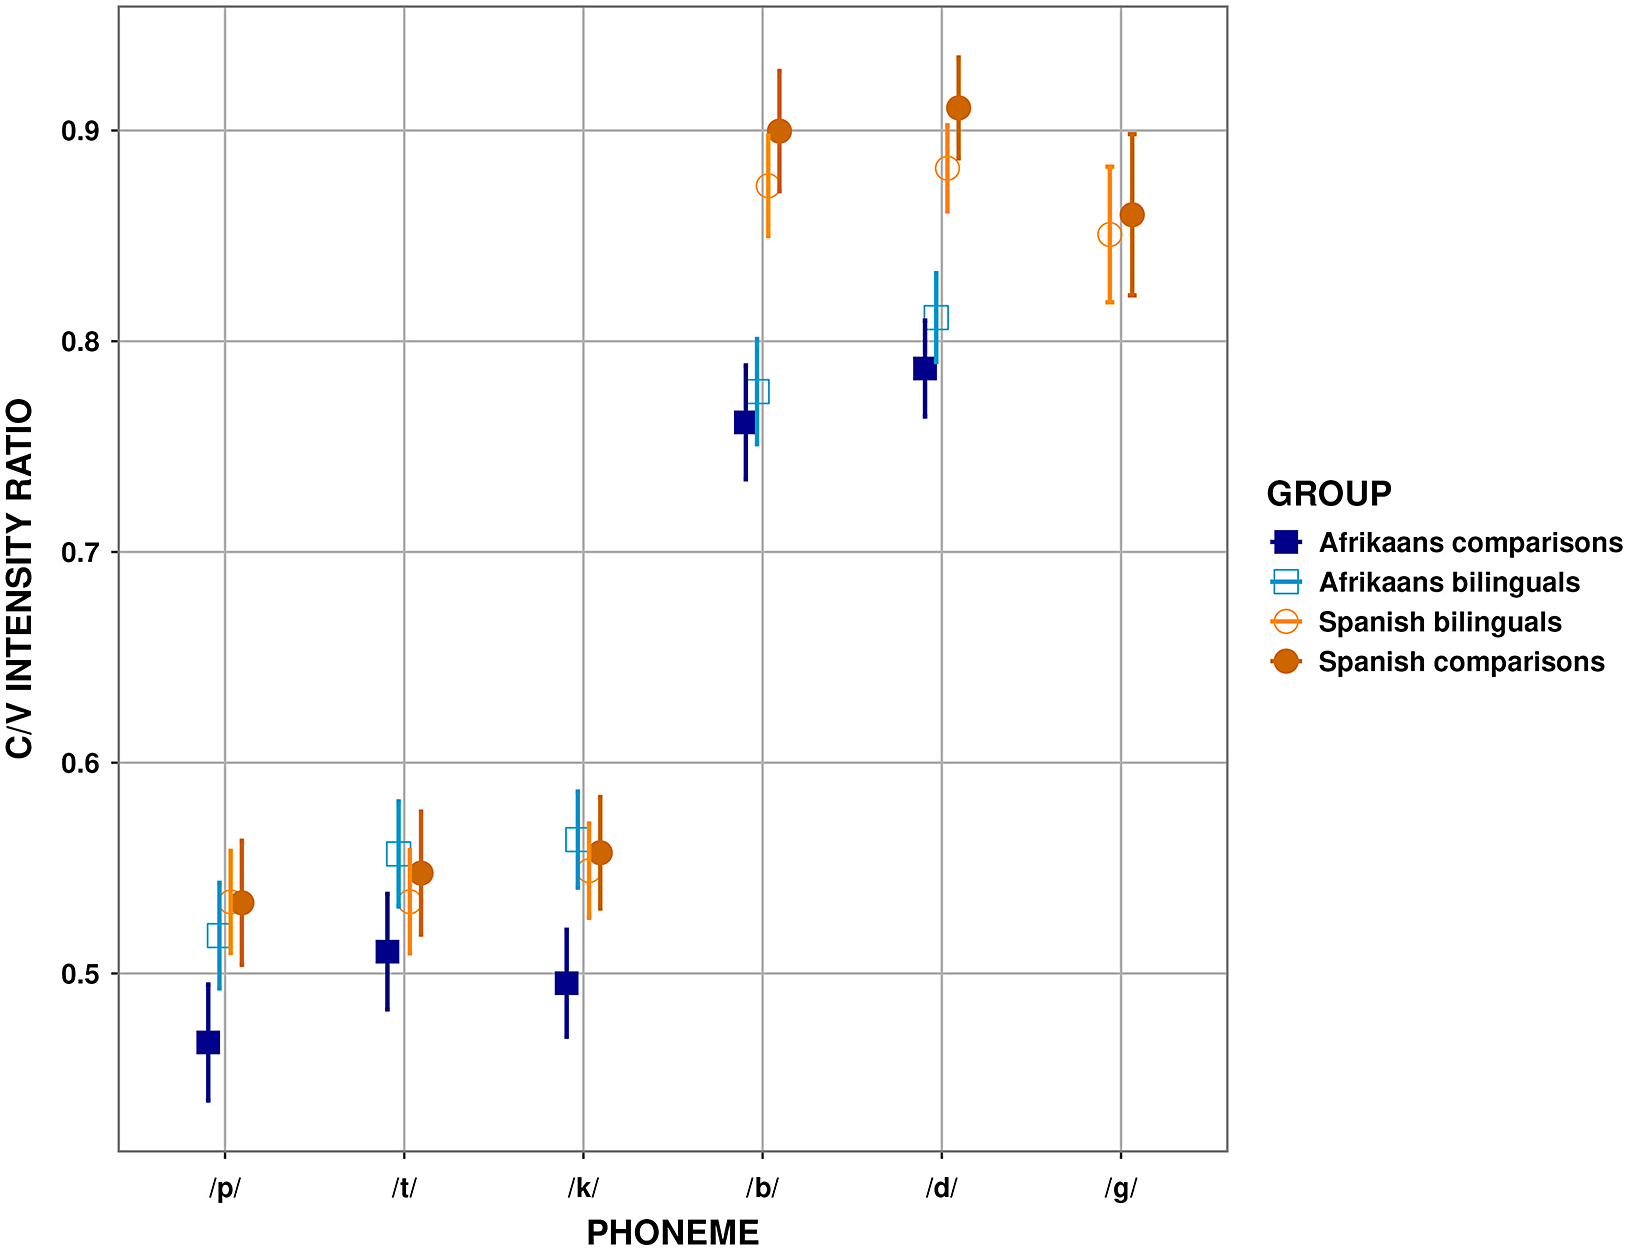
Regarding C/V-Intensity-Ratio, we found a significant two-way interaction between GROUP and PHONEME (F(13, 55.613) = 72.369, p < .001, marginal R2 = .031). Table 5 summarizes the t-test results, and Figure 5 plots the model-predicted means and confidence intervals.
Results for C/V-Intensity-Ratio in relation to the hypotheses. A checkmark indicates that the p-value of the test was below the corrected alpha level of .0009. An “X” symbol indicates that a particular comparison did not reach significance in the expected direction per the hypothesis. A dash indicates a cell where the comparison was not possible due the fact that Afrikaans lacks the phoneme /ɡ/. Table 2 in the Supplementary Materials contains detailed results of the performed t-tests, including t-values, p-values, and effect sizes.

Model-predicted means for each GROUP per PHONEME for the outcome C/V INTENSITY RATIO. Error bars mark the 95% confidence intervals around each predicted mean value.

Regarding H1 (comparing the two comparison groups), we found evidence that Afrikaans and Spanish comparison speakers produce /b d/ in significantly different ways (row 1 of Table 5). For these two plosives, the Spanish comparison speakers have higher C/V-Intensity-Ratios than the Afrikaans comparison speakers (Figure 5). For /p t k/, the Spanish comparisons also have higher predicted mean values than the Afrikaans comparisons. Although these differences were not statistically significant, the effect sizes (cf. Table 2 in the Supplementary Materials) indicate relatively strong effects for /p/ and /k/ (9.952 and 9.297, respectively) and a moderate effect for /t/ (5.595).
For the bilinguals’ between-language comparisons (H2; second row of Table 5), we found significant mean differences across all five phonemes: C/V-Intensity-Ratios were higher in Spanish than in Afrikaans for /p b d/, indicating the expected pattern of more lenition in Spanish. Unexpectedly, however, C/V-Intensity-Ratio was lower for /t k/ (Figure 5) in Spanish than Afrikaans, indicating potentially more lenited productions of these sounds in the speakers’ Afrikaans than Spanish. Since the effect is in the opposite to the hypothesized direction, we mark the respective cells with an “X” symbol in Table 5. Of note, the effect sizes of /p t k/ were some of the weaker findings for this metric (between 2.215 and 3.407; see Supplementary Materials).
With regard to H3a, in no instance did we find evidence of significantly lower mean C/V-Intensity-Ratio values for the bilingual speakers in Spanish than for the Spanish comparisons (row 3 in Table 5). Regarding potential L2-to-L1 effects (H3b), as seen in row 4 of Table 5, for the velar phoneme /k/, the mean C/V-Intensity-Ratio of the Afrikaans bilingual speakers was significantly higher (indicating greater lenition) than that of the Afrikaans comparisons. However, for the other four plosives shared between Afrikaans and Spanish (/p t b d/), the pairwise comparisons do not reflect significant differences. Nonetheless, it is noteworthy that the numerical differences for /p t b d/ align with the expected pattern had the bilinguals’ productions been influenced by Spanish—that is, the predicted mean values are numerically higher for the Afrikaans bilinguals than for the Afrikaans comparisons.
Percent voicing
As with the previous two models, for Percent Voicing we found evidence of a significant interaction between GROUP and PHONEME (Chi2 (6) = 38.130, p < .001). The results are summarized in Table 6, with the model-predicted means shown in Figure 6.
Results for Percent Voicing in relation to the hypotheses. A checkmark indicates that the p-value of the test was below the corrected alpha level of .0009. An “X” symbol indicates that a particular comparison did not reach significance in the expected direction per the hypothesis. Table 3 in the Supplementary Materials contains detailed results of the performed Chi-squared-tests, including t-values, p-values, and effect sizes.

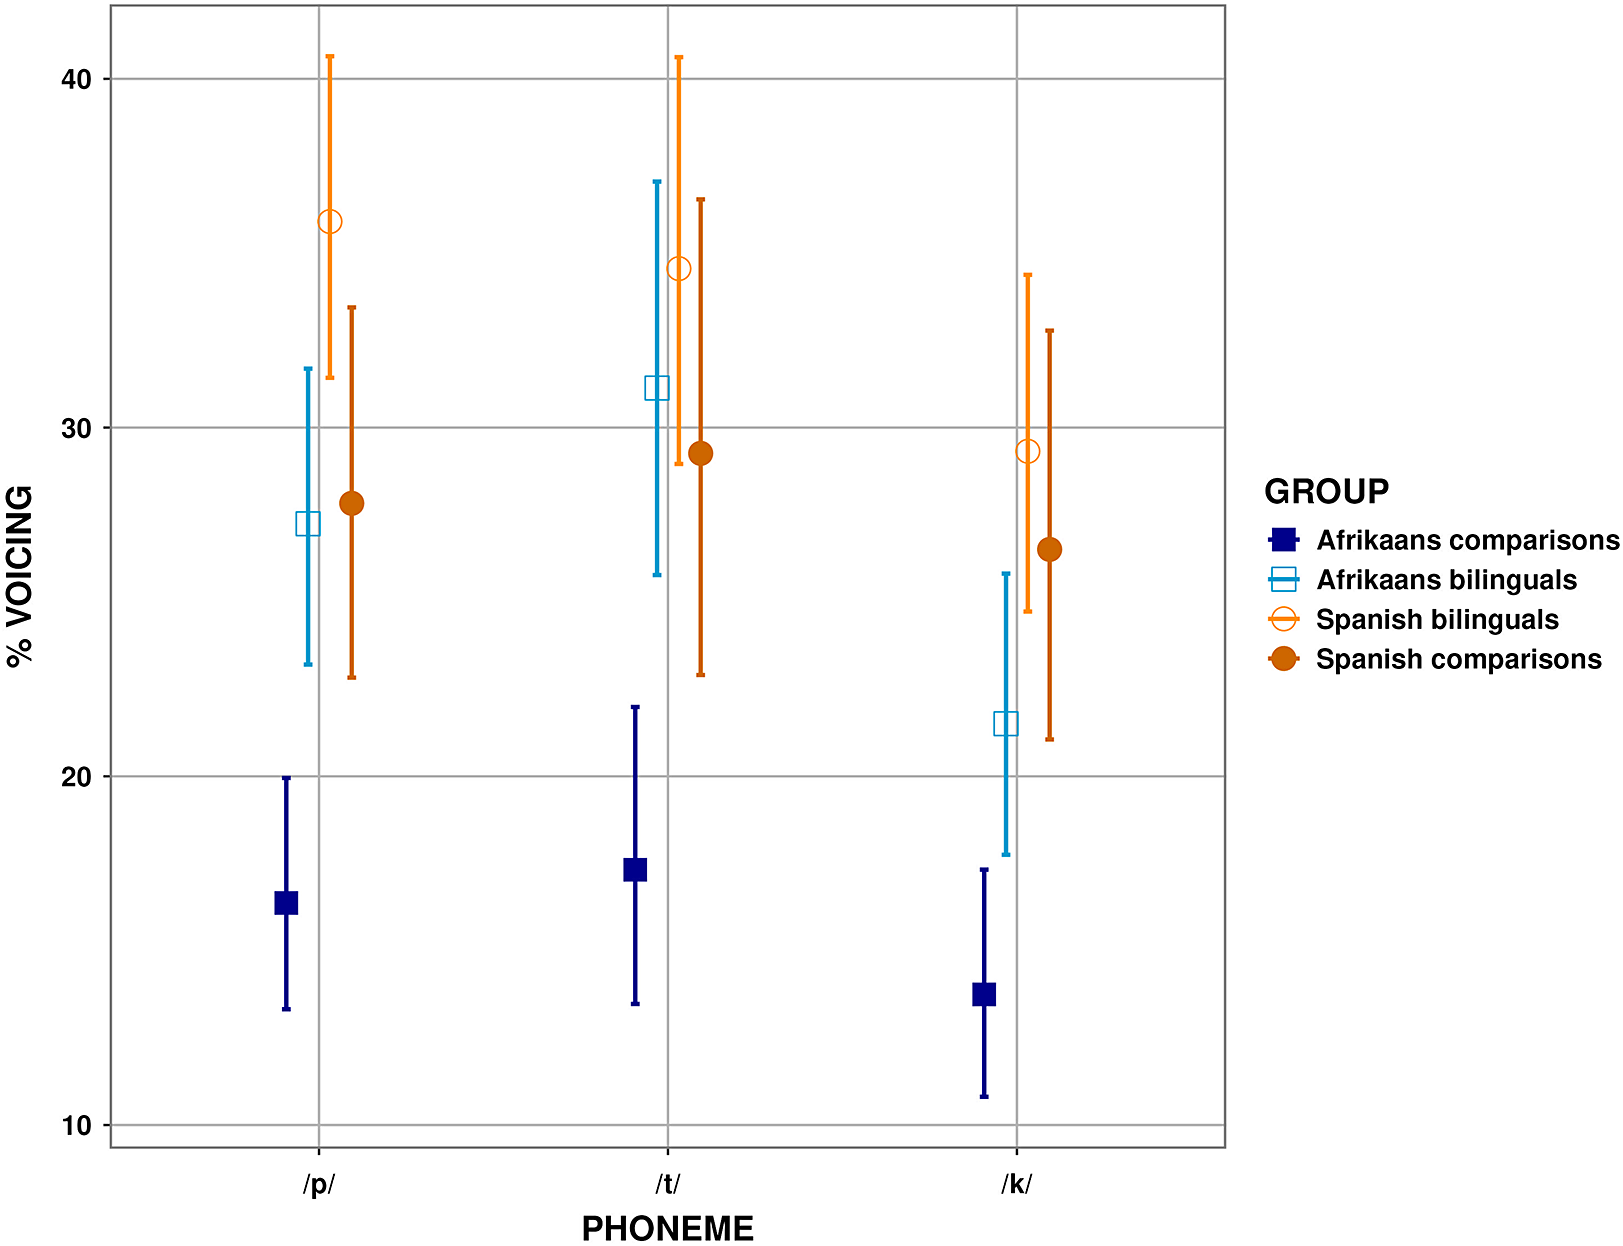
Model-predicted means for each GROUP per PHONEME for the outcome PERCENT VOICING. Error bars mark the 95% confidence intervals around each predicted mean value.

Regarding the two comparison groups (H1), the first row of Table 6, in conjunction with Figure 6, shows that the Spanish comparisons produced significantly greater proportions of their oral closures with voicing for all three phonemes. Similarly, for the bilingual speakers in their two languages (H2), Figure 6 shows that there is a tendency for the bilinguals to produce a greater proportion of their closures with voicing when speaking Spanish than when speaking Afrikaans. Per row 2 of Table 6, all tested differences show a significant finding.
Turning to the within-language comparisons, row 3 of Table 6 (H3a) shows that the Spanish bilingual and comparison speakers do not display significant differences regarding closure voicing. Finally, the comparisons between the Afrikaans bilingual and comparison speakers (H3b; row 4 of Table 6) show that the bilingual speakers produced significantly higher rates of closure voicing than the Afrikaans comparison group for /p t/ (Figure 6 shows a similar pattern for /k/, though the difference is not significant). Collectively, the findings suggest an influence of L2 Spanish on L1 Afrikaans, but not vice-versa.
Discussion
Table 7 synthesizes the results in terms of the hypotheses across the three acoustic measures, with the rest of this section containing a more detailed discussion of the patterns observed in this study.
Summary of group-level effects (Consonant duration, C/V intensity ratio, and Percent voicing sections) in terms of this study’s hypotheses (Research questions and hypotheses section).

How do (and don’t) Afrikaans and Spanish intervocalic plosives differ (H1 and H2)
Intervocalic plosives as produced by Afrikaans and Spanish comparison speakers
Per H1, we hypothesized that for intervocalic plosives, the Spanish comparison speakers would show more evidence of lenition than the Afrikaans comparison speakers. For the voiced plosives, we found strong evidence in support of H1 for /b d/ across both metrics (first row of Table 7). For the voiceless phonemes /p t k/, we almost always found significant differences between the two comparison groups for C-Duration and Percent Voicing, with Spanish speakers overall producing these consonants with more lenition. For C/V-Intensity-Ratio the differences were also in the expected direction with particularly strong effect sizes but did not achieve significance.
While the lenition of voiced plosive phonemes has been phonologized across varieties of Spanish, this process is limited to a gradient phonetic process in Afrikaans (Intervocalic plosives in Spanish and Afrikaans section). The differences in voiced plosives between Spanish and Afrikaans can be seen as a reflection of this grammatical difference between the two languages: lenition is phonological in Spanish but phonetic in Afrikaans. For the voiceless plosives, however, varieties of Spanish exhibit varying degrees of lenition, with the weakening of intervocalic /p t k/ resembling a gradient phonetic rather than a categorical phonological process (Intervocalic plosives in Spanish and Afrikaans section). The observed dissimilarities between Afrikaans and Spanish /p t k/ are thus more likely attributed to language-specific phonetic implementation than to differences between their phonological grammars (Keating, Reference Keating and Fromkin1985, Reference Keating1990; Strange, Reference Strange, Bohn and Munro2007).
Intervocalic plosives in the Afrikaans and Spanish of the bilingual speakers
Next, we turn to our second hypothesis (H2), that the bilingual speakers would show more lenition in Spanish than in Afrikaans. The second row of Table 7 shows strong support of H2 with respect to the voiced plosives /b d/: the bilinguals had significantly higher C-Duration values and significantly lower C/V-Intensity-Ratio values in Afrikaans than in Spanish. The between-language comparisons for /b d/ had particularly high effect sizes for C-Duration and C/V-Intensity-Ratio (see Supplementary Materials, Tables 1–2), adding additional evidence that these sounds differ between the two languages. For /t k/, there is weaker support that the bilinguals produce more lenition in Spanish than in Afrikaans (the comparisons were significant for Percent Voicing only). While all three comparisons for /p/ were significant, the respective effect sizes were medium (see Supplementary Materials). Taken together, the findings for H2 suggest that the bilinguals exhibit a more robust distinction between the voiced stops across their two languages than they do for the voiceless stops.
How do Spanish and Afrikaans influence each other in the speech of bilingual speakers? (H3a and H3b)
The third research question considered possible mutual influences between the bilingual speakers’ two languages. Starting first with the voiced plosives /b d ɡ/, previous work on the Patagonian community has documented the influence of L1 Afrikaans on L2 Spanish, and not of the converse (Henriksen et al., Reference Henriksen, Coetzee, García-Amaya and Fischer2021). The current study’s results partially agree with those of Henriksen et al. In terms of H3a, as inspection of the third row of Table 7 shows, the bilinguals’ voiced plosives in L2 Spanish differed significantly from those produced by the Spanish comparison speakers for C-Duration (in agreement with Henriksen et al.) but not C/V-Intensity-Ratio (different from Henriksen et al., which reported a significant difference in terms of both C-Duration and C/V-Intensity-Ratio). This result therefore suggests the partial influence of the L1 Afrikaans on the L2 Spanish realizations for the voiced plosives. We suspect that the discrepancy in findings compared to Henriksen et al. may follow from differences in study design (see the Participants and data collection section). Henriksen et al. used an experimentally induced code-switching paradigm, placing speakers in a “bilingual” speech mode (Grosjean, Reference Grosjean2008) likely inducing higher cross-language influence. In contrast, our data were collected in a setting aimed at eliciting a “unilingual” mode in each language (see the Limited evidence for L1/L2 interaction section), leading to more limited cross-language influence. In terms of H3b, we did not find significant differences between the bilinguals’ voiced plosives in Afrikaans and those of the Afrikaans comparison speakers, which suggests a lack of L2-to-L1 influence for /b d (ɡ)/, consistent with Henriksen et al.
Turning to the voiceless phonemes /p t k/, we found no significant differences between the Spanish bilingual and comparison speakers (H3a; third row of Table 7), indicating that the bilinguals’ L2-Spanish voiceless plosives were not susceptible to influence from L1 Afrikaans. On the other hand, we found four significant differences when comparing the bilinguals in Afrikaans to the Afrikaans comparison speakers (H3b; fourth row of Table 7), with some evidence that the bilingual speakers produced /k/ as more lenited than the Afrikaans comparisons. We present two possible explanations for this patterning of /k/: first, the absence of /ɡ/ in Afrikaans means that /k/ can lenite without diminishing the contrast between /k/ and /ɡ/. This situation differs from /p t/, where lenition can result in reduced contrast with /b d/. Secondly, Broś et al. (Reference Broś, Żygis, Sikorski and Wołłejko2021: Figure 4, Table II) found higher rates of lenition for /k/ than /p t/ also in Gran-Canaria Spanish, suggesting that /k/ may generally be more prone to lenition than other voiceless plosives.
The patterns of influence for the voiced and voiceless plosives, therefore, go in opposite directions: The bilinguals’ voiced plosives in Spanish show evidence of influence from Afrikaans (L1-to-L2 influence for C-Duration), while their voiceless plosives in Afrikaans show evidence of influence from Spanish (L2-to-L1 influence for Percent Voicing for /p t/, and for C-Duration and C/V-Intensity-Ratio for /k/). We suggest that these outcomes likely stem from the differences between phonetic and phonological processes in Afrikaans and Spanish. Specifically, the L1-to-L2 influence for /b d/ likely reflects the fact that the voiced plosives represent a grammatical difference between the two languages (lenition of voiced plosives is a phonological process in Spanish but a phonetic process in Afrikaans), while the voicing of voiceless plosives does not (lenition of /p t k/ is phonetic in both languages). When the phonological grammars of the two languages conflict (here, in the realization of the voiced plosives), the grammar of the L1 seems to take precedence, resulting here in L1-to-L2 influence in the realization of the voiced plosives. When no such conflict exists, as with the voiceless plosives, the influence of the L1 is less pronounced, facilitating L2-to-L1 influence and allowing the bilinguals to categorize these sounds similarly in both languages (see the Intervocalic plosives in the Afrikaans and Spanish of the bilingual speakers [H2] section).
Regarding the confirmation of H3a for C-Duration of /b d/, the influence of the L1-Afrikaans on the L2-Spanish voiced plosives further indicates that L1 influence can persist even in contexts of prolonged, intensive contact for bilinguals for whom the L2 has become the dominant language. Similar persistence patterns have been documented for other speech communities characterized by long-term contact (e.g., Antoniou et al., Reference Antoniou, Best, Tyler and Kroos2011). Finally, the influence of L2 Spanish on L1 Afrikaans (H3b) for the voiceless plosives adds evidence that L1 phonetic categories are not necessarily resistant to influence from the L2, especially in contexts of long-term contact (e.g., Bergmann et al., Reference Bergmann, Nota, Sprenger and Schmid2016; Flege, Reference Flege1987).
Limited evidence for L1/L2 interaction
In contexts of intense, prolonged bilingualism, there is often a robust mutual impact of speakers’ two languages (Bilingual phonetics section). Although we found evidence that the two languages of the Patagonian bilinguals impact each other in terms of the realization of intervocalic plosives, the influence can best be described as limited. As Table 7 shows, for the voiced plosives we found no evidence for the influence of L2 Spanish on L1 Afrikaans and limited evidence for such influence in voiceless plosives (H3b). The evidence for L1 Afrikaans influence on L2 Spanish (H3a) is even more tenuous, with Afrikaans impacting only the voiced series of Spanish plosives, and only in terms of C-Duration.
We present two possible explanations for the limited interactions between the speakers’ L1 and L2 in this study. First, we note the communicative context in which the data were collected. As discussed in the Participants and data collection section, the Afrikaans and Spanish interviews were conducted by a member of the research team who did not speak the other language. The bilingual participants therefore likely accommodated to this context by producing mostly monolingual Afrikaans and Spanish in each of the two interviews. The speakers were hence in a “unilingual mode” in each interview (Grosjean, Reference Grosjean2008). The specific communicative context in which our data were collected likely limited the simultaneous activation of both the Spanish and Afrikaans grammars of the speakers and therefore also the opportunity for the two languages to influence one another.
A second possible explanation for the limited cross-language influence relates to longer-term durable communicative patterns in the community. As noted in The Afrikaans–Spanish bilingual community in Patagonia, Argentina section, the Patagonian bilinguals differ from typical heritage communities in that they acquired L2 Spanish later in childhood, resulting in a longer period of predominant L1-Afrikaans use than is typical in heritage communities. This longer early entrenchment of the L1 may have resulted in the bilinguals’ Afrikaans sound patterns becoming more robustly established, and therefore being more resistant to influence from an L2. Furthermore, despite acquiring L2 Spanish later in life than in typical heritage communities, the bilinguals have been predominantly Spanish-speaking for the majority of their lives. Thus, even though Spanish is the bilinguals’ L2, the extensive use of this language has provided them with significant Spanish input, which may account for why their L2 Spanish shows limited influence from L1 Afrikaans, in particular for /p t k/ (H3a).
Altogether, our findings underscore the importance of considering the communicative context in which research is conducted, along with the linguistic ecology of the specific bilingual community, when interpreting the outcomes of bilingual research. Such results caution against making broad-stroke generalizations about cross-language interactions in bilingual speech, and the extent to which phonetic and phonological processes are susceptible to cross-language influence.
Limitations of the current study
This study’s first limitation relates to the differences between the communicative contexts in which our data were collected vis-à-vis the typical sociolinguistic practices of the Patagonian bilinguals. In their everyday lives, the Afrikaans conversations for these bilinguals typically occur with other Afrikaans–Spanish bilinguals and are characterized by frequent code-switching. In contrast, the bilinguals have extensive experience with Spanish conversations in unilingual settings. Our sociolinguistic interviews were conducted in mostly unilingual Afrikaans and Spanish modes, as each interviewer was proficient in only one of the bilinguals’ two languages (Participants and data collection section). The bilingual participants’ unfamiliarity with unilingual Afrikaans contexts may have influenced how well our study’s Afrikaans data reflect their typical language use.
The second limitation relates to the makeup of the two comparison groups. While the Spanish comparison speakers were monolingual Patagonian Spanish speakers, providing an ideal group for comparison with the bilinguals, the Afrikaans comparison speakers, being bilingual in Afrikaans and English, were a less ideal match for the study. The linguistic ecology in South Africa, however, is such that nearly all L1-Afrikaans speakers are also L2 speakers of English, making it impossible to recruit monolingual Afrikaans speakers for comparison. It is worth noting, nonetheless, that the Afrikaans comparison speakers were recruited from an area of South Africa where Afrikaans is the primary language. Additionally, like Afrikaans, English has only limited phonetic intervocalic lenition (Bouavichith & Davidson, Reference Bouavichith and Davidson2013), meaning that potential influence from English is unlikely to have impacted their production of intervocalic plosives.
Conclusion
This study presented an in-depth exploration of the implications of long-term bilingualism, focusing on the L1-Afrikaans/L2-Spanish bilingual community of Patagonia, Argentina. While our findings show evidence of well-known patterns of cross-language influence, they are noteworthy for revealing a more limited range of influence patterns than was previously reported for this community (Coetzee et al., Reference Coetzee, García-Amaya, Henriksen, Carstens and Bosman2024; García-Amaya & Lang, Reference García-Amaya and Lang2020; Henriksen et al., Reference Henriksen, García-Amaya, Coetzee, Wissing, Martínez-Gil and Colina2019; Reference Henriksen, Coetzee, García-Amaya and Fischer2021). Of importance, the findings suggest different patterns of cross-language influence for processes that are phonetic in a bilingual’s two languages (e.g., lenition of voiceless plosives) compared to those that are phonological in one language but phonetic in the other (e.g., lenition of voiced plosives in Spanish versus Afrikaans). The results additionally call attention to a complex interplay of factors that can bring about cross-language influence in bilingual speech, which may vary based on the target phoneme, the acoustic measure, and the situational context in which the data are collected (Grosjean, Reference Grosjean2008).
Supplementary material
The supplementary material for this article can be found at http://doi.org/10.1017/S0272263124000731.
Data availability statement
The experiment in this article earned Open Data and Open Materials badges for transparent practices. The materials and data are available at https://doi.org/10.48316/M4lUl-zpWtx.
Acknowledgements
We express our immense gratitude to the members of the Patagonian Afrikaans community who have shared their lives and their language with us. We also acknowledge with thanks the helpful feedback that we received from the SSLA editorial team and reviewers in the development of this article. Daan Wissing provided valuable assistance in conducting the South African sociolinguistic interviews, and also through countless discussions about Afrikaans phonetics. Micha Fischer provided expert statistical assistance without which this project would not have been possible. We also acknowledge the many members of the Speech Production Lab at the University of Michigan who assisted in transcribing and annotating the sociolinguistic interviews. This research is part of a larger project, From Africa to Patagonia: Voices of Displacement , made possible by financial support from the Humanities Collaboratory at the University of Michigan.


 Open access