


1. Introduction
The aim of this paper is to identify which political institutional variables are most strongly associated with the evolution of tax capacity in sub-Saharan Africa (SSA). Studies of tax performance in developing countries have focused on features of the economic structure and tax base and included democracy or governance indicators to capture political influences (e.g. Baskaran and Bigsten, Reference Baskaran and Bigsten2013; Chachu, Reference Chachu2021; Garcia and von Haldenwang, Reference Garcia and von Haldenwang2016). These studies indicate correlates of tax performance (tax/GDP ratios) but not factors associated with improvement in tax capacity. While recognising that improving tax efficiency contributes to state-building, we take no position on the difficult challenge of defining state and/or fiscal capacity (for discussion see Bruszt and Campos, Reference Bruszt and Campos2019; Kjaer et al., Reference Kjaer, Forged and Jeppesen2021; Moore, Reference Moore2021; Savoia et al., Reference Savoia, Sen and Tagem2021; Williams, Reference Williams2021). An agnostic approach to the determinants of tax performance and capacity is adopted and the analysis seeks to identify patterns in the data. The literature measuring tax effort by the residual (deviation from potential) from a tax performance regression is taken as a starting point and extended to construct a new measure of tax capacity for 39 SSA countries over 1985–2018.
Specifically, a measure of tax capacity is derived from estimating the trend component of tax efficiency – the ratio of actual to potential tax revenue – by removing cyclical and temporary variations. The benefit of the trend component measure is that it captures changes in underlying performance – a trend component of 1.0 (or greater) indicates the gap is being (more than) eliminated by underlying performance even if cyclical factors prevent actual tax/GDP from increasing. Acknowledging that there are also external factors which influence tax revenue, such as shocks or donor influence (Morrissey, Reference Morrissey2015; Morrissey et al., Reference Morrissey, Von Haldenwang, Von Schiller, Ivanyna and Bordon2016), justifies the focus on the trend component to represent capacity. Non-tax revenue (NTR) variables, especially resource rents, are included as determinants to capture their importance for many SSA countries.
In addition to proposing a new measure of capacity, the paper makes two contributions to the literature. First, we show that tax capacity in SSA has improved since 1985 – on average, countries are achieving potential and converging towards the regional tax performance norm – and this is associated with increasing tax/GDP ratios since the late 1990s. Oppel et al. (Reference Oppel, McNabb and Chachu2022) note that although SSA has low tax/GDP ratios relative to other developing regions, the majority of SSA countries have increased tax/GDP since 2000.Footnote 1 Conditioning on the most important structural determinants of tax performance, the majority of SSA countries are now closer to achieving their potential revenue, given choices made about tax rates and coverage. Growth in private household consumption (as a share of GDP) is associated with higher capacity, capturing the importance of income growth, as is the share of resource rents, consistent with the importance of NTRs (Bornhorst et al., Reference Bornhorst, Gupta and Thornton2009) – these may permit lower taxes without implying lower capacity. Increasing tax rates could increase revenue and factors affecting economic performance will affect revenue; however, the trend improvement in capacity suggests that, in general, inefficiencies in the collection are not the primary reason for low tax/GDP ratios.
Second, we show that the quality of institutions is related to capacity and identify which aspects of institutions are most influential. Equity in the provision of public services (an indicator of redistributive government spending) is the single most important institutional indicator associated with improving tax capacity – this is consistent with the argument that capacity to tax is enhanced if the public perceives an equitable distribution of benefits from public spending (Besley et al., Reference Besley, Ilzetzki and Persson2013; Besley and Persson, Reference Besley and Persson2014) or more generally that state-building and fiscal capacity reinforce each other (Bräutigam et al., Reference Bräutigam, Fjeldstad and Moore2008; Moore, Reference Moore, Bräutigam, Fjeldstad and Moore2008). Weak institutions do have adverse effects; tax capacity is negatively correlated with the level of political corruption, consistent with corruption eroding trust in government and tax morale (Tanzi, Reference Tanzi1998).
The empirical analysis comprises three steps. First, we employ a variety of econometric techniques to estimate tax performance using standard structural characteristics and other revenues – aid (net aid, grants), NTR, and total natural resource rents – as applied in the literature (for a review see McNabb et al., Reference McNabb, Danquah and Tagem2021; Tagem and Morrissey, Reference Tagem and Morrissey2021). The most robust variables are then used in a very parsimonious tax performance equation to estimate potential tax revenue, from which we measure performance efficiency (an indicator of tax effort) as the ratio of actual to potential tax revenue. Second, country-specific estimates of annual efficiency are decomposed to distinguish the trend from stochastic or cyclical elements. The trend component is our measure of tax capacity. Third, we apply a general-to-specific method, a variable selection approach to choose from a large number of variables those that are most important in explaining cross-country variation in tax capacity. This is specifically to identify the main correlates of country-specific measures of tax capacity.
The analysis is restricted to a sample of SSA countries and can only be interpreted as relative to regional performance. This is important because a feature of estimating tax performance, and hence the residual or measure of effort, is based on the sample – in general terms, conditioned on the structural determinants, efficiency is relative to the better-performing countries. While SSA may appear to have low tax/GDP ratios in a global sample of developing countries it may also be the case that performance is good given the characteristics of SSA countries. Although there is considerable heterogeneity across SSA countries (particularly in their levels of development and natural resource availability and dependence), compared to other developing regions SSA countries have similar features associated with lower tax revenue that are likely to affect tax capacity: low economic growth (at least until the 2000s) and export dependence on primary commodities (implying susceptibility to external shocks); experience of slavery and colonialism (which influence trust and state capacity); high poverty and rural/informal shares of the economy (ECA 2019; IMF 2018).
Section 2 discusses our approach and how the measure adds to the literature on tax capacity. Section 3 discusses the data and Section 4 presents the estimation methods employed. The results are discussed in Section 5, and Section 6 concludes by considering the implications for which institutions determine tax capacity.
2. Conceptual framework: Tax performance and capacity
In simple terms, tax revenue is determined by the tax rate applied to the tax base. The tax rate is a political choice, as is what to include in the tax base. Once the parameters of the tax base have been determined (e.g. what types of income and what thresholds or exemptions), given tax rates, the primary determinant of revenue collected is administrative effort. Thus, economic structure determines the potential tax base; political decisions determine the tax rates and which parts of the base will be liable for tax (related to the concept of tax expenditures); and administrative ability determines how much of the tax liability is collected (collection efficiency). For analysis at the country level, as conducted here, one is unavoidably aggregating over multiple rates and bases using proxy measures.
At the aggregate country level the tax base (B) is components of national income and expenditure; for simplicity it is usual to abstract from separate bases for different taxes (e.g. sales, income, capital gains) and from tax expenditures that reduce the amount of the base subject to tax, such as tariff exemptions, specific goods exempted from value-added tax (VAT), and tax-deductible allowances. At the aggregate level the tax rate (t) is notional – implicitly a weighted average of separate rates for different taxes and multiple rates for some taxes (e.g. income tax). Potential tax revenue (P) is notionally the appropriate rates applied to elements of the base (tB) and can be compared with actual tax revenue (T) so that the ratio T/P is an indicator of collection (performance) efficiency (similar to the notion of tax effort in the literature). In practice, t is represented by the tax/GDP ratio whereas the potential is what could be achieved given structural characteristics in comparison to other countries.
Although it is feasible to separate the effect of political factors (rates and tax expenditures) from collection or performance efficiency for some individual taxes using administrative data, this distinction cannot be made at the country level. In cross-country studies of total tax performance, it is very difficult to capture the varying factors that determine performance. Most cross-country studies regress T on a set of proxies for the tax base and use the error term to derive a measure of tax effort (following Bahl Reference Bahl1971) or establish some indicator of P and derive measures of effort based on P-T or T/P. McNabb et al. (Reference McNabb, Danquah and Tagem2021) review the tax effort literature, especially recent studies using the frontier approach (identifying the best performers in the sample), and provide estimates suggesting that SSA on average had the potential to increase revenue using 2019 data (relative to global performance). According to these estimates, SSA effort is slightly worse than South Asia and better than MENA or East Asia & Pacific. While these approaches are informative on how tax performance compares to some baseline standard, they are limited in identifying the trend in or sources of over- or under-performance.
This approach does not distinguish effort as a performance from capacity as capability; the methods of measuring tax effort are not clear indicators of tax or fiscal capacity interpreted as the ability to raise the revenue desired by the government.Footnote 2 While tax performance has a standard definition in terms of measuring revenue collected and regressions suggest which characteristics are associated with performance, tax capacity is inherently vague as it includes structural (base), political (rate), and administrative (efficiency) elements which are inter-related (e.g. political institutions can affect both structure and administrative capacity). The regression approach treating the unexplained part of the comparative performance as the indicator of tax effort conflates these elements. To the extent that the tax base proxies are poor measures of the true base and subject to measurement error, a large error interpreted as a shortfall of tax relative to the potential (low tax effort) may simply be due to poor performance of the regression specification.
This problem is likely to be highly prevalent in developing countries, especially low-income and fragile states, where the formal tax base is small, data quality is low, and large segments of the economy are difficult to measure and tax. The share of agriculture in the economy is a poor measure to capture the difficulty of taxing the large number of subsistence farmers as the share tends to change slowly (with a downward trend), while tax revenue comes from segments of the sector, especially commercial farmers and exporters. Manufacturing share of the economy is typically included to reflect the private sector but is also limited, as many firms and/or employees are informal – do not pay tax and are often not liable given incomes or turnover below the relevant threshold. Manufacturing exports would be a better measure although, to the extent exports are associated with multinationals that are difficult to tax, it is not evident that there is a positive correlation; Morrissey et al. (Reference Morrissey, Von Haldenwang, Von Schiller, Ivanyna and Bordon2016) find a negative association between manufacturing exports and tax revenue in low- and middle-income countries, perhaps reflecting tax incentives to attract (foreign) investment.
Political and institutional factors exacerbate these problems with tax performance regressions and inferring tax capacity (Ricciuti et al., Reference Ricciuti, Savoia and Sen2019a). For example, the government can decide what rates to apply and which parts of any tax base should be liable. If this results in low revenue relative to other countries with a similar base, this would be interpreted as low tax effort but need not imply low capacity – the revenue may have been what the government intended and expected. What matters for capacity is the institutional setting in which decisions are made; if the government is weak relative to strong lobbies which secure exemptions and low rates, that reduces capacity. On the other hand, if a capable technocratic government chooses low taxes, that should not be interpreted as limited capacity. The economic structure is also relevant, so countries with large resource (non-tax) revenues may choose relatively low tax revenue (low effort). A related issue is the effect of aid; grants are often assumed to reduce tax effort but the empirical evidence for this is very weak (Clist and Morrissey, Reference Clist and Morrissey2011).
Tax administration is another element of capacity but is subject to political influence and therefore institutional features influence how administrative capacity relates to tax capacity (Ricciuti et al., Reference Ricciuti, Savoia and Sen2019b). Reforms to enhance administrative performance, such as establishing semi-autonomous revenue authorities, may have only a limited impact on revenue as the administration operates within a set of parameters (such as rates and exemptions) set by political considerations (Dom, Reference Dom2019). Unfortunately, there are no good measures of administrative capacity covering a large number of SSA countries over a long period. Some of the indicators of institutions used may be correlated with (unmeasured) administrative capacity but in general that is an unobservable we can only infer.
3. Data
The econometric analysis uses annual data on 39 SSA countries from 1980 to 2018 (with estimation over 1985–2018 to allow for volatility in the early years).Footnote 3 Revenue data are obtained from the Government Revenue Dataset (GRD, UNU-WIDER 2020) and include total tax and NTR and components such as income, indirect and trade taxes.Footnote 4 The dependent variable is the non-resource tax/GDP ratio but we include a measure of NTR, which is mostly resource rents.Footnote 5 Aid data are obtained from the Organisation for Economic Co-operation and Development (OECD) Development Assistance Committee (DAC), version 2020. They include net aid, grants, loans, and technical assistance, all as shares of GDP. Aid is different from resource revenue with regard to a government's incentives to develop tax capacity due to aid conditionality, the level of fungibility, and consistency over time (Morrissey, Reference Morrissey2015).
The structural (economic) variables are chosen following the literature (Clist and Morrissey, Reference Clist and Morrissey2011). From the World Development Indicators database (World Bank 2020), we obtain the share of agriculture value added in GDP, GDP per capita in constant 2010 US$, the respective shares of exports and imports in GDP, and total natural resource rents (% GDP). The share of agriculture in GDP is expected to be negatively correlated with tax performance (but is a poor measure, as noted above). GDP per capita is a common indicator of the level of economic development, as well as a proxy for tax administration and compliance capacity (more developed countries tend to have more developed tax systems and better administration). The shares of imports and exports in GDP are included to reflect the historical importance of trade taxes in SSA but may also act as indicators of economic activity given that trade taxes have been significantly reduced since the 1980s (Clist and Morrissey, Reference Clist and Morrissey2011).
Institutions and political variables are captured with indicators from the rich Varieties of Democracy (V-Dem) dataset (Coppedge et al., Reference Coppedge, Gerring, Knutsen, Lindberg, Teorell, Altman, Bernhard, Fish, Glynn, Hicken, Lührmann, Marquardt, McMann, Paxton, Pemstein, Seim, Sigman, Skaaning, Staton, Cornell, Gastaldi, Gjerløw, Mechkova, von Römer, Sundtröm, Tzelgov, Uberti, Wang, Wig and Ziblatt2020). Three of these variables are of particular relevance (further detail in Tagem and Morrissey Reference Tagem and Morrissey2022). The political corruption index measures the extent to which the executive, judiciary, and legislative are susceptible to bribery and embezzlement. The equal distribution of resources index (a proxy for equity in public spending) is composed of indicators for access to public goods, welfare policies, educational equality, and health equality. In line with the literature on state formation (Moore, Reference Moore, Bräutigam, Fjeldstad and Moore2008), a more equitable distribution of public spending (resources) is expected to be associated with public trust in government and willingness to pay taxes. Vertical accountability captures the ability of citizens to hold government accountable through elections and political parties, which may influence fiscal capacity.
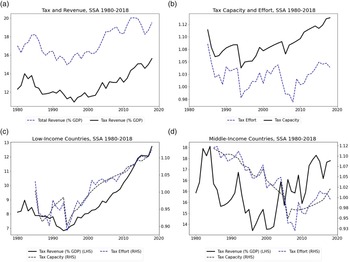
Tax mobilisation has improved over the years, from an average of around 12 per cent in 1980 to more than 15 per cent in 2018, although low-income countries collect less tax revenue than middle-income countries (Figure 1). There was a considerable drop in the mid-1990s, coinciding with the period when the structural adjustment programs led to a reduction in trade tax revenues, with recovery from 2000 onwards especially in low-income countries, as tax reform was implemented in most countries resulting in sustained increases in tax collection (ECA 2019).
Tax and revenue ratios, tax capacity and effort, SSA average 1980–2018.
Source: Authors' calculations for Tax/GDP and Revenue/GDP based on data from UNU-WIDER (2020); Capacity and Effort (tax efficiency) are own estimates over 1985-2018.

4. Estimation strategy
To capture the features of the economic structure which influence tax revenue, the benchmark equation for tax performance is:

Where tax it is the non-resource tax/GDP ratio over time periods t = 1, 2,…, T and countries i = 1, 2,…, N. X it is a set of controls for economic structure (tax handles), including: the share of agriculture value added in GDP, real GDP per capita, and imports and exports as proportions of GDP. The aid it variable includes alternative measures of foreign aid (e.g. net aid, grants, and loans) as a share of GDP, and NTR is non-tax revenue (a proxy for resource revenue). We also estimate models with a specific measure of resource revenue: total natural resource rents (the sum of oil, natural gas, coal, mineral, and forest rents) as a percentage of GDP. We assume the vectors of parameter coefficients (β 1, β 2, σ i) differ across countries but are constant over time. Equation (1) is estimated using standard fixed effects (including country and year fixed effects) and more rigorous panel time series estimators to address econometric concerns such as cross-country and unobserved heterogeneity (details in Tagem and Morrissey Reference Tagem and Morrissey2022).
Using the most parsimonious specification of equation (1) we obtain a measure of tax effort from:

Where tax it is actual tax revenue (T) and $\widehat{{tax}}_{it}$ is the predicted value or measure of tax potential (P), and equation (2) is an indicator of the level of performance efficiency (E), similar to measures of tax effort used in the literature. Our measure of C in (3) only uses the trend (permanent) component of E by separating out the cyclical/volatile element. Using the permanent component permits analysis of the underlying efficiency in each country abstracting from shocks and stochastic factors that affect revenue in specific years. A value greater than one shows over-performance (the trend over-achieves potential) while a value less than one depicts under-performance. Given how the measures are expressed, in countries where the underlying level of efficiency is high the underlying level of tax capacity will be high and vice versa.
Standard tax performance models have included various governance and/or political variables as well as interaction terms between governance variables and other covariates that are considered important determinants of tax performance such as aid and resource abundance. There is, however, no consensus view on the most important institutional variables. The strategy we pursue – the general-to-specific variable selection approach – is fundamentally different: all potentially important political variables are included in regressions with tax capacity as the dependent variable. Insignificant variables are systematically dropped from the various iterations of the model until the model is deemed appropriately specified, based on pre- and post-estimation diagnostics (Clarke, Reference Clarke2014; Herzer and Morrissey, Reference Herzer and Morrissey2013). This identifies the most important (by statistical significance) determinants of tax capacity.
Although the aim is to select the most important variables, this does not imply that other variables are irrelevant – variables not selected among the most important may nevertheless have effects, independently of or in conjunction with the main factors. Political or governance indicators may not be robust determinants of tax performance but could influence capacity directly or indirectly; institutional factors may interact to influence capacity. As the dependent variable is the trend component of the ratio T/P (as opposed to the tax/GDP or revenue/GDP ratios) and because many potential determinants are included, the general-to-specific approach is less susceptible to omitted variable bias than estimates of tax performance.
5. Empirical analysis
Given the intention to search for the covariates of tax capacity in the third stage of the analysis, the first stage estimates performance efficiency from a parsimonious specification. To identify the robust determinants of tax/GDP ratios, a full specification of equation (1) is estimated with a range of estimators allowing for fixed effects, heterogeneous but cross-sectionally independent tax performance, and heterogeneous and cross-sectionally dependent tax performance (full details in Tagem and Morrissey, Reference Tagem and Morrissey2021, Reference Tagem and Morrissey2022). Most explanatory variables are not robust moving from basic to more sophisticated estimators. Only four variables are regularly significant in most cases: the share of agriculture in GDP, GDP per capita, and the shares of exports and imports in GDP; only the last of these is significant across all regressions. These four variables comprise the parsimonious specification to estimate country-specific values of efficiency (E) and tax capacity (C). Variables that were never or very rarely significant determinants of tax performance will be included as potential determinants of tax capacity in the third stage of the analysis.
5.1 Deriving and reporting Tax capacity C
To obtain C (the trend or permanent component of tax efficiency E = T/P) we apply the Hodrick-Prescott filter (preferred to other alternatives as it performs better for non-stationary variable series) to the country-specific measures of E.Footnote 6 As C represents the underlying level of E, interpretation is similar: higher values signify better performance. Figure 1 shows the evolution of average tax/GDP and total revenue/GDP ratios (hereafter tax and revenue respectively) and the mean values of C and E for the 39 countries since 1980 (1985 for of C and E). The correlation between E and C is very high, at 0.96, indicating that on average countries are close to their (structural) potential, although deviations are clear in Figure 1. The correlation between C and tax/GDP is a much lower 0.59, consistent with our finding that determinants of performance and capacity differ (explored below).
Figure 1a shows that average tax and revenue follow a similar pattern over time, both declining from the mid-1980s to mid-1990s, followed by gradual growth until early 2000s and more rapid growth thereafter. The relatively good performance up to the mid-1980s may be indicative of the contribution of trade taxes during a period of weak economic performance (hence weak structural characteristics). Figure 1b shows that the trends in C and E follow similar patterns to each other and broadly follow the trend in tax. Notably, mean values of C are greater than 1.0 throughout, indicating good underlying capacity given structural tax determinants, although E does fall below 1.0 sometimes (1994, 2006–08) and is more volatile (to be expected as cyclical factors are not removed).
There is evident heterogeneity comparing LICs and non-LICs. Figure 1c shows the lower tax levels for LICs with a generally small decline to the mid-1990s and then a strong increase. Both C and E are volatile and below 1.0 until 2000, after which there is a steady improvement. In the case of non-LICs (Figure 1d) the pattern is very different: tax declines from the mid-1980s to 2000, then increases slowly; C declines until 2006 (E until 2008), to below 1.0 in the 2000s, and does not get back above 1.0 until 2018. This heterogeneity is explored further in Section 5.3.
5.2 Identifying the covariates of C
Building fiscal capacity entails investing in tax institutions, introducing tax and fiscal reforms, and improving the efficiency of revenue collection (for example, through training and organisational restructuring in revenue authorities). Such investment may be financed by aid or more generally influenced by reform policies advocated by donors and agencies such as the IMF and World Bank. Any such reforms will require time to affect structural and institutional variables that affect tax capacity. Given this, and the potential endogeneity of all explanatory variables (as tax performance is the root of estimated capacity), 5-year lags of all variables considered as potential covariates of C are used to account for potential dynamics (hence estimation is from 1985). The analysis could provide candidates for subsequent attempts to identify causal factors, but this would not be a promising avenue in the exploratory cross-country analysis given the number of plausible ‘causal mechanisms’ and potentially complex interactions that can vary across countries and time. Bivariate scatter plots (Tagem and Morrissey, Reference Tagem and Morrissey2021) between C and the main measures of governance (equal distribution, corruption and vertical accountability) show a strong relationship which matches a priori expectations: higher scores on the governance variables are associated with higher capacity (C greater than 1) and countries with the lowest tax capacity (C less than 0.8) have among the lowest values for all three governance measures. This suggests that these governance indicators are good candidates as determinants of tax capacity.
Given the level of multi-collinearity across variables (especially V-Dem data), including all the variables in one specification is not ideal. Although the general-to-specific method can handle multi-collinearity by sequentially dropping different sets of variables, we adopt the alternative approach of not including all variables at once so vary the total included in different estimates. The first stage estimates for tax performance assumed that structural variables determine potential revenue, so only significant structural variables were included while behavioural variables were omitted. However, tax capacity is the trend component which can be influenced by structural variables, such as private consumption or resource rents, that affect behaviour. Although most of these structural variables were not significant in explaining revenue, they could still be correlated with capacity, for example through indirect effects (such as interaction with institutions). Consequently, private consumption and ‘other income’ variables (such as net aid, grants, NTR, and resource rents – all as shares of GDP) are included.
The main institutional variables are the vertical accountability index, the equal distribution of resources index, and the political corruption index. Other institutional measures considered are democracy indices (egalitarian, electoral, liberal, participatory, and deliberative democracy) and accountability indices (horizontal and diagonal).Footnote 7 All V-Dem indicators are rescaled to range from 0 to 100 and corruption is rescaled so that higher values are more corruption (see Tagem and Morrissey Reference Tagem and Morrissey2022); structural and non-income variables are in natural logs for estimation. We start by estimating a general model with all potentially important independent variables. Using the full sample, 90 per cent is retained and 10 per cent is set aside for out-of-sample testing. Variables are ranked by the size of their t-statistics, then five simplification paths are applied. Each of the five variables with the lowest t-statistic is removed, yielding the fifth search path. If each equation passes the battery of tests, insignificant variables are eliminated. This goes on until either all the insignificant variables have been eliminated or there are no more variables that can successfully be dropped. The potential terminal specification is also subject to a battery of tests for model adequacy. Finally, each of the five terminal specifications is compared and if they are different, the final specification is determined using encompassing (F-tests) or information criteria (Clarke, Reference Clarke2014; Herzer and Morrissey, Reference Herzer and Morrissey2013).
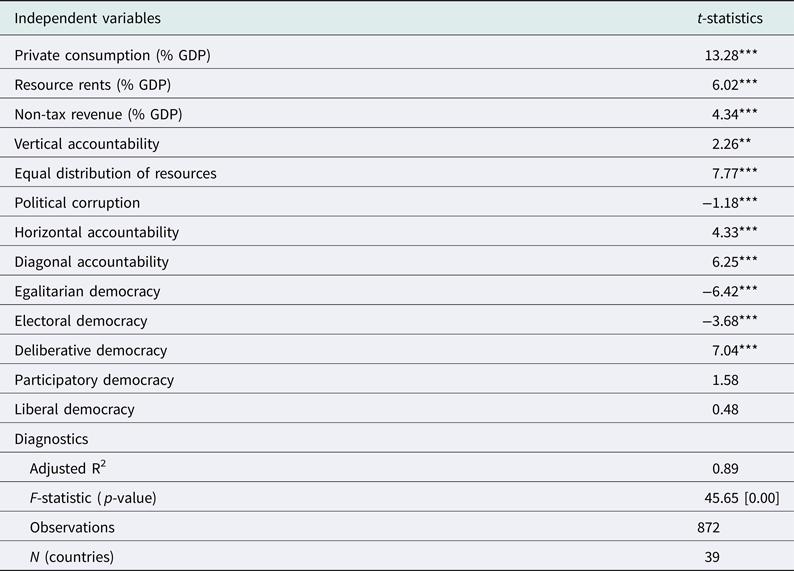
The final specification is reported in Table 1 and the four ‘most’ significant variables, the robust determinants of cross-country variations in tax capacity, have the expected sign. The equal distribution of resources index is positively associated with tax capacity, consistent with the view that taxpayers are more willing to pay tax if the allocation of public spending is perceived as fair. There is a strong positive relationship between private (household) consumption and tax capacity, consistent with increased household incomes improving the underlying capacity of the government to raise taxes (the pervasiveness of VAT exemptions in SSA may reduce the amount of tax collected, but that is a policy choice). Resource rents also have a positive relationship with capacity, suggesting that, conditional on any adverse effects of other incomes (of which resource rents may be a component), resource wealth can improve capacity (perhaps because of the presence of identifiable ‘large’ taxpayers). The corruption index is negatively associated with tax capacity, consistent with the resource curse where bribery and embezzlement of state funds undermine tax capacity. The correlation between E and C is very high, at 0.96, indicating that on average countries are close to their (structural) potential. Some deviations are clear in Figure 1b, but the main determinants of E are the same as in Table 1 for C (Tagem and Morrissey, Reference Tagem and Morrissey2022).
Main determinants of tax capacity (C)

Notes: Estimated using the genspec command in STATA (Clarke, Reference Clarke2014) with robust standard errors. Coefficients are presented, with t-statistics in parentheses (***p < 0.001, **p < 0.05, *p < 0.1 indicate significance at 1%, 5%, and 10% respectively). The F-statistic is for joint significance of all independent variables, with the corresponding p-value.
Source: authors' calculations.
Variables not selected in Table 1 as having a direct impact on tax capacity may indirectly influence the main determinants so a general specification including all variables is reported in Table 2.Footnote 8 The main variables and some additional variables are significant. Although aid measures are insignificant, NTR is positive and significant (and not highly correlated with resource rents), perhaps because non-resource NTR are visible and perceived as, in effect, taxes (e.g. it is known that many people pay fees which signals tax compliance and encourages others to comply). The types of non-resource NTRs vary considerably across countries, and comprise (OECD 2021): (i) government services and charges; (ii) sales of goods and services (such as licenses and, which may account for spikes, receipts from privatisation); (iii) income on government assets; and (iv) fines and penalties (mostly due to tax violations). The negative correlation between NTR and private consumption may be because the importance of NTR is less when revenue from sales and income taxes is higher. Measures of accountability are positive and significant; the finding that these effects appear indirect may be because they are positively correlated with equal distribution of resources, suggesting that the perception of equitable distribution has an enhanced effect on capacity where accountability is greater.
General specification of determinants of C
Notes: As for Table 1. Net aid/GDP and Grants/GDP included but insignificant so not reported.
Source: Authors' calculations.
The egalitarian and electoral democracy indices are both negatively associated with tax capacity in Table 2 but deliberative is positive and significant (all democracy indicators are positively correlated with equity). This suggests that it is elements of democracy, rather than democracy per se, that have indirect effects on capacity: egalitarian incorporates equity, electoral promotes accountability whereas deliberative captures aspects of process correlated with equity. Equitable distribution is the principal factor, but more accountable processes are associated with higher tax capacity. Almost all variables associated with variation in C (Table 2) are also significant in a general specification of determinants of E with the same sign except that vertical accountability is insignificant (see Tagem and Morrissey Reference Tagem and Morrissey2022, which also reports some differences in determinants of total revenue capacity).
5.3 Heterogeneity in Performance and Capacity
The heterogeneity suggested in Figure 1 is shown in greater detail in the box and whiskers plots in Figure 2 – the box shows the range for the half of the sample around the mean, the horizontal line through the box is the mean, and the whiskers represent the 25th and 75th percentiles. Figure 2a shows that mean tax/GDP is consistently lower and less dispersed for LICs than for non-LICs, despite fairly steady improvement since the mid-1990s. Performance for non-LICs is both highly dispersed and volatile, with some improvement in 2003–05 (but stable thereafter) compared to the 1990s. Tagem and Morrissey (Reference Tagem and Morrissey2022) show that total revenue exhibits a similar level and trend for LICs but is higher and even more variable for non-LICs (consistent with most countries deriving significant NTRs being non-LICs, but these are not necessarily resource rents). The pattern of capacity over time is somewhat different. Figure 2b shows that C was low and highly dispersed for LICs in the 1980s, improved and less dispersed in the 1990s but deteriorated with greater variance in the 2000s until the most recent observations. For non-LICs, C tended to be higher and less variable initially but lower on average since around 2000 (and more dispersed until recently). Overall, LICs have managed a more consistent improvement in capacity and performance even if tax/GDP remains lower and barely above 10 per cent on average.
Tax ratios and tax capacity trends by income groups 1985–2018.
Source: Authors' calculations for Tax/GDP based on data from UNU-WIDER (2020), Capacity from own estimates over 1985-2018.

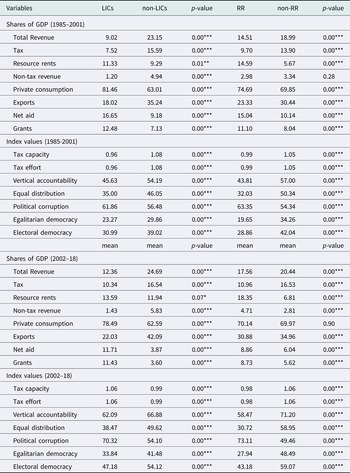
Table 3 presents means over 1985–2001 and 2002–18 according to splitting the samples into LICs and non-LICs and resource rich (RR) versus resource poor (non-RR). In both periods, tax/GDP and revenue/GDP are higher in non-LICs and non-RR, although the improvement in the 2000s is greatest for LICs; non-LICs and non-RR have higher exports but lower private consumption (both determinants of performance). Unsurprisingly, resource rents are higher for RR; they are also higher for LICs, indicating that many are resource rich. In the first period, tax capacity and effort (both identical) are significantly lower for LICs and RR. This changes significantly in the 2000s: capacity increases to over 1.0 and is higher in LICs (it falls below 1.0 for non-LICs), but this shift is not observed for RR and non-RR. This demonstrates variation within LICs – on average, those without resources improved capacity – and perhaps even greater variation within non-LICs so that if also RR capacity declined. Tagem and Morrissey (Reference Tagem and Morrissey2022, Table A7) show that countries that only enter the sample for 2002–18 or have extreme values affect these unweighted means. Nevertheless, the main patterns of changes in the second period are clear: almost three-quarters of LICs improved C and tax by the 2000s, whereas less than a third of non-LICs improved; a slight majority of RR but only over a third of non-RR improved. Improvement in C (to going above 1.0) was most pronounced for LICs and RR, although most non-LICs with a decline in C and tax were RR.
Heterogeneity, mean values by country groups 1985-2001 and 2002-18

Notes: Group sizes are LICs (18), non-LICs (21), RR (20) and non-RR (19). The means for the 39 countries (listed in fn 3) are unweighted and the covariances across groups are unequal. The p-value is based on a t-statistic for the difference in sample means. *** (**) denote significance at 1% (5%) level. Mean values of tax and NTR do not sum to total revenue because there are some large outliers (especially for resource rents) and averages are over a long period.
Source: Authors' calculations; further details in Tagem and Morrissey (Reference Tagem and Morrissey2022).
It is notable that exports rose for all groups in the 2000s, consistent with higher tax performance, but private consumption fell for LICs and RR on average and rose for non-LICs (similar for non-RR). The values of institutional indicators are all lower for LICs and RR although most improved, often considerably, by the 2000s. The exceptions are equal distribution, which fell for RR, and corruption which increased for LICs and RR. This suggests that increasing corruption was associated with lower capacity in RR, consistent with the resource curse hypothesis, but on average this was in those that are non-LICs (as capacity improved in LICs).
The measure of equal distribution of resources is higher in non-LICs and lower in RR, as are accountability and all democracy measures, consistent with non-LIC RR being among the poor performers. Although resource rents are higher, NTR are lower in LICs (some have significant resources). Net aid and grants are higher in LICs and RR; reinforcing that some relatively poor countries are rich in resources (and the resource curse is one reason why growth may not benefit from the resources). As poorer countries tend to have lower tax revenue and capacity, this is one reason why results for the relationship between different measures of aid and capacity are mixed – any benefits of aid, or donor policy recommendations, take time to affect behaviour, outcomes, and institutions.
6. Conclusion
Domestic revenue mobilisation is recognised as an important development objective that is especially challenging for low- and lower-middle-income countries. Many studies focus on measures to raise revenue, often in the context of observing ‘poor’ tax performance (a low tax/GDP ratio), considering the institutional framework of tax policy and performance (loosely termed as fiscal capacity). Structural variables (proxies for the tax base) are the main determinants of tax performance, but they do not adequately explain the differences in tax/GDP ratios across countries (as these are also a result of underlying political factors). While many studies of developing countries include political or governance indicators (e.g. Baskaran and Bigsten, Reference Baskaran and Bigsten2013; Chachu, Reference Chachu2021; Garcia and von Haldenwang, Reference Garcia and von Haldenwang2016), these provide correlates of performance but do not identify factors associated with improvement in tax capacity. This study contributes by constructing a measure of tax capacity based on isolating the trend in the ratio of actual to potential tax revenue (a measure of tax efficiency or effort) for a sample of 39 SSA countries over the period from 1985 to 2018 to identify the institutional indicators that are most robust in explaining cross-country variations in (the trend in) tax capacity.
There are three elements to the analysis. First, as no variables are consistently significant across a range of specifications and estimators for tax performance, the four variables found to be relatively robust determinants of tax/GDP ratios (per capita GDP; imports, exports and agriculture all as a share of GDP) are used in a parsimonious tax performance regression to derive the measure of tax efficiency. Second, country-specific estimates of the trend component (eliminating stochastic and cyclical elements) of efficiency are used as the measure of tax capacity. We find that tax capacity is high – on average countries are achieving potential tax revenue given structural characteristics relative to other SSA countries – and that capacity has improved since the late 1990s, markedly so for low-income countries. We also note deteriorating performance in a number of non-LICs. Third, a general-to-specific methodology is employed to identify variables that are the most important determinants of the cross-country variation in tax capacity. Only four variables are consistently significant: tax capacity increases with private consumption, resource rents, and equal distribution of resources, but decreases with political corruption.
The finding for resource rents suggests that, whilst access to alternative sources of domestic revenue is associated with lower tax revenue, it does not reduce capacity interpreted as the ability to achieve potential tax revenue (the target potential is lowered by NTRs). A more equal distribution of public resources, capturing greater equity in the allocation of public spending such as for education and health, does appear to increase tax capacity. This is consistent with arguments that equitable distribution of public spending is associated with greater public trust in government and willingness to pay taxes (Moore, Reference Moore, Bräutigam, Fjeldstad and Moore2008) and seems to be enhanced by greater accountability. Institutions that enhance public perceptions that government allocates and collects resources fairly and is accountable do appear to improve efficiency (or effort) and tax capacity. Such institutions may not be associated with higher tax revenue, unless they encourage or allow governments to raise taxes or improve structural features, which may help explain inconsistent results for governance variables in tax performance studies. Nevertheless, good institutions assist governments in achieving the level of tax revenue they want to raise given economic characteristics.
These results should not be interpreted as causal but as providing strong associations. The correlations identified are consistent with equity being associated with accountability, and both have positive effects on capacity, suggesting that the perception of equitable distribution has an enhanced effect on capacity where accountability is greater. All democracy indicators are positively correlated with equity; indeed, egalitarian democracy incorporates equity whilst electoral promotes accountability (associated with equity). It is plausible to conclude that only elements of democracy, rather than democracy per se, have indirect effects on capacity. Equitable distribution appears to be the principal factor, but more accountable processes are associated with higher tax capacity. Political corruption is negatively correlated with all institutional variables and with capacity, consistent with it being a strong indicator of poor institutions.
The analysis sheds light on which aspects of political institutions appear to be most informative for further analysis of capacity, adding to the finding that indicators of impartiality and effectiveness of the tax system are positively associated with constraints on the executive so that ‘mechanisms of accountability and placing constraints on rulers facilitate the existence of a fiscal bargain’ (Ricciuti et al., Reference Ricciuti, Savoia and Sen2019a, p361). Equity in the distribution of resources underpins a fiscal bargain and tax capacity; accountability and elements of democracy support this (perhaps indirectly in supporting perceptions of equity so that taxpayers are more willing to comply because they see benefits from government spending). However, the effect of institutions on tax capacity is fluid and improving specific institutions does not ensure an increase in tax revenue. Changes in the composition of alternative revenue sources also influence behaviour over the medium to long term. For example, although access to resource revenues does not seem to reduce tax capacity, resources may encourage corruption that undermines capacity. Furthermore, revenue from resource revenues is volatile as it depends on prices and demand in global markets. Growth in the private sector of the economy is essential for a sustained increase in tax revenue while more accountable and equitable processes help to realise the increase in potential revenue.
Acknowledgements
This study was prepared within the UNU-WIDER project Fiscal states – the origins and developmental implications, which is part of the Domestic Revenue Mobilization programme financed through specific contributions by the Norwegian Agency for Development Cooperation (Norad). The authors thank two anonymous referees. Kunal Sen, Antonio Savoia, Odd-Helge Fjelstad, participants at the WIDER June 2021 workshop on ‘Fiscal States – the origins and development implications’, and seminar participants at UNU-WIDER provided helpful comments on earlier versions. The usual disclaimer applies.


 Open access