

“Through their constant vilification of blacks, carpetbaggers, scalawags, and Reconstruction, the ‘old political leaders’ fostered a climate that condoned violence as a legitimate weapon in the struggle for Redemption.”
—Eric Foner, Reconstruction: America’s Unfinished Revolution (1988, p. 434)
American history is replete with examples of “tax revolts” and other forms of resistance to taxation. From the colonial resistance to British taxation policies such as the Navigation Acts to Quakers refusing to pay taxes to continental revolutionary governments to Shay’s Rebellion in 1786, Americans have sometimes violently opposed tax policies. The traditional narrative of these revolts turns on considering the competing needs of financing the state within a representative democracy and the distributional impacts of tax policy. Violent tax revolts have not been particularly successful. Federal, state, and local authorities routinely quelled revolts since the founding of the republic. As one example, President Washington used state militias to end the Whiskey Rebellion in 1794, avoiding violence through a show of military force. One particular set of violent revolts against taxation, however, was not quelled and was in fact highly successful. It has also escaped analysis by economic historians—the violence seen at the end of Reconstruction, which was often cast as resistance to excessive taxation.
This paper explores the potential link between violence and tax policy in the United States using the unique history from Reconstruction to the end of the nineteenth century. This period featured a range of violence that was particularly racialized. In the American South, White conservatives sought to use terrorism to return to the racial social order that prevailed during chattel slavery. This campaign of fear and intimidation found political support not only as racialized public policy, but also as a stand against Black enfranchisement, Black political leadership, expanded federal authority, and an altered public finance structure which followed the Civil War. While claims of excessive taxation were common and feature prominently in the narrative record documenting White resistance, there has been little empirical analysis of the role of tax policy on political violence at the time.
Before the Civil War, the range of public goods provided by state governments in the South was relatively small and tax rates were low. Wealth and political inequality were pronounced, with a small number of Whites controlling the majority of wealth as well as the political infrastructure (Merritt Reference Merritt2017; Ager Reference Ager2013). Following the Civil War, Black enfranchisement led to the election of Black officeholders who pursued a dramatically different policy agenda, with local taxes financing public schools, repairs and construction of public works projects, and humanitarian aid. The resistance of Whites to these policies was highly organized. Political organizations took the form of Taxpayer Conventions, rifle clubs, the Ku Klux Klan, and other groups which sought to intimidate voters, press local officials for detailed accounts of public expenditures, and use local media to characterize elected officials as corrupt and wasteful. Violence was also used as a tool for political ends. Estimates claim that more than 50,000 African Americans were murdered by the time Reconstruction ended in 1877, with more than a third of the murders being politically motivated (Egerton Reference Egerton2014).
Given the changes in enfranchisement, Black people in policymaking positions, White claims of excessive taxation, and politically motivated violence, the historical narrative has been unable to establish clear links between these factors. While new research suggests that Black officials were causally related to taxes (Logan Reference Logan2020), the relationship between taxes and political violence during Reconstruction is unknown. On the one hand, it could be the case that racial violence was so general that it was unrelated to variation in local taxes. On the other hand, violence could be more likely in places where Black people hold positions of influence or, more specifically, in places where they pursue more aggressive tax policies. Unfortunately, a full accounting of racial violence during Reconstruction is not possible, and discerning the intent of specific documented acts of violence is difficult and unresolved among historians (Foner Reference Foner2014; White Reference White2017). Nevertheless, scholars continue to draw inferences about racial violence and policy during the Reconstruction era, though there have been very few empirical tests of this relationship.
This paper provides the first estimates of the relationship between Reconstruction-era tax policy and the violent attacks against Black politicians. Using unique data on Black politicians, political violence, and local tax revenue, I find that areas with higher local per capita tax revenue were much more likely to have violent acts committed against Black policymakers. Overall, the likelihood of a violent attack increased by more than 25 percent for each additional dollar in per capita tax revenue collected in 1870. Even when restricting the analysis to counties with Black representation, larger tax revenues were strongly correlated with an increased likelihood of a violent attack against Black policymakers. Additional specifications show that the relationship is robust—controls for a variety of county characteristics, antebellum aspects of the slave economy, and Black voter registration do not alter the relationship in any substantive way. As a further check that this violence was related specifically to tax policy, I show that general racial violence in the post-Reconstruction period, as proxied by Black lynching, is not related to violence against Black politicians. This is the first evidence that Black politicians were more likely to be victimized in places with more redistributive public finance.
This paper makes several contributions to the literature. First, this study adds the element of violence to the literature on ethnic and racial divisions and public finance (Alesina, Baqir, and Easterly Reference Alesina, Baqir and Easterly1999; Hopkins Reference Hopkins2009). Previous studies of political violence have concentrated on expanding welfare policy and Black civil unrest in the twentieth century (see, e.g., Button Reference Button1978; Fording Reference Fording2001; Wilkinson Reference Wilkinson2009). Little research has investigated White political violence directed at Black political leaders. More generally, most work on political conflict concentrates on war, ethnic conflict, and legislative processes such as gerrymandering (as in Fearon and Laitin (Reference Fearon and Laitin2003)). Works that analyze specific violence tend to concentrate on assassinations of national leaders (Jones and Olken Reference Jones and Olken2009). This study shows that violent acts against policymakers were strongly related to tax policies and were pronounced at the local level.
Second, the results add to the growing literature on public policy and violence in history. Williams (Reference Williams2022) finds lynching in the late nineteenth century (after Reconstruction’s end) depressed contemporary Black voter turnout. Jones, Troesken, and Walsh (Reference Jones, Troesken and Walsh2012, Reference Jones, Troesken and Walsh2017) find formal voting restrictions were complementary to violence in depressing African American voter turnout, while Chacón and Jensen (Reference Chacón and Jensen2017) and Suryanarayan and White (Reference Suryanarayan and White2019) concentrate on Union military occupation during Reconstruction. Cook, Logan, and Parman (Reference Cook, Logan and Parman2018), however, find no relationship between lynching and the presence of Black politicians during Reconstruction. This paper adds the missing channel of public finance as one mechanism for politically motivated racial violence and rationalizes the contradictory findings in the literature.
Third, this paper provides a quantitative assessment of the relationship between tax policy and violence directed toward Black policymakers. Scholars such as Du Bois (Reference Du Bois1935), Foner (Reference Foner2014), Franklin (Reference Franklin1961), Hahn (Reference Hahn2005), Reidy (Reference Reidy2019), Logan (Reference Logan2020), and others have discussed the positive role of Black politicians during Reconstruction. The results here suggest Black politicians were successful to the extent that violence was used against them. Even when restricting the analysis to the areas with Black officeholders, the areas with more aggressive tax policies were significantly more likely to be places of violent attacks. Another group of scholars, such as Egerton (Reference Egerton2014), Gillette (Reference Gillette1982), Hesseltine (Reference Hesseltine1935), Lemann (Reference Lemann2007), Prince (2014), Darity and Mullen (2020), and others have stressed the role that post-Reconstruction institutions played in the formation of twentieth-century American political development. This implies the relationship between violence and public finance could have influenced the way that American political institutions solve the problem of public goods provision. As such, this paper makes a contribution to the narrative history of Reconstruction and its violent aftermath.
Fourth, this paper presents a new focus for scholarship that seeks to link the ante- and postbellum United States. A number of studies have linked antebellum factors to later political and economic outcomes (Acharya, Blackwell, and Sen Reference Acharya, Blackwell and Sen2016; Dippel and Heblich Reference Dippel and Heblich2021; Williams, Logan, and Hardy Reference Williams, Logan and Hardy2021), the persistence of the White elite in the South (Ager Reference Ager2013; Bellani, Hager, and Maurer Reference Bellani, Hager and Maurer2022; Chacón and Jensen Reference Chacón and Jensen2020; Ager, Boustan, and Eriksson Reference Ager, Boustan and Eriksson2021), or the legacy of enslavement on outcomes for Black people (Althoff and Reichardt Reference Althoff and Reichardt2022; Price, Darity, and Headen Reference Price, Darity and Headen2008). Few studies have focused on the use of targeted political violence to overturn the Reconstruction regime as a means of achieving persistence. Similarly, no studies have looked at the relationship between Black political efficacy and White racial violence during this time. Considering antebellum persistence in all of its forms requires an investigation into the mechanisms that overthrew the political, economic, and social upheavals related to Black citizenship during Reconstruction. Here, we learn that politically motivated violence was a critical component in returning to antebellum political policy and anti-democratic institutions.
Finally, this paper speaks to an omitted element of political economy in American political and economic development. Aggressive tax policy in the South was likely to be met with violence, and the political distinction of the American South, with fewer public goods, lower tax rates, and high levels of inequality, could have their roots in Reconstruction-era political violence (Hardy, Logan, and Parman Reference Hardy, Logan and Parman2018; Rodden Reference Rodden2010; Acharya, Blackwell, and Sen Reference Acharya, Blackwell and Sen2016; Glaser Reference Glaser1994; Suryanarayan and White Reference Suryanarayan and White2019). Indeed, recent research has shown that issues salient in Reconstruction politics have national influence in the United States today (Bateman, Katznelson, and Lapinski Reference Bateman, Katznelson and Lapinski2018). I find that areas with violence against Black politicians had the largest reversions of tax policy between 1870 and 1880. This would link such violence to a larger goal of Southern redemption—to curtail the expansion of federal powers, restrict the range and scope of public goods provision in the South, decrease tax rates, and use political violence when necessary to achieve that end.
RECONSTRUCTION AND VIOLENCE
One key issue facing any policymaker during Reconstruction in the South was public finance (Anderson Reference Anderson1943). The antebellum tax base in some Southern states was predicated on slavery. In Louisiana, for example, slaves accounted for between one-third and one-half of the tax base. Given that the majority of Civil War battles were fought in the South, infrastructure repair placed additional demands on public finance. The humanitarian needs of the formerly enslaved were not fully addressed at the federal level and required local public support. The historical narrative has established that Black politicians played a key role in altering the scale and scope of public financing in the South after Reconstruction.Footnote 1
Taxation and the expansion of government services were racially politicized in the South. The popular opinion among Whites was that new programs benefited Black people disproportionately. Egerton (Reference Egerton2014) details how Southern newspapers predicted Black officials would enact aggressive tax policies to support public services targeted at Black people. On the issue of schooling, one of the largest categories of local expenditures, the racist rhetoric was particularly pronounced. Sterling (Reference Sterling1994) notes the resistance that local Whites had to funding school buildings and teacher salaries. Holt (Reference Holt1977) describes how Republicans began to propose cuts to schools to secure White support, and Williamson (Reference Williamson1986) and others have documented the dramatic declines in school funding that followed. It is important to note the resistance to school financing was not only due to the expense but also to the race of the students—the belief that Black people were unfit for education led many to conclude that educational expenditures on Black people were particularly wasteful. Fitzgerald (Reference Fitzgerald2007) notes that Whites “grudged every penny assessed on them for building school-houses and paying teachers, as though they were thrown into the sea” (p. 85). To be clear, resistance to taxes was highly racialized, and it is difficult to disentangle the two.
As documented by Thornton (2016), taxes nearly doubled between 1860 and 1870, and given the tax system at the time, the majority of the tax burden fell on White landowners since the primary funding source was local property taxes. While these taxes were for relatively new public goods such as schooling, infrastructure, railroads, public assistance, and the like, there was an immediate backlash against the change in tax rates (Fitzgerald Reference Fitzgerald2007). In South Carolina, Democrats organized the first Taxpayers’ Convention in 1871. They demanded a full accounting of state appropriations and also popularized the idea that Black politicians and their sympathizers were levying heavy taxes as a means to redistribute wealth. The publicity generated from the convention helped fuel the narrative of a government unrepresentative of the population and rife with corruption. States such as Texas and Mississippi, for example, quickly organized Taxpayers’ Conventions with the same aims.
Resistance to Black enfranchisement and Reconstruction was particularly violent at the local level. The backlash against these policy changes was nestled in an antebellum past that featured racial violence and a political regime where taxes were low and public goods were relatively few. As Rable (Reference Rable2007) notes, it would be simplistic to connect all racial crime to politics or racism during this time. At the same time, the politics of Reconstruction gave rise to a class of Black leaders whose very presence violated the racist belief that Black people were inferior. Attacks on Black voters, Black officials, and Republican sympathizers were common (Valelly Reference Valelly2004).
Violence was so rampant early in the Reconstruction era that the Grant administration took action on violence and voter intimidation through the Enforcement Acts, which were passed in 1870 and 1871. The acts made it a federal crime to prevent or obstruct voting, from barring those not constitutionally excluded from holding office being allowed to serve, and gave the federal government authority to prosecute cases. In situations where violence was acute, such as race riots, the acts specifically suspended habeas corpus. Additional sections of the acts were direct responses to the strategies employed by the Ku Klux Klan, and gave federal authorities power to prosecute violent acts as well as conspiracies to intimidate voters or fix elections. The acts were effective in leading to the prosecution of the Ku Klux Klan, the establishment of Black voting, and the creation of a class of Black officeholders in the early years of Reconstruction (Foner Reference Foner2014).
These gains were short-lived. After the 1872 election cycle, the relationship between violence and politics was revived and extended. Egerton (Reference Egerton2014) notes one-third of all the race riots in 1873 occurred the week before a local election. Rifle clubs and other civic-named organizations sprang up throughout the South to intimidate voters and threaten local officials over policy. While contemporary news reports concentrated on corruption, historians now conclude that one of the chief goals of violence was to oust Republican leaders and lower taxes, particularly those earmarked for education. Democrats routinely signaled education expenditures, which were controlled by local officials, as an area rife with corruption (Foner Reference Foner2014; Williamson Reference Williamson1965; Rable Reference Rable2007; Egerton Reference Egerton2014). Violence became part of the Democratic electoral strategy by the early 1870s. In Louisiana, Mississippi, South Carolina, and Florida, the Black population share was enough to ensure significant Republican representation. Locally prominent Black people began to fear for their livelihoods and safety given the increasing levels of violence. In response, they began to organize and collect information on violence. The committee, which forbade politicians from joining, was formed to catalog the violence as best they could throughout the South (White Reference White2017). They recorded information on more than 500 violent attacks. At the same time, federal presence in the area dwindled to less than 500 troops in Florida by 1872, making violence a very real and efficient option to gain political control. At the other end of the spectrum, “White Men’s Clubs” in Mississippi, which had been active since 1870, kept “dead books” that listed Black Republicans. The goal was to monitor local Black political activity and target elites for intimidation. They organized and patrolled roads on election day to suppress the vote and refused to employ Black people who voted Republican.
One salient example can be found in the Colfax Massacre of 1873, which eventually provided legal cover for overt Black voter intimidation. The contested 1872 elections in Grant Parish, Louisiana, resulted in Black people being seated in the offices of judge and sheriff. Black people seized control of the courthouse to take office and were attacked by Whites on Easter Sunday, 13 April 1873. Even after the Black people in the courthouse raised a white flag of surrender, Whites continued cannon and rifle fire. After the courthouse was seized by Whites, it was burned with Black people still inside. Many of the Black people fleeing the fire were led off two by two to be shot dead. The death toll is believed to be somewhere above 100 slain in the massacre. Attempts to prosecute the perpetrators under the Enforcement Act led to the United States v. Cruikshank decision of 1876, which disallowed federal prosecution of conspiracy charges under the Enforcement Acts. This left gangs of armed Whites essentially immune from prosecution, and the decision emboldened Whites in Southern states to re-double their efforts to intimidate Black voters (Rable Reference Rable2007; Valelly Reference Valelly2004; Foner Reference Foner2014). Even before the Supreme Court decision, however, the die had been cast in Louisiana: Whites seized control of counties and forced Black officials to resign from their elected offices (Rable Reference Rable2007).Footnote 2
The strategy of using violence for political aims followed the 1874 “Alabama Plan,” described by Rable (Reference Rable2007). Democrats in Alabama abandoned any hope of securing Black votes and instead labeled themselves a “White man’s party” while publicly issuing a call to end violence as a means to attract moderate White support. Sympathetic White newspapers filled with stories of Black people being trained to take up arms, with little evidence that any of this occurred. In the Alabama Black Belt, for example, the tactics ranged from preventing Republicans from assembling (Eutaw County), murder of locally prominent politicians (Sumter County), intimidation of Black voters in the form of forcing them to vote for Democrats or lose their jobs (Barbour County), forcing Black people to leave polling stations without voting (Mobile County), having Whites cross the border from neighboring states to cast ballots, and preventing Republicans who won their elections from raising their bonds and therefore allowing defeated Democrats into those offices by default. The general strategy was not to incite total violence, which would increase the prospects of Congressional or military intervention, but to intimidate Black voters to alter election outcomes. Even with this, the Attorney General of Alabama publicly stated that anyone could murder a Republican for political intimidation without fear of punishment (Bellesiles Reference Bellesiles2010).
This activity was illegal under the Enforcement Acts at the time, but by the mid-1870s, Congressional will to root out voter intimidation and racial violence had largely ended. Congressional investigations into the 1874 elections in Alabama determined that “Democrats had used force to over-turn the state’s Republican majority” (Rable Reference Rable2007, p. 118), but did not act on the issue. The state of Alabama itself did not move to investigate independently nor act on the results of the Congressional investigation. The political strategy of Redemption now had a successful template. This plan was adopted and used in Mississippi in 1875, when terroristic attacks by Redshirts, a paramilitary arm of the Democratic party, and widespread voter intimidation brought Democrats to a significant majority. In that election cycle, activists were specifically targeted to decrease Black voter turnout, and high-profile individuals were targeted to serve as a warning to others of the dangers of being politically active. The elections of 1876 featured rampant “fraud, intimidation, and terrorism in the South returned the region to conservative control and restored Blacks to a condition more resembling serfdom than freedom” (Rable Reference Rable2007, p. 185).
Despite the continued use of military occupation and martial law in the South, attempts to have federal authorities intervene were not well organized. When violence erupted in Mississippi in 1875, for example, President Grant agreed to send troops only if Mississippi could raise its own militia. This exacerbated the problem of violence because the White mobs and rifle clubs were typically well armed, and Black militias often lacked basic arms and ammunition, partly due to Presidential Reconstruction bans on Black gun ownership (White Reference White2017). Even more, the violence went undeterred. In South Carolina, armed Whites, who brought their own cannon, attacked the predominantly Black town of Hamburg in July of 1876, killing five men and pillaging the town. The mayor, following an investigation, issued arrest warrants for 87 men believed to be responsible for the violence. One of the indicted, Matthew Butler, was made a state senator that same year. Another, Benjamin Tillman, would become governor of South Carolina a short time later (White Reference White2017).
Election day in 1876 featured a number of firsts in the United States. It was the first time that the nation held a common election day. It also featured the highest White participation rate in the South at that time or since. In South Carolina, more White votes were cast than White adult males in the state (White Reference White2017), and more than 150 Black people were murdered during the campaign (Lemann Reference Lemann2007). When Hayes emerged as the President after the disputed election, the withdrawal of all federal forces from the South was met with a promise to protect Black civil rights (Riddleberger Reference Riddleberger1960). It was in vain. States repudiated the debt incurred under Republican leadership and curtailed the ability of local bodies to levy taxes. By the election of 1878, Hayes himself noted there was “atrocious” violence throughout the South. Black political participation was already stymied—none of the three Republicans elected from the South that year served in majority-Black districts.
Estimates of the exact range of violence vary. In Florida, the Secretary of State Jonathan Gibbs estimated that more than 150 Black people had been assassinated between 1868 and 1871 and that more than 50,000 Black people had been murdered in the South by 1887 (Egerton Reference Egerton2014). While a complete accounting is impossible, Congressional testimony and local accounts in newspapers speak to the profound regularity of racial violence in the South during this time, and a significant portion was politically motivated. Black voter turnout declined by more than 20 percent between the late 1860s and the 1880s (Egerton Reference Egerton2014). By the last decade of the nineteenth century, Black school funding was reduced substantially, taxes were decreased, and the range of public goods offered in the South again stood in stark contrast to the rest of the nation. Further, once Black political participation had been muted, voting restrictions and other forms of disenfranchisement calcified the Jim Crow policies throughout the former Confederacy (Kousser Reference Kousser1974).Footnote 3
THE QUESTION OF POLITICAL VIOLENCE AND PUBLIC FINANCE
American politics have featured “tax revolts” in all parts of the nation. From Shay’s Rebellion and the Whiskey Rebellion in the eighteenth century, Americans have sometimes responded to tax policy with armed rebellion. These rebellions, however, tend to feature responses to specific taxes and not public finance generally. For example, the Whiskey Rebellion was a multi-year conflict where the question of the federal government’s authority to enact excise taxes was settled through federal intervention. In contrast, Shay’s Rebellion centered on local taxation in Massachusetts as the state attempted to avoid deficits related to war finance. Another distinction is that tax revolts rarely feature specific political targets as opposed to an end to the tax in question. Another distinction of Reconstruction is that tax revolts in American history have been routinely suppressed when they moved to armed conflict. During Reconstruction, however, such violence was not successfully thwarted, but rather replicated throughout the region.Footnote 4
This paper narrows the focus of the relationship between public finance and political violence to a specific question: Was the violence visited upon Black politicians in the Reconstruction era related to the public finance policies in their local communities? Racial violence took many forms in the South, and a relationship between all violence and public finance could reflect a spurious relationship. Violence in places with more aggressive taxation could be driven by a number of factors, and violence could serve multiple purposes: voter intimidation, a check on local politicians’ prerogatives, or a more generally violent reaction to Black leadership and political power. Similarly, the lack of a correlation between overall violence and tax policy could obscure a relationship that would be driven by specific actors or policies.Footnote 5
A related concern is that a complete cataloging of violent acts during Reconstruction is not possible, making an answer to the general question impossible. There are now studies that look at military occupation during Reconstruction and its political effects (Chacón and Jensen Reference Chacón and Jensen2017; Stewart and Kitchens Reference Stewart and Kitchens2017), but military occupation at the time was a political decision that showed strong temporal trends as Reconstruction advanced (Foner Reference Foner2014; Franklin Reference Franklin1961). In some instances, troop deployment was sent to prevent violence, and in other instances, it was sent to respond to the aftermath of a riot. In other instances, it was not sent at all. Indeed, Grant became increasingly reluctant to use military force as Reconstruction continued, which only served to embolden resistance (Foner Reference Foner2014; Egerton Reference Egerton2014; Rable Reference Rable2007). Congressional testimony of Reconstruction violence was politically constructed, focused on riots and other large-scale events, and designed to stress the need for continued military occupation. As such, the selection of issues using military presence and reports of violence in Congressional testimony may go in a variety of directions.
We do have better and more complete data on Black officeholders, as well as information on whether or not they were victims of violence. There is also a narrative record establishing that tax reform was a key goal in Redemption. Given that taxes were set by local policymakers, a refined hypothesis would center on Black political leaders and local public finance. More specifically, what was the role of taxation in the likelihood of attacks on Black politicians?
While this is inherently an empirical question, the historical narrative gives alternative answers to the question. First, the expansion of the Ku Klux Klan and political violence preceded the establishment of Reconstruction governments, making it unlikely that all violent acts were due to politics as opposed to attempts to re-establish antebellum racial hierarchies (Fitzgerald Reference Fitzgerald2007; Russ Reference Russ1934a, 1934b). Even though poor Whites in particular benefited from the expansion of public goods provision during Reconstruction, attempts to educate those voters on the benefits “had only limited effect on the mass of farmers, whose wartime and racial loyalties were nearly impervious to economic arguments” (Fitzgerald Reference Fitzgerald2007, p. 99). This suggests racial hatred could have been a guiding principle more than the role of public finance and taxation.Footnote 6 Related to this is that the majority of the tax burden was borne by relatively few Whites given the high levels of inequality at the time (Ager Reference Ager2013), making it less likely that widespread violence, even in the name of politics and excessive taxation, would be related to taxes.
One aspect of the racial nature of the Redemption is that White Southern populists were vocal in their opposition to any Black political power or enfranchisement. Fitzgerald (Reference Fitzgerald2007), Rable (Reference Rable2007), and Lemann (Reference Lemann2007) claim that political arguments over “excessive” taxation were related to increasing Klu Klux Klan activity and overt acts of racial intimidation, many of which were aimed at Black voters and officeholders. Political violence was needed in areas where Democratic victory required a suppressed Black vote (Foner Reference Foner2014). If this is true, there could be a link between Black voting and politically motivated violence, but not a link between taxation and violence against Black officeholders.
Despite the appeals to states’ rights, Redemption featured strong federalism in public finance when it limited Black political prerogatives. This is consistent with the political ideology which led to succession, which Dew (Reference Dew2002) argues was less related to political concerns as opposed to hostility to Black people. Similarly, Jones, Troesken, and Walsh (Reference Jones, Troesken and Walsh2012) and Williams (Reference Williams2022) show that informal forms of voter suppression and racial violence were effective deterrents to Black political participation after Reconstruction’s end. If voter suppression was more likely to be effective via violence against Black political leaders, we could see a link between voters and violence, but not one that would work through nor be related to taxes. Given the general nature of racial animus at the time and the extent of violence directed toward African Americans generally, it may not be the case that tax revenues led to more or fewer attacks on politicians.
Casual empirics, however, suggests that there could be a link. Louisiana was one of the most violent states during Reconstruction, and it also had taxes that were twice the regional average (Bellesiles Reference Bellesiles2010). State level relationships obscure the fact that local taxation varied considerably, and was related to the presence of Black politicians (Logan Reference Logan2020). If Black officeholders, who were related to larger tax revenues, were more likely to be attacked, it could be the case that this was a function of Black officeholding, but not an effect of taxes. Therefore, the more specific empirical question is whether, conditional on having Black officeholders, Black officeholders in locations with higher taxes were more likely to be victims of violent attacks.
DATA AND EMPIRICAL STRATEGY
Data
Information on Black policymakers and the acts of violence against them comes from Foner (Reference Foner1996), which is the most comprehensive source on Black officeholders during Reconstruction. While not a complete catalog of every Black officeholder during Reconstruction, which would be impossible, Foner (Reference Foner1996) contains the entries of all major officials and the supermajority of Black officials (“all the major black officials at the national and state levels and a majority of local officeholders”) during Reconstruction.Footnote 7 As noted by Foner (Reference Foner1996), they had “control over such matters as public expenditures, poor relief, the administration of justice, and taxation policy, local officials had a real impact on the day-to-day lives of all Southerners” (p. xxvi).
One concern is the selection of the officials appearing in Foner (Reference Foner1996), which would be correlated with their political success. The historiography of Reconstruction, however, strongly suggests this would not be the case. The existing scholarship about the known Black politicians was often incorrect, and narratives about the illiteracy and poverty of the Black politicians continued to be repeated in the historical narrative until the archival work in Foner (Reference Foner1996) and other histories were compiled. Indeed, the histories of Reconstruction that noted Black officials did so derisively—Coulter (Reference Coulter1968), for example, described Black officials in Georgia as swindlers who could not read, although the majority were literate. Black officials were not included as examples of political effectiveness but most often as prime examples of incompetence and unfitness for office (Dunning Reference Dunning1907; McPherson Reference McPherson1875).
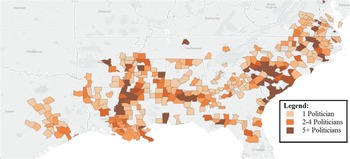
The data compiled by Foner includes not only the name and position held, but also the place of officeholding. Figure 1 shows the map of Black officeholders by county. As the figure shows, there is a great deal of variation within states in the number of Black officeholders. Of special note, Tennessee was not required to call a new state constitutional convention under the Reconstruction Act of 1867 as it had ratified the Fourteenth Amendment prior to the passage of the Reconstruction Acts. The majority of Black officeholders began their service before 1870, and on average, they were out of office by 1874.
SPATIAL DISTRIBUTION OF BLACK OFFICIALS DURING RECONSTRUCTION
Source: Foner (Reference Foner1996).

Additional information on officeholders includes term in office and additional information that could be determined in Census records and contemporaneous sources such as their occupation, literacy, and slave status at birth. Table 1 shows summary statistics for Black politicians. The majority of officials held legislative positions, were literate (64 percent), and a large number owned significant property (23 percent). More than 10 percent were victims of violence.
SUMMARY STATISTICS FOR BLACK OFFICIALS DURING RECONSTRUCTION

Source: Data come from Foner (Reference Foner1996) for each unique Black officeholder.
Violence visited upon officials and coded as violence ranges from threats of death to murder. For example, George Barber of South Carolina fled his home in Fairfield County, South Carolina, over Ku Klux Klan (KKK) death threats in 1871. James Alston and his family were threatened by the Ku Klux Klan in 1869 and wounded by them two years later. Theophilus Steward of Georgia received death threats after he asserted that juries should involve both Black and White citizens. Charles Caldwell of Mississippi was murdered in 1875, months after he escaped an armed mob by fleeing to Jackson, Mississippi. Simon Corker of South Carolina was killed in 1876 by Democrats in the Ellerton riot—he was kneeling in prayer after being captured. The violence variable captures the very real and present threat of violence.
The violence data was compiled by Foner through a search of the biographies of Black politicians serving during Reconstruction, and the full bibliographic information on the specifics of violence is contained in Foner (Reference Foner1996). As noted by Foner (Reference Foner1996): “It is difficult to think of any group of public officials in American history who faced the threat of violence as persistently as Reconstruction’s Black officeholders” (p. xxviii). The violence was most often at the hands of organized groups such as the Ku Klux Klan, para-military groups, self-proclaimed militias, “White Men’s Clubs,” and other domestic terrorist organizations. Of the 158 officials recorded as victims of violence by Foner, their specific violent acts are disaggregated as follows: 42 (26.5 percent of victims) were physically assaulted (shot at, stabbed, or beaten); 36 (22.8 percent) received death threats; 45 (28.5 percent) were violently driven from their homes (sometimes never to return); and 35 (22.2 percent) were murdered. To put this in perspective, the homicide rate for all Black officeholders was 2.3 percent, or 2,317 per 100,000 officials. This would make the homicide rate among Black officials more than 20 times greater than any other demographic in the United States as of 2020, where the highest homicide rate is less than 105 per 100,000.Footnote 8 To say that public office was hazardous for Black politicians would be a severe understatement of the risks they faced. I include all acts of violence in Foner in the violence measure used here (Logan 2023).
County level information comes from the 1870 and 1880 censuses as well as electoral return data at the county level (Haines and ICPSR 2005; Clubb et al. Reference Clubb, Flaigan and Zingale2006; ICPSR 1999; Atack Reference Atack2016).Footnote 9 The focus on county taxes is due to the fact that very few municipalities collected any taxes in either 1870 or 1880. For historical public finance, county tax revenue is the key metric for within-state variation (Sylla Reference Sylla1986).Footnote 10 For example, in Alabama, fewer than 20 percent of the counties reported any local or municipal taxes. Out of all municipal taxes collected in Alabama, more than 80 percent came from two urban counties, Mobile and Montgomery. Other Southern states followed a similar pattern of very little municipal taxation.
Table 2 shows the summary statistics of county-level information. It shows means by whether the county had a Black officeholder, and whether or not an officeholder met with violence. Nearly one-third of all Southern counties had a Black officeholder during Reconstruction. For the counties that were represented by Black officeholders, they averaged more than four officeholders during Reconstruction. There are some differences between the counties represented by Black officeholders. For example, they were more likely to serve in urban counties, but slightly less likely to serve in counties with large Republican vote shares. Per capita taxes, farm values, manufacturing wages, and manufacturing output are all higher in counties that have Black officeholders. As Logan (Reference Logan2020) shows, Black politicians served in counties with higher tax revenues.
SUMMARY STATISTICS FOR SOUTHERN COUNTIES DURING RECONSTRUCTION

Note: Standard deviations in parentheses.
Source: Author’s calculations.
Counties with Black representation had 1870 per capita tax revenues that were 62 percent higher than those without. Interestingly, 1870 taxes were even higher in counties with subsequent violence against Black politicians than those without, on average more than 40 percent higher. By 1880, however, tax revenues per capita were lower in counties that had been represented by Black officials. At a basic level, this is a significant reversion of tax revenue in a very short period of time. Even among the counties with no Black representation taxes declined, however, suggesting a general regime of reduced taxation after Reconstruction’s end. Counties where Black officials met with violence saw much larger per capita tax changes from 1870 to 1880—by 1880, counties with violence had per capita tax revenues, which were only 12 percent higher than others, and overall taxes declined in counties represented by Black officeholders by more than 40 percent between 1870 and 1880. If the goal was to revise taxes downward in areas where Black politicians had increased them, the results of Table 2 show that this indeed took place.
The tax reversion is consistent with the argument that the end of Reconstruction saw significant declines in tax revenues that are most pronounced in areas with Black political representation and largest in areas where Black politicians were subject to violence.
Empirical Strategy
The basic specification estimates the relationship between taxes and violence against Black politicians:
 $${\nu _{i,s}} = \alpha + \beta {\tau _{i,s}} + {\theta _s} + { \in _{i,s}},$$
where υ is violence against an official, τ is county taxes per capita in county i in state s, and θ s is a state fixed effect.Footnote 11 The second method is the inclusion of additional controls to assess the robustness of the bivariate relationship in a full regression specification:
 $${\nu _{i,s}} = \alpha + \beta {\tau _{i,s}} + \Gamma {X_{i,s}} + {\theta _s} + { \in _{i,s}},$$
where X includes a host of controls that should determine per capita county taxes. The specification in Equation (2) is designed to measure whether public finance was related to an increased likelihood of violence and later reversion of taxes. The controls include not only the value of farms and real estate and wealth (the basis for property tax assessment), but also percent Black in the county (a proxy for Black voting and the need of any policymaker to account for the preferences of the Black electorate), total population (a proxy for the provision of poll taxes), average manufacturing wages, the value of manufacturing output (both of which proxy for industrial interests), illiteracy (a proxy for voter education), Republican vote share in the 1868 Presidential election (a proxy for baseline political preferences of the electorate), the Logan–Parman measure of racial residential segregation (Logan and Parman (Reference Logan and Parman2017), a measure of physical racial separation), and indicators for rail access, water access, and whether the county is urban (each of these being shifters of land values).Footnote 12 The specifications above were estimated using OLS regression and via probit and Poisson regression. These two specifications are used to account for the fact that political violence is a dichotomous indicator (in the case of probit) and that the number of victims of political violence is a count measure (in the case of Poisson).Footnote 13
Key to identification here is that the violence recorded in Foner (Reference Foner1996) comes after 1870, when the taxes, τ, were determined. The timing of the taxes and the subsequent violence lend themselves to an intuitive causal interpretation of the results, exploiting variation in taxes in 1870 to see if it is related to violence thereafter. Given the structure of the timing, it is quite unlikely that reverse-causality is present. Indeed, if the threat of violence was related to tax policy it would lead to an underestimate of the effect as politicians would be less likely to pursue aggressive policy for fear of attacks, lowering estimates of β. There is little narrative evidence that Black politicians thought of themselves as martyrs for the sake of tax policy. Moreover, using the small number of violent attacks that occurred before 1870 as a check, I find there is a weak relationship between taxes in 1870 and pre-1870 violence (β = 0.0002, t = 0.24), and the relationship turns negative when restricted to counties with Black representatives (β = –0.0015, t = 0.45). This is consistent with violence having a negative relationship to taxes in places where politicians were attacked before 1870 taxes were determined, but the limited number of cases leaves the results imprecise.
VIOLENCE AND TAXES
Bivariate Estimates
The bivariate estimates in Table 3 show the within-state likelihood of violence against a Black official is well correlated with taxes per capita in 1870. In Panel A, the dependent variable is the dichotomous indicator for whether a Black official was violently attacked in the county. In all Southern counties, a dollar increase in per capita taxes is related to an increased probability of violence against an official. This is over 4 percentage points in linear probability models, and more than 3 percentage points in probit models. This is substantively large. Given a baseline rate of violence of 10 percent among Black officeholders, these results imply a dollar increase in per capita taxes raised the likelihood of violent attacks by more than 30 percent.
BIVARIATE RELATIONSHIP BETWEEN TAXES AND VIOLENCE

Notes: Standard errors in parentheses. *** p<0.01, ** p<0.05, * p<0.1 N = 823 for all counties. Each reported coefficient is obtained from a separate regression of an indicator for any act of violence against a Black officeholder (Panel A) or number of violent acts against Black officeholders (Panel B) on the variable listed in the row. N = 311 Black officials. All regressions include state fixed effects. Probit estimates are reported as marginal effects evaluated at the mean.
Source: Author’s calculations.
When restricting the sample to those counties where Black people were officeholders, the relationship still holds. This is over 3 percentage points in linear probability models, and more than 4 percentage points in probit models. Counties where Black officials were attacked saw larger declines in their per capita tax revenues. Even with this, counties where Black officials were attacked had higher per capita tax revenues than others in 1880. This is consistent with the summary statistics in Table 2, which showed that despite the larger declines in taxes in counties with violence against Black politicians, those counties still had slightly higher per capita taxes in 1880. For both the change in taxes between 1870 and 1880 and 1880 taxes, however, the results in Panel A do not hold when looking among the set of counties with Black officeholders.Footnote 14 This is consistent with substantially less variation in taxes by 1880.Footnote 15
In Panel B of Table 3, the dependent variable is the number of violent acts against Black officials. The results show a dollar increase in per capita taxes was correlated with 0.09 more attacks on politicians over all Southern counties, and 0.115 in counties represented by Black officials. The Poisson models show similar results.Footnote 16 The incidence rate for violence against officials is 17 percent higher in counties with one dollar more in county per capita taxes, and 12 percent higher when restricted to counties represented by Black officials. Each additional violent act is correlated with a reduction in per capita taxes of 23 cents, rising to 42 cents when restricted to counties represented by Black officials. The number of violent acts is not related to 1880 taxes.
Regression Estimates
In Table 4, a full set of controls is added to assess whether the relationship is altered or related to factors that determine county taxes. In particular, regressions include total value of farms in 1870, the Logan and Parman (Reference Logan and Parman2017) racial residential segregation measure, percent black, total population, manufacturing wages, value of manufacturing output, number illiterate, county wealth, and indicators for rail access, water access, and urban county. All regressions also include state fixed effects.Footnote 17 Even with a host of controls, the results are consistent with those in Table 3. In Panel A, an additional dollar in per capita tax revenue is correlated with a 3 percentage points (linear probability) to 9 percentage points (probit) increase in the likelihood of a violent act. When restricting this to counties with Black politicians, the likelihood increases by 5 percentage points. Each dollar increase in per capita county taxes is correlated with 0.1 additional violent acts and a 16 percent greater incidence rate. When looking only at counties with Black politicians, each dollar increase in per capita county taxes is correlated with 0.16 additional violent acts, and a 18 percent greater incidence rate of politician violence. Overall, the results in Table 4 show the relationship between taxes and violence is not lessened by the inclusion of covariates, which determine variation in per capita tax revenues.Footnote 18
REGRESSION ESTIMATES FOR TAXES AND VIOLENCE

Notes: Standard errors in parentheses. *** p<0.01, ** p<0.05, * p<0.1 N = 823 for all counties. Each reported coefficient is obtained from a separate regression of an indicator for any act of violence against a Black officeholder (Panel A) or number of violent acts against Black officeholders (Panel B) on the variable listed in the row. N = 311 Black officials. All regressions include total value of farms in 1870, Logan–Parman segregation measure, percent black, total population, manufacturing wages, value of manufacturing output, number illiterate, rail access, water access, county wealth, and urban county. Probit estimates are reported as marginal effects evaluated at the mean. All regressions include state fixed effects.
Source: Author’s calculations.
ROBUSTNESS
While the results of the previous section provide strong evidence that violence against Black politicians was related to tax policy, it is still the case that the relationship could be related to or mitigated by other factors not included in the specification in Equation (2). I show the results in Table 4 are robust to the most likely threats to a causal interpretation of the results: antebellum factors and controls for Black voting during Reconstruction. Furthermore, I show while the relationship in Table 4 is related to tax policy, it is not the case that violence against Black politicians is a proxy for general racial violence at the time, specifically lynching. Overall, these robustness checks establish the violence against Black politicians was specifically related to their policy agenda.
Including Antebellum Factors
There is recent research that the legacy of slavery has long-lived effects on preferences for redistribution and racial conflict (Acharya, Blackwell, and Sen Reference Acharya, Blackwell and Sen2016). More recent work has highlighted the relationship between slavery and Reconstruction taxes (Suryanarayan and White Reference Suryanarayan and White2019). Similarly, some argue slavery was intimately related to Black political organizations (Chay and Munshi Reference Chay and Munshi2011). As such, violence against politicians could reflect antebellum racial attitudes, institutions, or inequality and could have been only indirectly related to politicians. Controlling for antebellum effects is difficult, however, as many measures that would reflect antebellum factors would be related to factors that would also affect taxes postbellum (Wright Reference Wright2006). For example, land values were related to the crops grown and the number of enslaved persons (both being functions of land suitability and the labor requirements of crops).
To investigate whether political violence was predicted by antebellum factors, I replicated the regressions in Table 4 and added 1860 cotton production, tobacco production, and sugar production in addition to the number of acres of improved farmland by county. I also added the number of enslaved persons in 1860 and the number of farms with more than 15 slaves, which has been used as a threshold for large-scale staple crop cultivation in the antebellum period (Fogel and Engerman Reference Fogel and Engerman1974). Table 5 shows the results and reports the coefficients for the number of enslaved Black people in 1860 and the number of farms with more than 15 enslaved individuals. The number of enslaved Black people in 1860 is not related to the presence of violence and the number of violent acts, but the number of large plantations is related to violence against politicians. None of the agricultural production measures were substantively or statistically related to political violence.Footnote 19 The antebellum factors do not alter the relationship between violence and 1870 taxes. Indeed, the coefficient on taxes is slightly larger with the inclusion of antebellum controls, both over all Southern counties and when restricting it to counties that had Black representatives.
REGRESSION ESTIMATES FOR TAXES AND VIOLENCE, ANTEBELLUM CONTROLS

Notes: Standard errors in parentheses. *** p<0.01, ** p<0.05, * p<0.1 N = 823 for all counties. N = 311 Black officials. All regressions include total value of farms in 1870, Logan–Parman segregation measure, percent black, total population, manufacturing wages, value of manufacturing output, number illiterate, rail access, water access, county wealth, urban county, pounds of cotton ginned (1860), pounds of tobacco (1860), pounds of cane sugar (1860), and number of improved acres in farmland (1860). Probit estimates reported as marginal effects evaluated at the mean. All regressions include state fixed effects.
Probit estimates are reported as marginal effects evaluated at the mean.
Source: Author’s calculations.
Including the Racial Composition of the Electorate
One additional set of controls that could alter the relationship between taxes and violence would be political proxies. For example, areas with more Black voters could have been more likely to have violent acts as a means of voter intimidation as opposed to public finance. As discussed earlier, violence could be more related to voter demographics than to politicians themselves if the goal was to lower Black political participation. Similarly, areas with more Democratic Party support could have favored lower taxes, and these areas may see violence as a means to stymie Black voting to assure Democratic Party control. Both of these factors are measured before political violence.Footnote 20 To test for this possibility Table 6 replicates the regressions in Table 4 and includes the share of votes for the Republican Party in 1868 and the share of registered voters who were Black as controls for political preferences and voting shares, respectively. (The regressions in Table 4 include the percent Black in all specifications.) As the table shows, the inclusion of these controls for political preferences and Black voting does not diminish the effect of 1870 taxes on violence. As with Table 5, the inclusion of these political proxies actually strengthens the estimated effect of taxes on violence. In both instances, the relationship between violence and taxes is quite robust. This result is consistent with political violence being related to politicians and not voter intimidation.
REGRESSION ESTIMATES FOR TAXES AND VIOLENCE, VOTING, AND REGISTRATION CONTROLS

Notes: Standard errors in parentheses. *** p<0.01, ** p<0.05, * p<0.1 N= 823 for all counties. N = 311 Black officials. All regressions include total value of farms in 1870, Logan–Parman segregation measure, percent black, total population, manufacturing wages, value of manufacturing output, number illiterate, rail access, water access, county wealth, and urban county. All regressions include state fixed effects. Probit estimates are reported as marginal effects evaluated at the mean.
Source: Author’s calculations.
Does Politician Violence Predict Other Racial Violence?
The final robustness check looks to see if political violence was more likely to occur in places which featured racialized violence throughout the period. If this was the case, the relationship between taxes and political violence could be spurious, as the violence would have continued long after the tax policies were reversed. There is some evidence that political factors were related to racial violence.
Williams (Reference Williams2022), Jones, Troesken, and Walsh (Reference Jones, Troesken and Walsh2017), and Epperly et al. (Reference Epperly, Witko, Strickler and White2020) have found lynching is related to depressed Black voter turnout, while Cook, Logan, and Parman (Reference Cook, Logan and Parman2018) do not find a relationship between the number of Black politicians and lynchings. If lynching is a form of voter intimidation, we would not expect a relationship between lynching and attacks on politicians given the results in Table 6. But if attacks on Black politicians were part of a larger agenda of racial violence that included voter intimidation, there could be a relationship between the two.
In Table 7, I estimate the relationship between Black lynchings, which occurred post-Reconstruction, and violence against Black politicians. For lynchings, I use the HAL data, which is the most widely used data on lynchings, with the politician data described at the county level (Cook Reference Cook2012). In Panel A of Table 7, I find there is no relationship between any violence against Black politicians and Black lynchings from 1882 to 1930.Footnote 21 This holds for all counties and those counties that were represented by Black officeholders. In Panel B of Table 7, I find there is no relationship between the number of violent acts against Black politicians and the number of Black lynchings in the post-Reconstruction era. Again, this holds for all counties and those represented by Black politicians. Put another way, the violence visited upon Black politicians does not appear to be related to subsequent racial violence. (This relationship is the same when Black voting shares are included in the specification.) This is suggestive evidence that the violence against Black politicians was for a different purpose than the racial violence that followed and that these attacks were directly related to policies and not voter intimidation.Footnote 22
REGRESSION ESTIMATES FOR POLITICIAN VIOLENCE AND LYNCHING

Notes: Standard errors in parentheses. *** p<0.01, ** p<0.05, * p<0.1 N = 823 for all counties. N = 311 Black officials. All regressions include total value of farms in 1870, Logan–Parman segregation measure, percent black, total population, manufacturing wages, value of manufacturing output, number illiterate, rail access, water access, county wealth, and urban county. All regressions include state fixed effects. Probit estimates are reported as marginal effects evaluated at the mean.
Source: Author’s calculations.
These results imply the violence visited on Black politicians toward the end of Reconstruction was more targeted than the violence of lynching which followed. It could be the case that targeting Black political leaders was a necessary first step in subsequent disenfranchisement since political leaders had access to mechanisms that would protect their constituents. This result is also consistent with the timing of disenfranchisement, which reached its peak as Southern states passed new state constitutions after Reconstruction. In order to accomplish this goal, they first had to remove Black leaders from office, perhaps simultaneously intimidating voters, and then continue a campaign of violent voter intimidation to remain in power, even when in the minority. While this is conjecture consistent with the narrative record and the timing, it also highlights the fact that research on racial violence should consider the nuance of the intent of specific forms of violence employed in different circumstances.
CONCLUSION
Regional differences in public finance are pronounced in the United States. In general, states in the South have a lower tax burden as a percent of state income, and lower per capita expenditures on public goods such as public assistance, public health insurance, and education (Hardy, Logan, and Parman Reference Hardy, Logan and Parman2018). These states also receive a larger share of federal aid as a percent of state revenue. This has been a long-standing feature of public finance, and some scholars have argued that the regional pattern has roots in social norms and Reconstruction politics (Bateman, Katznelson, and Lapinski Reference Bateman, Katznelson and Lapinski2018; Acharya, Blackwell, and Sen Reference Acharya, Blackwell and Sen2016; Ager Reference Ager2013) and was later extended nationally through Southern control of the legislative branch in the mid-twentieth century (Bateman, Katznelson, and Lapinski Reference Bateman, Katznelson and Lapinski2018). While commentators have repeatedly mentioned that racial dynamics of public goods provision have played a role, this study shows that within the South there were literally dire consequences for pursuing aggressive systems of taxation, especially those that were seen to benefit Black people.
The results here add an interesting mechanism to the well-known regional differences in public goods provisions in the United States.
This is the first study to find a statistical relationship between local tax revenue and violence against Black officeholders, a finding that suggests political attacks were partly related to the policies Black politicians pursued. This paper used unique data on Black officeholders and local taxes to test the relationship between local tax revenue and violence against Black politicians. While the historical narrative documents the racial violence of Reconstruction, the dismissal of Black politicians, and the claims of excessive taxation by White Democrats, whether these were empirically related was unknown. The advocacy and funding of an extensive range of public goods were related to the likelihood of physical violence. While the focus here is on officeholder race and the policies pursued by Black politicians, it is also reasonable to view tax rates themselves as a proxy for Black elected officials’ influence on county-level policy.
The results show Black politicians in areas with the most aggressive taxation were significantly more likely to be attacked. Even more, in those areas with the most aggressive taxation, the tax reforms after Reconstruction were also the most pronounced. These results are statistically and substantively significant—Black politicians who were the most successful in changing local taxation policy were much more likely to be violently attacked. These results hold despite the inclusion of factors that historians and political scientists have thought may weaken the relationship. In this paper, I considered two such factors: antebellum characteristics and Black voting. Although each had been thought of historically as potentially influencing violence against officials, I found neither mitigated the substantive impact of taxes on the likelihood of violence against Black politicians. In addition, I found there was little evidence to support the argument that Black politicians who were attacked came from communities which displayed more overt acts of racial violence throughout the nineteenth century.
The focus on taxes and Black politicians allows us to look at the role tax policy played in violence against Black officials, but it is unknown whether this relationship extends to violence more generally. Similarly, given the extent of the violence at the time, it is difficult to isolate its exact source (the former enslaver class, a larger group of White citizens, Democratic party operatives, etc.) to understand how the results of the violence may be related to those most likely to benefit from the tax reversions. Further research documenting the number of violent acts during Reconstruction, and discerning the motivations behind specific acts of racial violence, will aid in answering this more general question. A related topic for future work is the relationship between violent attacks and Black voter registration and voting patterns, as it could inform the role of race in American politics more generally (Hutchings and Valentino Reference Hutchings and Valentino2004; Williams Reference Williams2022). As it stands, the evidence suggests that Black politicians paid a particularly high price for relatively aggressive tax policy during Reconstruction.


 Open access