


INTRODUCTION
Landscape evolution is controlled by multiple factors, including changes in climate, volcanic eruptions, tectonism, erosion-sedimentation processes, and human activity. During landscape development, there are periods of stable environmental conditions, when pedogenesis is actively developing, and periods of dynamic instability, when landform evolution is driven by both sediment accumulation and erosion processes, which are interrelated in space and time. The accumulation process produces new landforms while the erosion process transforms or eliminates them.
Both pedogenic and geomorphic processes coexist and actively affect landscape evolution. However, their relative importance may vary considerably in space and over time (Sycheva et al., Reference Sycheva, Daineko, Sulerzhitskiy, Usyanov and Chichagova1998; Sycheva, Reference Sycheva2003). Soil development is active during the periods of stable evolution of landscapes under closed vegetation cover (Glazovskaya, Reference Glazovskaya1996, Reference Glazovskaya2000). Pedosedimenary sequences can include sediments of highly variable composition and thickness, sedimentation gaps, and erosional contacts between layers, which indicate a high rate of relief formation, frequent and dramatic changes in environments, and occasional catastrophic events, respectively. Pedogenesis and soil erosion-redeposition are essentially competing processes (Gerrard, Reference Gerrard1981; Sycheva, Reference Sycheva, Targulyan and Goryachkin2008). High rates of relief-forming processes create extreme conditions for soil formation and can often completely inhibit it. When conditions are optimal for soil development, the processes of erosion and deposition are confined mainly to steep slopes, valley floors, and depressions. An alternation of periods of geomorphic stability/soil development and geomorphic activity/intensive processes of erosion and deposition is controlled by global and regional environmental changes (Rohdenburg, Reference Rohdenburg1970).
In recent decades extensive paleoenvironmental reconstruction has been undertaken in Central Mexico. Most of these studies have been based on lacustrine (Caballero et al., Reference Caballero, Lozano, Ortega, Urrutia and Macias1999; Torres-Rodríguez et al., Reference Torres-Rodríguez, Lozano-García, Roy, Ortega, Beramendi-Orosco, Correa-Metrio and Caballero2015; Brown et al., Reference Brown, Caballero, Cabral Cano, Fawcett, Lozano-García, Ortega, Pérez and Schwalb2019; Martínez-Abarca et al., Reference Martínez-Abarca, Lozano-García, Ortega-Guerrero, Chávez-Lara, Torres-Rodríguez, Caballero, Brown, Sosa-Nájera, Acosta-Noriega and Sandoval-Ibarra2021), glacial (White, Reference White1962; Heine, Reference Heine, Mörner and Karcén1984; Vázquez-Selem and Heine, Reference Vázquez-Selem, Heine, Ehlers and Gibbard2004, Reference Vázquez-Selem and Heine2011), fluvial (Borejsza and Frederick, Reference Borejsza and Frederick2010), or soil (Sedov et al., Reference Sedov, Solleiro-Rebolledo, Gama-Castro, Vallejo-Gómez and González-Velázquez2001, Reference Sedov, Solleiro-Rebolledo, Terhorst, Solé, Werner and Poetsch2009; Solleiro-Rebolledo et al., Reference Solleiro-Rebolledo, Macías, Gama-Castro and Sedov2004, Reference Solleiro-Rebolledo, Sedov, de Tapia E., Cabadas, Gama-Castro and Vallejo-Gómez2006; Sycheva et al., Reference Sycheva, Sedov and Solleiro-Rebolledo2013; Sánchez-Pérez et al., Reference Sánchez-Pérez, Solleiro-Rebolledo, Sedov, McClung de Tapia, Golyeva, Prado and Ibarra-Morales2013) sedimentary records. Lacustrine sediments reveal the history of closed basins and lower landscape positions, whereas glaciers are limited to the highest volcanic elevations. As a result, we have information on extreme landscape positions (high and low). In intermediate positions, not covered by glaciers or lake sediments, the processes of soil formation, soil erosion, and soil redeposition represent another important source of information. Consequently, paleopedological sequences that formed in these intermediate positions represent an additional source of information on past environmental changes (Solleiro-Rebolledo et al., Reference Solleiro-Rebolledo, Sedov, Gama-Castro, Flores-Román and Escamilla-Sarabia2003; Sedov et al., Reference Sedov, Solleiro-Rebolledo, Terhorst, Solé, Werner and Poetsch2009; Díaz-Ortega et al., Reference Díaz-Ortega, Solleiro-Rebolledo, Sedov and Cabadas2010, Reference Díaz-Ortega, Solleiro-Rebolledo and Sedov2011).
In this paper, we describe soil-sedimentary sequences, which included fragipan horizons locally called tepetate, developed in different topographic positions within the Tlaxcala Block (Mexican Plateau), from the very end of the Pleistocene to the late Holocene. Since Reference Aeppli1973 (Aeppli) tepetate were considered to be a direct result of soil formation, but the discussion on their origin still continues (Quantin, Reference Quantin1992; Miehlich, Reference Miehlich1992; Oleschko et al., Reference Oleschko, Zebrowski, Quantin and Fedoroff1992; Zebrowski, Reference Zebrowski1992; Gama-Castro et al., Reference Gama-Castro, Solleiro-Rebolledo, Flores-Román, Sedov, Cabadas-Báez and Díaz-Ortega2007; Poetsch, Reference Poetsch2004). In a previous study, Sycheva et al. (Reference Sycheva, Sedov and Solleiro-Rebolledo2013) provided a brief introduction to the paleo-gully geomorphology, based only on field description and non-calibrated age data, as well as the paleoenvironmental reconstruction, but only at a local scale. Therefore, we consider it necessary to provide a stronger analytical approach, with calibrated ages and with correlation to regional and global paleoclimatic records. Specifically, we investigate trends and dynamics of landform and soil evolution in the Tlalpan region (Fig. 1) to identify the stages of stability (soil formation) and instability (geomorphic evolution) of regional landscapes based on radiocarbon dating of paleosols, tepetates, and colluvial deposits. Additionally, a regional paleoenvironmental reconstruction is proposed.
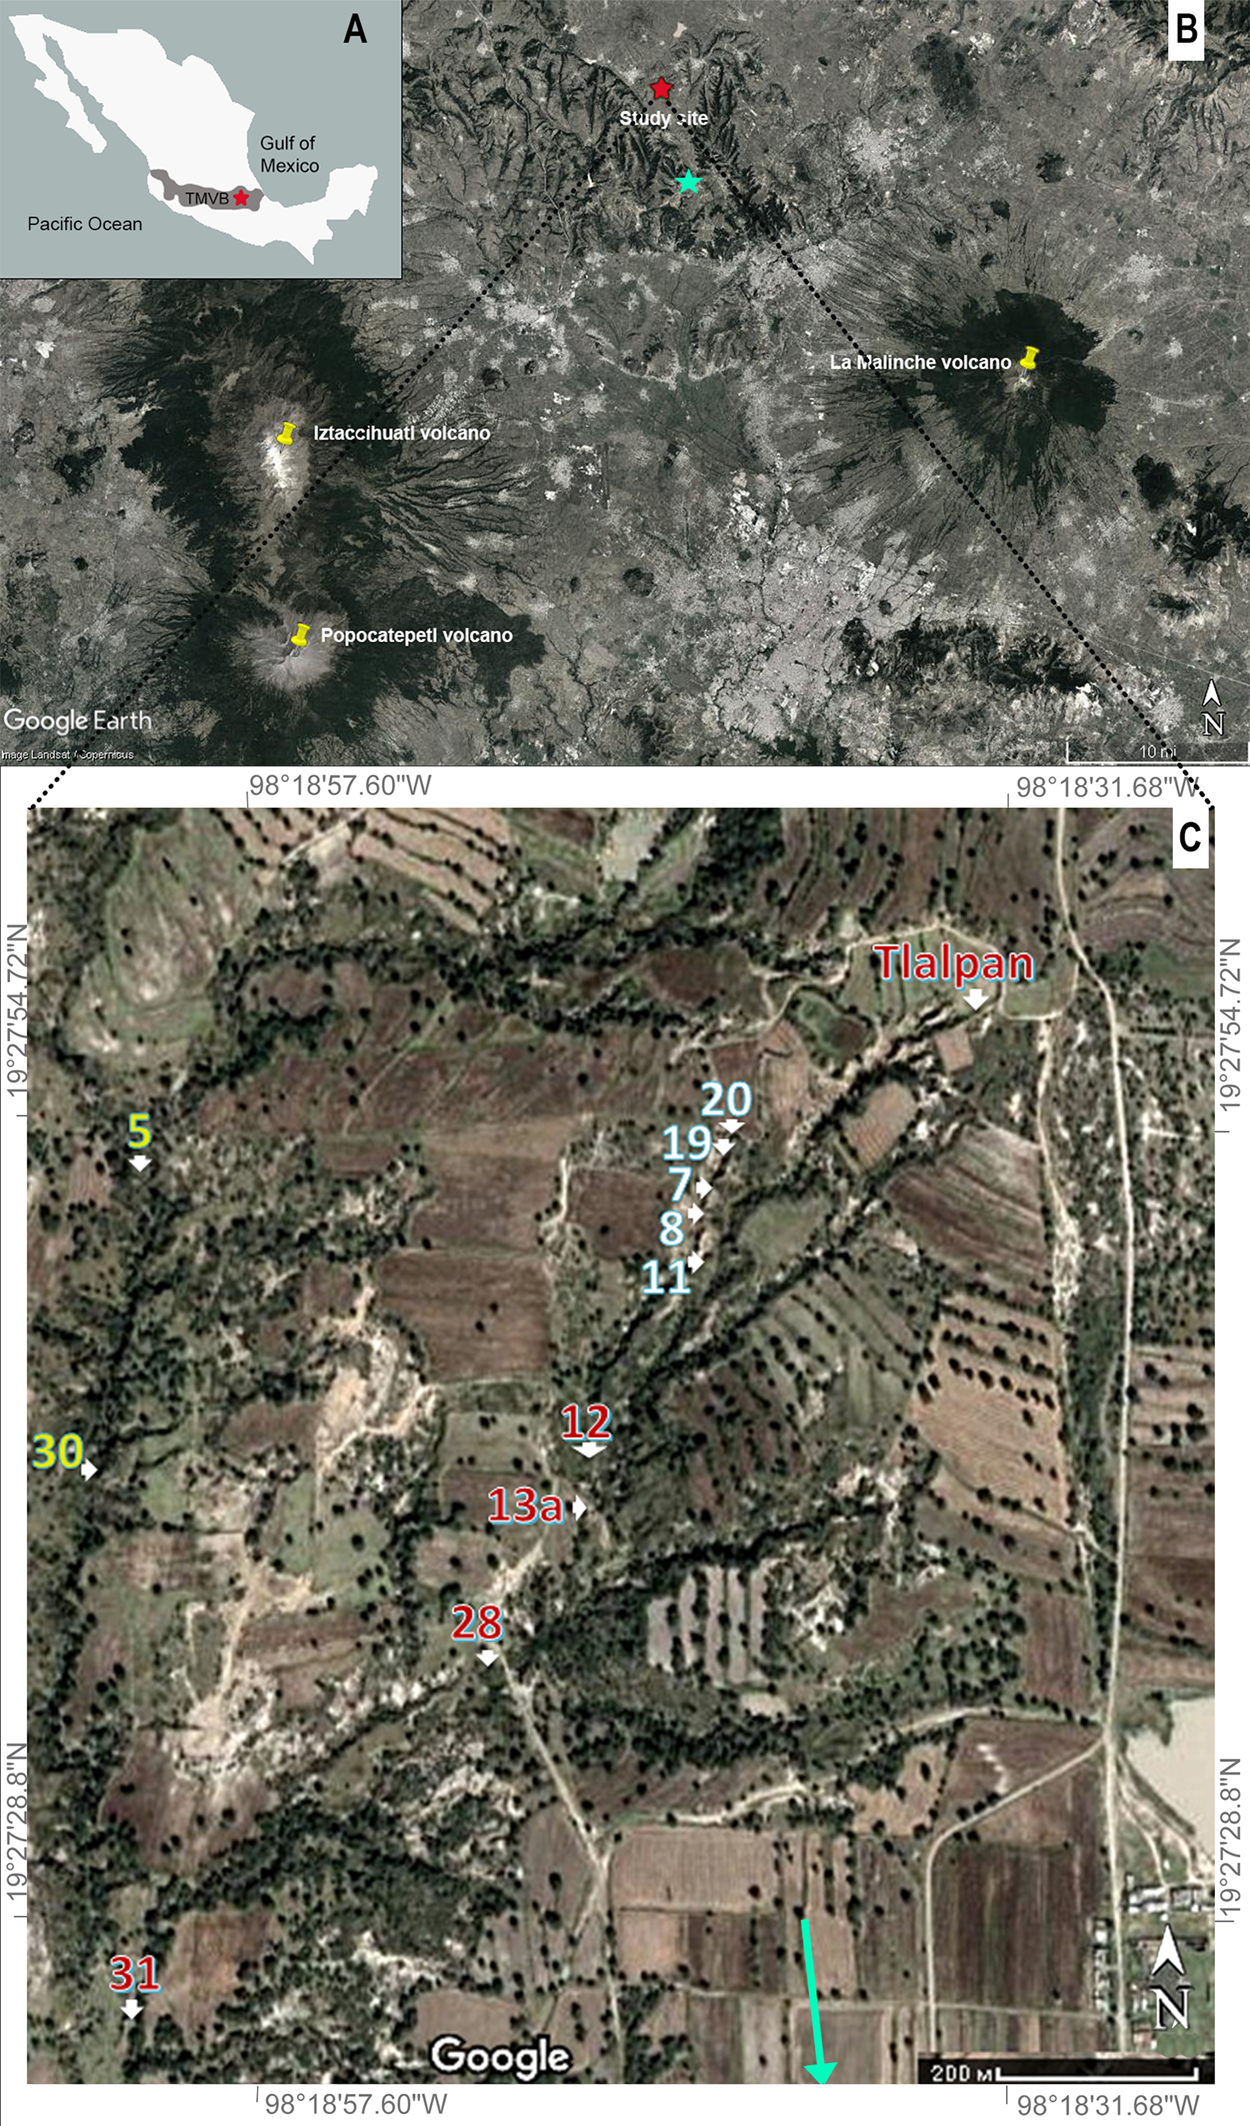
Location of study area and investigated profiles. (A) General location of study area (TMVB = Trans-Mexican Volcanic Belt). (B) Positions of main volcanoes in relation to the study site (red star) and the gully of Blanca (green star). (C) Map of locations of the studied profiles within the gully network. Yellow numbers correspond to the Concepcion gully (profiles 5 and 30), red and white numbers correspond to the Tlalpan (12, 13a, 28, and 31) and Young (7, 8, 11, 19, and 20) gullies. The green arrow shows the direction to the gully of Blanca, which is located at a distance of ~8 km from the study site.
Because geomorphic evolution involves erosion and sedimentation (sediment reallocation), we analyzed the sequences located in drainage divide (‘upland’) positions and on slopes and valleys (‘lowlands’) within the ravine network as complementary information sources. Furthermore, the study of surface soils and the sedimentary mantle is important in order to have access to the most complete “soil memory,” as has been shown by Kozlovskii and Goryachkin (Reference Kozlovskii and Goryachkin1996). Parts of the sedimentary mantle that developed in low geomorphic positions (e.g., foot slopes and depressions) often provides more detailed soil-sedimentary records with a higher temporal resolution for certain chronological intervals, in comparison to the sections formed in upland divide areas (Sycheva Reference Sycheva2006, Reference Sycheva, Targulyan and Goryachkin2008). The concept of importance of landscape soil distribution for paleoenvironmental investigations has been successfully applied for Pleistocene and Holocene paleosols in other regions. For example, paleoenvironmental reconstruction based on landscape soil distribution was applied in the Olduvai basin for 1.8 Ma paleosols of the Olduvai Gorge (Beverly et al., Reference Beverly, Ashley and Driese2014); in northwestern Poland slope sequences it showed a high-resolution record of the Alleröd interstadial (Jankowski, Reference Jankowski2012); and it was applied in a Late Pleistocene paleo-catena in Northern Ireland (Wilson, Reference Wilson1996).
LANDSCAPE AND ENVIRONMENTAL SETTING
The study area is located within the Transmexican Volcanic Belt (Fig. 1A), specifically within the Tlaxcala Block, which is surrounded by several volcanic structures (Fig. 1B). The Tlaxcala Block is an elevated part of a horst-graben system that was originated during the Miocene by a normal fault (Mooser et al., Reference Mooser, Montiel and Zúñiga1996; Lermo-Samaniego and Bernal-Esquia, Reference Lermo-Samaniego and Bernal-Esquia2006). In the grabens, there are closed depressions infilled by lacustrine sediments. Volcanic activity was intense and perhaps synchronous with tectonic movements in the main stratovolcanoes of La Malinche, Iztaccihuatl, and Popocatepetl (with altitudes ranging from 4461–5426 m asl), as well as smaller volcanoes (altitudes ~2500–2700 m asl). In the study region, lava flows have been identified in the Blanca gully, dated by K-Ar method to 2.4 Ma (Sedov et al, Reference Sedov, Solleiro-Rebolledo, Terhorst, Solé, Werner and Poetsch2009). We also found lavas at the floor of the Concepcion gully (Fig. 1).
The region is heavily dissected with numerous linear erosional landforms such as rills, ravines, and deeply incised gullies, which are locally named barrancas, with slopes ranging from 3–60% (Alvarado-Cardona et al., Reference Alvarado-Cardona, Colmenero-Robles and Valderrábano-Almegua2007). These slopes have been cultivated since the pre-Hispanic period for ca. 3000–3500 years (Lauer, Reference Lauer1979; Heine, Reference Heine2003). As a consequence, the area represents a dramatic example of the environmental effects of intensive agriculture and deforestation since the Preclassic period (2500–100 BC). The growing population and increasing intensity of cultivation of slope soils, together with presence of indurated fragipan-type tepetate horizons, provoked accelerated erosion (Heine, Reference Heine2003). The agricultural system included the construction of terraces to avoid or control erosion in the area (Whitmore and Turner, Reference Whitmore and Turner2001; Borejsza et al., Reference Borejsza, Rodríguez-López, Frederick and Bateman2008). This is why cross-slope terraces (“zanja-bordo” or dich-and-border terraces) are prominent landscape features (Borejsza et al., Reference Borejsza, Rodríguez-López, Frederick and Bateman2008; LaFevor, Reference LaFevor2014).
The climate is characterized by the alternation of dry and wet seasons. The wet season is mostly confined to summer months (June to September) and causes most of the erosion (Haulon et al., Reference Haulon, Werner, Flores-García, Vera-Reyes and Felix-Henningsen2007). The study area has a mean annual precipitation of 812 mm and a mean annual temperature of 14°C (García, Reference García2004). The soil cover of the Tlaxcala Block is mostly dominated by Cambisols with profile differentiation into А-АВ-В horizons (Werner et al., Reference Werner, Lückoff, Moll and Werner1988). Most of the tepetate formations correspond to BC-C horizons. Fluvisols are occasionally found on lacustrine and fluvial sediments within gullies. Both Cambisols and Fluvisols of the study area may alternatively be classified as Anthrosols because they have been plowed since ancient times and often contain pottery fragments in the uppermost 20–25 cm.
Our study was carried out within the drainage basins of the gullies (‘barrancas’) of Concepcion, Tlalpan, and Young. The Concepcion Barranca included profiles from the upland area, terraces, slopes, and the valley floor (Figure 1C). The Concepcion Barranca represents a large ramified system of gullies originating from a watershed at ~2600 m asl. Along the Tlalpan Barranca, a paleopedological study had previously been conducted in the locality named Tlalpan (Sedov et al., Reference Sedov, Solleiro-Rebolledo, Terhorst, Solé, Werner and Poetsch2009), where tepetates are widely exposed (Aliphat-Fernández and Werner, Reference Aliphat–Fernández and Werner1994), as well as in the Young Barranca (Fig. 1C). Sedov et al. (Reference Sedov, Solleiro-Rebolledo, Terhorst, Solé, Werner and Poetsch2009) identified several paleosol units separated by tepetates. According to their morphology, the materials were grouped into Gray, Brown, and Red units (from the younger to the older one). The Gray unit developed during Marine Isotope Stage (MIS) 3–1, which is evidence for the climate shift from cool and humid to drier and warmer conditions (Solís-Castillo et al., Reference Solís-Castillo, Solleiro-Rebolledo, Sedov and Salcido-Berkovich2012).
MATERIALS AND METHODS
Field survey
As part of the field work, we carried out a reconnaissance survey to determine the main relief-forming processes and to identify the most active ones, as well as to estimate the scale of eroded surfaces. During the survey, special attention was given to sites with evidence of local catastrophic events (e.g., fires, water breaks through natural dams, etc.), sites of ancient settlements, and areas of former ephemeral lakes (ponds). We also described sedimentary sequences in various parts of the Concepcion, Tlalpan, and Young barrancas (Fig. 1C). In particular, sections 19 and 20 are at the head of the Young gully: sections 7, 8, and 11 contain sediments infilling older (‘paleo-’) gully deposits (Figs. 2, 3A). Sections 12, 13а, and 28 are located in the lower part of the Tlalpan Barranca downstream of the Young Barranca mouth (Fig. Fig. 4). The sections in the Concepcion Barranca (Fig. 4) are arranged as follows: section 5, at its head, on the remnant of the former floor at the confluence of several tributaries entering the main valley; section 30, on the gully terrace in the middle part of the long profile; and section 31, the main gully terrace downstream from the Tlalpan Barranca mouth (Fig. 4). We collected samples of soil organic matter, charcoal, carbonates, and bones from the sections presented in Figures 2 and 4 in order to establish the chronological framework. In addition, we re-sampled the Gray Unit at the Tlalpan section, previously studied by Sedov et al. (Reference Sedov, Solleiro-Rebolledo, Terhorst, Solé, Werner and Poetsch2009) and Pogosyan et al. (Reference Pogosyan, Gastelum, Prado, Marquez, Abrosimov, Romanenko and Sedov2019). During the morphological description (Fig. 5), new profile-horizon nomenclature was applied, and soils were classified following the IUSS Working Group WRB (2015) system. Samples for magnetic studies, bulk chemical composition, pore space distribution. and biomorphs were taken every 10 cm throughout the Tlalpan profile.
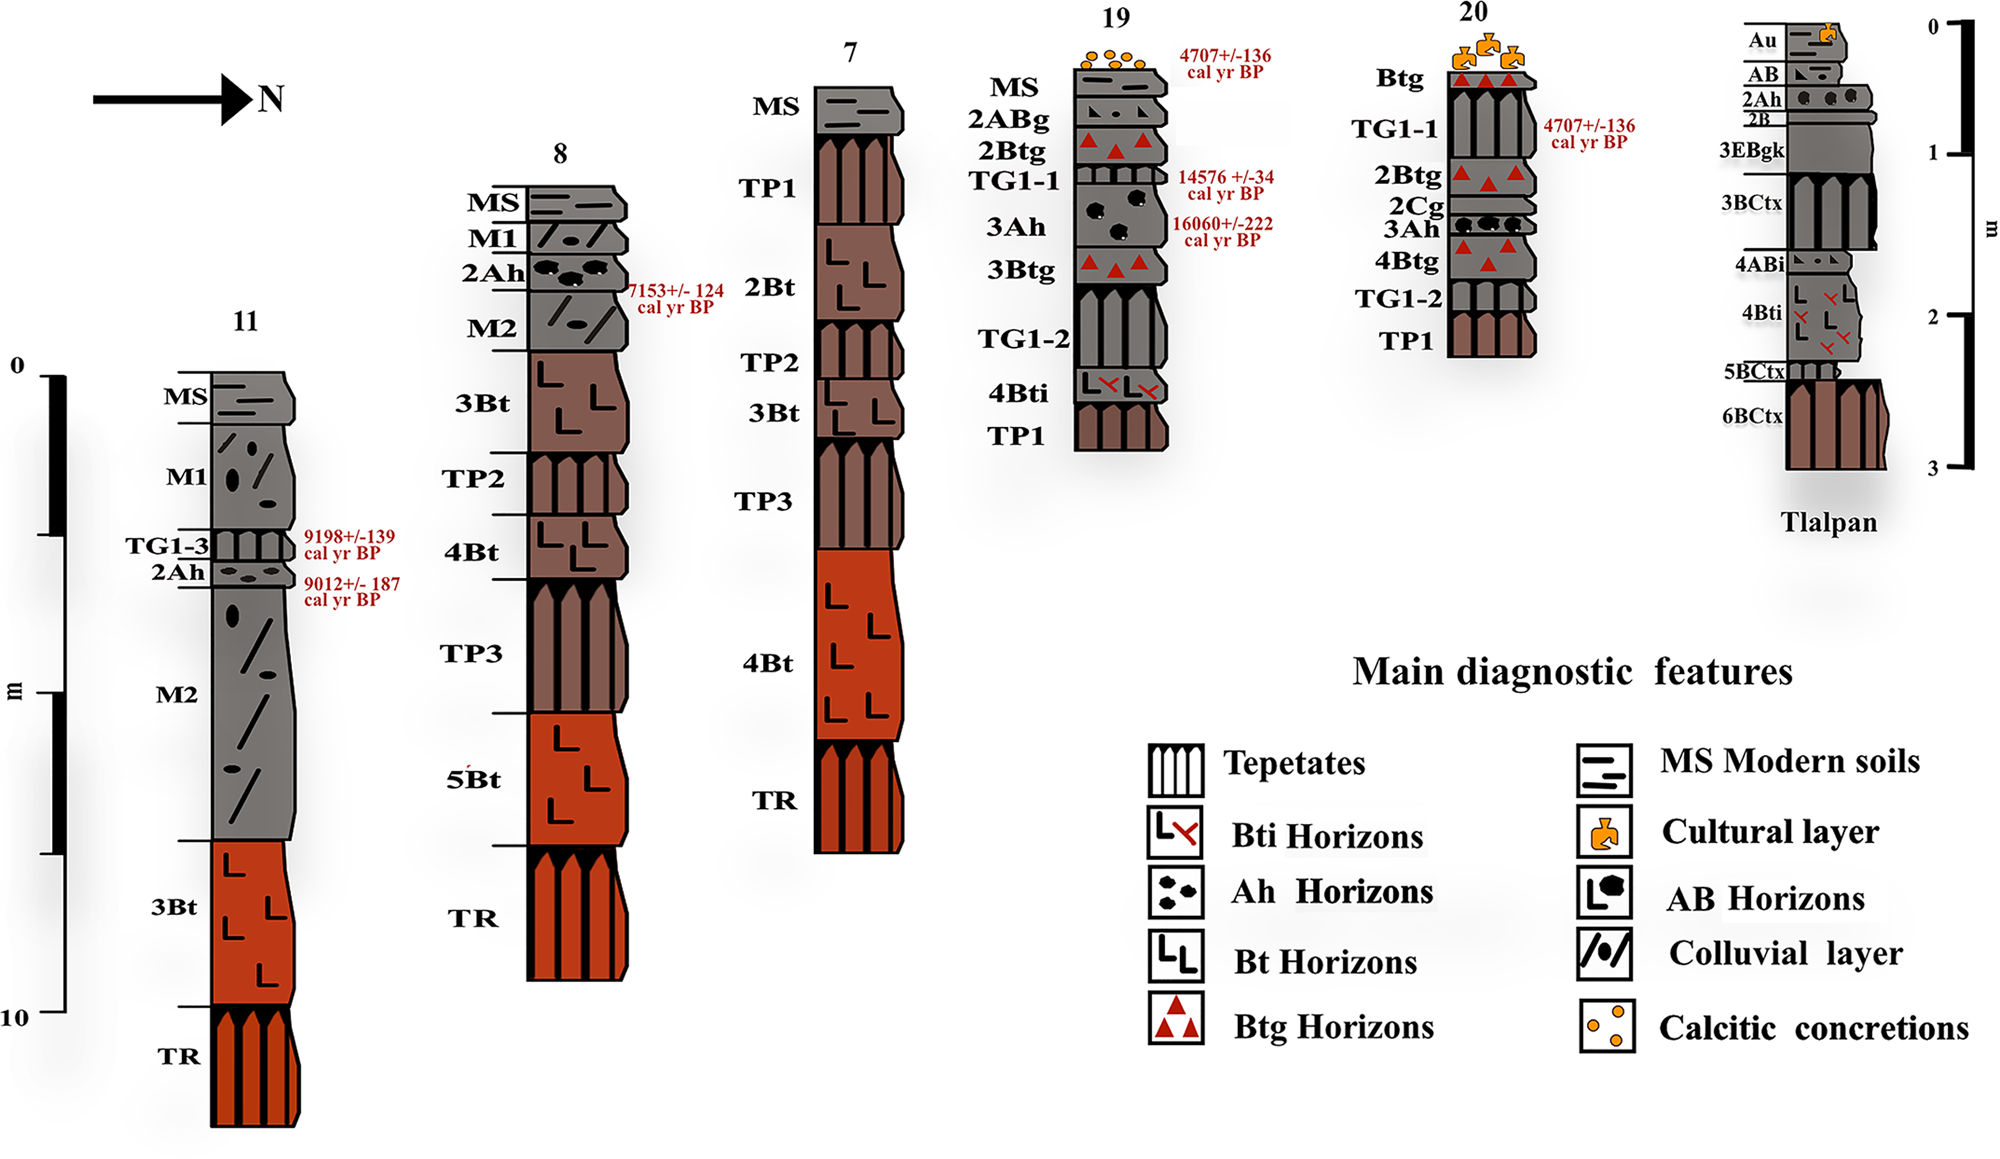
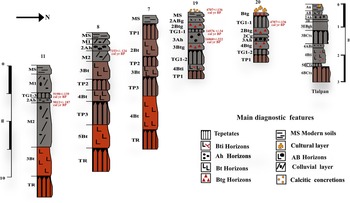
Profiles of Young Gully (20, 19, 7, 8, 11) and the Tlalpan section. Red, brown, and gray colors correspond to the main units described by Sedov et al. (Reference Sedov, Solleiro-Rebolledo, Terhorst, Solé, Werner and Poetsch2009). TG, TP, and TR correspond to Grey, Brown and Red tepetate respectively. M corresponds to colluvial horizons. See radiocarbon dating descriptions at Table 1.
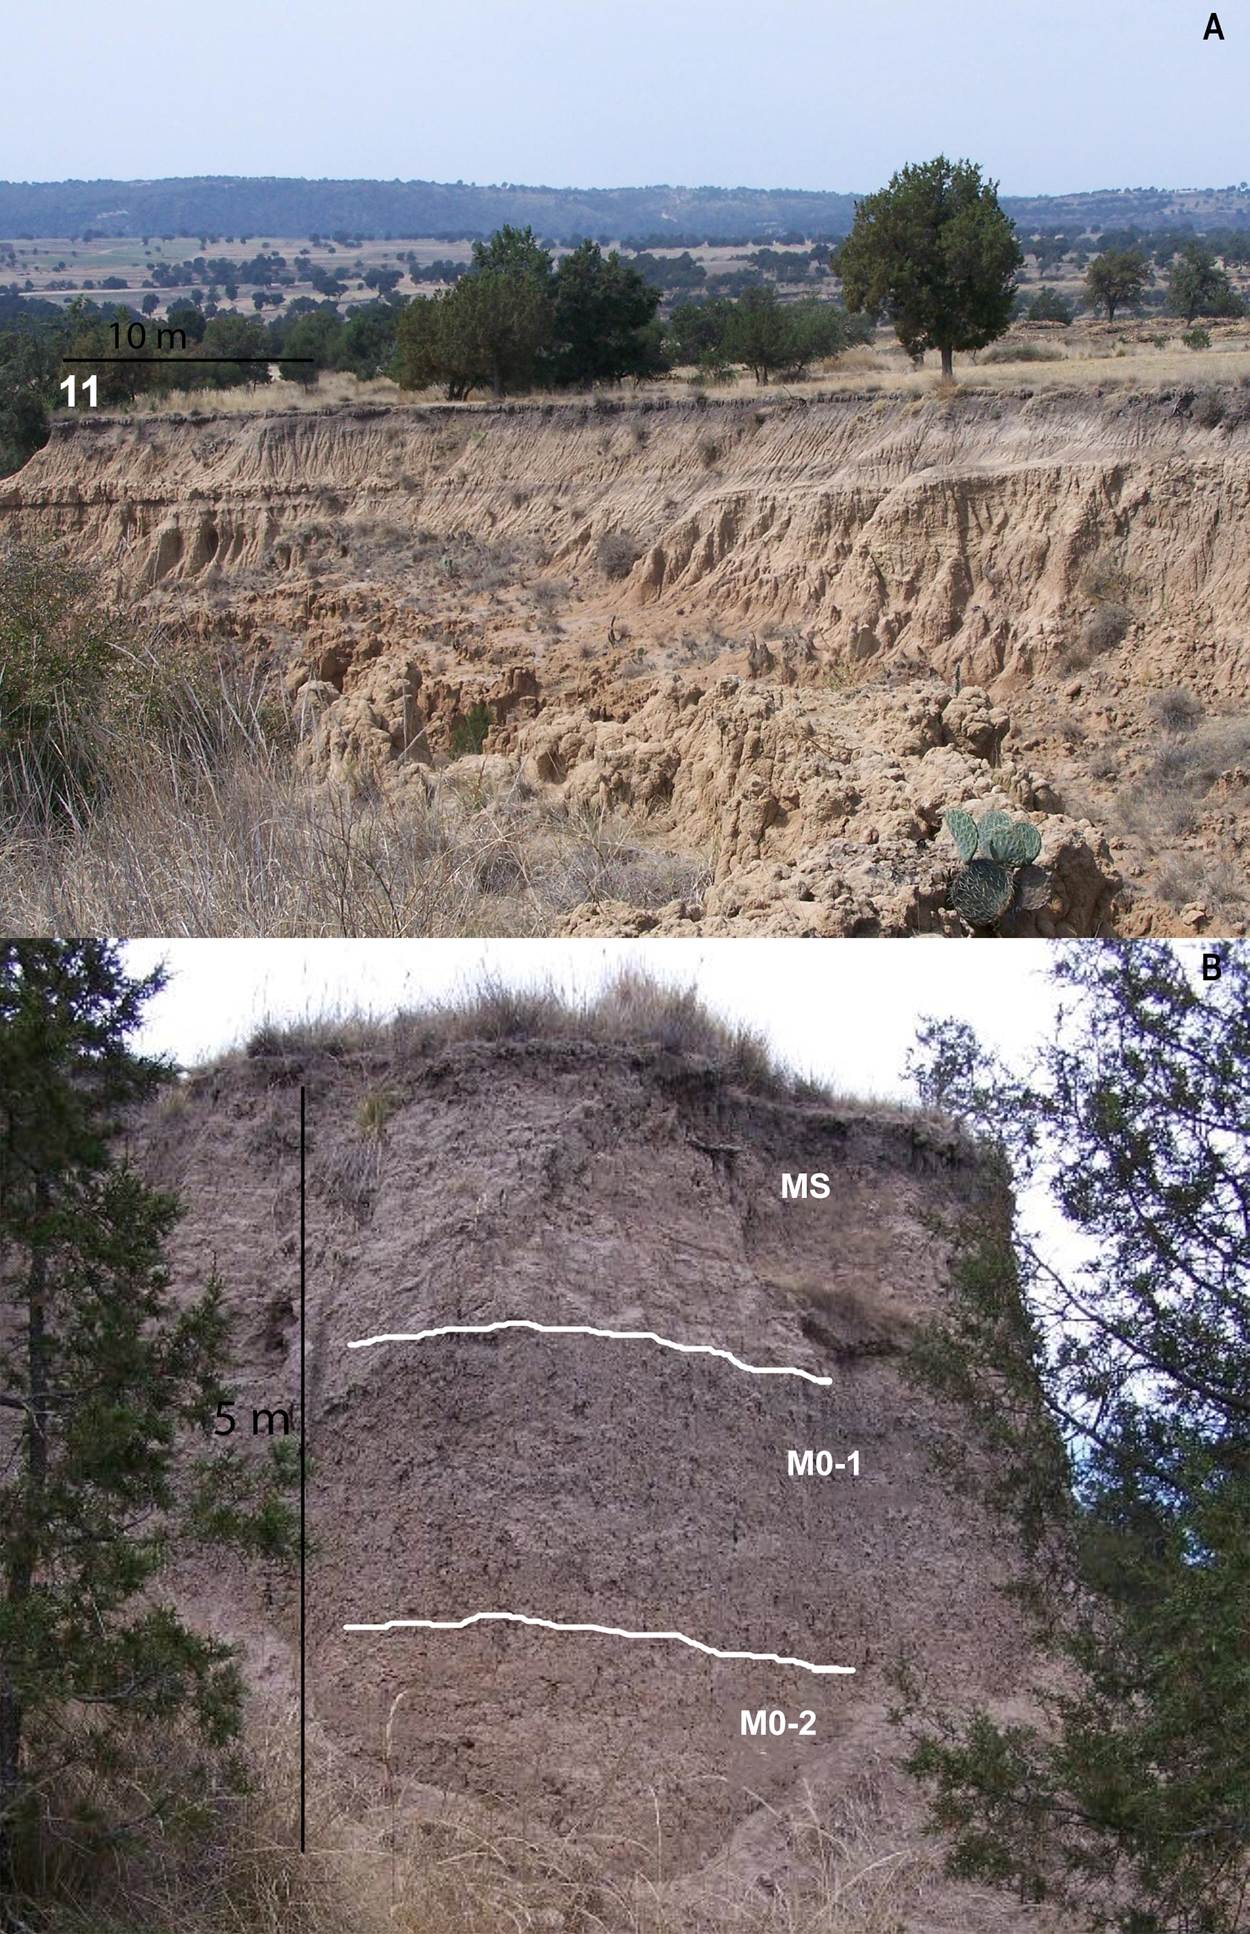
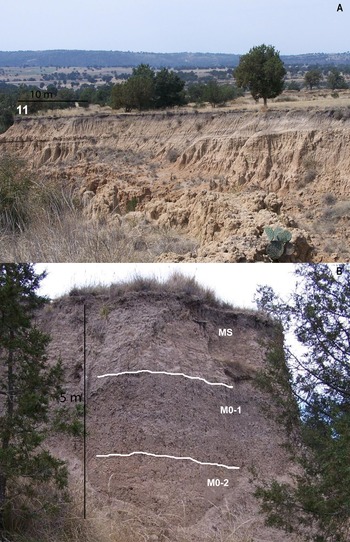
Photos of the gully profiles. (A) Young Barranca, profile 11; (B) stratigraphy of the Concepcion gully terrace (section 30).
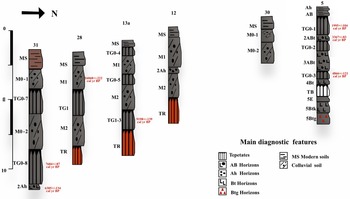
Profiles of Conception (5 and 30) and Tlalpan Gully (12, 13a, 28, and 31). Red, brown, and gray colors correspond to the main units described by Sedov et al. (Reference Sedov, Solleiro-Rebolledo, Terhorst, Solé, Werner and Poetsch2009). TG, TR, and TB correspond to Grey, Red and White tepetate respectively. See radiocarbon dating descriptions at Table 1.
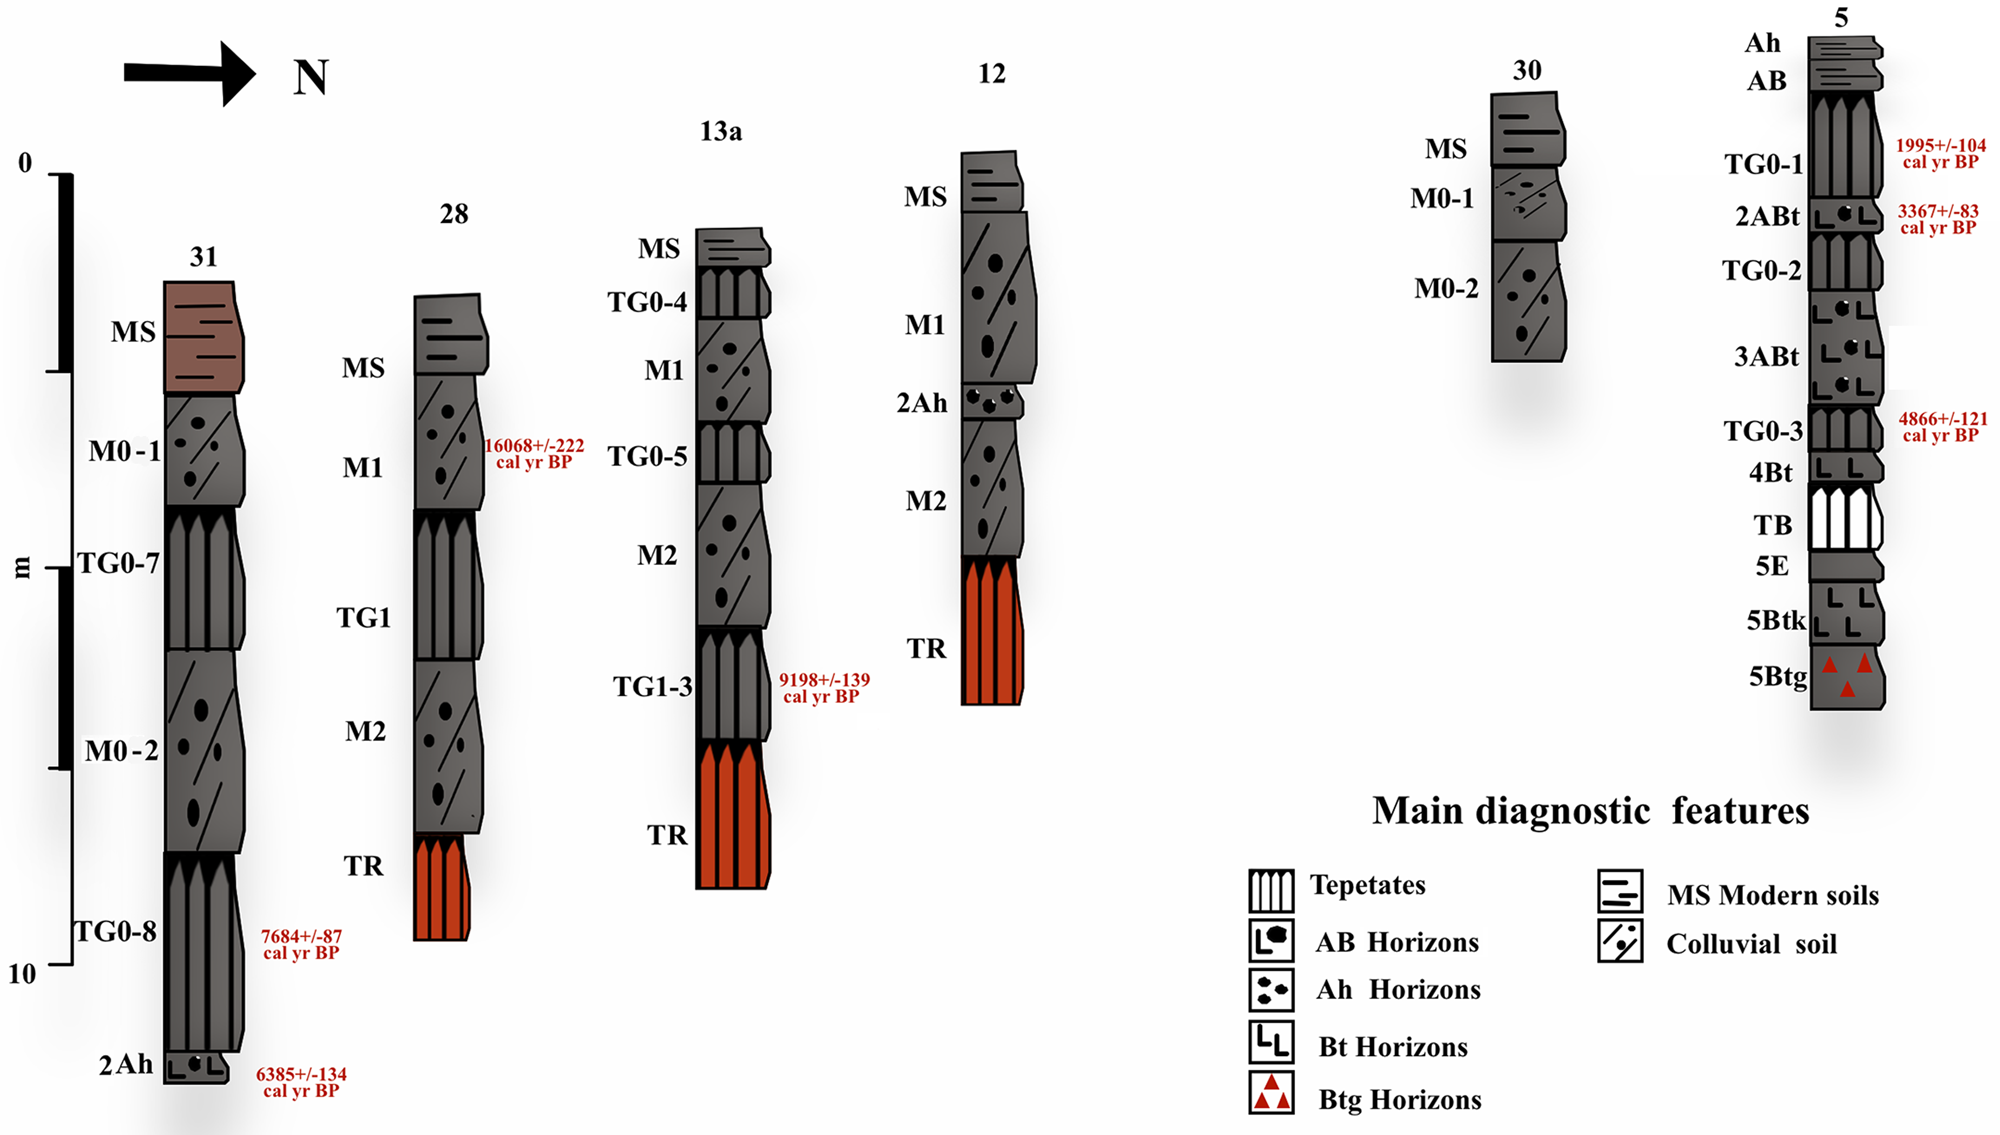
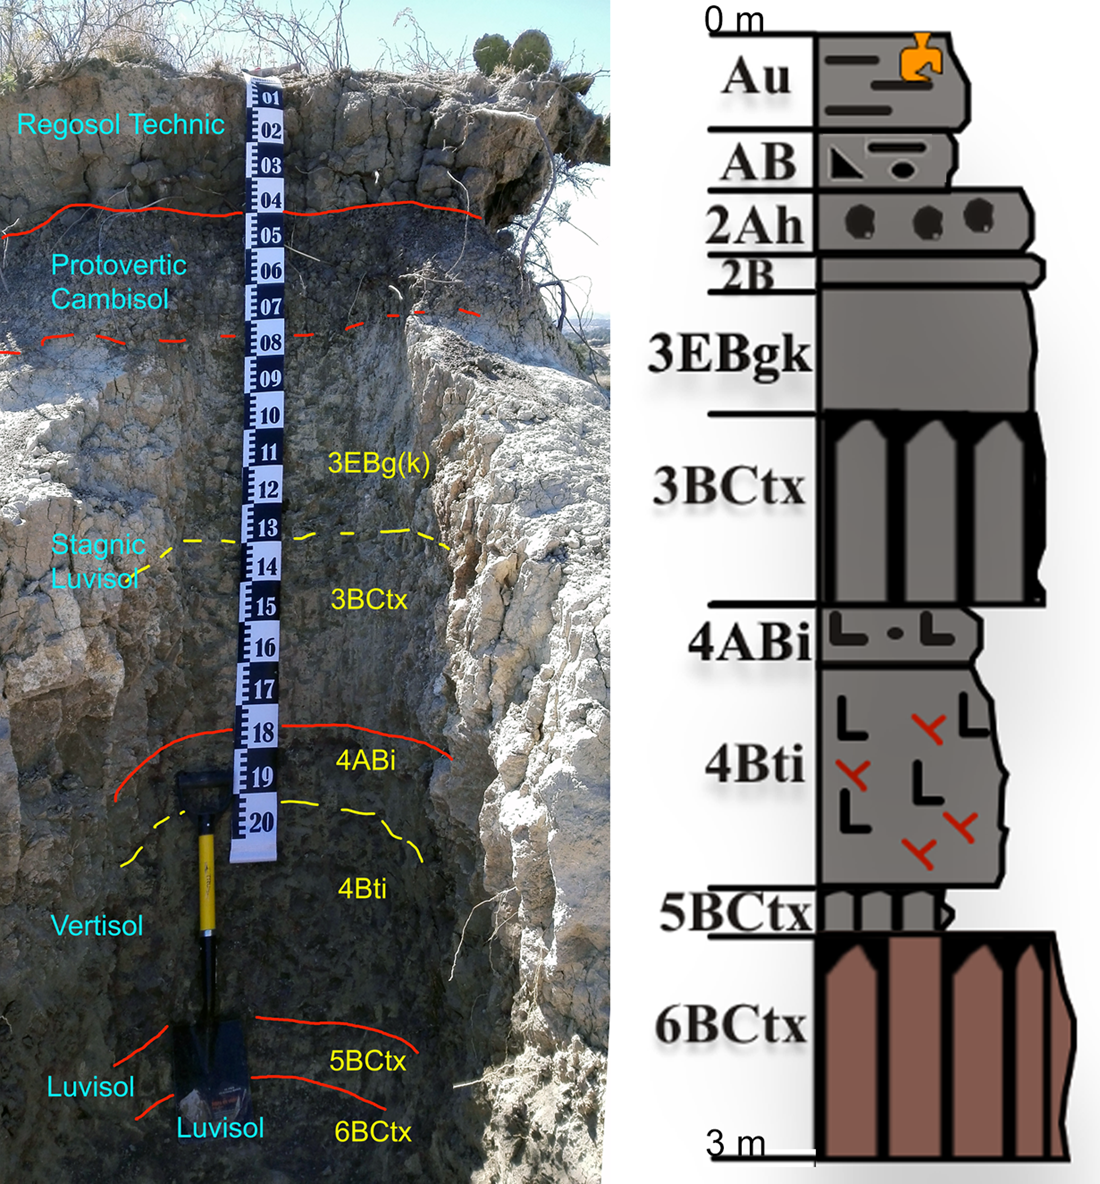
Photo of the Tlalpan profile with main morphological units and horizons scheme. See Figure 2 for Tlalpan section explanation.
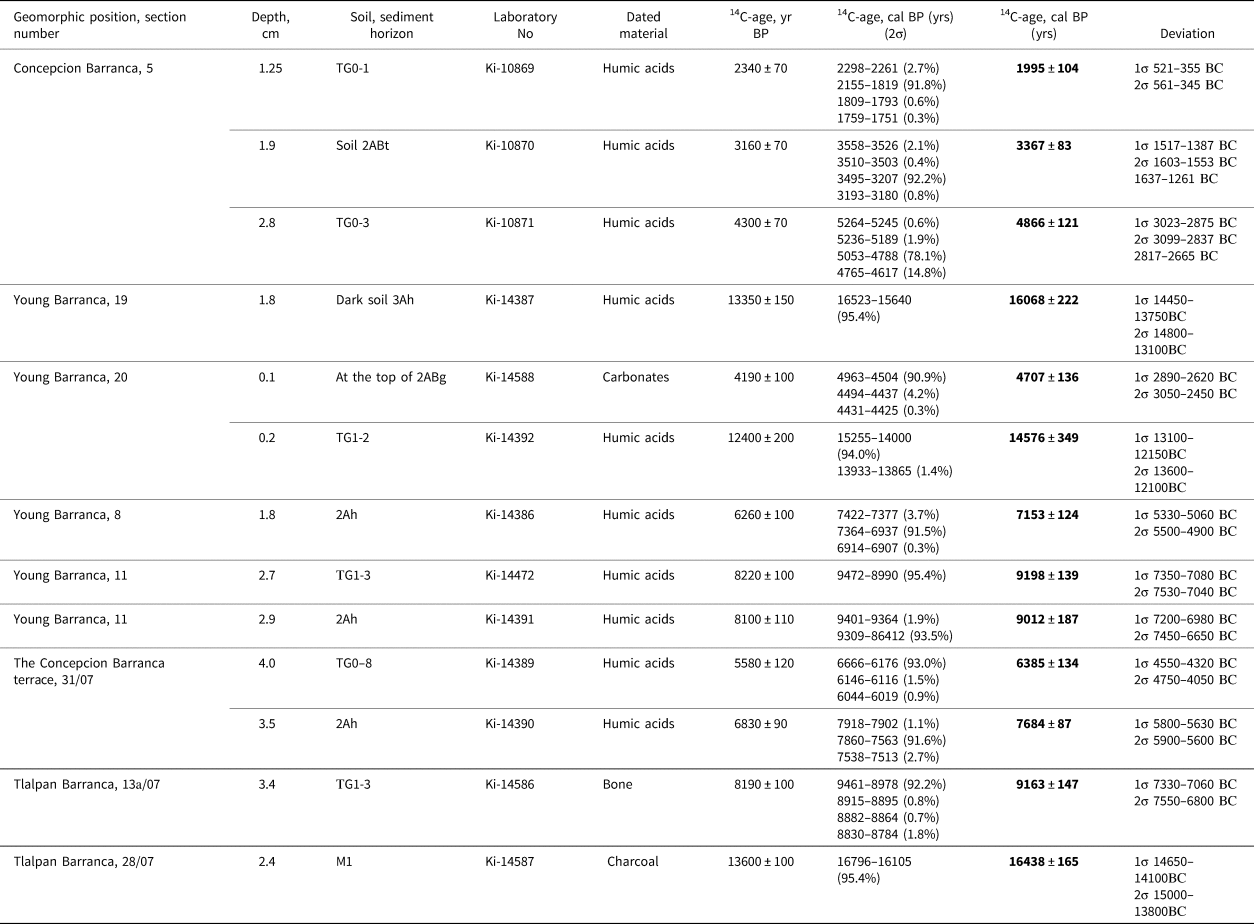
Results of radiocarbon dating of soils and deposits.
Analytical methods
Particle-size distribution analysis and micromorphological observations of each genetic horizon were conducted (Fig. 5). Particle-size distribution was determined using an Analysette 22 Comfort laser analyzer (FRITSCH, Germany) and the parameters of calculation proposed by Sochan et al. (Reference Sochan, Polakowski and Łagód2014); the upper limits of fraction sizes were determined by Schoeneberger et al. (Reference Schoeneberger, Wysocki and Benham2012). The samples were pre-treated with an ultrasonic disruptor (Stepped Solid Horn ½”, Digital Sonifier S-250D, Branson Ultrasonics, USA), following North (Reference North1976). Fraction sizes were defined as sand (63<1000 μm), silt (2<63 μm), and clay (<2 μm), following the FAO (2006) guidelines. Thin sections for micromorphology were prepared using a polyester resin, cut and polished to obtain a 30 μm section. For the micromorphological descriptions, an Olympus petrographic microscope was used, following the terminology of Bullock et al. (Reference Bullock, Fedoroff, Jongerius, Stoops, Tursina and Babel1985).
Magnetic susceptibility was used as an indicator of pedogenic versus lithogenic processes. Each sample was air dried, gently crushed, and then tightly packed into cubical diamagnetic boxes of 8 cm3 each. The mass of each sample was measured to calculate mass-normalized magnetic susceptibility (χ). Magnetic susceptibility in low (0.47 kHz) and high (4.7 kHz) frequencies (χlf and χhf) was measured with a Bartington MS2B susceptibility meter with a dual sensor. We also calculated the frequency-dependent magnetic susceptibility (χfd), which is the percentage difference between low and high frequency magnetic susceptibility (χfd = 1 − χhf/χlf).
The bulk chemical composition was measured for major (Ca, Fe, Ti, and K) and trace (Zr) elements. For this analysis, 5 g of soil were crushed in agate saddle stone and sieved with sieve number 60. Then, the samples were placed in plastic bags and measurements made using a NITON XL3t Thermo Scientific portable analyzer using a radiation source of a Ag anode (6–50 kV, 0–200μA max). Following the US EPA manual for the 6200 method (Revision 0, February 2007; https://www.epa.gov/sites/default/files/2015-12/documents/6200.pdf) for each sample, the value was measured threefold with relative standard deviation <20%.
Pore space was studied by computed tomography to describe the pore distribution and connectivity. The porosity may contain a significant element of soil memory in the shape and orientation of pores (Romanis et al., Reference Romanis, Sedov, Lev, Lebedeva, Kondratev, Yudina, Abrosimov, Golyeva and Volkov2021) and preserves the original forms for a long time (López-Prat et al., Reference López-Prat, Agostino, Bandyopadhyay, Carrascosa, Crocco, De Luca and Filosa2021). Tomographic scanning of soil samples was performed using a Bruker SkyScan 1172 G 3D X-ray scanner. The resolution of obtained images is 3.15 μm. Image reconstruction was performed using Bruker nRecon software. The images were segmented manually by global thresholding. Morphometric analysis was performed using Bruker CTAn software. We obtained the following morphometric data: porosity (open and closed), pore size distribution, and connectivity of solid phase. Porosity is the ratio of volume of pores (black voxels after segmentation) to whole volume of interest. Rendering of soil 3D images was performed using Bruker CTVox.
The detritus, phytoliths, sponge spicules, and other remains of biomorphs were studied under the microscope. A 50 g sample was treated with a hot 30% solution of H2O2; sand and clay fractious were separated from silt, which was subjected to flotation in a heavy liquid (cadmium iodide and potassium iodide with a specific gravity of ~2.3 g/cm3). After 10 min-centrifugation, the floating siliceous particles and other biomorphs were collected into a tube, washed with distilled water several times, and dried. Then the sample was immersed in oil (silica oil or glycerin) and studied under the optical microscope at magnifications varying from 200–900 times. The morphotypes were counted in specimens prepared with a volume of ~1.9 mm3 each. Analyzing the entire complex of soil microbiomorphs enables the entire spectrum of particles from one sample to be determined. Ecological and environmental interpretations of the phytolith assemblages were undertaken according to Golyeva (Reference Golyeva, Madella and Zurro2007).
Dating of the materials
The dating of materials was performed at the Institute of Radiogeochemistry and Environments of the National Academy of Sciences of Ukraine using the vacuum pyrolysis method (14C dating of small-size samples with the use of an accelerator). The dated material was mostly represented by humic acids separated from soils, tepetate, and colluvial-deposit samples. In addition, there were also dated charcoal and bone remains from slope deposits and carbonate concretions recovered from tepetate. Calibration was done by using the OxCal 4.4 calibration program (https://c14.arch.ox.ac.uk/oxcal.html) and the Northern Hemisphere Radiocarbon Age Calibration Curve IntCal 20 (Reimer et al., Reference Reimer, Austin, Brad, Bayliss, Blackwell, Bronk Ramcey and Butzin2020). As for the Tlalpan sequence, the dating has been presented earlier (Sedov et al., Reference Sedov, Solleiro-Rebolledo, Terhorst, Solé, Werner and Poetsch2009).
RESULTS
Key profile Tlalpan
The macromorphological description of the modern soil and the Gray Unit of the Tlalpan profile was published previously by Sedov et al. (Reference Sedov, Solleiro-Rebolledo, Terhorst, Solé, Werner and Poetsch2009) and Solís-Castillo et al. (Reference Solís-Castillo, Solleiro-Rebolledo, Sedov and Salcido-Berkovich2012) and updated by Pogosyan et al. (Reference Pogosyan, Gastelum, Prado, Marquez, Abrosimov, Romanenko and Sedov2019). The studied sequence consists of the modern soil, two paleosols, and three tepetate layers (marked here as BCtx horizons), which correspond to different events of sedimentation and separate soil formation cycles (Fig. 5). The modern soil (Regosol Techniс) is grayish, vastly eroded, and preserves many obsidian artifacts; it is represented by Au and AB horizons. The soil below it (Protovertic Cambisol) is darker and has a better aggregate structure in the 2Ah horizon, it also has 2AB and 2B horizons. Below the first paleosol there is another paleosol (Stagnic Luvisol), which starts with a 3EBgk horizon (2Bk in Pogosyan et al., Reference Pogosyan, Gastelum, Prado, Marquez, Abrosimov, Romanenko and Sedov2019). This horizon is characterized by the presence of 1300 year old carbonate concretions and thick iron nodules (0.5 cm in diameter). The first tepetate 3BCtx (TG1 at Pogosyan et al., Reference Pogosyan, Gastelum, Prado, Marquez, Abrosimov, Romanenko and Sedov2019) horizon underlies the 3EBgk horizon and has typical fragipan morphological properties. Below it, there is a dark-colored clayey paleo-Vertisol with well-defined angular (wedge-shaped) aggregates; it has 4ABi-4Bti horizons (3ABi at Pogosyan et al., Reference Pogosyan, Gastelum, Prado, Marquez, Abrosimov, Romanenko and Sedov2019). At the bottom of the profile, there are two tepetate layers, 5BCtx and 6BCtx (TG2 and TP1 at Pogosyan et al., Reference Pogosyan, Gastelum, Prado, Marquez, Abrosimov, Romanenko and Sedov2019, respectively), with properties similar to those of the 3BCtx tepetate, but the lower one belongs to the older Brown stratigraphic Unit (Sedov et al., Reference Sedov, Solleiro-Rebolledo, Terhorst, Solé, Werner and Poetsch2009). In this new description, the tepetate layers were considered as BCx horizons, which differs from our previous observations where they were named as Cx horizons (Sedov et al., Reference Sedov, Solleiro-Rebolledo, Terhorst, Solé, Werner and Poetsch2009) or described as TG (Tepetate of the Gray Unit) and TP (Tepetate of the Brown Unit) (Sycheva et al., Reference Sycheva, Sedov and Solleiro-Rebolledo2013; Pogosyan et al., Reference Pogosyan, Gastelum, Prado, Marquez, Abrosimov, Romanenko and Sedov2019). However, because the studied profiles on the gully slopes have no direct analogies with the Tlalpan profile, which makes correlation difficult, we still use the TG, TP, TR (Tepetate of the Red Unit), and TB (White tepetate) nomenclature for the rest of profiles.
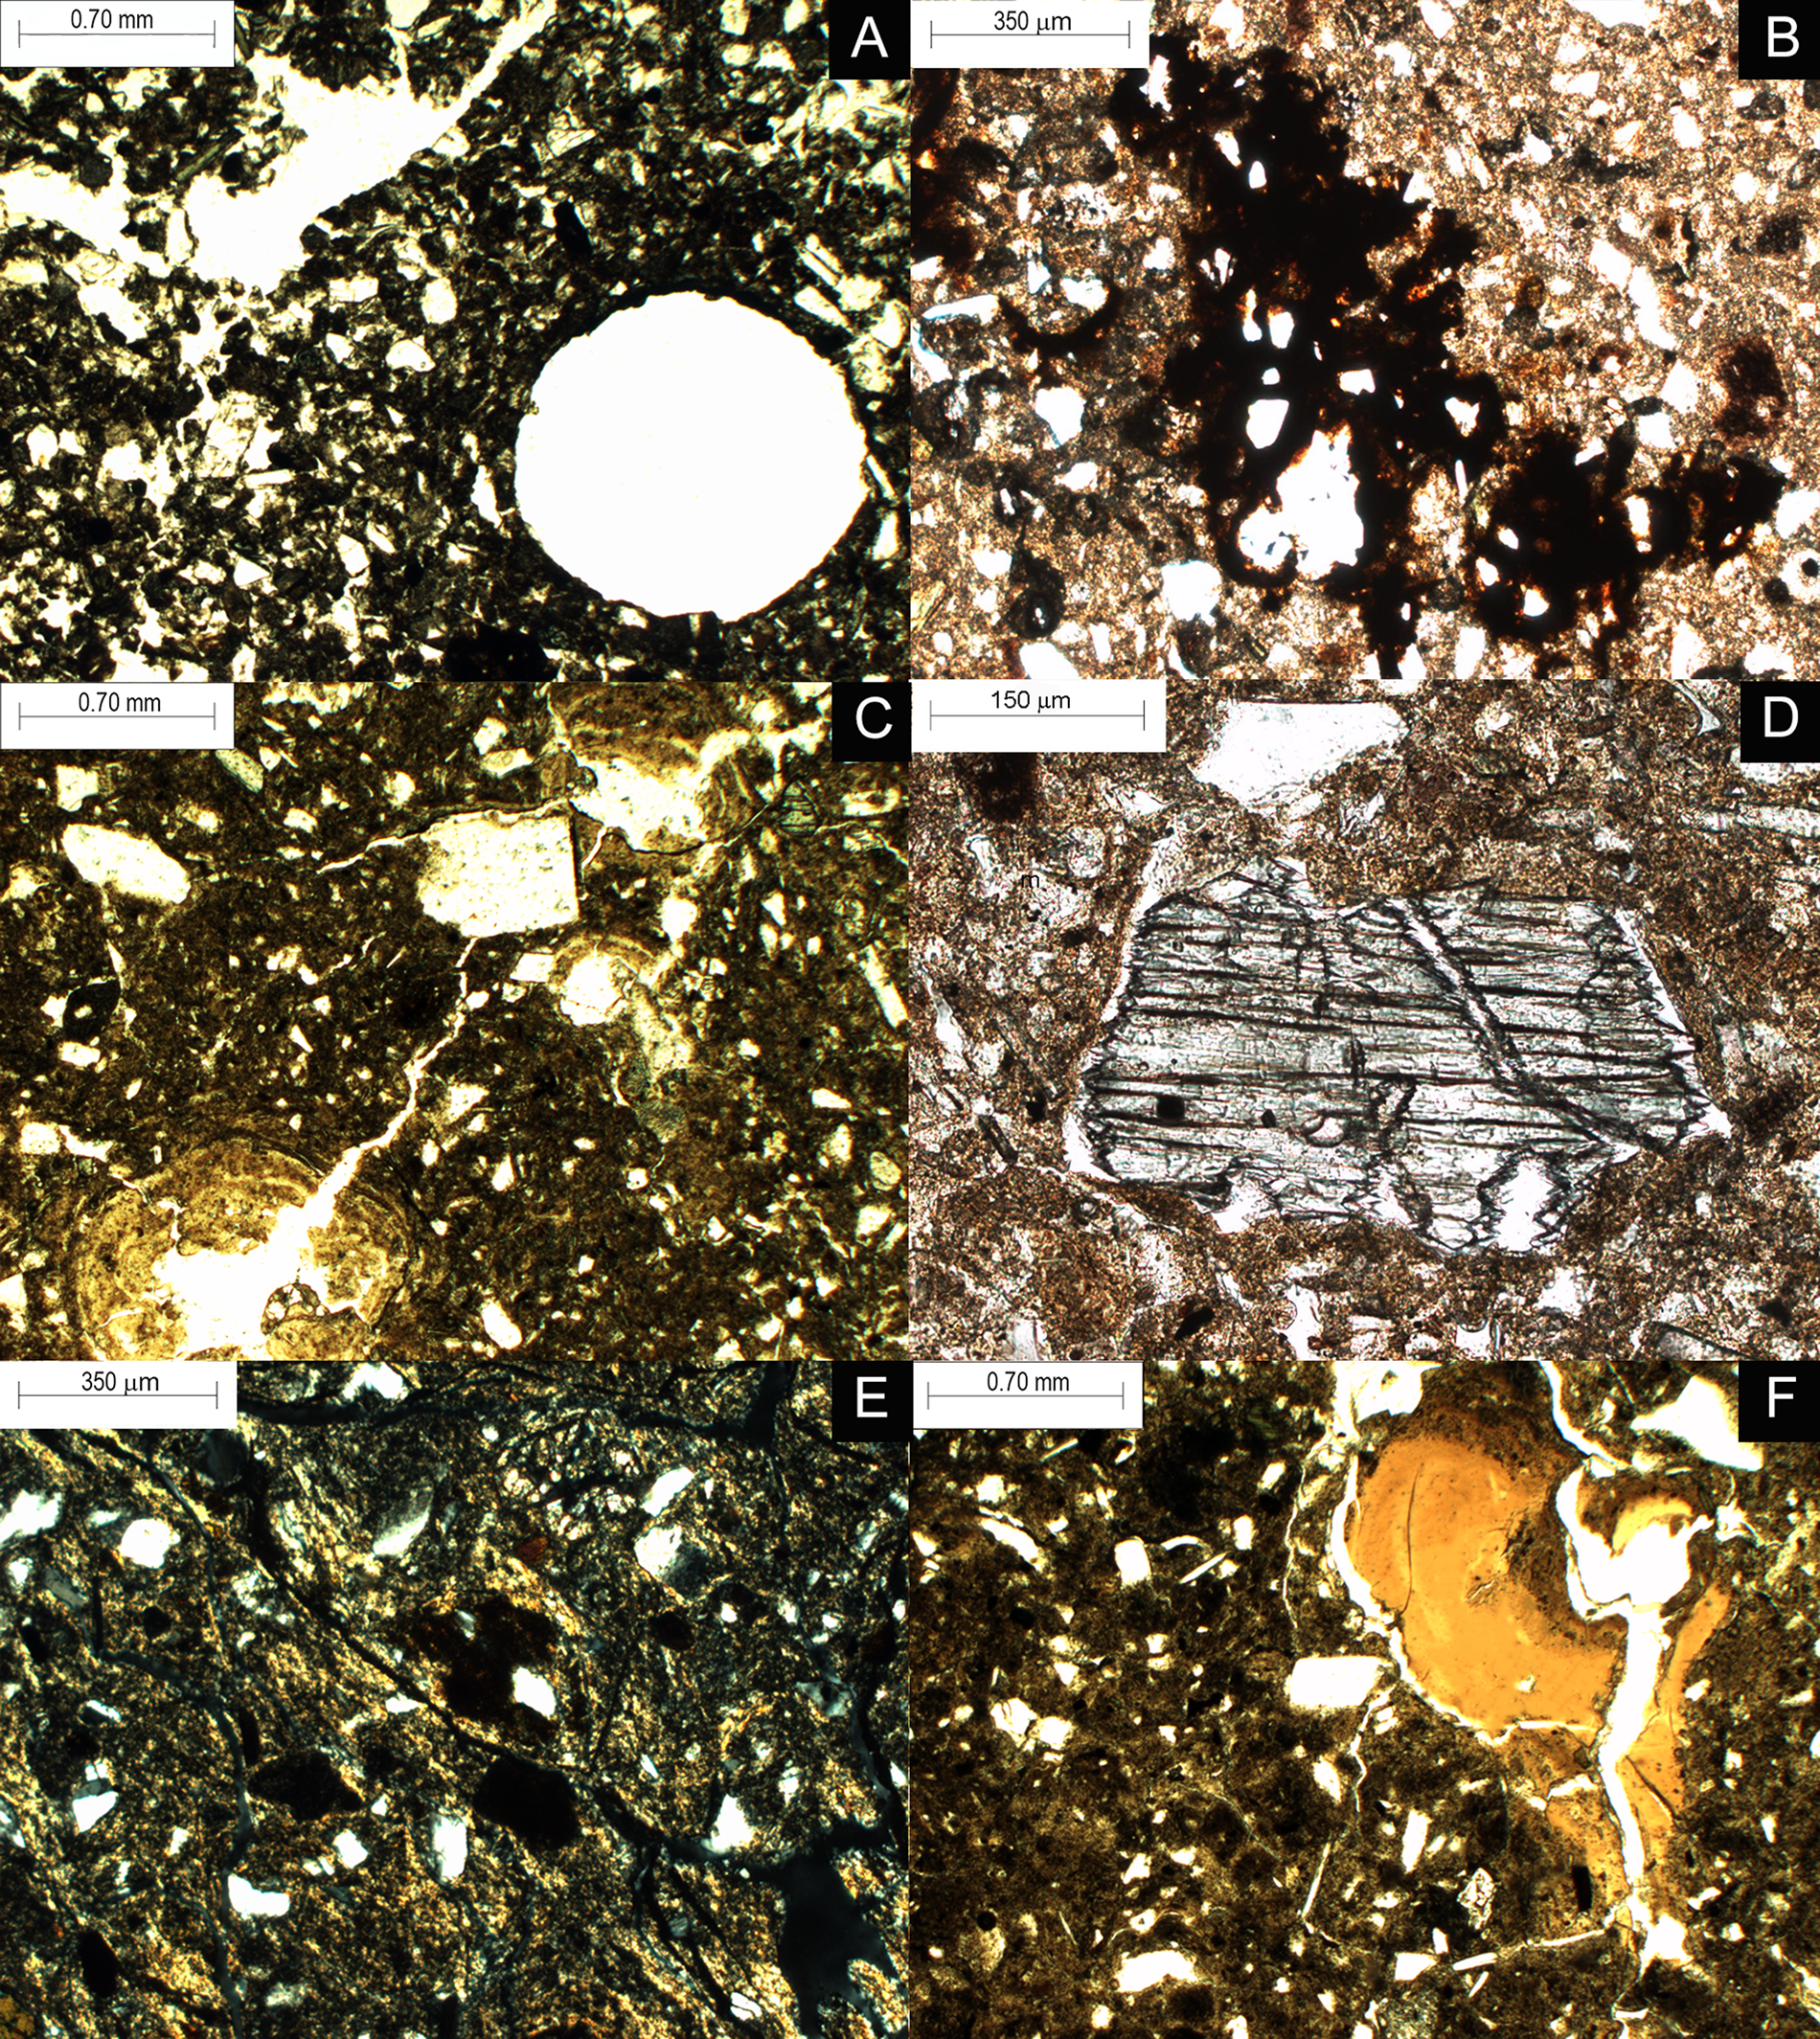
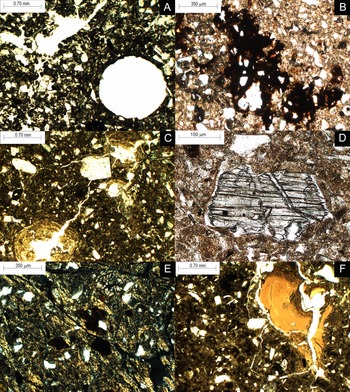
Micromorphological observations have shown that the modern soil is characterized by a dark compact groundmass with a subangular blocky structure, few channel voids (Fig. 6A), and the presence of microartefacts (charcoal and ceramic fragments). The 2Ah horizon has a clayey groundmass and angular blocky structure; sometimes the microaggregates have a wedge-like shape. Below, within the 3EBgk horizon, the groundmass has more coarse sand and silt material and incorporates large rounded ferruginous nodules (Fig. 6B). Thick illuvial clay coatings are a prominent feature of the first tepetate (3BCxt horizon). They partly fill the few original large channels, leaving only small, isolated pores (Fig. 6C). Most of them have a dotted morphological pattern caused by multiple inclusions of fine silt particles. In this horizon, we observed evidence of moderate weathering of volcanogenic minerals, in particular etching of pyroxenes (Fig. 6D). Clay coatings are also present in the underlying 4ABi horizon, however here they are more limpid and frequently fragmented and deformed. The 4Bi horizon shows the most clear Vertic micromorphological pattern: compact clayey groundmass that has striated b-fabric with strong birefringence areas along thin fissures (stress-cutans) (Fig. 6E). The lower gray tepetate (5BCtx horizon) also contains clay coatings (Fig. 6F) and infillings that occupy large channels, as in the 3BCtx horizon. Their color is brownish-yellow due to slight ferruginous pigmentation, thus their morphology differs from all other illuvial pedofeatures within the overlying sequence.
Micromorphological photographs of main horizons of the Tlalpan profile. (A) Biogenic aggregation and pores in the Au horizon, PPL; (B)compact matrix organization and complex ferruginous nodule in the 3EBgk horizon, PPL; (C) illuvial impure clay coatings occupy a significant part of pore-channels in the 3BCtx tepetate horizon, PPL; (D) moderately weathered grain of pyroxene with serrated edges in the 3BCtx tepetate horizon, PPL; (E) porostriated b-fabric (stress cutans) in the 4Bti horizon, N+; (F) compact matrix, thick undisturbed illuviated clay coating in the pore-channel of the 5BCtx tepetate horizon, PPL. PPL = plain polarized light; N+ = crossed polarizers.
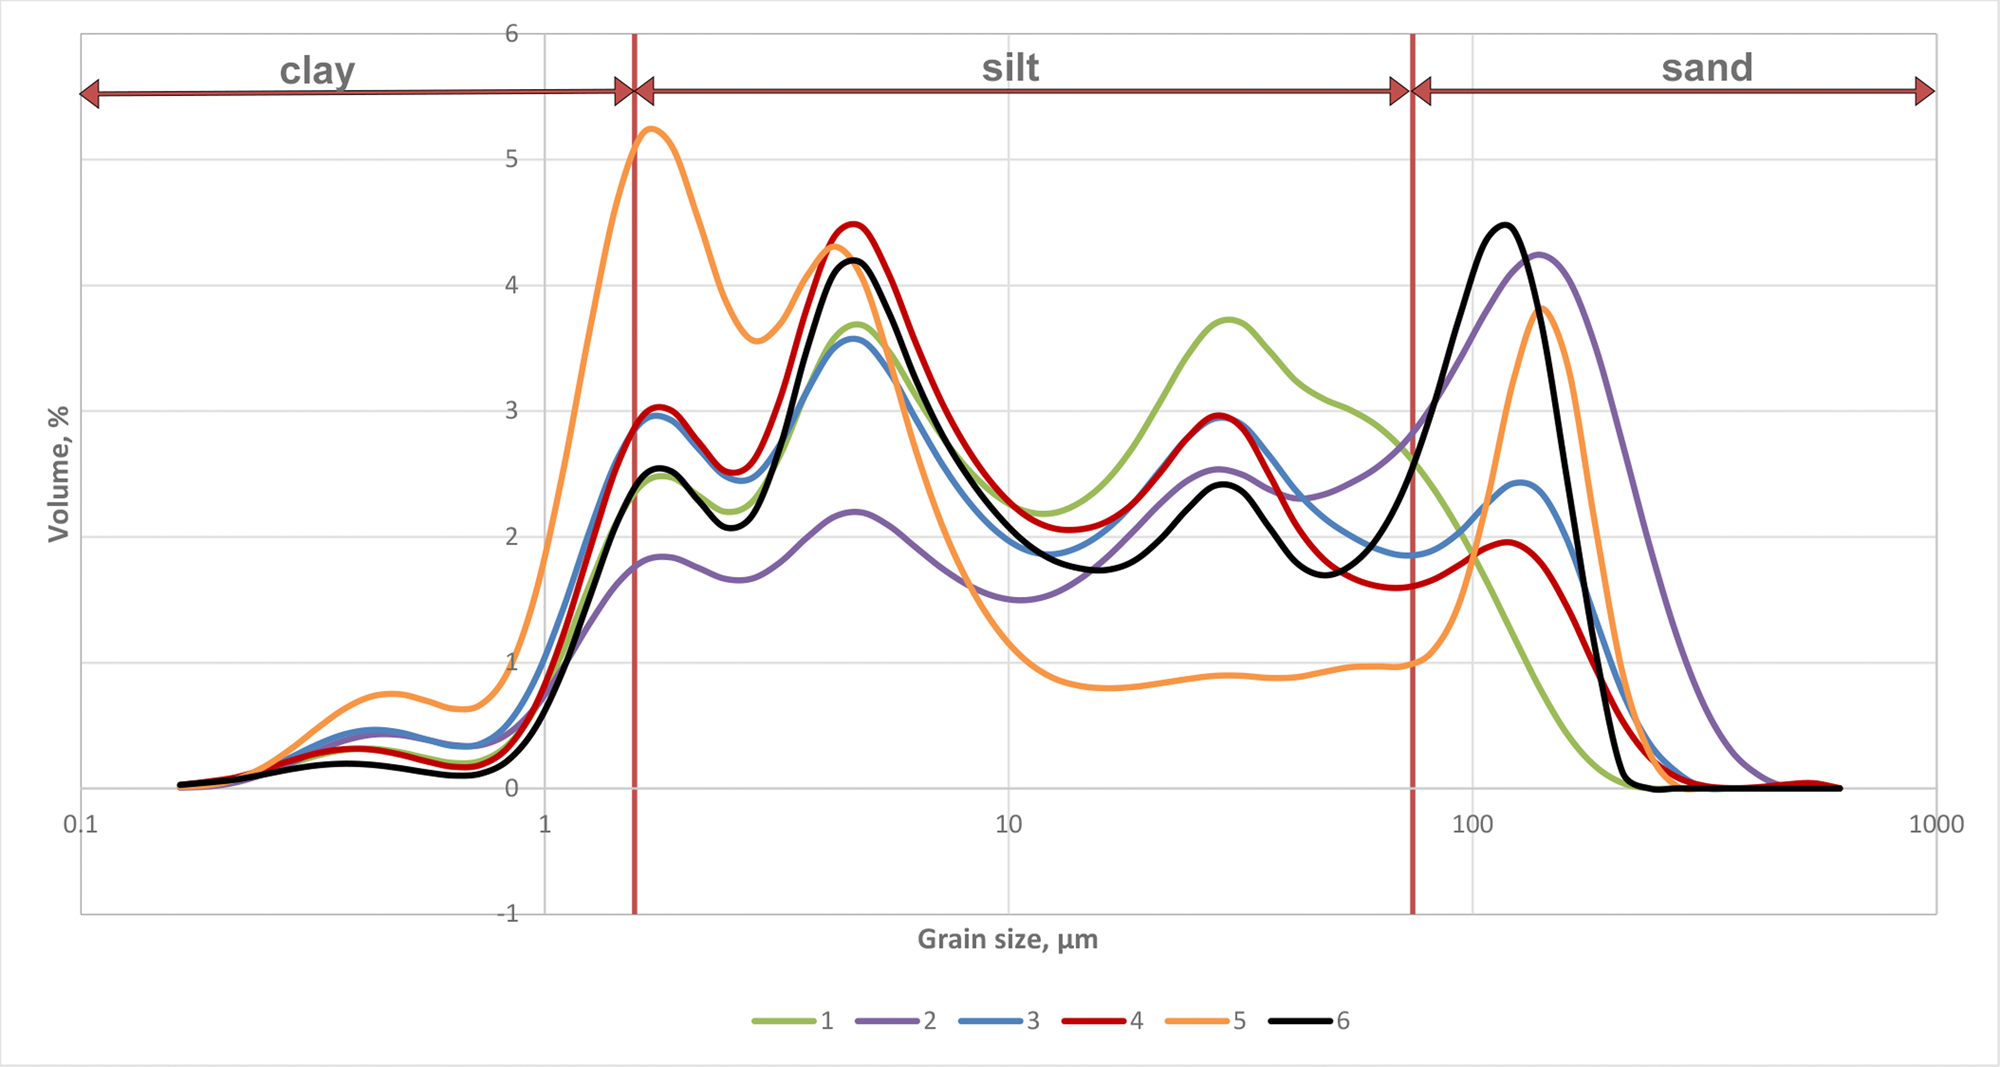
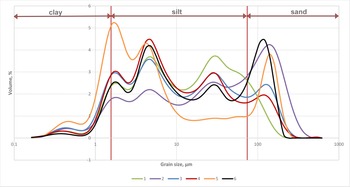
The studied paleosol sequence showed variations in the particle-size distribution, which clearly differentiates each soil/paleosol unit. The first pattern corresponds to the modern soil (Au horizon) with a predominance of the silt fraction (Fig. 7A). The particle-size distribution of the first paleosol, particularly the 2Ah horizon, is characterized by a higher amount of the coarse fractions (coarse silt and sand) (Fig. 7B). The 3EBgk and 3BCtx horizons (first gray tepetate) have a similar pattern (Fig. 7C) to that observed in the modern soil (Fig. 7A), but here the amount of sand is higher. The vertic paleosol horizons (4ABi and 4Bti horizons) have a higher proportion of clay and the highest content of the fine sand fraction (Fig. 7D). The second level of the tepetate (5BCtx horizon) shows a bimodal distribution, where sand and fine silt-clay fractions are more abundant (Fig. 7E). Similarly, the pattern found in the 6BCtx horizon also has a bimodal distribution, but here the clay content is lower (Fig. 7F).
Six general patterns of the particle-size distribution of the Tlalpan profile. Type 1 corresponds to the Au horizon; type 2 includes AB, 2Ah, 2AB, and 2B horizons; type 3 includes the 3EBgk and the 3BCtx horizons; type 4 corresponds to the 4ABi and 4Bti horizons; type 5 corresponds to the 5BCtx horizon; and type 6 corresponds to the 6BCtx horizon. Texture classes were defined as sand (63<–1000 μm), silt (2<–63 μm), and clay (<2 μm), following the gradation proposed by FAO (2006) guidelines; the horizontal (x) axis is presented in logarithmic scale.
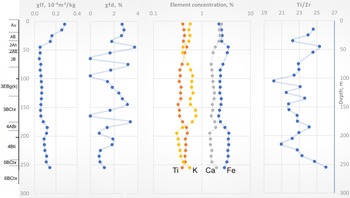
Concerning the magnetic properties, the χlf values are more or less homogeneous in the paleosols horizons, but an enhancement is clearly observed in the modern soil (Fig. 8) although there is not a large amount of superparamagnetic particles (ranging from 2–3%), given by the χfd proportions. In paleosols, χfd values are low in general and exhibit some abrupt variations along the profile, even within a single horizon. The highest χfd values are observed in the 2Ah and 2B horizons, in the transitional zone from 3EBgk horizon to the 3BCtx horizon, and at the 4ABi horizon.
Diagrams of magnetic susceptibility in low (0.47 kHz) frequencies (χlf), frequency-dependent magnetic susceptibility (χfd), distribution of major element (Ca, Fe, K, and Ti) percentages, and geochemical coefficient (Ti/Zr ratio) in the Tlalpan profile. For the diagrams of element distribution, the horizontal (x) axis is presented in logarithmic scale.
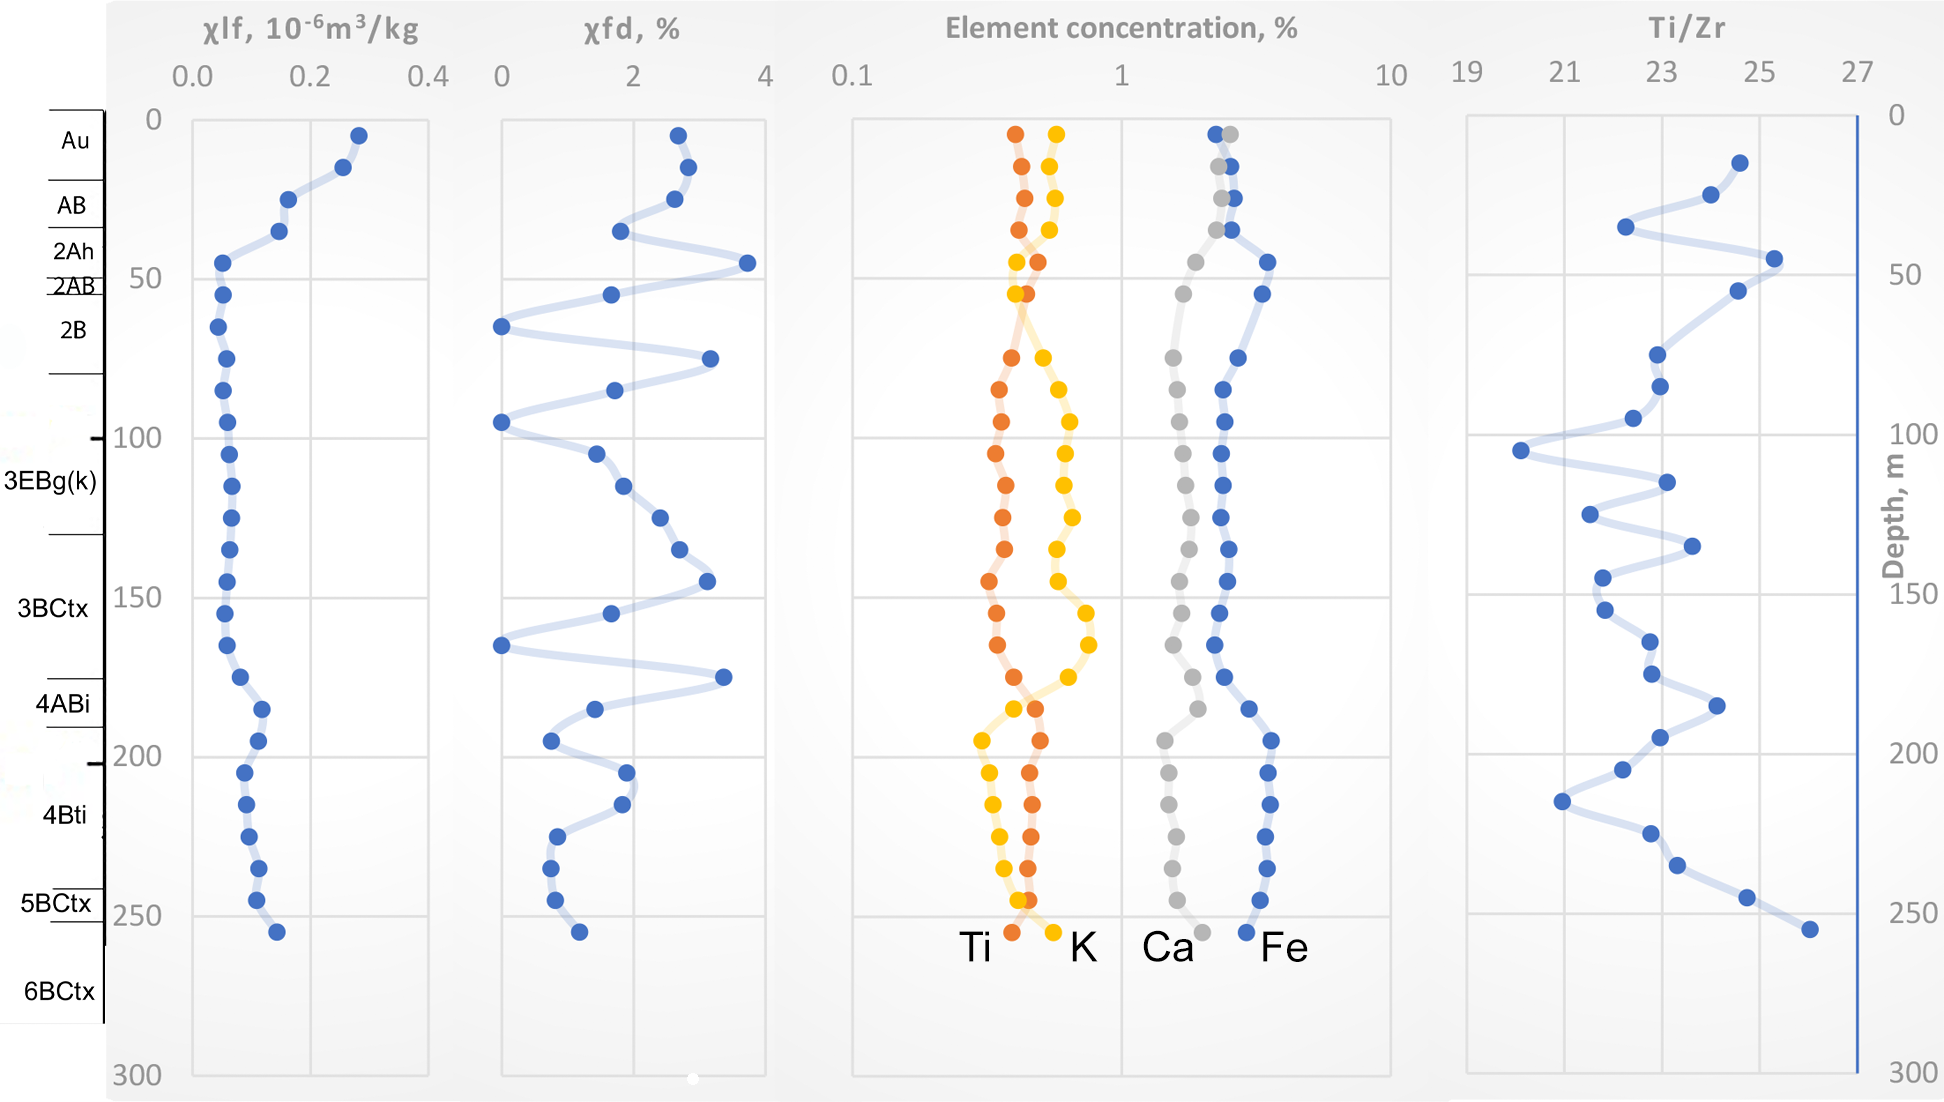
The Fe and Ti distribution shows a similar pattern throughout the profile, with higher concentrations in the 2Ah and in the lowermost 4Bti, 5BCtx, and 6BCtx horizons (Fig. 8). The profile distribution of K is the opposite to that of Ti and Fe, and has minimal and maximal values in opposite points. Calcium has its maximum value in the upper part of the modern soil and gradually decreases with depth, but there is also a small peak at a depth of 185 cm within the 4ABi horizon and in the first brown tepetate. The Ti/Zr rate showed uniformity in the middle part of the profile, from the 3EBgk to the 4Bti horizon. However, the lower and upper part of the profile have higher values, with maxima at Au, 2Ah, and 6BCtx horizons.
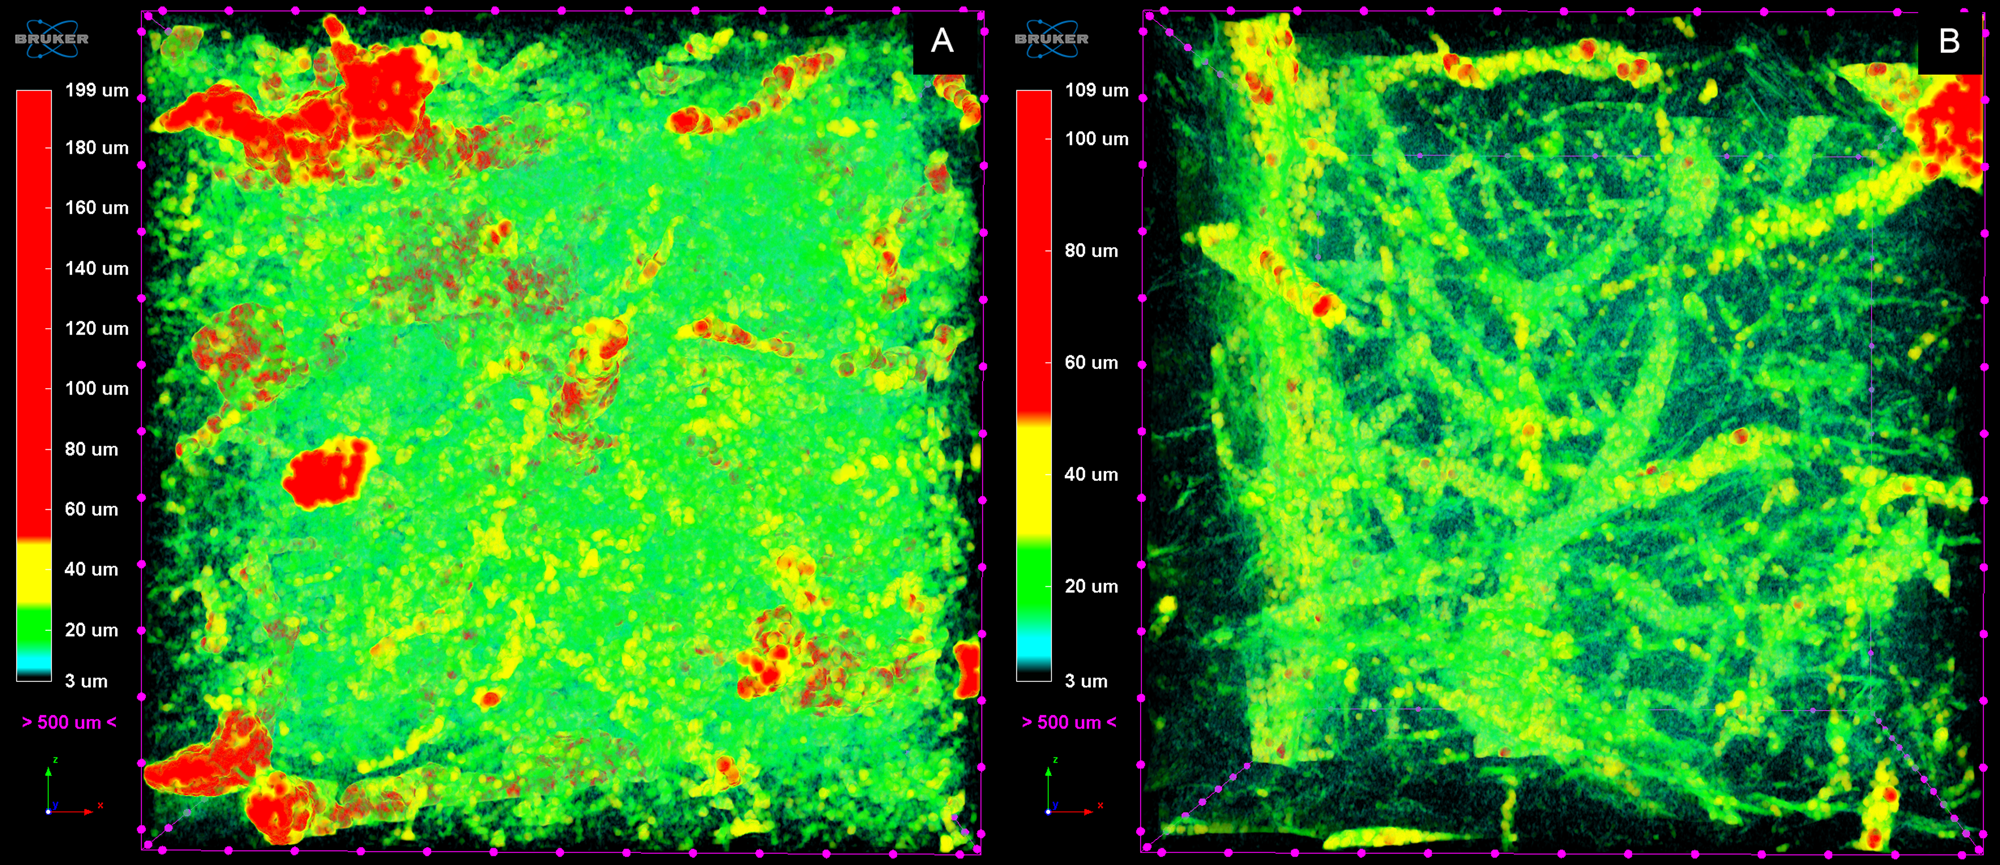
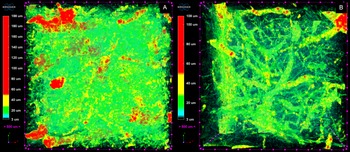
Computed tomography showed differences in the pore distribution of the different horizons (Fig. 9). The topsoil horizon is characterized by large and connected channel biogenic pores. The 3EBgk horizon showed a compact structure and low presence of pore-channels. In the 3BCtx horizon, the pore space is represented by interaggregate and intergrain packing pores, and there are many small vesicular pores homogeneously distributed in all the samples (Fig. 9A). All tepetate horizons are similar in their pore space organization pattern, which is shown in Figure 9A (3BCtx horizon). The 3D image of vertic horizons showed that they are more compact, and their pore space is comprised of planar fissures where slickensides are shown (Fig. 9B, 4ABi horizon).
Pore space distribution from CT of Tlalpan profile horizons. (A) Homogeneous distribution of different pore size types in the 3BCtx tepetate horizon and irregular-shaped pore-channels being filled and separated from each other by illuviated clay (see Fig. 3D, G, H); (B) compact structure of the vertic 4ABi horizon with well-defined slickenside surfaces; large pore-channels are almost absent.
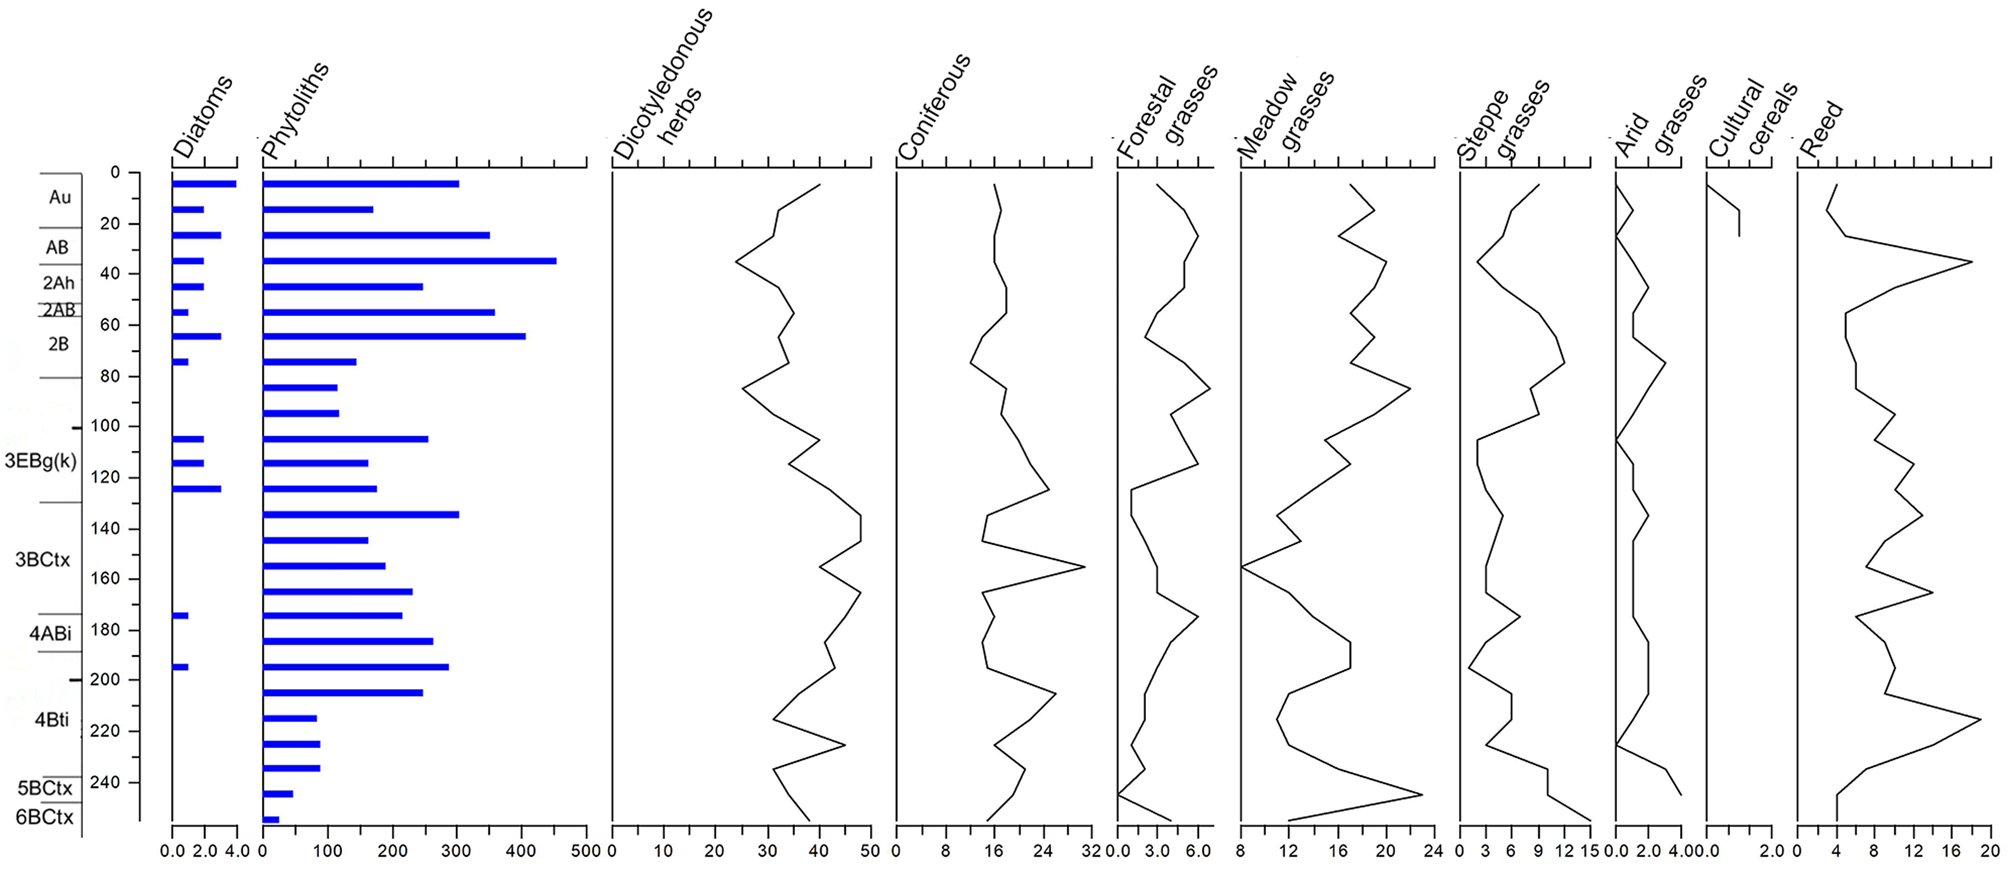
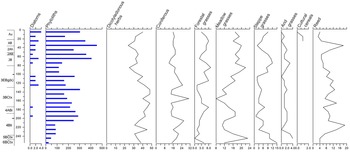
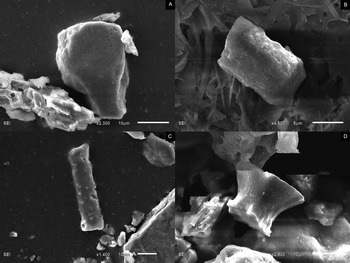
The whole sequence shows a high abundance of phytoliths (Fig. 10), except in the lowermost tepetate layers (5BCxt and 6BCxt) where their quantities decrease. Unexpectedly, in the upper tepetate, 3BCxt, phytoliths are as abundant as in the underlying and overlying paleosol horizons. The distribution of the main botanical groups in general shows irregular variations of a relatively low amplitude. However, the following tendencies could be clearly identified: (1) forms typical for cereals related to agricultural land use were detected only in the uppermost Ah horizon; (2) conifers were only slightly increased in the 3EBgk–3BCtx horizons; and (3) meadow grasses, in contrast, were more abundant in the 2Ah–2AB and 4ABi–4Bti horizons. However, the highest content of meadow grasses was found in the 5BCtx horizon. We were surprised to find in this currently dry and well-drained position some opaline microfossils (phytoliths of reeds and diatom fragments) indicative of hydromorphic conditions or even water bodies. Diatoms tended to increase in the upper part of the sequence. SEM images of some typical forms encountered within the profile are shown in Figure 11.
Distribution of biomorphs in the Tlalpan profile. The vertical scale is profile depth in cm, the horizontal scale for first two columns (diatoms and phytoliths) is total amount and % of total amount for the rest of columns.
SEM micrographs of phytoliths from the Tlalpan profile that originated from (A) reed; (B) coniferous species; (C) dicotyledonous herb; and (D) meadow grass.

Sections at the head of gullies
Head (sections 19 and 20) and eroded slope (section 7) at the Young Barranca
At the topographically highest levels, sections 19 and 20, several stratigraphical differences were detected, in comparison with the Tlalpan section (Fig. 2). In those sections, we also observed the basal brown tepetate (TP1), but not the TG2 (5BCtx), thus the 4Bti horizon rests directly on TP1. However, TG1 was found in two levels: one directly on the surface (TG1-1) and another one (TG1-2) overlying the 4Bti horizon. Between these two tepetate layers, a well-developed paleosol was found, which has redoximorphic features (3Ah–3Btg). A few calcitic concretions were found on the surface of profile 19 and dated by 14C to 4707 ± 136 cal yr BP (Table 1). An additional observation is the occurrence of a depression, that presently is covered with water (Figs. 9, 10), similar to the one of section 20. Here, a gleyed Luvisol (with 4Btg horizon) occurs under the tepetate TG1-1. This Luvisol varies to a Gleysol in the deeper part of the depression, where compact thin laminae (sand alternating with clay) are also observed, which formed most probably in a small pond. The underlying distinctly pronounced dark-colored soil TX2 (Sedov et al., Reference Sedov, Solleiro-Rebolledo, Terhorst, Solé, Werner and Poetsch2009) labeled here as 4Bti, does not appear in section 20 due to the ponding processes and profile transformation. Additionally, the section shows a cultural layer of an ancient settlement that contains numerous flakes and blades of obsidian together with ceramic fragments under the modern colluvium. On the eroded part of the slope (section 7), the described layers of the barrancás head decrease in thickness. In consequence, TP1 is exposed on the surface or covered with a thin layer of colluvium (Fig. 11A). The incised landform of Young Barranca appears as a rill at its uppermost part and then transforms to a 3–5 m deep canyon-like gully.
Incised valley of the Young Barranca (sections 8, 11)
The uppermost part of the sequence in the incised valley of the Young Barranca is composed of colluvial deposits that cover a dark-colored soil (2Ah). The age of this soil, sampled in section 8, is 7153 ± 124 cal yr ВР (Table 1). Alluvial and colluvial deposits fill the paleo-gully, which cuts through all the inclined layers of the Brown Unit of Pleistocene age (Sedov et al., Reference Sedov, Solleiro-Rebolledo, Terhorst, Solé, Werner and Poetsch2009). They are complex in structure and occur discordantly relative to the present-day surface. The erosional paleo-landform (paleo-gully) is also filled with brown and grayish-brown, horizontally stratified pedosediments (Fig. 2). The stratification is clear and shows an alternation of layers of compact (“tepetized”) loams and of loose brownish loam and horizons of soils. A buried soil (2Ah) that is interlayered with the sediments filling the paleo-gully can be recognized in section 11 (Fig. 11A), overlain by TG1-3 and a colluvium. This soil is less developed in comparison to the older soils, although it has some characteristics of the previously formed Luvisols (blocky structure, grayish-brown colors).
Sequences of the terraces and gully floors
In the Concepción Barranca (Fig. 4), the tepetate surface is mostly inclined at an angle of 3–5° to 7–10°. Section 5, at the head of the Concepción Barranca, is close to the confluence of several gullies and intersects a small remnant of a former gully floor, which at present is a terrace. Section 5 displays the thickest and most complete Holocene soil and tepetate series overlying the eroded surface. The soil-tepetate series consists of four paleosols separated by tepetates (labeled here as TG0-1, TG0-2, and TB Tepetate of White color). In the lower part of the series, the best preserved and developed Luvisol appears, with the following horizons: 5E–5Btk–5Btg. The paleosol is overlain by a light-colored tepetate TB composed of pyroclastic material and redeposited soil material. The higher levels are comprised of paleosols, with only the following horizons detected (from the bottom to the top of the series): 4Bt, TG0-3, 3ABt, TG0-2, 2ABt, TG0-1, AB, Ah. The series ends with accumulation of weakly humified, undifferentiated deposits, separated by a more compact tepetate layer (Tep 1) composed of humified pedosediments that include pyroclastic and organic materials. Practically all the tepetates were affected by the soil-forming processes, including clay and humus illuviation (ТG0-2 in particular), as well as probably gleization in the lower part of the profile (ТG0-1) and carbonate accumulation (ТG0-2 and ТG0-3).
Section 12 (Fig. 4), situated in the lower part of the Tlalpan Barranca downstream of the Young Barranca mouth (Fig. 1), exposes three layered, gray colluvial deposits overlying a dark-colored paleosol (2Ah). In section 13а (Fig. 4) in the Tlalpan Barranca, the Holocene colluvial deposits occur as a continuous three-layered mantle. At TG1-3, a fossil bone was found, the collagen of which was dated at 9163 ± 147cal yr ВР (Table 1). In section 28, situated lower down the slope, colluvial sediments are also present, where brown and gray layers are intercalated. In between the colluvial sediments, a gray-colored tepetate is observed, which corresponds to the upper Gray tepetate of the Tlalpan profile (TG1).
At the middle part of the Concepcion Barranca, there are three alluvial layers exposed in a fresh scarp cut into the former floor of the Concepcion Barranca (section 30) (Figs. 3B, 4). The sequence is ~5 m thick and has similarities with section 13а. It also includes three layers distinguishable by color: the lower one (M0-2), ~1 m thick, is brownish yellow; the middle layer (M0-1) (~2 m thick) is grayish yellow; and the upper one, ~2 m thick altogether, begins with a dark-gray humus interlayer that is 0.2–0.3 m thick (MS). At the lower part of a slope in the Concepcion Barranca, section 31 (Fig. 4), near a sharp bend of this gully, several terrace deposits were found. Samples for radiocarbon dating were taken from the depths of 3.5 m (tepetate TG0-8) and 4.0 m (loose material of a redeposited 2Ah horizon).
Chronology of the studied profiles
The chronological framework obtained for this study comes from a set of radiocarbon dates (summarized in Table 1). At the head of the Young Barranca (section 19), the 3Ah horizon organic matter of the paleosol in between the two tepetate layers, has a date of 16,068 ± 222 cal yr BP (Fig. 9). The TG1-1 layer, in section 20, has an age of 14,576 ± 349 cal yr BP, while the calcitic concretion dated to 4707 ± 136 cal yr BP (Table 1). The age of the dark-colored soil (2Ah) of section 8 is 7153 ± 124 cal yr ВP, while the ages of TG1-3 (within the paleo-gully of section 11) and of the paleosol (2Ah) below it are 9198 ± 139 cal yr BP and 9012 ± 187 cal yr BP, respectively (Table 1).
In section 5, the following ages were obtained: ТG 1-1 1995 ± 104 cal yr ВР; 2ABt 3367 ± 83 cal yr BP; TG0-3 4866 ± 121 cal yr ВР. The deposits filling the paleo-gully in section 12 dated by 14C at 9012 ± 187 cal yr ВР. At the boundary between layers 2 and 3 of section 13a, a fossil bone was found, whose collagen was dated at 9012 ± 187 cal yr ВР (Table 1). In section 28, a charcoal sample taken at a depth of 2.4 m gave a 14C age of 16,438 ± 165 cal yr BP (Table 1). Finally, at section 31, the results showed an inversion of 14C ages: 7684 ± 87 cal yr ВР for tepetate and 6385 ± 134 cal yr ВР for the redeposited Ah horizon.
DISCUSSION
Sequences of soil/tepetate/colluvium strata and cyclicity of events of landscape development
Various combinations of pedogenesis, deposition, and denudation processes result in a complex soil-depositional series—representing a kind of record of past process interactions and terrestrial environment evolution (Glazovskaya, Reference Glazovskaya1996). The paleosols and other deposits with different origins were found to appear repeatedly in the studied sections and to form certain combinations known as cyclites. The recorded cyclic changes are related to variations in environments and reflect rhythms of various duration that were mostly controlled by climate changes. Each of the cyclite constituents corresponds to a certain ecological phase of the rhythm. Among the studied cyclites in the sequences, the combinations discussed below were identified.
1. Soil–tepetate
Soil–tepetate is the most typical combination that represents two kinds of environmental conditions: one favorable for soil and vegetation development (warm and humid phase marked by soil formation) and another unfavorable, when a tepetate develops. Specifically, the sequence is as follows: the soil forms first, then the overlying tepetate develops above the soil from its own pedosediment. This is supported by the recorded inversion of dates and by phytolith analysis of the ‘soil–tepetate’ sequence of the Tlalpan profile. The radiocarbon age of tepetate is somewhat greater than that of the underlying soils, which suggests that the tepetate was formed immediately after the soil formation (as a result of a destabilization of the relief-forming processes and deterioration of environments), so the soil and tepetate might be related to the two opposite phases of the same rhythm.
No chronological inversion has been recorded in the radiocarbon ages of the dark paleosol (ca. 16 ka BP) and the overlying tepetate (ca. 14.5 ka BP) described in sections 19 and 20. Besides, the considerable difference in their ages—ca. 1000 years—suggests that the horizons not only developed in different phases of a single rhythm, but most probably belonged to different rhythms. The tepetate could be formed of pedosediment of a paleosol younger than 16 ka BP.
2. Colluvium–tepetate
Cyclites of this type show a prevalence of sedimentation over soil formation and alternating faster and slower processes of the relief formation. Such cyclites, dated to the Holocene, occur in the lower reaches of the gullies Tlalpan and Concepcion (see section 31). There is a notable inversion of radiocarbon dates documented in the section 31, which exposed the sequence in the Concepcion Barranca terrace (the tepetate overlying the sequence is dated to 7684 cal yr BP, while the age of the underlying colluvium is 6385 cal yr BP), giving grounds to assigning them to different rhythms. Inversion of the radiocarbon dates is rather a typical phenomenon for the alluvial and colluvial paleosol-sedimentary sequences in Central Mexico, as demonstrated in multiple profiles of the Teotihuacan Valley (McClung et al., Reference McClung de Tapia, Domínguez-Rubio, Gama-Castro, Solleiro-Rebolledo and Sedov2005). The main reason for date inversion is large-scale redeposition of humus of pre-existing soils due to erosion and its incorporation in more recent pedosediments.
3. Colluvium–soil
Such an order of layers is typical of sediments filling paleo-channels and suggests an alternation of accelerated erosion phases and short-term episodes of soil formation. In such cases, the soils are rather immature, while the colluvial series are thick and display a complicated stratified composition.
4. Colluvium–soil–tepetate.
Such a combination is also typical of sediments filling older erosional landforms. While the colluvium was deposited by rapid flows and served as a parent material for the soil, the tepetate is formed by slower lahar flows that include eroded soil, which buried the soils in lower positions. There may be thin soils and tepetate found in colluvial series that correspond to short-term rhythms.
Main stages of landscape evolution since MIS3: paleopedological record of the Tlalpan key profile
The Tlalpan key profile holds information regarding several of the main stages of environmental changes in Central Mexico. In comparison with previous investigations (Sedov et al., Reference Sedov, Solleiro-Rebolledo, Terhorst, Solé, Werner and Poetsch2009; Solís-Castillo et al., Reference Solís-Castillo, Solleiro-Rebolledo, Sedov and Salcido-Berkovich2012), in this paper we analyzed not only the memory from the soil horizons, but also the memory contained within the tepetate horizons. We consider tepetates as pedosediment layers that indicate unstable and changeable landscapes. The presence of such tepetates means that soil formation had been interrupted by a short-term sedimentation process.
Based on the morphological descriptions and analyses (Figs. 6–11), we distinguished six paleosol-sedimentary units that reflect periods of soil formation interrupted by depositional events. At the bottom of the sequence, we observed the TP (Brown tepetate) layer, which was named as the 6BCtx horizon. This tepetate shows signs of strong clay illuviation, which is associated with a period of humid climate. After that, pedogenesis was interrupted by catastrophic events, which caused erosion of the complete soil profile (except for its lower layer, the 6BCtx horizon). Then there is evidence of sedimentation with the occurrence of the Gray tepetate (TG1), and the formation of the 5BCtx horizon, under similar conditions as during the previous stage. The next cycle resulted in formation of a well-developed Vertisol (4ABi–4Bti) with ancient clay coatings that are superimposed by slickenside formation and with strong humus accumulation (Figs. 5, 6, 9). We suggest warm and humid conditions for the beginning of this soil development, and then a change to a contrasting seasonal climate with wetting/drying cycles. Consistently, phytoliths provided evidence for the presence of meadow grasses (Fig. 10). Soil development is intensive, as evinced by strong weathering of primary minerals with lower values of K and higher percentages of Ti and Fe (Fig. 8), as well as by an increased contribution of ultrafine magnetic particles, indicated by the high χfd values (Fig. 8). Ortega-Guerrero et al. (Reference Ortega-Guerrero, Sedov, Solleiro-Rebolledo and Soler2004) considered that these superparamagnetic particles formed by pedogenesis in the volcanic paleosols of Tlaxcala. Pedogenesis of this unit had been interrupted by deposition of the next lithologic group, which includes the upper Gray tepetate (i.e., the 3BCtx horizon). Pore shapes and distribution that were studied in detail with the use of computed tomography and micromophological methods (Pogosyan et al., Reference Pogosyan, Gastelum, Prado, Marquez, Abrosimov, Romanenko and Sedov2019) showed that consolidation of the tepetate horizon occurred before clay illuviation. The quantity of phytoliths is very low in 5BCtx and 6BCtx tepetates, but they were abundant in 3BCtx tepetate, showing a decreasing tendency compared to the amount in the Vertisol horizons (Fig. 10). At the same time, the morphological properties of all three tepetates are very similar. We consider the phytoliths found in 3BCtx to be inherited (as was suggested by Sedov, Reference Sedov2015) from the Vertisol. The latter was eroded from higher positions of the landscape during a phase of geomorphological instability, and therefore the tepetate 3BCtx is interpreted as a pedosediment of this Vertisol. Low variability of Ti/Zr ratio in the middle part of the profile (from 3EBgk to 4Bti) supports the idea of pedosedimentary origin of tepetate. Therefore, we suggest that some of the fragipan type tepetates were formed from redeposited soil material with admixture of fresh volcanic sediment transported by lahars or volcanic mudflows. These results are similar to those previously reported by Solleiro-Rebolledo et al. (Reference Solleiro-Rebolledo, Sedov, Gama-Castro, Flores-Román and Escamilla-Sarabia2003) who considered tepetate horizons as pedosediments developed as a result of soil erosion and redeposition associated with volcanic eruptions and extreme climatic events and compacted by hydroconsolidation processes. This interpretation explains the primary compaction of fragipan type tepetates. Concerning soil development after the tepetate consolidation, we detected two main processes: clay illuviation (with thick clay illuvial coatings in the 3BCtx horizon) and surface redoximorphic (Stagnic) processes (with the accumulation of stagnic iron nodules in the 3EBgk horizon as well as of diatoms at the top of the 3BCtx horizon). It is probable that water stagnation is caused by the presence of the low permeability tepetate. These main processes responsible for profile differentiation are accompanied by moderate weathering of primary minerals. We assume that conditions were wet but cool during this stage of pedogenesis. Regarding the carbonate nodules observed in this soil, as was mentioned by Sedov et al. (Reference Sedov, Solleiro-Rebolledo, Terhorst, Solé, Werner and Poetsch2009), the carbonate nodules found here have a much younger age and do not correspond to the third paleosol formation.
The next lithological group confirmed by texture analysis and the Ti/Zr ratio refers to the upper paleosol, which is represented by the 2Ah, 2AB, and 2B horizons. From the morphological observations, it is evident that this soil had a strong humus accumulation and, at the micromorphological level, incipient slickenside formation. The paleosol is relatively low in K content and rich in ultrafine magnetic minerals, considered as a sign of strong weathering and pedogenesis in seasonal semi-arid climate, so the soil developed vertic properties. The last stage of pedogenesis occurs in the upper, modern soil. The soil cover is thin, and despite the presence of biogenic pores shown by computed tomography, the soil is not as rich in organic material as the underlying paleosol. We explain such a poor development of this soil by long-term human-induced erosion. Remains of this anthropogenic activity are distributed on the soil surface in the form of ceramic and stone fragments, as well as obsidian flakes. Heine (Reference Heine2003) has documented several erosional phases for the last 3500 years and assumed this was a human-induced process. The enhancement of magnetic susceptibility observed in this layer (Fig. 6) may also result from the charred material produced by human activities. Additionally, the carbonate nodules found in the 3EBgk horizon correspond to this recent stage of pedogenesis, as evinced by their young radiocarbon age of 1.3 ka (Sedov et al., Reference Sedov, Solleiro-Rebolledo, Terhorst, Solé, Werner and Poetsch2009). These calcitic pedofeatures may be related to a drier climate established in the late Holocene. This tendency towards aridification in Central Mexico during the last millennia was documented by some lacustrine records (Metcalfe et al., Reference Metcalfe, O'Hara, Caballero and Davies2000). However, we should also take into account that the age of the carbonates coincides with the maximum of landscape transformation by humans during the Classic period. Could anthropogenic processes influence carbonate neoformation? Cultivation, enhanced runoff, and decreased water-holding capacity of the degraded soil should produce a drier soil environment, reduced leaching, and thus better conditions for carbonate precipitation. It was shown that long-term cultivation could change the carbonate status of soils, increasing the amount of secondary carbonates, as well as shifting the upper boundary of the Calcic horizon closer to the surface (Kuznetsova et al., 2013).
We further speculate that the six stages described in the Tlalpan profile development are related to the specific environmental evolution during the late Quaternary, as described below. Until now, there have been no data on the ages of both lower tepetate layers (TG2 and TP: 5BCtx and 6BCtx horizons, respectively). However, the age of the fourth stage, which corresponds to a paleo-Vertisol (4ABi–4Bti), named as TX2, ranges from 30.19–51.80 ka (Sedov et al., Reference Sedov, Solleiro-Rebolledo, Terhorst, Solé, Werner and Poetsch2009). Therefore, this soil is related to MIS 3. The next paleosol (Stagnic Luvisol), which includes the upper Gray tepetate (TP1–3BCtx horizon) correlates with TX1b paleosol from the Mamut section, which also contains iron nodules. This paleosol was developed during a colder climate, most probably during MIS 2 (Sedov et al., Reference Sedov, Solleiro-Rebolledo, Terhorst, Solé, Werner and Poetsch2009; Solís-Castillo et al., Reference Solís-Castillo, Solleiro-Rebolledo, Sedov and Salcido-Berkovich2012). It also coincides with data published by Metcalfe at al. (2000), who suggest cool and wet conditions for the same time period. At the end of MIS 2, a dynamic landscape development was recorded by the presence of 16,068 ± 222 cal yr BP-tepetate found in slope sections of the Young Barranca (Fig. 12). The formation of stagnic Luvisol was interrupted and the paleosol was buried by the sediments, which later became parent materials of the youngest paleosol of the Tlalpan section. That paleosol was most probably formed during the early to middle Holocene, and correlates to paleosols/pedosediments and alluvial-colluvial sediments found in the eroded slope (section 8), the incised valley, and the terrace of the studied barrancas, whose ages range from 9–3 ka (Table 1, Fig. 12). The modern soil with evidence of a long human occupation was formed during the late Holocene under a dry climate and with anthropogenically induced erosion. This soil corresponds to the soil from slope sections of the age of 2 ka.
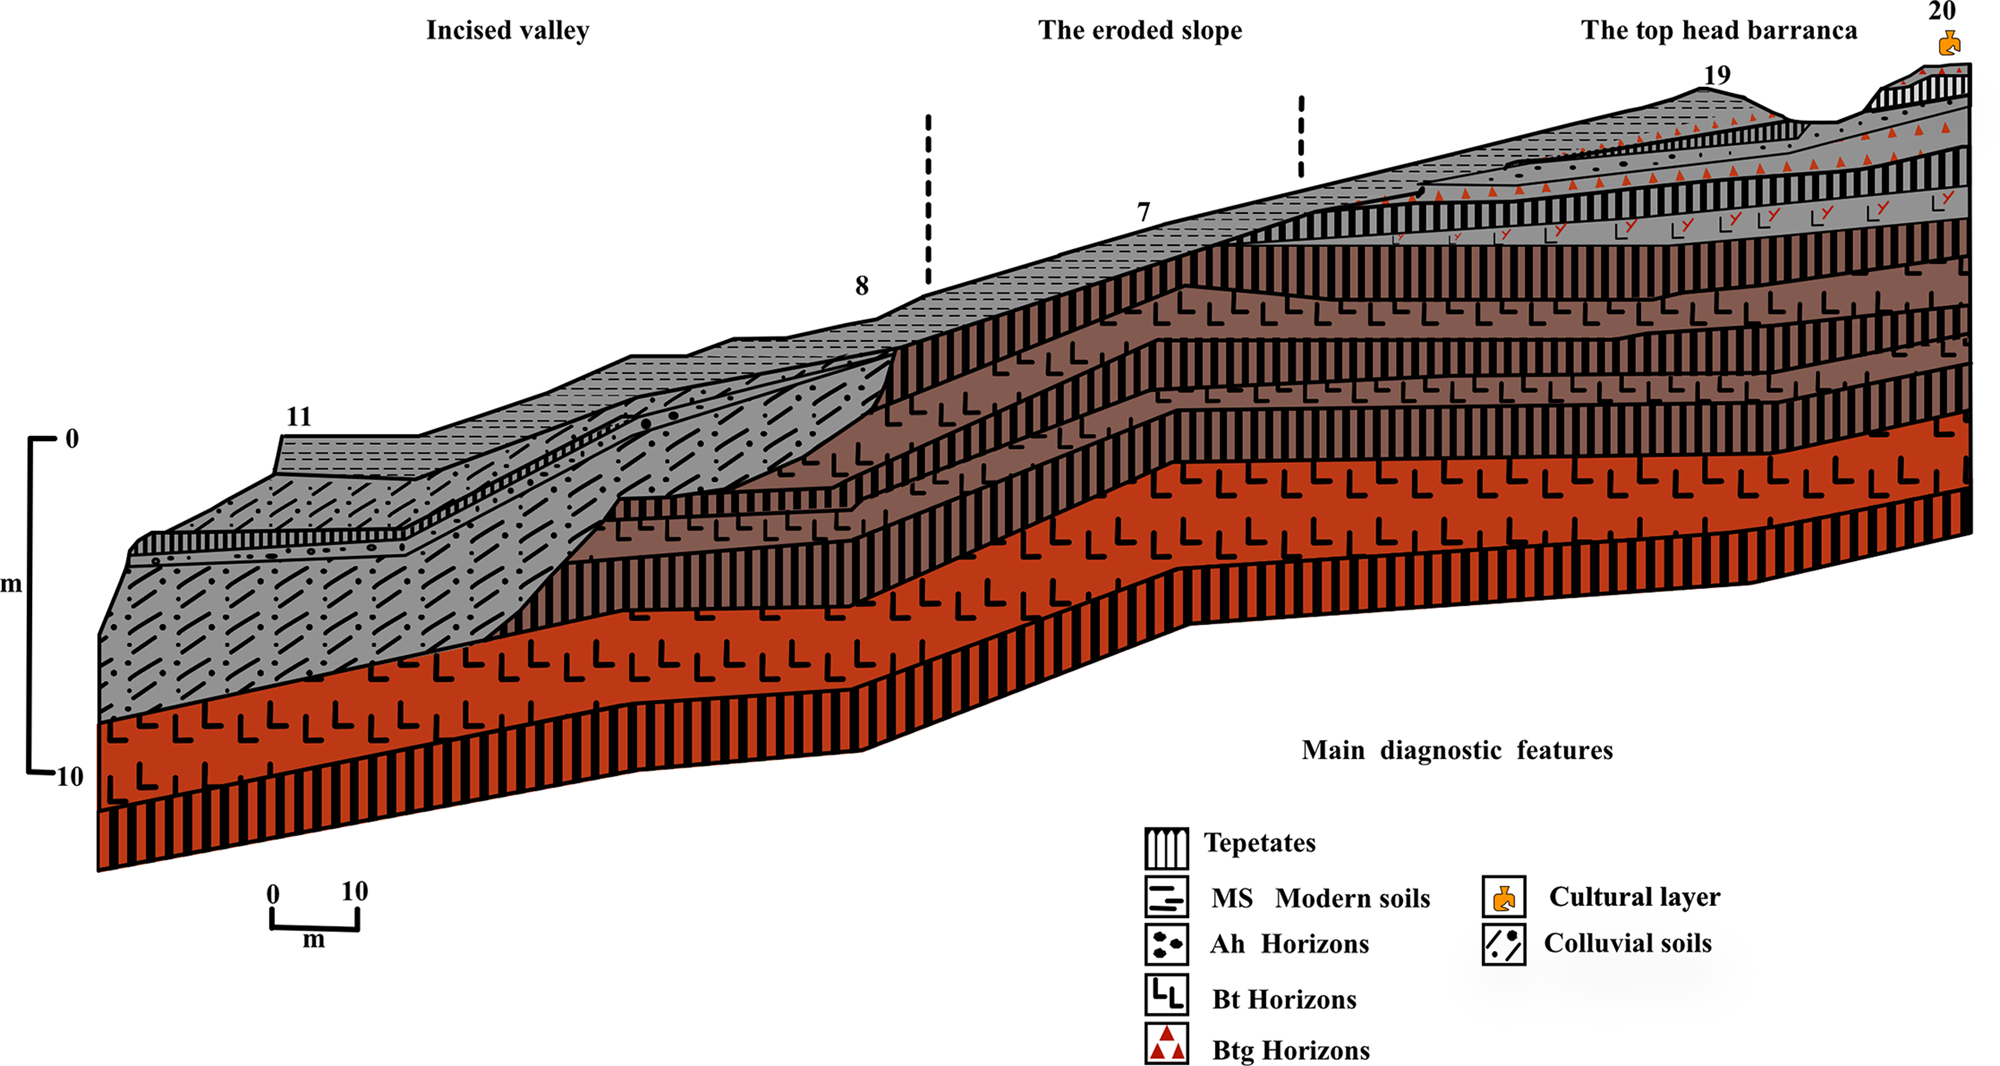
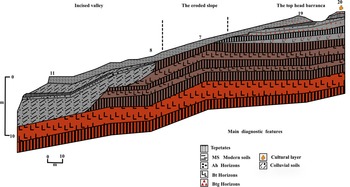
Geomorphological scheme of correlation of main stratigraphic layers of the Tlalpan profile and the profiles of Young Gully (7, 8, 11, 19, 20). Red, brown, and gray colors correspond to the main units described by Sedov et al. (Reference Sedov, Solleiro-Rebolledo, Terhorst, Solé, Werner and Poetsch2009).
Detailed soil-sedimentary records for the Late Pleistocene and Holocene in slope sections and correlation of the sections
The record of landscape evolution in this study was not only established from the Tlalpan profile, which is located at the highest relief position, but also from the slope sequences. This approach allowed us to access more-detailed records (i.e., a higher time-scale resolution), with more stages of formation being detected. The paleosol samples reveal their approximate ages near their burial times. In the case of colluvial sediments, the obtained ages should be interpreted cautiously because they can incorporate old materials. Therefore, the radiocarbon ages may not coincide with the time of sedimentation.
In the small paleo-depressions, there are indicators of pedogenesis-sedimentation processes. Section 20 (Figs. 2, 13) allows us to suggest the following process of pond formation: (1) formation of the dark-colored paleosol (Luvisol) TX2–4Bti; (2) erosion of the surface and development of a depression; (3) flooding of the depression and small lake formation, marked by accumulation of stratified sediments; (4) lake shallowing and drying-up; (5) sedimentation and tepetate development; (6) sedimentation, soil formation with the formation of the pedogenic carbonates (dated to 4707 ± 136 cal yr BP); and (7) erosion. The age of this tepetate is 14,576 ± 349 cal yr ВР, therefore it is most probably an equivalent of the upper Gray tepetate from the Tlalpan section (3BCtx horizon).
The cultural layer of section 19 documents an erosional stage in which the soil material is eroded leaving the artifacts on the surface of the Gray Unit tepetate. The abundance of artifacts suggests that this is a site of a large ancient settlement that was occupied by people over a long period and could not have existed without a permanent water source. Because there was not a permanent stream at the site, the local population could have used one of the small lakes. It is worth noting that such impoundments, some of them being sustained by earthen dams, still may be found in villages in the region. The ages of small lakes could vary from the late Glacial to the Late Holocene.
We suggest that the base of the oldest erosional landform (i.e., the beginning of the gully incision) was formed at the end of the Pleistocene. This suggestion is confirmed by the age (14,576 ± 349 cal yr BP) of the tepetate layer cut by the incision. In addition to this evidence, the age of a bone fragment found in the alluvial-colluvial deposits in section 28 is 16,438 ± 165 cal yr ВР. This bone was transported downslope at the time of paleo-gully initiation.
Therefore, we assume that the deep downcutting of the gully occurred at the final stage of the last (Wisconsinan) glaciation. Deposition proceeded at maximal rates during the first stage of the paleo-depression filling. Two intervals of reduced erosion were identified in the development of two levels of paleosols, differing in age, separating alluvial-colluvial layers. The upper paleosol was dated in the Young Barranca by radiocarbon at 9012 ± 187 cal yr ВР (Table 1). This paleosol is buried under a tepetate of approximately the same age (9198 ± 139 cal yr BP), so we suggest a continuous sequence of events: soil formation, followed by soil burial under the tepetate formed of redeposited pedosediment of the same soil from the upper locations. Most probably, the soil burial was a result of environmental deterioration. The second soil is 14C dated to 7153 ± 124 cal yr ВР. Possibly, the deposition rate decreased in the Middle Holocene.
The well-developed Luvisol found in section 5 (5E–5Btk–5Btg) was formed under mostly coniferous forest ecosystems over a long time, as seen from its mature, well-differentiated profile. Burial of the Luvisol could be a consequence of deforestation and subsequent erosion resulting from a volcanic eruption or a drought (the pyroclastic material detected in the overlying tepetate [Tep 4] favors the hypothesis about volcanic activity). We have no unambiguous evidence indicative of the soil age. The rest of the sequence, documented by the ages of the tepetates (Tep 3 to Tep 1), was formed during the Middle–Late Holocene, when the area was densely occupied by humans (Heine, Reference Heine2003; Borejsza et al., Reference Borejsza, Rodríguez-López, Frederick and Bateman2008, Borejsza and Frederick, Reference Borejsza and Frederick2010).
The present-day Young and Concepcion barrancas follow older valleys filled with brown alluvial-colluvial deposits overlain with well-developed paleosols, one of which was dated by radiocarbon at 9012 ± 187 cal yr ВР in the Young Barranca. Downcutting processes and gully growth were particularly active at the time of gully initiation and the formation of the paleo-ravine bed. Filling of the erosional landform initially proceeded at a high rate. The lower layer of the brown colluvium M3 occasionally includes thin tepetate units and immature paleosols. Later, the erosion processes became less active, a rather well-developed soil formed on the colluvium (9012 ± 187 cal yr ВР) and was soon buried under the tepetate with well-defined polygonal structure composed of cemented pedosediment of approximately the same age. After that, deposition of colluvium continued until a new phase of soil formation that occurred ca. 7684 ± 87 cal yr BP.
Correlation of landscape evolution records for the Holocene and the Late Pleistocene in Central Mexico and other regions
Correlation of the key profile Tlalpan formation with the main environmental changes has been suggested previously by Sedov et al. (Reference Sedov, Solleiro-Rebolledo, Terhorst, Solé, Werner and Poetsch2009) and supported with new details presented in this paper. Below, we provide the correlation for the slope section profiles, as a proxy of higher resolution records of Holocene and Late Pleistocene conditions.
The oldest colluvial sediments and paleosols, documented in the studied sections of gully slopes and bottom, are dated to an age of >16 ka, which means there was a period of stability when the bottom paleosols were developed. According to Sedov et al. (Reference Sedov, Solleiro-Rebolledo, Terhorst, Solé, Werner and Poetsch2009), these paleosols are: TX2 (4Bti) formed during the MIS 3, and TX1a and TX1b developed during MIS 2 (the youngest age for this unit is ca. 20,000 cal yr BP). Comparison of the “soil memory” of these paleosols with the lacustrine records shows clear similarities in addition to considerable discrepancies of the paleoclimatic signals for certain periods, as was discussed already by Sedov et al. (Reference Sedov, Solleiro-Rebolledo, Terhorst, Solé, Werner and Poetsch2009). Reconstructions for the MIS3 climate match up quite well: for example, the late Quaternary proxy of drought and fire frequencies obtained from Lake Chalco (Torres-Rodríguez et al., Reference Torres-Rodríguez, Lozano-García, Roy, Ortega, Beramendi-Orosco, Correa-Metrio and Caballero2015) confirmed the tendency towards aridification at the end of MIS3. This tendency is clearly recorded by vertisol development in the 4Bti horizon over the pre-existing Luvisol. However, certain contradictions exist concerning MIS2 paleoecology: some lake cores produced a “cool and dry” signal during the last glacial maximum (Lozano-García et al., Reference Lozano-García and Ortega-Guerrero1998), whereas in the studied sequence, a Stagnic Luvisol 3EBgk–3BCtx corresponding to this interval shows signs of humid pedogenesis. The situation is even more complex when considering that some lacustrine records do not show considerable droughts during MIS2 (Torres-Rodríguez et al., Reference Torres-Rodríguez, Lozano-García, Roy, Ortega, Beramendi-Orosco, Correa-Metrio and Caballero2015). Clearly, more results from different proxies are necessary to solve this contradiction.
The tepetate TG-1 contains fragments of the A horizon of a paleosol that was formed after the erosional activity dated to 16 ka. During the late Glacial (14.70–12.9 ka ВР), the strongest and longest-lasting volcanic eruptions occurred (Mooser, Reference Mooser1967). It was during that interval that gullies were initiated and the oldest erosional landforms developed. Global climate change was also involved in the landscape development processes. Deglaciation of the Laurentide Ice Sheet was responsible for variable intensity discharge of meltwater to the Gulf of Mexico during the Younger Dryas (Marchitto and Wei, Reference Marchitto and Wei1995), which was suggested as a reason for the cold and unfavorable environment for soil formation in Central Mexico (Heine, Reference Heine1994).
Observations of Holocene climate evolution follow the new global Holocene subdivisions scale (Walker et al., Reference Walker, Gibbard, Head, Berkelhammer, Björck, Cheng and Cwynar2019). Significant glacier advances recorded on La Malinche and Nevado de Toluca volcanoes (Palacios et al., Reference Palacios, Stokes, Phillips, Clague, Alcalá-Reygosa, Andrés and Angel2020), ca. 10–8 ka BP, in Mexico correspond to the Greenlandian stage. It is well known that large volcanic eruptions result in climate changes and surface cooling (Timmreck, Reference Timmreck2012). Extremely strong eruptions of Popocatepetl and other volcanoes in the late Glacial and at the beginning of the Holocene caused extensive glaciation, which deposited three moraines on La Malinche and other summits from 10–8 ka ВР (Heine, Reference Heine1988, Reference Heine1994; Vázquez-Selem and Heine, Reference Vázquez-Selem, Heine, Ehlers and Gibbard2004). Glacial influence extended into the early Holocene and contributed to the prolonged existence of cold and wet conditions in Tlaxcala and adjacent regions. Sections 11–13a revealed three 14C dates at 9 ka. One of these ages was obtained for a Luvisol-type paleosol with reductimorphic features, which requires warm and humid climatic conditions and >1 ka for its formation (Miehlich, Reference Miehlich1992; Sedov et al., Reference Sedov, Solleiro-Rebolledo and Gama-Castro2003; Solleiro-Rebolledo et al., Reference Solleiro-Rebolledo, Sedov and Cabadas-Báez2015). The deepest and most active downcutting and channel formation happened from the end of the Pleistocene to the beginning of the Holocene. At first, landform infilling proceeded at a high rate, after which the deposition rate was somewhat lessened and the lower soil of sections 8 and 11 developed (9012 ± 187 cal yr ВР), followed by resumption of erosion. The soil is buried under the tepetate consisting of a cemented pedosediment that is 14C-dated to a similar age (9198 ± 139 cal yr ВР).
The transition from the cold and unstable Greenlandian epoch to the warmer and more stable Northgrippian Stage did not leave any notable evidence in the Tlaxcala paleosol sequence. The younger soil, with some characteristics of Luvisols (in section 8), which was dated to 7 ka, was formed after the 8.2 ka event (probably on the colluvial sediment produced because of this event). After that, accumulation of alluvial-colluvial deposits continued until a new phase of stability and soil formation. The radiocarbon age of the second paleosol (in the deposits filling paleo-channels) is 7153 ± 124 cal yr ВР. The most humus-rich soils, colluvial layers, and tepetate are confined to the middle part and the beginning of the Holocene. That could have been brought about by climate amelioration and less-active processes of sheet and rill erosion on the forested slopes. Our data for the 7 ka paleosol correlate well with pollen assemblages for Central Mexico (Caballero et al., Reference Caballero, Lozano-García, Vazquez-Selem and Ortega2010). Thus, favorable (warm and wet) conditions for soil (Luvisol) formation existed in the upper reaches of gullies at the end of the first half of the Holocene (section 5). Even at that time, during repeated erosion, alluvial-colluvial deposits accumulated and tepetate developed in the lower reaches of gullies (section 31). The interruption of paleosol formation at 6 ka may be related to the fourth Bond cycle (5.9 ka) for the North Atlantic (Bond et al., Reference Bond, Showers, Cheseby, Lotti, Almasi, deMenocal, Priore, Cullen, Hajdas and Bonani1997, Reference Bond, Kromer, Beer, Muscheler, Evans, Showers, Hoffmann, Lotti-Bond, Hajdas and Bonani2001).
Bernal et al. (Reference Bernal, Lachniet, McCulloch, Mortimer, Morales and Cienfuegos2011) suggested that the influence of North Atlantic climatic changes decreased since the beginning of Meghalayan epoch due to the greater importance of the El Niño-Southern Oscillation, which is indicated in the speleothems of southwestern Mexico. Bernal et al. (Reference Bernal, Lachniet, McCulloch, Mortimer, Morales and Cienfuegos2011) proposed that this restricted the advection of humidity from the Caribbean area and provoked drier conditions in southwest Mexico during the end of the Holocene, which means it would have affected Central Mexico as well.
The radiocarbon age of the lower humified tepetate in section 5 is 4866 ± 121 cal yr BP, and the uppermost one is 1995 ± 104 cal yr BP. This leads us to conclude that the overlying alluvial-colluvial series is a result of human-induced erosion, and to date it to the Preclassic period (2500–100 BC). We are of the opinion that the human effects imposed on the arid climate essentially exacerbated the effect of the latter. The ponds surrounded with settlements gradually shallowed and dried up, and the people had to look for better habitat. Soil-forming processes were suppressed by the processes of erosion, deposition, and tepetate formation. Accelerated human-induced erosion developed in at least three stages: (1) formation of eroded sites at the heads of gullies; (2) initiation of gullies within the area of paleo-depressions filled with older deposits; and (3) development of badlands. Formation of gullies presently is proceeding on a large scale. The present-day gullies are a relatively new phenomenon that are largely attributable to the natural trend in the relief evolution superimposed on the human-induced accelerated erosion. In the upper reaches, the present-day gullies are incised into the older soil-tepetate series, and downstream they cut into alluvial-colluvial deposits that accumulated during earlier stages of gully evolution. During the last 2000 years, the principal process was accumulation of syn-sedimentary, poorly sorted colluvial deposits.
Anthropogenic effects in soil erosion during the Late Holocene (ca. the last 3000 years) in the Central Mexican Highlands, and in particular in Tlaxcala, is still a controversial issue. There is a large body of opinion that the agricultural practices of the ancient Mesoamerican civilizations were environmentally friendly and protective, and that intensive soil erosion started only in the colonial period when plowing and cattle breeding were initiated (García-Cook, Reference García-Cook1986). However, Heine (Reference Heine2003) studied colluvial sequences in the downslope and valley bottoms positions in Tlaxcala and showed extensive accumulation of pedosediments prior to colonial time, which indicates strong soil mobilization and redeposition. Borejsza et al. (Reference Borejsza, Rodríguez-López, Frederick and Bateman2008) investigated surface slope sediments in La Laguna in Tlaxcala and documented that intensive soil erosion already was occurring during the Formative period (2000 BC–200 AD), which resulted in exposure of tepetate at the surface. Later, during the Classic (AD 200–700) and Colonial (after 1520s) periods, terraces were constructed on the slopes to control soil loss. We conclude that intensive human-induced colluviation events also have been taking place since the beginning of agriculture at the studied site.
Our results are also in agreement with materials published by Borejsza and Frederick (Reference Borejsza and Frederick2010) who distinguished three differently aged terraces and the modern bottom in the studied gullies of Tlaxcala. The oldest terrace is dated to the late Pleistocene (most probably, MIS 2), the next one formed at the end of Pleistocene–Early Holocene (as suggested by the presence of the Early Holocene hydromorphic humified alluvial deposits at its base), and the young terrace and bottom developed in the Late Holocene.
CONCLUSIONS
This study has shown that tepetate horizons hold a significant record of the landscape evolution and main trends of the Central Mexican Plateau paleoenvironmental history. The combination of topographically higher and lower profiles of the gully range helped us to increase the time-scale resolution for the paleo-environmental reconstruction in the Holocene part of the section.
For the late Pleistocene period, we have found humid and warm conditions for the lowest two tepetate horizons and for the first stage of the formation of a Luvisol, which probably occurred during MIS3. Later, the climate became arid and the same paleosol (4Bti horizon) was modified to a Vertisol. After that, we identified a period of dynamic landscape development, when a tepetate horizon was formed. The tepetate was formed in MIS2 and its soil memory contains two main stages. Because the tepetate was formed from the pedosediment, most probably by a hydroconsolidation process, formation occurred soon after the unstable stage of landscape development (first stage). Subsequent to primary compaction of tepetate, pedogenesis in a humid and warm climate resulted in clay illuviation from the overlying layers. The compactness and impermeability of fragipan type tepetate resulted in strongly illuviated clay accumulation and almost total infilling of pore space in the 3BCtx horizon (second stage). This led to stagnation and formation of Fe-Mn nodules in the overlaying 3EBgk horizon in a cold and humid climate, which is characteristic for the end of the MIS2 stage in general. For the end of the Pleistocene and the transition to the Holocene, we distinguished only two incipient paleosols and only in slope sections, so we assume that the environmental conditions were not favorable for soil formation.
We distinguished a stage of stable environment for paleosol formation at the beginning of the Holocene (9 ka paleosol) in section 11, as well as during the Middle Holocene (6 ka and 5 ka paleosols). These three paleosols were found in slope sections, but most likely are correlated to the youngest paleosol from the Tlalpan section, which we interpret as having formed in a warm, but not humid environment. However, this paleosol formation was interrupted several times, the erosional processes of which left three different records in form of tepetate and colluvium.
The last stage of environmental evolution that we found is related to the soil with a strong anthropic influence. The soil formation recorded drier conditions than those of Middle Holocene environments. The modern soil development is restricted by human-induced erosion.
Acknowledgments
This work has been supported by the Russian Foundation for Basic Research, grant №19-29-05024 and PAPIIT grant IN106616. The research was also supported by the Russian State Task Program № 0148-2016-0003 and by M.V. Lomonosov Moscow State University (State Research Program № 122011800459-3). The authors are grateful to N.N. Kovalyukh and V.V. Skripkin for the radiocarbon dating, which was performed at the Institute of Radiogeochemistry and Environments of the National Academy of Sciences of Ukraine, and to Dr. Beatriz Ortega-Guerrero for her help with the measurement of the magnetic characteristics at the laboratory of Magnetic Susceptibility of the Institute of Geophysics, UNAM, Mexico. We thank Jaime Diaz for help in preparation of the thin sections and correlation schemes, Dr. Andrey Dolgikh for help with radiocarbon data calibration, and Dr. Anna Yudina for help with texture analysis. Lilit Pogosyan and Hermenegildo Barceinas Cruz gratefully acknowledge CONACyT for the PhD scholarship (51849333-2) and a scholarship of researcher's assistant (19134). Authors thank UNAM's Academic Writing Program for important suggestions in improving this manuscript. This manuscript was improved by reviews from Dr. Peter Jacobs, Dr. Lorenzo Vázquez Selem, and an anonymous reviewer.


 Open access