


INTRODUCTION
The southwestern Cape of South Africa is a particularly dynamic region in terms of long-term climate change, as it is situated at the nexus of the three dominant climate systems in southern Africa: the South Atlantic anticyclone, the temperate westerlies, and the tropical easterlies (Tyson, Reference Tyson1986; Taljaard, Reference Taljaard1996; Tyson and Preston-Whyte, Reference Tyson and Preston-Whyte2000; Chase and Meadows, Reference Chase and Meadows2007). While most of the subcontinent experiences summer rainfall as a result of perturbations in the tropical easterlies, the southwestern Cape presently receives the majority of its rainfall during the austral winter, when the southern westerly storm track migrates northward (Tyson, Reference Tyson1986; Taljaard, Reference Taljaard1996; Tyson and Preston-Whyte, Reference Tyson and Preston-Whyte2000). In contrast, during the austral summer, the westerlies and the South Atlantic Anticyclone shift southward limiting the influence of both frontal systems and tropical moisture sources (Tyson and Preston-Whyte, Reference Tyson and Preston-Whyte2000; Reason et al., Reference Reason, Landman and Tennant2006). These spatially distinct precipitation patterns led to the classification of the winter rainfall zone (WRZ) (sensu Chase and Meadows, Reference Chase and Meadows2007; >66% of annual precipitation in winter), the summer rainfall zone (SRZ; >66% of annual precipitation in summer), and a transitional zone of limited seasonality between the WRZ and SRZ, the aseasonal or year-round rainfall zone (ARZ) (Fig. 1).
Map of the southwestern margin of Africa showing seasonality of rainfall and sharp climatic gradients dictated by the zones of summer/tropical (red) and winter/temperate (blue) rainfall dominance. The major oceanic circulation systems (the cold Benguela Current and the warm Agulhas and Angola Currents; temperatures shown in °C; Reynolds et al., Reference Reynolds, Smith, Liu, Chelton, Casey and Schlax2007) are indicated, as well as the position of Pearly Beach (star) in relation to key palaeoclimatic records. 1, Cango Caves (Talma and Vogel, Reference Talma and Vogel1992); 2, Seweweekspoort (Chase et al., Reference Chase, Boom, Carr, Meadows and Reimer2013, Reference Chase, Chevalier, Boom and Carr2017); 3, Katbakkies Pass (Meadows et al., Reference Meadows, Seliane and Chase2010; Chase et al., Reference Chase, Lim, Chevalier, Boom, Carr, Meadows and Reimer2015b); 4, De Rif (Chase et al., Reference Chase, Quick, Meadows, Scott, Thomas and Reimer2011, Reference Chase, Boom, Carr, Carré, Chevalier, Meadows, Pedro, Stager and Reimer2015a; Quick et al., Reference Quick, Chase, Meadows, Scott and Reimer2011; Valsecchi et al., Reference Valsecchi, Chase, Slingsby, Carr, Quick, Meadows, Cheddadi and Reimer2013); 5, Pakhuis Pass (Scott and Woodborne, Reference Scott and Woodborne2007a, Reference Scott and Woodborne2007b; Chase et al., Reference Chase, Boom, Carr, Chevalier, Quick, Verboom and Reimer2019a); 6, Elands Bay Cave (Cowling et al., Reference Cowling, Cartwright, Parkington and Allsopp1999; Parkington et al., Reference Parkington, Cartwright, Cowling, Baxter and Meadows2000); 7, Pella (Lim et al., Reference Lim, Chase, Chevalier and Reimer2016; Chase et al., Reference Chase, Niedermeyer, Boom, Carr, Chevalier, He, Meadows, Ogle and Reimer2019b); 8, Stampriet Aquifer (Stute and Talma, Reference Stute and Talma1998); 9, Zizou (Chase et al., Reference Chase, Niedermeyer, Boom, Carr, Chevalier, He, Meadows, Ogle and Reimer2019b); 10, Spitzkoppe (Chase et al., Reference Chase, Meadows, Scott, Thomas, Marais, Sealy and Reimer2009, 2019b); 11, ODP 1084B (Farmer et al., Reference Farmer, deMenocal and Marchitto2005); 12, GeoB 1023-5 (Kim et al., Reference Kim, Schneider, Mulitza and Müller2003).

The southwestern Cape is also where the warm Agulhas Current and the cold Benguela Current meet and, the region is thus also particularly dynamic from an oceanographic perspective. Both currents are key components of the global ocean “conveyor belt” (thermohaline circulation) (Lutjeharms, Reference Lutjeharms, Wefer, Berger, Siedler and Webb1996; Rahmstorf, Reference Rahmstorf and Elias2006) and therefore contribute not only to climatic variability within the southwestern Cape but also play a role in global climate dynamics (Walker, Reference Walker1990; Walker and Shillington, Reference Walker and Shillington1990; Cohen and Tyson, Reference Cohen and Tyson1995; Reason, Reference Reason2001; Biastoch et al., Reference Biastoch, Boning, Schwarzkopf and Lutjeharms2009; Beal et al., Reference Beal, De Ruijter, Biastoch and Zahn2011).
The climatic setting of the southwestern Cape has played an important part in the development of the vegetation of the Cape Floristic Region (CFR) and is thought to have fostered the region's extraordinary botanical diversity (Goldblatt, Reference Goldblatt1978; Linder et al., Reference Linder, Meadows, Cowling and Cowling1992; Cowling and Lombard, Reference Cowling and Lombard2002; Linder, Reference Linder2005; Bradshaw and Cowling, Reference Bradshaw, Cowling, Allsopp, Colville and Verboom2014; Cowling et al., Reference Cowling, Potts, Bradshaw, Colville, Arianoutsou, Ferrier, Forest, Fyllas, Hopper and Ojeda2015). While long-term climatic stability during the Pliocene and Pleistocene is hypothesised to be one of the key factors for the diversification of the Cape flora (Cowling et al., Reference Cowling, Richardson, Schulze, Hoffman, Midgley, Hilton-Taylor, Cowling, Richardson and Pierce1997, Reference Cowling, Potts, Bradshaw, Colville, Arianoutsou, Ferrier, Forest, Fyllas, Hopper and Ojeda2015; Cowling and Lombard, Reference Cowling and Lombard2002; Linder, Reference Linder2005; Bergh and Cowling, Reference Bergh, Cowling, Allsopp, Colville and Verboom2014), little direct evidence is available. Furthermore, species diversity within the CFR is not homogeneous, and at finer spatial and temporal scales, the concept of climatic stability driving diversity and species richness becomes more complex (Cowling, Reference Cowling1992; Cowling et al., Reference Cowling, Richardson, Schulze, Hoffman, Midgley, Hilton-Taylor, Cowling, Richardson and Pierce1997; Cowling and Lombard, Reference Cowling and Lombard2002). Palaeoclimatic records from the western montane region of the CFR provide evidence for steep palaeoenvironmental gradients and highlight the need for more research to be conducted to assess the role of palaeoclimatic change in biodiversity patterns (Chase et al., Reference Chase, Boom, Carr, Chevalier, Quick, Verboom and Reimer2019a).
Despite the challenges of conducting Quaternary paleoenvironmental studies in arid–semi-arid areas (see Chase and Meadows, Reference Chase and Meadows2007), considerable progress has been made over the last decade in terms of the generation of high-resolution palaeoclimatic records for the southwestern and southern Cape regions (e.g., Neumann et al., Reference Neumann, Scott and Bamford2011; Stager et al., Reference Stager, Mayewski, White, Chase, Neumann, Meadows, King and Dixon2012; Chase et al., Reference Chase, Boom, Carr, Meadows and Reimer2013, Reference Chase, Boom, Carr, Carré, Chevalier, Meadows, Pedro, Stager and Reimer2015a, Reference Chase, Boom, Carr, Chevalier, Quick, Verboom and Reimer2019a, Reference Chase, Boom, Carr, Quick and Reimer2020; Valsecchi et al., Reference Valsecchi, Chase, Slingsby, Carr, Quick, Meadows, Cheddadi and Reimer2013; Quick et al., Reference Quick, Chase, Wündsch, Kirsten, Chevalier, Mäusbacher, Meadows and Haberzettl2018; Wündsch et al., Reference Wündsch, Haberzettl, Cawthra, Kirsten, Quick, Zabel and Frenzel2018; Kirsten et al., Reference Kirsten, Kasper, Cawthra, Strobel, Quick, Meadows and Haberzettl2020). This emerging regional data set is enabling a more refined understanding of the spatial and temporal complexity of climate and vegetation responses to a range of forcing mechanisms and suggests that substantial variability in inferred climatic trends/trajectories occurs across relatively short distances (e.g., Chase et al., Reference Chase, Boom, Carr, Carré, Chevalier, Meadows, Pedro, Stager and Reimer2015a, Reference Chase, Chevalier, Boom and Carr2017, Reference Chase, Boom, Carr, Quick and Reimer2020; Chase and Quick, Reference Chase and Quick2018). Even though more—and indeed more detailed—records are now available, most of these records only cover the Holocene (11.7–0 cal ka BP) or portions thereof. In particular, greater spatial and temporal coverage is still needed to fully document the last glacial maximum (LGM; 26.5–19 ka; Clark et al., Reference Clark, Dyke, Shakun, Carlson, Clark, Wohlfarth, Mitrovica, Hostetler and McCabe2009) and last glacial termination (Termination I; the period from the end of the LGM to the early Holocene, ~19–11.7 ka).
During Termination I, one of the primary internal drivers of global change was variability in Atlantic Meridional Overturning Circulation (AMOC), a key component of the thermohaline circulation (Mix et al., Reference Mix, Ruddiman and McIntyre1986; Crowley, Reference Crowley1992; Broecker, Reference Broecker1998; Stocker, Reference Stocker1998; Stocker and Johnsen, Reference Stocker and Johnsen2003). The AMOC transports heat from the Southern Hemisphere to the North Atlantic basin. Perturbations in the strength of the AMOC thus impact climate in both hemispheres, with a stronger AMOC resulting in net cooling (warming) in the Southern (Northern) Hemisphere, and a weaker AMOC resulting in a buildup of heat in the Southern Hemisphere while the Northern Hemisphere cools, a dynamic referred to as the “bipolar seesaw” (Broecker, Reference Broecker1998; Stocker and Johnsen, Reference Stocker and Johnsen2003). Massive ice and freshwater discharges in the North Atlantic, known as Heinrich events, exerted a significant influence on the AMOC, resulting, for example, in its near shutdown during Heinrich stadial 1 (HS1; ~18–14.6 ka) (Broecker, Reference Broecker1998; McManus et al., Reference McManus, Francois, Gherardi, Keigwin and Brown-Leger2004; Ritz et al., Reference Ritz, Stocker, Grimalt, Menviel and Timmermann2013; Ng et al., Reference Ng, Robinson, McManus, Mohamed, Jacobel, Ivanovic, Gregoire and Chen2018; Bendle et al., Reference Bendle, Palmer, Thorndycraft and Matthews2019).
In the southwest African sector, the influence of a weaker AMOC is manifested in a general warming of southeast Atlantic sea-surface temperatures (SSTs) (Kim and Schneider, Reference Kim and Schneider2003; Farmer et al., Reference Farmer, deMenocal and Marchitto2005), a poleward shift of the Subtropical Front (Barker et al., Reference Barker, Diz, Vautravers, Pike, Knorr, Hall and Broecker2009), and thus likely an increase in Agulhas leakage (Gordon, Reference Gordon1986; Peeters et al., Reference Peeters, Acheson, Brummer, de Ruijter, Schneider, Ganssen, Ufkes and Kroon2004; Caley et al., Reference Caley, Giraudeau, Malaizé, Rossignol and Pierre2012; Rühs et al., Reference Rühs, Schwarzkopf, Speich and Biastoch2019). As an example, the abrupt slowdown in the AMOC during HS1 is consistent as the underlying driver for the distinct humid phase registered at sites along the western continental margin in the Namib Desert (Lim et al., Reference Lim, Chase, Chevalier and Reimer2016; Chase et al., Reference Chase, Niedermeyer, Boom, Carr, Chevalier, He, Meadows, Ogle and Reimer2019b) and the Cederberg Mountains in the southwestern Cape (Chase et al., Reference Chase, Boom, Carr, Carré, Chevalier, Meadows, Pedro, Stager and Reimer2015a), as well as further afield in the continental interior (Chase et al., Reference Chase, Chevalier, Boom and Carr2017; Chevalier and Chase, Reference Chevalier and Chase2015). It remains to be determined, however, how these changes in the AMOC affected Africa's southern/southwestern Cape coast, particularly in the context of the emerging evidence for spatial complexity in the regional climatic response (Chase and Quick, Reference Chase and Quick2018; Chase et al., Reference Chase, Boom, Carr, Chevalier, Quick, Verboom and Reimer2019a, Reference Chase, Boom, Carr, Quick and Reimer2020). This brings into question the utility of the simple widely used binary models that indicate or infer a coeval inverse relationship between the WRZ and SRZ (van Zinderen Bakker, Reference van Zinderen Bakker1976; Cockcroft et al., Reference Cockcroft, Wilkinson and Tyson1987) and thus how climate changes related to the AMOC may have manifested in the region.
To investigate the potential influence of AMOC variability at the interface of the Agulhas and Benguela Currents and at the margin of the WRZ, we present here a new record of fossil pollen, charcoal, and sediment grain size from a 25,000 year sediment core taken from Pearly Beach 1, a near-coastal wetland site situated on the eastern coastal boundary of the present-day WRZ (Figs. 1 and 2). Data from the core present a rare opportunity to consider vegetation/climate responses through this major global climate transition. The record reveals that distinct changes in vegetation composition occurred along the southwestern Cape coast during the LGM, Termination I, and the Holocene. From these data, we infer considerable variability in temperature and moisture availability over the last 25,000 years and link these changes to glacial and interglacial boundary conditions, and particularly to the perturbations and dynamics in the Earth system that characterised the process of deglaciation.
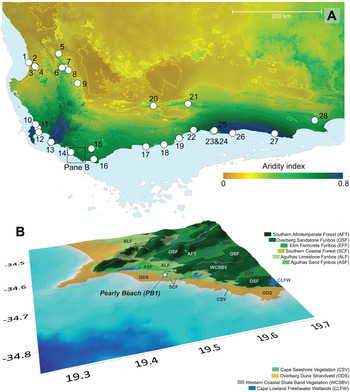
(A) Aridity index map of the southwestern Cape (data: Zomer et al., Reference Zomer, Trabucco, Bossio, van Straaten and Verchot2008), with lower values indicating drier conditions. Peripheral blue shading indicates position of shoreline at last glacial maximum (LGM) low stand (−130 m). The locations of published palaeoenvironmental and archaeological records from the region are shown: 1, Elands Bay Cave (Parkington et al., Reference Parkington, Poggenpoel, Buchanan, Robey, Manhire, Sealy, Bailey and Parkington1988, Reference Parkington, Cartwright, Cowling, Baxter and Meadows2000; Cowling et al., Reference Cowling, Cartwright, Parkington and Allsopp1999); 2, Grootdrift (Meadows et al., Reference Meadows, Baxter and Parkington1996); 3, Verlorenvlei (Kirsten et al. Reference Kirsten, Kasper, Cawthra, Strobel, Quick, Meadows and Haberzettl2020; Stager et al., Reference Stager, Mayewski, White, Chase, Neumann, Meadows, King and Dixon2012; Carr et al., Reference Carr, Boom, Chase, Meadows and Grimes2015); 4, Klaarfontein Springs (Meadows and Baxter, Reference Meadows and Baxter2001); 5, Pakhuis Pass (Scott and Woodborne, Reference Scott and Woodborne2007a, Reference Scott and Woodborne2007b); 6, Sneeuberg Vlei and Driehoek Vlei (Meadows and Sugden, Reference Meadows and Sugden1991); 7, De Rif (Chase et al., Reference Chase, Quick, Meadows, Scott, Thomas and Reimer2011, Reference Chase, Boom, Carr, Carré, Chevalier, Meadows, Pedro, Stager and Reimer2015a; Quick et al., Reference Quick, Chase, Meadows, Scott and Reimer2011; Valsecchi et al., Reference Valsecchi, Chase, Slingsby, Carr, Quick, Meadows, Cheddadi and Reimer2013); 8, Truitjes Kraal (Meadows et al., Reference Meadows, Seliane and Chase2010); 9 Katbakkies (Meadows et al., Reference Meadows, Seliane and Chase2010; Chase et al., Reference Chase, Lim, Chevalier, Boom, Carr, Meadows and Reimer2015b); 10 Rietvlei (Schalke, Reference Schalke1973); 11, Cape Flats (Schalke, Reference Schalke1973); 12, Princess Vlei (Neumann et al., Reference Neumann, Scott and Bamford2011; Kirsten and Meadows, Reference Kirsten and Meadows2016; Cordova et al., Reference Cordova, Kirsten, Scott, Meadows and Lücke2019); 13, Cape Hangklip (Schalke, Reference Schalke1973); 14, Die Kelders (Klein and Cruz-Uribe, Reference Klein and Cruz-Uribe2000); 15, Bynekranskop (Schweitzer and Wilson, Reference Schweitzer and Wilson1982; Faith et al., Reference Faith, Chase and Avery2018); 16, Agulhas Plain vleis and lunettes (Soetendalsvlei, Voëlvlei, Renosterkop, and Soutpan) (Carr et al., Reference Carr, Thomas and Bateman2006a, Reference Carr, Thomas, Bateman, Meadows and Chase2006b); 17, Blombos Cave (Henshilwood et al., Reference Henshilwood, Sealy, Yates, Cruz-Uribe, Goldberg, Grine, Klein, Poggenpoel, van Niekerk and Watts2001); 18, Rietvlei-Still Bay (Quick et al., Reference Quick, Carr, Meadows, Boom, Bateman, Roberts, Reimer and Chase2015); 19, Pinnacle Point (Marean, Reference Marean2010; Rector and Reed, Reference Rector and Reed2010); 20, Seweweekspoort (Chase et al., Reference Chase, Boom, Carr, Meadows and Reimer2013, Reference Chase, Chevalier, Boom and Carr2017); 21, Cango Cave (Talma and Vogel, Reference Talma and Vogel1992) and Boomplaas Cave (Deacon et al., Reference Deacon, Deacon, Scholtz, Thackeray, Brink and Vogel1984); 22, Norga peats (Scholtz, Reference Scholtz1986); 23, Eilandvlei (Kirsten et al., Reference Kirsten, Haberzettl, Wündsch, Frenzel, Meschner, Smit, Quick, Mäusbacher and Meadows2018; Quick et al., Reference Quick, Chase, Wündsch, Kirsten, Chevalier, Mäusbacher, Meadows and Haberzettl2018; Wündsch et al., Reference Wündsch, Haberzettl, Cawthra, Kirsten, Quick, Zabel and Frenzel2018) and Bo Langvlei (du Plessis et al., Reference du Plessis, Chase, Quick, Haberzettl, Kasper and Meadows2020); 24, Groenvlei (Martin, Reference Martin1968; Wündsch et al., Reference Wündsch, Haberzettl, Kirsten, Kasper, Zabel, Dietze and Baade2016); 25, Vankervelsvlei (Irving and Meadows, Reference Irving and Meadows1997; Quick et al., Reference Quick, Meadows, Bateman, Kirsten, Mäusbacher, Haberzettl and Chase2016); 26, Nelson Bay Cave (Cohen and Tyson, Reference Cohen and Tyson1995); 27, Klasies River Mouth (Deacon et al., Reference Deacon, Geleijnse, Thackeray, Thackeray, Tusenius and Vogel1986) and 28 Uitenhage Aquifer (Heaton et al., Reference Heaton, Talma and Vogel1986; Stute and Talma, Reference Stute and Talma1998). (B) Location of Pearly Beach 1 sediment coring site in relation to the current distribution of dominant vegetation types (South African National Biodiversity Institute, 2018). Bathymetry contours are at 20 m intervals (GEBCO Bathymetric Compilation Group, 2020) and 0.1° grid intervals equate to ~9.2 km at this latitude.

REGIONAL SETTING
In 2007, a sediment core (Pearly Beach 1, referred to hereafter as PB1; 34°38.880′S; 19°30.300′E, 5 m above sea level [m asl], 2.5 km from the current coastline; Fig. 2) was extracted from wetlands 2 km north of the coastal town of Pearly Beach, ~200 km southeast of Cape Town. The site is situated on the boundary of the modern WRZ (sensu Chase and Meadows, Reference Chase and Meadows2007; >66% of annual precipitation falling in MJJAS), receiving 68% of its mean annual average of ~450 mm of rainfall during the winter (Climate System Analysis Group, 2021). Temperatures are moderate (monthly averaged daily mean of 17°C), snow has not been recorded, and frost appears to be absent from the area as well.
The Pearly Beach wetland complex is situated on a low-lying undulating coastal plain that is bounded to the north by Bredasdorp Group limestone (calcarenite) ridges and Table Mountain Group sandstone outcrops of the Peninsula Formation (Malan, Reference Malan1990). The wetlands derive their waters from the limestone uplands to the northeast of the site via both runoff and throughflow from spring seeps. Transverse coastal dunes, currently invaded by extensive alien vegetation, stretch along the southern and western boundaries of the wetland adjacent to the ocean. Relict deflated parabolic dunes can be identified within the landscape towards the northwest and southeast of the site. The coastal platform is underlain by unconsolidated aeolian calcareous Quaternary sediments of the Strandveld Formation with partially consolidated calcrete lenses found in some patches along the coast and further inland (Gresse and Theron, Reference Gresse and Theron1992). Alluvial deposits characterise the wetlands of the area. On the limestone ridges, soils are shallow, alkaline, and calcareous, whereas the lower slopes are characterised by more acidic, colluvial soils with evidence of early stages of podsolisation (Rebelo et al., Reference Rebelo, Cowling, Campbell and Meadows1991). The young coastal dune sands are associated with deeper calcareous, alkaline soils in comparison to the soils found on the slopes.
Contemporary vegetation
The study area (Fig. 2) is home to the Groot Hagelkraal farm—a registered private nature reserve and a South African Nature Foundation Natural Heritage Site. The Groot Hagelkraal area harbours six local-endemic and 21 regional-endemic plant species and has been lauded as the world's “hottest” biodiversity hotspot and foremost conservation priority in the CFR (Cowling, Reference Cowling1996; Willis et al., Reference Willis, Cowling and Lombard1996; Jones et al., Reference Jones, van Nieuwenhuizen and Day2002). The surrounding landscape is dominated by (1) sclerophyllous, Mediterranean-type shrublands of the fynbos biome, found on both the lowlands and uplands; (2) subtropical thickets that occupy parts of the near-coastal dune fields adjacent to the site; and (3) pockets of forest vegetation in more sheltered sites (Cowling et al., Reference Cowling, Campbell, Mustart, McDonald, Jarman and Moll1988; Mucina and Rutherford, Reference Mucina and Rutherford2006). Where surface water is perennially or seasonally available, lowland areas also support riparian and wetland habitats (Mustart et al., Reference Mustart, Cowling and Albertyn2003).
The azonal vegetation associated with the wetland systems around Pearly Beach and the upper reaches of the Groot Hagelkraal River is broadly classified as Cape Lowland Freshwater Wetlands (Mucina et al., Reference Mucina, Rutherford, Powrie, Mucina and Rutherford2006b). These systems are dominated by the reed Phragmites australis (Poaceae) and the rushes Juncus kraussii and Juncus capensis (Juncaceae). Sedges, especially Ficinia nodosa (Cyperaceae), form dense stands along the margins of the vlei, while Typha capensis and Isolepis prolifera (Cyperaceae) inhabit the open water and shallower margins, together with obligate aquatics like Aponogeton distachyos and Nymphaea nouchali.
Three broad types of fynbos vegetation occur in the study area, each associated with a specific edaphic substrate (Thwaites and Cowling, Reference Thwaites and Cowling1988). Agulhas Limestone Fynbos occurs in fragmented patches inland of the Pearly Beach site on shallow, alkaline sands that accumulate in depressions over Bredasdorp Group limestone pavements (Cowling et al., Reference Cowling, Campbell, Mustart, McDonald, Jarman and Moll1988; Mustart et al., Reference Mustart, Cowling and Albertyn2003; Rebelo et al., Reference Rebelo, Boucher, Helme, Mucina, Rutherford, Mucina and Rutherford2006). This mid-high, moderately dense shrubland contains tall, emergent proteoids and is characterised by the presence of Protea obtusifolia and Leucadendron meridianum. The restioid component is poorly developed, but the widespread species Elegia microcarpa and Restio leptoclados and the more restricted Thamnochortus fraternus are typical of this fynbos type. Typical ericoid shrubs include Aspalathus calcarea (Fabaceae), Metalasia calcicola (Asteraceae), Phylica selaginoides, and Passerina paleacea, as well as several local- and regional-endemic species of the Ericaceae (e.g., Erica calciphila) and Rutaceae (e.g., Diosma haelkraalensis) (Mustart et al., Reference Mustart, Cowling and Albertyn2003; Rebelo et al., Reference Rebelo, Boucher, Helme, Mucina, Rutherford, Mucina and Rutherford2006).
Like Agulhas Limestone Fynbos, Agulhas Sand Fynbos is associated with Bredasdorp Group limestones, but this vegetation type occurs on deep colluvial, neutral sands that fringe the base of limestone outcrops (Cowling et al., Reference Cowling, Campbell, Mustart, McDonald, Jarman and Moll1988; Mustart et al., Reference Mustart, Cowling and Albertyn2003; Rebelo et al., Reference Rebelo, Boucher, Helme, Mucina, Rutherford, Mucina and Rutherford2006). Overstorey proteoids that characterise this vegetation type are Protea susannae and Leucadendron coniferum. Typical ericoid shrubs include Erica discolor, Erica plukenetii subsp. lineata, Metalasia densa, and Passerina corymbosa, as well as the Hagelkraal-endemic Spatalla ericoides (Mustart et al., Reference Mustart, Cowling and Albertyn2003; Rebelo et al., Reference Rebelo, Boucher, Helme, Mucina, Rutherford, Mucina and Rutherford2006). Commonly occurring restioids are Elegia filacea, Elegia tectorum, Restio triticeus, Thamnochortus erectus, and Thamnochortus insignis.
Overberg Sandstone Fynbos occurs on the rolling uplands, where it is associated with deep colluvial, infertile acid sands derived from Table Mountain Group sandstones (Thwaites and Cowling, Reference Thwaites and Cowling1988; Cowling et al., Reference Cowling, Campbell, Mustart, McDonald, Jarman and Moll1988; Rebelo et al., Reference Rebelo, Boucher, Helme, Mucina, Rutherford, Mucina and Rutherford2006; Fig. 2). Protea compacta is the dominant and characteristic overstorey proteoid, while Leucadendron xanthoconus is also common. Restioids can be locally abundant, with Ceratocaryum argenteum, Hypodiscus argenteus, Mastersiella digitata, and Staberoha multispicula being typical species.
The deep, well-drained alkaline sands of coastal dunes in the study area support Overberg Dune Strandveld, a mosaic-type vegetation comprising small clumps of subtropical thicket in a matrix of asteraceous fynbos (Cowling et al., Reference Cowling, Campbell, Mustart, McDonald, Jarman and Moll1988; Rebelo et al., Reference Rebelo, Boucher, Helme, Mucina, Rutherford, Mucina and Rutherford2006). The dune–fynbos component is dominated by non-ericaceous ericoid shrubs, especially Acmadenia obtusata (Rutaceae), Agathosma collina (Rutaceae), Metalasia muricata (Asteraceae), Muraltia satureioides (Polygalaceae), P. paleacea, and Phylica ericoides (Mustart et al., Reference Mustart, Cowling and Albertyn2003). Restioids are not abundant in the dune fynbos; this group is typically represented by only two species, E. microcarpa and Restio eleocharis. A conspicuous difference between the fynbos component of Overberg Dune Strandveld and the other fynbos vegetation types occurring in the study area is the absence of proteoids in the former (Cowling et al., Reference Cowling, Campbell, Mustart, McDonald, Jarman and Moll1988). While subtropical thicket shrubs occur throughout Overberg Dune Strandveld, dune thicket clumps are best developed in moist, wind- and fire-protected dune slacks, where their structure and composition approach that of coastal forests (see below). Characteristic dune thicket shrubs include Carissa bispinosa (Apocynaceae), Euclea racemosa, Morella cordifolia, Myrsine africana, Lauridia tetragona (Celastraceae), Olea exasperata, Robsonodendron maritimum (Celastraceae), Pterocelastrus tricuspidatus (Celastraceae), and Searsia glauca (Cowling et al., Reference Cowling, Campbell, Mustart, McDonald, Jarman and Moll1988; Mustart et al., Reference Mustart, Cowling and Albertyn2003; Rebelo et al., Reference Rebelo, Boucher, Helme, Mucina, Rutherford, Mucina and Rutherford2006).
The azonal vegetation associated with coastal strands, rocky shorelines, and mobile dune cordons in the study area is classified as Cape Seashore Vegetation (Mucina et al., Reference Mucina, Adams, Knevel, Rutherford, Powrie, Bolton, van der Merwe, Anderson, Bornman, le Roux, Mucina and Rutherford2006a). Sandy areas typically host the grasses Ehrharta villosa and Thinopyrum distichum (both Poaceae); the succulent shrubs Tetragonia decumbens and Carpobrotus acinaciformis (both Aizoaceae); several herbaceous species like Arctotheca populifolia (Asteraceae), Dasispermum suffriticosum (Apiaceae), Senecio elegans (Asteraceae), and Silene crassifolia (Caryophyllaceae); and the shrubs Hebenstreitia cordata (Scrophulariaceae), M. cordifolia, and Passerina rigida (Mustart et al., Reference Mustart, Cowling and Albertyn2003; Mucina et al., Reference Mucina, Adams, Knevel, Rutherford, Powrie, Bolton, van der Merwe, Anderson, Bornman, le Roux, Mucina and Rutherford2006a). The more stabilised dunes half a kilometre inland of the littoral zone are predominantly vegetated by Osteospermum moniliferum (Asteraceae), which, together with other woody species like Searsia crenata, form small pockets of wind-pruned thicket. Along rocky shores, the vegetation comprises low grasslands of salt-tolerant species like Sporobolus virginicus and Stenotaphrum secundatum or succulent herblands where Dimorphotheca fruticosa (Asteraceae), Drosanthemum intermedium (Aizoaceae), Mesembryanthemum vanrensburgii (Aizoaceae), and Plantago crassifolia are typical.
There are small, isolated patches of Southern Coastal Forest to the west of the site that are dominated by Sideroxylon inerme. Other trees and shrubs present in these patches include Cassine peragua (Celastraceae), Chionanthus foveolatus (Oleaceae), R. maritimum (Celastraceae), Maytenus procumbens (Celastraceae), Olea capensis, Polygala myrtifolia, P. tricuspidatus (Celastraceae), and Tarchonanthus littoralis (Asteraceae) (Mustart et al., Reference Mustart, Cowling and Albertyn2003; Mucina and Geldenhuys, Reference Mucina, Geldenhuys, Mucina and Rutherford2006).
MATERIALS AND METHODS
Chronology
The age–depth model for the PB1 core was constructed from eight radiocarbon ages (Table 1). Subsamples of approximately 1 g were taken from various positions along the PB1 core and sent to Beta Analytic Inc. for accelerator mass spectrometry (AMS) radiocarbon dating. These ages were calculated using the Libby half-life of 5568 years following Stuiver and Polach (Reference Stuiver and Polach1977). The ages were corrected for isotope fractionation using the AMS-measured δ13C, which accounts for both natural and machine fractionation.
Accelerator mass spectrometry (AMS) radiocarbon ages for Pearly Beach 1.a
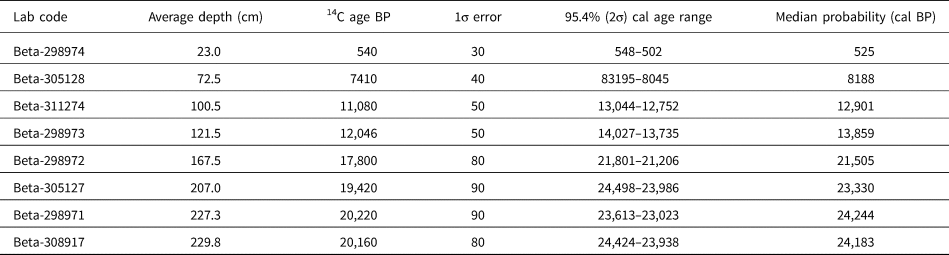
a The SHCal13 dataset (Hogg et al., Reference Hogg, Hua, Blackwell, Niu, Buck, Guilderson, Heaton, Palmer, Reimer and Reimer2013) was used to calibrate the ages.
The age–depth model was developed in the software package rbacon (v. 2.3.6; Blaauw and Christen, Reference Blaauw and Christen2011). Using a Bayesian framework, rbacon divides the core into sections and models the accumulation rate for each section through multiple Markov chain Monte Carlo iterations. The ages were calibrated with the SHCal13 data (Hogg et al., Reference Hogg, Hua, Blackwell, Niu, Buck, Guilderson, Heaton, Palmer, Reimer and Reimer2013).
Particle size analysis
Particle size analysis was conducted at the Department of Geography, Friedrich-Schiller-University, Jena, Germany. Subsamples of ~5 g were pretreated with hydrogen peroxide (H2O2) to remove organic material, while carbonates were removed with hydrochloric acid (HCl). Sodium pyrophosphate (Na4P2O7) was added as a deflocculant. The particle size distributions were detected using a Beckman Coulter LS 13 320 Laser Diffraction Particle Size Analyzer, the single-wavelength Aqueous Liquid Module. Measurements were carried out in several runs until a reproducible signal was obtained.
Pollen and microcharcoal analyses
Pollen and microcharcoal subsamples (1 cm thick) were initially taken at 5 cm intervals. This was followed by finer-resolution subsampling at targeted locations along the core that were identified by the initial pollen results as representing periods of significant vegetation change.
Palynomorphs were concentrated and extracted following Moore et al. (Reference Moore, Webb and Collinson1991) with specific adaptations for dense media separation from Nakagawa et al. (Reference Nakagawa, Brugiapaglia, Digerfeldt, Reille, De Beaulieu and Yasuda1998). This involved 30% HCl treatment to remove carbonates, 10% KOH digestion to disaggregate the samples and remove humic acids, and heavy liquid mineral separation using ZnCl2 to separate the pollen grains from the non-pollen matrix (Faegri and Iversen, Reference Faegri and Iversen1989; Moore et al., Reference Moore, Webb and Collinson1991; Nakagawa et al., Reference Nakagawa, Brugiapaglia, Digerfeldt, Reille, De Beaulieu and Yasuda1998). Samples were acetolysised and mounted in Aquatex, an aqueous mounting agent. Three slides were produced per sample, and absolute pollen concentrations were calculated via the addition of Lycopodium spores as per Stockmarr (Reference Stockmarr1971). Pollen counts of 500 grains per sample were carried out at 400× magnification for routine identification and 1000× for specific identification. Non-pollen palynomorphs were counted but not included in the total pollen sum. The University of Cape Town pollen reference collection and published resources (van Zinderen Bakker, Reference van Zinderen Bakker1953, Reference van Zinderen Bakker1956; van Zinderen Bakker and Coetzee, Reference van Zinderen Bakker and Coetzee1959; Scott, Reference Scott1982) were used for the identification of pollen taxa. The pollen and microcharcoal diagram was constructed in Tilia (v. 2.1.1) (Grimm, Reference Grimm1991) and was divided into statistically significant pollen assemblage zones based on a constrained incremental sum of squares (CONISS; with square-root transformation) analysis (Grimm, Reference Grimm1987).
Charcoal particles were identified and counted on the same microscope slides produced for the pollen analysis. Only particles that were black, opaque, and angular were considered charcoal fragments (Patterson et al., Reference Patterson, Edwards and Maguire1987; Mooney and Tinner, Reference Mooney and Tinner2011). Charcoal fragments were classified and counted according to two size categories based on the long axis of each fragment: 10–100 μm and >100 μm. Particles smaller than 75 μm2 (or ~10 μm long) were not counted due to the risk of false identification (Mooney and Tinner, Reference Mooney and Tinner2011). Therefore, the charcoal signal primarily relates to the regional (10–100 μm) and local (>100 μm) fire signals and excludes extra-regional fires (<10 μm). Absolute charcoal abundances were calculated in the same manner as pollen concentrations (Stockmarr, Reference Stockmarr1971).
Defining plant–climate relationships
To objectively define the plant–climate relationships associated with the Pearly Beach pollen assemblage, we used the CREST (Climate REconstruction SofTware) method and software (Chevalier et al., Reference Chevalier, Cheddadi and Chase2014; Chevalier, Reference Chevalier2019). For our analyses, we used botanical data obtained from the Global Biodiversity Information Facility (GBIF) database (https://www.gbif.org), specifically the curated data set of Chevalier (Reference Chevalier2020), and we used a regional subset of the Worldclim 2 climatology (Fick and Hijmans, Reference Fick and Hijmans2017).
RESULTS
Stratigraphy and chronology
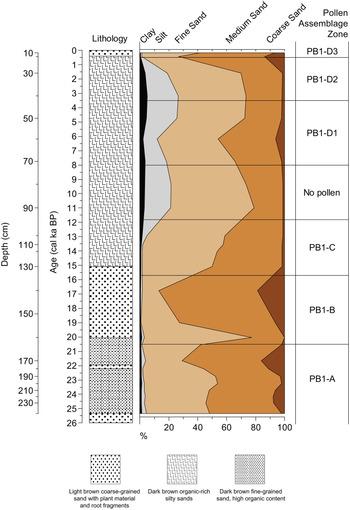
The particle size analysis results indicate that the 250 cm core predominantly comprises sands and silty sands with three distinct zones of pale coarser-textured sands at the top (0–25 cm), middle (130–160 cm), and base (235–250 cm) of the core (Figs. 3 and 4, Supplementary Appendix A). They are bounded by relatively homogeneous organic-rich silty sands. The exception being a thin lens of light-coloured coarser sand situated between 175 and 180 cm (Fig. 3).
Age–depth model for Pearly Beach (PB1) using the rbacon (Blaauw and Christen, Reference Blaauw and Christen2011). The blue areas represent the 2σ probability distributions of the calibrated 14C ages, the greyscales indicate all likely age–depth models, grey dotted lines show the 95% confidence intervals, and the red dotted line shows the single “best” model based on the median age for each depth.

Pearly Beach 1 (PB1) particle size analysis data displayed as percentages of clay (0–2 μm), silt (2–20 μm), fine sand (20–200 μm), medium sand (200–500 μm), and coarse sand (500–2000 μm) plotted against interpolated age (cal ka BP) and composite depth (cm) with pollen assemblage zones indicated on the far right.

The core spans the period ~25.3 cal ka BP to present (Fig. 3), encompassing much of the LGM (26.5–19 cal ka BP), Termination I (~19–11.7 cal ka BP), and the Holocene (11.7–0 cal ka BP).
Pollen and microcharcoal
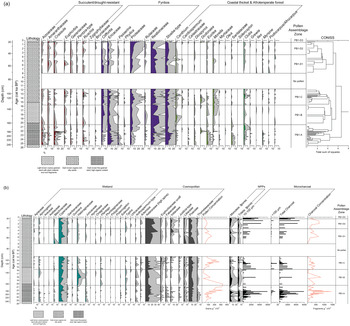
A total of 102 pollen taxa were identified from the 78 samples analysed. The pollen, non-pollen palynomorphs, microcharcoal, and particle size data (Figs. 4 and 5, Supplementary Appendix A) were divided based on CONISS analysis results and assemblage variability into four pollen assemblage zones (and three subzones). Pollen concentrations range between 2 × 10³ and 33 × 103 grain/g, with peaks in concentration at 22.5–19 cal ka BP and 14–12 cal ka BP. No pollen was preserved from 11.6 to 8.5 cal ka BP.
(a and b) Relative percentage pollen and microcharcoal diagrams for Pearly Beach (PB1). Taxa grouped according to general ecological affinities and are plotted against interpolated age (cal ka BP) and composite depth (cm). Taxa included in the Cosmopolitan ecological grouping that represent less than 2% for any given level were excluded, the full data set is presented in Supplementary Appendix A. Exaggeration curves are 3×, and zonation is based on the results of a constrained incremental sum of squares (CONISS) analysis.

The overall assemblage is characterised by variations in fynbos taxa (e.g., Proteaceae, Ericaceae, Restionaceae, Cliffortia, and Stoebe-type), coastal thicket elements (such as Euclea, Morella, and Canthium Footnote 1), succulent/drought-resistant elements (e.g., Aizoaceae, Crassula, and Euphorbia), and local wetland vegetation (predominantly Cyperaceae, Juncaceae, and Haloragaceae), as well as more cosmopolitan pollen types such as Asteraceae and Poaceae. Ericaceace pollen is most prominent at the base of the sequence (pollen assemblage zone PB1-A; 25–21 cal ka BP), coinciding with the only significant presence of Passerina, relatively elevated proportions of Stoebe-type (which includes various Stoebe spp. and Elytropappus spp.) and low percentages of Proteaceae and Restionaceae. A further distinguishing feature of PB1-A is the generally greater proportions of coastal thicket taxa, particularly Euclea and Santalaceae, as well as discrete, relatively high peaks in Dodonaea and Morella from 22.5 to 21.5 cal ka BP. The isolated peaks in Dodonaea and Morella coincide with a large spike in Crassula (14%) and a smaller peak in Aizoaceae. Just before this phase, the highest counts and greatest concentrations of microcharcoal were recorded (from 23–22 cal ka BP). There is a small peak in Juncaceae percentages at the base of the sequence and peaks in Cyperaceae around 22 cal ka BP, although wetland taxa percentages are generally somewhat reduced for PB1-A.
For PB-1B (21–14.5 cal ka BP), we observe significantly elevated percentages of Restionaceae within the sand layer dating to ~20–15.5 cal ka BP (Figs. 4 and 5), coinciding with generally reduced succulent/drought-resistant taxa and fynbos elements relative to PB1-A. The highest peak in the aquatic taxon Haloragaceae for the sequence (12%) and peaks in the coastal thicket taxa Canthium and Morella also characterise PB1-B. While Dodonaea reappears near the top of PB1-B, this taxon is recorded in more significant proportions within PB1-C (14.5–12 cal ka BP), together with relatively elevated percentages in coastal thicket indicators (e.g., Canthium and Morella) and the afrotemperate forest taxon Clutia. Fynbos (Ericaceae, Restionaceae, Proteaceae, and Stoebe-type) proportions remain relatively high for this period. The succulent/drought-resistant taxa Crassula, Euphorbia, and Ruschia all exhibit prominent peaks within this PB1-C.
Pollen was not found in sediments dating to the early Holocene (11.7–8 cal ka BP). For most of the mid- to late Holocene (PB1-D; ~7.7–0 cal ka BP), other than Restionaceae, which remains relatively high, fynbos elements (particularly Ericaceae and Passerina) are represented in much lower proportions in comparison to the previous zones. The halophytic taxon Amaranthaceae peaks from 6 to 5 cal ka BP and is generally represented in high proportions within the whole of PB1-D. Coinciding with the peak in Amaranthaceae are peaks in Ruschia, Crassula, and microcharcoal concentrations. Microcharcoal concentrations and amounts (for both size classes) peak again from 2 to 1 cal ka BP. Asteraceae percentages are generally higher within PB1-D compared with the previous zones and reach a maximum for the sequence (38%) at ~4.2 cal ka BP. Wetland taxa generally exhibit no clear trends/changes other than a small peak in Blechnaceae at base of the zone at ~7.7 cal ka BP and peaks in Cyperaceae at ~5.8 and ~1.9 cal ka BP.
The most recent portion of the record, the last 500 years (PB1-D3), is substantially different from the rest of the Holocene section, being characterised by exceptionally high percentages of Proteaceae (up to 26%); distinct peaks in Cliffortia, Amaranthaceae, Euclea, Morella, and Dodonaea; and the appearance of Sideroxylon pollen.
DISCUSSION
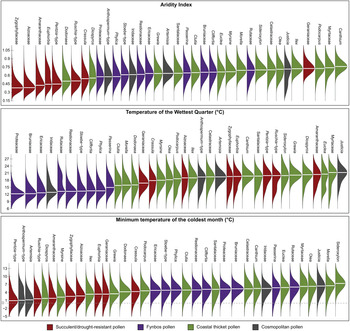
The pollen results from the Pearly Beach sediment core reveal that distinct changes in vegetation composition occurred along the southwestern Cape coast since the onset of the LGM. The analysis of contemporary climatic constraints on the identified taxa (Figs. 6 and 7) provides a framework for the interpretation of this record. Considerable variability in temperature and moisture availability may be inferred from these results, which are of particular importance in shedding new light on the LGM and Termination I in the region. The Holocene portion of the record is of significantly lower resolution, but it provides important context for understanding the climate and vegetation history of the site. As the site is located 2.5 km from the modern coastline and ~28.5 km from the LGM coastline (Spratt and Lisiecki, Reference Spratt and Lisiecki2016; GEBCO Bathymetric Compilation Group, 2020), the potential impact of changing sea level should be considered when considering the Pearly Beach data. The gradient of the adjacent shelf is low and regular, and the coastline is predicted to have encroached upon the site at a rate of ~1.6 km/ka since the LGM, achieving its current position at ~5 ka. Considering the position and palaeo-landscape of the site, factors such as increased continentality are unlikely to have been a significant factor, and a related progressive increase in moisture availability with reduced distance to the coast is not indicated by the pollen record, as will be described (Fig. 5). Similarly, rising sea levels would have raised base level and associated groundwater levels, but again the records do not indicate an increase in water availability with a rise in base level. Sea-level changes and the position of the site relative to the coast may also have had an impact on sedimentation regimes, with marine transgression resulting in an increase in marine and aeolian sands. Grain size results from the sediment core (Fig 4.), however, indicate no pattern that can be readily associated with sea-level change, such as an increase in the coarse sediment fraction. Thus, in the absence of specific evidence for a strong marine impact, the record is presently interpreted primarily in terms of climate.
Probabilistic responses of the pollen taxa to three important regional climate determinants: the aridity index (Zomer et al., Reference Zomer, Trabucco, Bossio, van Straaten and Verchot2008; Trabucco and Zomer, Reference Trabucco and Zomer2019), the temperature of the wettest quarter (used as a proxy for the temperature of the growing season), and the minimum temperature of the coldest month (Fick and Hijmans, Reference Fick and Hijmans2017). These responses were calculated following the probability density function (pdf) approach of Chevalier et al. (Reference Chevalier, Cheddadi and Chase2014) and using data from the SANBI database (South African National Biodiversity Institute, 2020), restricted to the plant species that currently live in the study area (defined here as a box between 17° and 29°E and between 32° and 35°S).

Biplot representing the climate optima (i.e., the climate value with the highest probability of presence) of the studied taxa for the temperature of the growing season (x-axis) (as represented by temperature of the wettest quarter) and aridity (y-axis; larger values associated with more humid conditions).

The LGM ($\sim$ 25.3–19 cal ka BP)

Pollen from cold-tolerant fynbos taxa (e.g., Stoebe-type, Passerina, and Ericaceae) indicate that these plants were dominant features of the Pearly Beach landscape from 25.3 to 22.5 cal ka BP (Figs. 5–7). This is consistent with other evidence of cooler conditions throughout southern Africa during the last glacial period and the LGM in particular (Heaton et al., Reference Heaton, Talma and Vogel1986; Talma and Vogel, Reference Talma and Vogel1992; Stute and Talma, Reference Stute and Talma1998; Truc et al., Reference Truc, Chevalier, Favier, Cheddadi, Meadows, Scott, Carr, Smith and Chase2013; Chevalier and Chase, Reference Chevalier and Chase2015). However, the presence of pollen from Dodonaea, a relatively frost-intolerant taxon (Valsecchi et al., Reference Valsecchi, Chase, Slingsby, Carr, Quick, Meadows, Cheddadi and Reimer2013; Fig. 6), suggests that frost—if it occurred—was not common.
During this period, the coastal thicket group is dominated by a relatively high abundance of Euclea and Santalaceae pollen (likely Thesium, based on associations with increased fynbos representation at this time), which, coupled with the co-occurrence of Ruschia pollen, may reflect a relatively xeric coastal thicket composition (Boucher and Moll, Reference Boucher, Moll, Castri, Goodall, and Specht and L1981; Boucher, Reference Boucher1987; Cowling et al., Reference Cowling, Cartwright, Parkington and Allsopp1999). While more mesic taxa such as Morella, Canthium, and the afrotemperate taxa Podocarpus/Afrocarpus and Myrsine are present, they are found only in relatively low proportions (Figs. 5–7). Cooler conditions at this time thus do not seem to be associated with either a significant decline in moisture availability (as has been inferred from charcoal data from Boomplaas Cave; Deacon et al., Reference Deacon, Deacon, Scholtz, Thackeray, Brink and Vogel1984; Scholtz, Reference Scholtz1986). Nor, however, do they seem to reflect substantially wetter conditions during the LGM, as has been indicated by some palaeoclimate model simulations (Engelbrecht et al., Reference Engelbrecht, Marean, Cowling, Engelbrecht, Neumann, Scott and Nkoana2019) and inferred from evidence elsewhere in the WRZ, such as Elands Bay Cave (Cartwright and Parkington, Reference Cartwright and Parkington1997; Cowling et al., Reference Cowling, Cartwright, Parkington and Allsopp1999; Parkington et al., Reference Parkington, Cartwright, Cowling, Baxter and Meadows2000). Considered within the context of the record as a whole, Euclea does exhibit a general positive relationship with microcharcoal concentrations (Fig. 5), suggesting that fire may also be a factor contributing to the dominance of Euclea in the coastal thicket at this time. Euclea (e.g., E. racemosa) may have been able to exert a competitive advantage over more mesic, less fire-adapted thicket taxa under a regime of more regular fire occurrence (Nzunda and Lawes, Reference Nzunda and Lawes2011).
The period from ~22.5 to 22 cal ka BP is characterised by high levels of succulent/drought-resistant pollen and decreased levels of both coastal thicket and afrotemperate forest taxa, indicating a period of relatively dry conditions (Figs. 5 and 8). High percentages of Stoebe-type pollen suggest this interval was also perhaps the coolest of the last 25 kyr. At ~22 cal ka BP, this phase of cool and relatively dry conditions is disrupted abruptly by an episode of increased temperatures and humidity, as indicated by strong increases in Morella and Dodonaea pollen (Figs. 5 and 6). While brief, the timing of this event is consistent with episodes of increased humidity in other regional records at Seweweekspoort (Chase et al., Reference Chase, Chevalier, Boom and Carr2017) and along the southwest African margin (Chase et al., Reference Chase, Niedermeyer, Boom, Carr, Chevalier, He, Meadows, Ogle and Reimer2019b).
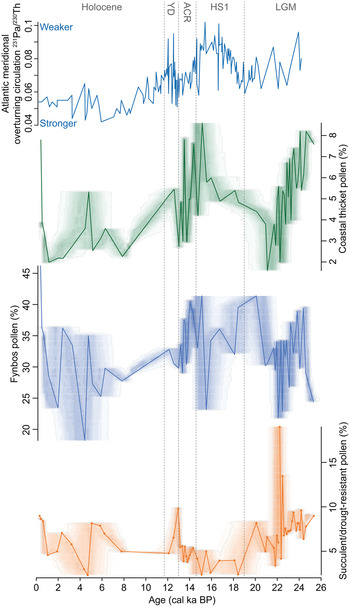
Primary pollen groups from Pearly Beach (PB1). Associated shading was obtained from proxy ghost analysis using rbacon software (v. 2.3.6; Blaauw and Christen, Reference Blaauw and Christen2011) to express chronological uncertainties. The Holocene, Younger Dryas (YD), Antarctic Cold Reversal (ACR), and last glacial maximum (LGM) chronozones are indicated.

The late LGM, from ~22 to 19 cal ka BP, is characterised by a further decline in coastal thicket and afrotemperate forest taxa and a dominance of Restionaceae pollen in association with greater contributions of medium- and coarse-grained sands (Figs. 4 and 5). These trends may reflect the ceding of the thicket niche to Restionaceae species that are more tolerant of summer drought (e.g., Thamnochortus, which is common on dunes along the arid, winter rain–dominated west coast; Linder and Mann, Reference Linder and Mann1998; South African National Biodiversity Institute, 2020). The thicket taxa Morella and Canthium begin to become more prominent at ~20 cal ka BP, suggesting the beginning of an increase in humidity that accelerates rapidly (reflected in substantial increases in these taxa) with the onset of Southern Hemisphere warming at ~19 ka.
In terms of drivers of the patterns of vegetation change observed in the Pearly Beach pollen record, the data are consistent with indications from elsewhere in southwestern Africa (e.g., Chase et al., Reference Chase, Boom, Carr, Carré, Chevalier, Meadows, Pedro, Stager and Reimer2015a, Reference Chase, Niedermeyer, Boom, Carr, Chevalier, He, Meadows, Ogle and Reimer2019b) that AMOC was a strong modulator of global LGM conditions. At Pearly Beach, changes in the pollen record—while complex—are in accord with results from Namib Desert rock hyrax (Procavia capensis) middens, which indicate phases of relatively drier conditions (~24–22.5 cal ka BP and ~22–18 cal ka BP) demarcated by brief phases of increased humidity from ~24.5–24 cal ka BP and 22.5–22 cal ka BP before the beginning of Termination I (Chase et al., Reference Chase, Niedermeyer, Boom, Carr, Chevalier, He, Meadows, Ogle and Reimer2019b; Fig. 9).
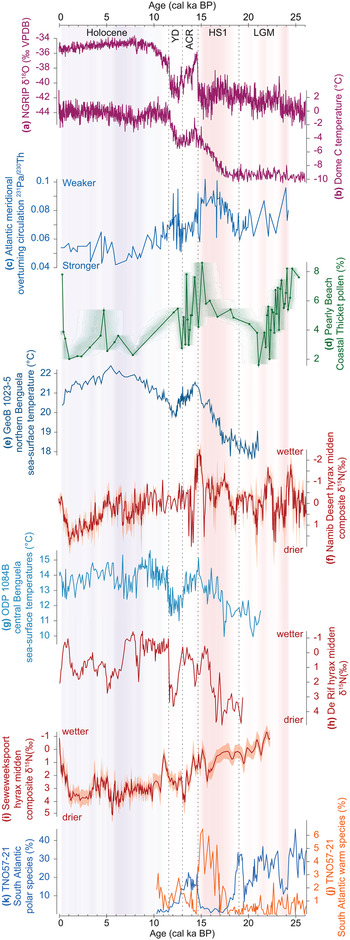
Comparison of records relevant to the context and climate dynamics associated with the changes observed in the Pearly Beach record. The last glacial maximum (LGM), Heinrich stadial 1 (HS1), Antarctic Cold Reversal (ACR), Younger Dryas (YD), and Holocene chronozones are indicated. Shading has been added to indicate the strength of Atlantic overturning circulation relative to the 25 ka mean (red = weaker, blue = stronger). Records shown are: (a) North Greenland Ice Core Project (NGRIP) oxygen isotope record (North Greenland Ice Core Project Members, 2004), (b) Antarctic temperature record from Dome C (Jouzel et al., Reference Jouzel, Masson-Delmotte, Cattani, Dreyfus, Falourd, Hoffmann and Minster2007), (c) record of Atlantic overturning circulation strength (Ng et al., Reference Ng, Robinson, McManus, Mohamed, Jacobel, Ivanovic, Gregoire and Chen2018), (d) the coastal thicket pollen record from Pearly Beach, shading from proxy ghost analysis using rbacon software (v. 2.3.6; Blaauw and Christen, Reference Blaauw and Christen2011) to express chronological uncertainties, (e) sea-surface temperature record from the GeoB 1023-5 marine core (Kim et al., Reference Kim, Schneider, Mulitza and Müller2003), (f) Namib Desert rock hyrax midden nitrogen isotope record (Blaauw and Christen, Reference Blaauw and Christen2011), (g) sea-surface temperature record from ODP 1084B marine core (Farmer et al., Reference Farmer, deMenocal and Marchitto2005), (h) De Rif rock hyrax midden nitrogen isotope record (Chase et al., Reference Chase, Quick, Meadows, Scott, Thomas and Reimer2011, 2015a), (i) Seweweekspoort rock hyrax midden nitrogen isotope record (Chase et al., Reference Chase, Chevalier, Boom and Carr2017), (j and k) percentages of polar and warm water foraminiferal species in South Atlantic core TNO57-21 (Barker et al., Reference Barker, Diz, Vautravers, Pike, Knorr, Hall and Broecker2009).

At variance with the inference that the cool/cold boundary conditions of the terminal Pleistocene created relatively humid conditions in the southwestern Cape (van Zinderen Bakker, Reference van Zinderen Bakker1976; Cockcroft et al., Reference Cockcroft, Wilkinson and Tyson1987; Cowling et al., Reference Cowling, Cartwright, Parkington and Allsopp1999), the Pearly Beach record suggests that phases of increased humidity correlate positively with increased temperature (Figs. 8 and 9). This likely relates to a combination of factors linked to a progressive buildup of heat in the South Atlantic and high southern latitudes associated with a weaker AMOC (Stocker and Johnsen, Reference Stocker and Johnsen2003; McManus et al., Reference McManus, Francois, Gherardi, Keigwin and Brown-Leger2004; Ng et al., Reference Ng, Robinson, McManus, Mohamed, Jacobel, Ivanovic, Gregoire and Chen2018). This warming—including the southeast Atlantic and oceans surrounding the southwestern Cape (Kim et al., Reference Kim, Schneider, Mulitza and Müller2003; Farmer et al., Reference Farmer, deMenocal and Marchitto2005; Dyez et al., Reference Dyez, Zahn and Hall2014)—may have influenced regional climates through: (1) a southerly shift of the Atlantic Intertropical Convergence Zone (ITCZ) and African rainbelt (Broccoli et al., Reference Broccoli, Dahl and Stouffer2006), including a weakening of the southeasterly trade winds and a southerly shift of the Angola-Benguela Front (Kim et al., Reference Kim, Schneider, Mulitza and Müller2003; Fig. 1); (2) a poleward displacement of the Subtropical Front and westerlies storm track (Lee et al., Reference Lee, Chiang, Matsumoto and Tokos2011; Menviel et al., Reference Menviel, Spence, Yu, Chamberlain, Matear, Meissner and England2018) (likely also enabling increased Agulhas leakage into the SE Atlantic; Peeters et al., Reference Peeters, Acheson, Brummer, de Ruijter, Schneider, Ganssen, Ufkes and Kroon2004; Caley et al., Reference Caley, Giraudeau, Malaizé, Rossignol and Pierre2012), but a warming of the southwest Atlantic and waters upstream from the southwestern Cape, increasing moisture uptake by the frontal systems that bring winter rains to the Cape (Reason et al., Reference Reason, Rouault, Melice and Jagadheesha2002, Reference Reason, Landman and Tennant2006); and (3) increased evaporation and advection of moisture from southern coastal waters, fostering the development of localised precipitation systems (Jury et al., Reference Jury, Valentine and Lutjeharms1993, Reference Jury, Rouault, Weeks and Schormann1997). All these factors could result in a less-seasonal rainfall regime and a shorter/less intense drought season in the southwestern Cape (Chase et al., Reference Chase, Lim, Chevalier, Boom, Carr, Meadows and Reimer2015b). At the subcontinental scale, it has been observed that warm events in the southeast Atlantic off Angola and Namibia are associated with increased rainfall along southern Africa's western margin and that these anomalies may extend inland significantly, particularly if easterly flow off the Indian Ocean is also high (Rouault et al., Reference Rouault, Florenchie, Fauchereau and Reason2003). A critical dynamic may have thus been fostered between the warming and southward displacement of the Angola-Benguela Front (Fig. 1) and the increased moisture uptake of westerly frontal systems.
Today, cloud bands known as tropical-temperate troughs (TTTs) account for a significant proportion of southern Africa's summer rainfall and are a major mechanism for the poleward transfer of energy (Todd and Washington, Reference Todd and Washington1999). The potential of TTTs and other forms of tropical temperate interactions (TTIs) to have been an important factor in determining synoptic-scale climate dynamics in southern Africa during the last glacial period has been highlighted and is considered to be a possible explanation for similarities in patterns of climate change across the continental interior (Chase, Reference Chase2010; Chase et al., Reference Chase, Chevalier, Boom and Carr2017). These types of synoptic systems have been identified as having an important influence on modern southern Cape climates (Engelbrecht et al., Reference Engelbrecht, Landman, Engelbrecht and Malherbe2015), and similarities evident between the Pearly Beach record and records of climate change from sites in the Namib Desert (Chase et al., Reference Chase, Niedermeyer, Boom, Carr, Chevalier, He, Meadows, Ogle and Reimer2019b; Fig. 9) suggest that the interactions between tropical and temperate regions may have been enhanced during periods of elevated southeast Atlantic SSTs and that associated cloud bands and other related disturbances may have formed further to the southwest than is common today.
Termination I ($\sim$19–11.7 cal ka BP)

At Pearly Beach, the onset of Southern Hemisphere warming and the end of the LGM is associated with more abundant moisture, as indicated by the development of coastal thicket vegetation and a reduction in succulent/drought resistant pollen from ~19–13 cal ka BP (Figs. 5 and 8). In contrast to the thicket composition of the early LGM, Canthium is the dominant taxon at ~18.4 cal ka BP (Fig. 5). Canthium is most prevalent in humid coastal regions from the Knysna region eastward (South African National Biodiversity Institute, 2020), and at Pearly Beach it is a clear indicator of warmer, moister conditions (Fig. 7), likely implying significant contributions of summer rainfall as a result of the climate system dynamics, such as TTIs and as described above. Interestingly, Canthium quickly cedes dominance to Morella, which establishes itself as the most prominent thicket taxon for the period 18–14.5 cal ka BP, broadly coincident with the HS1 chronozone (~18.5–14.6 cal ka BP).
Morella and Canthium occupy very similar climatic niches, and the progression from Canthium to Morella dominance in the thicket taxa pollen spectrum may have been due to non-climatic mechanisms related to vegetation succession, as has been noted at other southern Cape sites (cf. Quick et al. Reference Quick, Meadows, Bateman, Kirsten, Mäusbacher, Haberzettl and Chase2016). Morella species likely do occur at the site (e.g., M. quercifolia) and are associated with stabilised sand dunes. Canthium inerme and Afrocanthium mundianum are associated with coastal forests and dune thicket but may have a closer association to active stream networks than Morella. The landscape surrounding Pearly Beach comprises a low-relief coastal platform (<30 m asl) occupied by alluvial and aeolian sediments—including an extensive semi-active to primarily dormant dune field—and a significant stream network associated with upland catchments to the north and northeast. The landscape dynamics of the immediate region therefore have potential to create a complex and changing mosaic of ecological niches. Therein, the observation that peaks in Canthium effectively bracket phases of Morella dominance may be associated with differences in the response time between fluvial systems and dune fields to changes in rainfall. While dune stabilisation under more humid conditions may be a protracted process, increased rainfall would have a much more immediate impact on fluvial activity and the development of riparian zones, thus potentially favouring the early establishment of Canthium over Morella. Once the dune fields became more stable, Morella would have become more prevalent. Conversely, increased aridity may have a more immediate impact on dune field vegetation, as fluvial networks may continue to be fed by rainfall in the adjacent uplands and through groundwater discharge, maintaining higher levels of water availability at seeps and along channels.
Regardless of successional or landscape/hydrologic dynamics, the marked increase in Canthium and Morella pollen—and indeed coastal thicket taxa as a group—at ~18.5 cal ka BP, indicating a substantial increase in moisture availability, is coincident, and perhaps associated with a slowing AMOC (McManus et al., Reference McManus, Francois, Gherardi, Keigwin and Brown-Leger2004; Ng et al., Reference Ng, Robinson, McManus, Mohamed, Jacobel, Ivanovic, Gregoire and Chen2018) and a buildup of heat in the southern Atlantic (Fig. 9). As has been noted elsewhere (Chase et al., Reference Chase, Boom, Carr, Carré, Chevalier, Meadows, Pedro, Stager and Reimer2015a, Reference Chase, Niedermeyer, Boom, Carr, Chevalier, He, Meadows, Ogle and Reimer2019b), the response in terrestrial environments in southwestern Africa to changes in the AMOC associated with HS1 is not predicted to be immediate. The rapid slowdown in the AMOC at the beginning of HS1 resulted in a relatively slow, progressive buildup of heat in the South Atlantic and high southern latitudes, culminating in maximum temperatures being reached at the very end of HS1, at ~14.6 cal ka BP (Kim and Schneider, Reference Kim and Schneider2003; Farmer et al., Reference Farmer, deMenocal and Marchitto2005; Jouzel et al., Reference Jouzel, Masson-Delmotte, Cattani, Dreyfus, Falourd, Hoffmann and Minster2007; Pedro et al., Reference Pedro, van Ommen, Rasmussen, Morgan, Chappellaz, Moy, Masson-Delmotte and Delmotte2011; Fig. 9). As has been described for the LGM, these changes in SSTs in the Southeast Atlantic and oceans surrounding the southwestern Cape may have resulted in a less-seasonal rainfall regime. At such times, increased summer rainfall may have been derived from both localised precipitation systems (Jury et al., Reference Jury, Valentine and Lutjeharms1993, Reference Jury, Rouault, Weeks and Schormann1997) and the development of the aforementioned larger synoptic-scale TTTs /TTIs (Todd and Washington, Reference Todd and Washington1999), which may have been more prevalent in the region, given elevated west coast SSTs (Fig. 9). At Pearly Beach, these changes are reflected in high coastal thicket taxa pollen percentages and a strong increase in Dodonaea pollen (Fig. 5), indicating warm, humid conditions under a less-seasonal rainfall regime.
Similarities with the deglacial record from Pearly Beach are observed across a wide range of terrestrial records not only from the southern and southwestern Cape (Chase et al., Reference Chase, Boom, Carr, Carré, Chevalier, Meadows, Pedro, Stager and Reimer2015a; Quick et al., Reference Quick, Meadows, Bateman, Kirsten, Mäusbacher, Haberzettl and Chase2016) and the western margin of southern Africa (Chase et al., Reference Chase, Boom, Carr, Carré, Chevalier, Meadows, Pedro, Stager and Reimer2015a, Reference Chase, Niedermeyer, Boom, Carr, Chevalier, He, Meadows, Ogle and Reimer2019b; Lim et al., Reference Lim, Chase, Chevalier and Reimer2016)—regions under the immediate influence of the South Atlantic Anticyclone and the westerlies—but also from the ARZ (Scholtz, Reference Scholtz1986; Chase et al., Reference Chase, Chevalier, Boom and Carr2017) and the SRZ (Chevalier and Chase, Reference Chevalier and Chase2015), emphasising the subcontinental-scale influence of the slowdown of the AMOC during HS1 (Fig. 9).
HS1 ended at 14.6 ka, and at Pearly Beach this transition is marked by variable, declining levels of coastal thicket pollen and increases in pollen from xeric taxa such as Ruschia (Fig. 5). Coupled with increases in pollen from plants favouring cool/cold conditions—such as Stoebe-type and Ericaceae between ~13.9 and 12.6 cal kBP—the evidence seems to suggest that the increased AMOC strength (Ng et al., Reference Ng, Robinson, McManus, Mohamed, Jacobel, Ivanovic, Gregoire and Chen2018) that triggered cooling in the southeast Atlantic (Kim and Schneider, Reference Kim and Schneider2003; Farmer et al., Reference Farmer, deMenocal and Marchitto2005) and the high southern latitudes (e.g., Jouzel et al., Reference Jouzel, Masson-Delmotte, Cattani, Dreyfus, Falourd, Hoffmann and Minster2007)—the Antarctic Cold Reversal (Pedro et al., Reference Pedro, Bostock, Bitz, He, Vandergoes, Steig, Chase, Krause, Rasmussen and Markle2016)—resulted in relatively cool, dry conditions at Pearly Beach (Fig. 9). The subsequent Younger Dryas period is characterised by slight increases in pollen from both cool/cold and coastal thicket taxa, perhaps indicating a modest increase in winter rainfall. As has been noted elsewhere (Chase et al., Reference Chase, Boom, Carr, Carré, Chevalier, Meadows, Pedro, Stager and Reimer2015a), the magnitude of forcing associated with the Younger Dryas was substantially less than it was for HS1 and left an accordingly less distinct signature in most southwestern Africa records, with greater spatial heterogeneity.
The Holocene (7.8–0.3 cal ka BP)
No pollen was preserved in the sediments dating to ~12–7.8 cal ka BP in the Pearly Beach core. It could be speculated that the limited preservation of pollen within the Pearly Beach core during the early Holocene was a response to increased aridity, as inferred from micromammalian data from Byneskranskop, an archaeological site 8 km northwest of Pearly Beach (Faith et al., Reference Faith, Chase and Avery2018, Reference Faith, Chase and Avery2020; Thackeray, Reference Thackeray2020). Indications of relatively low moisture availability are also evident from further east within the Wilderness embayment (Martin, Reference Martin1968; Quick et al., Reference Quick, Chase, Wündsch, Kirsten, Chevalier, Mäusbacher, Meadows and Haberzettl2018), and the summer-rainfall zone (e.g., Holmgren et al., Reference Holmgren, Lee-Thorp, Cooper, Lundblad, Partridge, Scott, Sithaldeen, Talma and Tyson2003), related, in part, to increased drought stress under warmer Holocene temperatures (Chevalier and Chase, Reference Chevalier and Chase2016).
The resolution of the Holocene record allows for the identification of multimillennial trends, but it lacks the detail required to make definitive inferences regarding the primary mechanisms driving climate change. As a whole, coastal thicket pollen percentages are relatively low until the recent past, when a strong increase is observed at ~0.3 cal ka BP. This suggests generally drier Holocene conditions compared with the late Pleistocene, with a modest but notable increase in apparent humidity in the mid-Holocene, from ~6–4 cal ka BP (Figs. 5 and 9).
The recovery of high-resolution records from the southwestern Cape—from Katbakkies Pass (Chase et al., Reference Chase, Lim, Chevalier, Boom, Carr, Meadows and Reimer2015b) and Pakhuis Pass (Chase et al., Reference Chase, Boom, Carr, Chevalier, Quick, Verboom and Reimer2019a)—has enabled correlations with records for Southern Ocean SSTs and sea-ice extent (Nielsen et al., Reference Nielsen, Koç and Crosta2004) during the Holocene. These have been interpreted to indicate a phase of increased westerly influence during the mid-Holocene, which may account for the increased humidity at Pearly Beach. However, when considered in the context of other comparable records from the region, a pattern of marked spatial heterogeneity is observed (Chase et al., Reference Chase, Boom, Carr, Carré, Chevalier, Meadows, Pedro, Stager and Reimer2015a, Reference Chase, Boom, Carr, Chevalier, Quick, Verboom and Reimer2019a), particularly between coastal and interior sites (Chase and Quick, Reference Chase and Quick2018; Quick et al., Reference Quick, Chase, Wündsch, Kirsten, Chevalier, Mäusbacher, Meadows and Haberzettl2018). Furthermore, the mid-Holocene in the Cape is a period of significant climatic variability, and while efforts have been made to establish diagnostic patterns of change that can be used to infer specific drivers (Chase et al., Reference Chase, Chevalier, Boom and Carr2017, Reference Chase, Boom, Carr, Quick and Reimer2020; Chase and Quick, Reference Chase and Quick2018), the Pearly Beach record currently lacks the requisite resolution to draw meaningful conclusions in this regard. It is evident that there are significant changes in the overall vegetation composition at Pearly Beach between the deglacial and Holocene, with a clear shift from ericaceous fynbos in the late Pleistocene to other structural types of fynbos (proteoid, restioid, and asteraceous) in the middle and late Holocene. These changes are likely in response to increased Holocene temperatures and relatively drier conditions compared with HS1 and at least some phases of the LGM.
The last 500 years are characterised by a significant increase in coastal thicket (e.g., Euclea, Morella, and Sideroxylon, as well as Dodonaea, comparable to the peaks during HS1) and represent the culmination of the steady rise in Proteaceae percentages across the Holocene (Fig. 5). While the abovementioned taxa suggest more humid conditions, consistent with coeval increases in temperature and humidity as indicated by the record as a whole, there is also an increase in Amaranthaceae and Ruschia pollen, suggesting at least some phases of more arid conditions and probably an increase in climate variability. The sharp increase in thicket taxa in the sample dated to ~0.3 cal ka BP is consistent with marked changes in inferred water availability in higher-resolution records from Bo Langvlei (du Plessis et al., Reference du Plessis, Chase, Quick, Haberzettl, Kasper and Meadows2020), Seweweekspoort (Chase et al., Reference Chase, Chevalier, Boom and Carr2017), and the Namib region (Chase et al., Reference Chase, Niedermeyer, Boom, Carr, Chevalier, He, Meadows, Ogle and Reimer2019b). Again, however, the resolution of this portion of the Pearly Beach record—in terms of both pollen and radiocarbon samples—does not allow for a clearer attribution of this increase in thicket pollen to either an increase in summer rainfall following the Little Ice Age (LIA; 0.7–0.1 cal ka BP), as speculated at Bo Langvlei (du Plessis et al., Reference du Plessis, Chase, Quick, Haberzettl, Kasper and Meadows2020), or an increase in winter rainfall during the LIA, as inferred from diatom data at Verlorenvlei, on the west coast (Stager et al., Reference Stager, Mayewski, White, Chase, Neumann, Meadows, King and Dixon2012).
CONCLUSIONS
In this paper, we present new fossil pollen, microcharcoal, and sediment particle size data from a 25,000 year sediment core taken from a wetland at Pearly Beach, southwestern Cape coast of South Africa. The results reveal considerable variability in vegetation composition and, by inference, climate along the southwestern Cape coast since the onset of the LGM. We find that the Pearly Beach record is generally consistent with indications from elsewhere in southwestern Africa (Chase et al., Reference Chase, Boom, Carr, Carré, Chevalier, Meadows, Pedro, Stager and Reimer2015a, Reference Chase, Niedermeyer, Boom, Carr, Chevalier, He, Meadows, Ogle and Reimer2019b; Lim et al., Reference Lim, Chase, Chevalier and Reimer2016) that the AMOC, through its impact on regional oceanic and atmospheric circulation systems, was potentially a strong modulator of global LGM boundary conditions, resulting in phases of relatively drier conditions (~24–22.5 cal ka BP and ~22–18 cal ka BP) demarcated by brief phases of increased humidity (~24.5–24 cal ka BP and 22.5–22 cal ka BP). During Termination I, the marked increase in coastal thicket pollen at ~18.5 cal ka BP indicates a substantial increase in moisture availability, coincident and likely associated with a slowing AMOC and a buildup of heat in the southern Atlantic during HS1. The resolution of the Holocene portion of the record does not allow for definitive inferences regarding the primary mechanisms driving climate change, but it is evident that there are significant changes in the overall vegetation composition between the deglacial period and the Holocene, with a clear shift from ericaceous fynbos in the late Pleistocene to other structural types of fynbos (proteoid, restioid, and asteraceous) in the middle and late Holocene. These changes are likely in response to increased Holocene temperatures and relatively drier conditions.
Overall, the Pearly Beach record represents an important new contribution to a growing body of data that provides evidence for great spatial complexity in regional climatic responses and, more specifically, provides evidence that AMOC variability influence extended eastwards along the southwestern Cape coast at least as far as the modern boundary of the WRZ. It also provides a rare look at the response of lowland sectors of the mega-diverse CFR to major long-term climatic transitions.
Supplementary Material
The supplementary material for this article can be found at https://doi.org/10.1017/qua.2021.31.
Data Availability
The full pollen, charcoal, and particle size data sets are given in Supplementary Appendix A and will also be available on the Neotoma Palaeoecology data archive (https://www.neotomadb.org) as a contribution to the African Pollen Database.
Acknowledgments
We thank Carmen Kirchner for conducting the particle size analysis at the Department of Geography, Friedrich-Schiller-University, Jena. We also thank Rachid Cheddadi and Graciela Gil-Romera for assisting with recovery of the core.
Financial Support
LJQ acknowledges the financial assistance of the National Research Foundation (NRF) of South Africa, PAST (Palaeontological Scientific Trust), and the University of Cape Town. This study was funded in part by the European Research Council (ERC) under the European Union's Seventh Framework Programme (FP7/2007-2013)/ERC Starting Grant “HYRAX,” grant agreement no. 258657.


 Open access