


Nutrition plays a key role in supporting athletic performance; however, athletes often consume a diet inadequate to support their energy requirements and/or sporting demands(Reference Andrews and Itsiopoulos1,Reference Masson and Lamarche2) . A key role of sports nutritionists or dietitians is to educate athletes on consuming a diet that is supportive of training demands and improvement of athletic performance. This is usually achieved through nutrition education, typically in the form of face-to-face workshops or presentations(Reference Buffington, Melnyk and Morales3–Reference Philippou, Middleton and Pistos5). Although previous reviews have suggested that higher levels of knowledge are associated with an improved dietary intake, the limited number of comprehensively validated, reliable, sport-specific nutrition knowledge measures available make this relationship difficult to evaluate(Reference Trakman, Forsyth and Devlin6–Reference Spronk, Heaney and Prvan8). The availability of a valid and reliable instrument would assist practitioners with rapid screening that enables tailored education interventions, help researchers evaluate education interventions and allow the link between dietary intake and knowledge to be more thoroughly examined.
Development of valid and reliable sport-specific nutrition knowledge instruments requires the use of up-to-date sports nutrition recommendations, adaptability to different food supplies or cultures, and applicability and relevance to a wide range of athletes and sports(Reference Trakman, Forsyth and Devlin6). Furthermore, to our knowledge, there are no sports nutrition knowledge assessment instruments that use a primarily visual electronic platform to engage respondents or display food pictures to assist comprehension as it exists within some clinical populations(Reference Franklin, Holman and Tam9).
With regard to developing a useful and relevant instrument, a range of techniques to determine reliability and validity need to be considered(Reference Parmenter and Wardle10). Traditionally, classical test theory (CTT) techniques which utilise overall scores to test variables, such as item difficulty, and reliability measures, such as Cronbach’s α, have been used(Reference Parmenter and Wardle10). More recently, however, Trakman et al.(Reference Trakman, Forsyth and Hoye11) suggested the need for more instruments validated by item response theory techniques such as Rasch analysis as these techniques are currently underutilised and remain novel within the development of nutrition questionnaires. Rasch analysis has several advantages over CTT techniques including the ability to improve instrument precision, in some cases up to 125 %(Reference Gothwal, Wright and Lamoureux12,Reference Lundström and Pesudovs13) , and can specifically improve construct validity by plotting individual items along a ‘Wright map’(Reference Khine14). Rasch analysis is advantageous as it does not consider absolute test scores, unlike CTT, which cannot consider item difficulty and considers differences in knowledge as equidistant. CTT would suggest that the knowledge improvement of Person A from 50 to 60 % is equal to Person B who improves from 80 to 90 %, despite the likelihood Person B would have answered questions of greater difficulty. Meanwhile, Rasch can differentiate between respondents with equal scores by relating which questions were correctly answered and their relative difficulties(Reference Khine14,Reference Boone15) . A combination of CTT and item response theory techniques is recommended to provide a more comprehensive evaluation of an instrument’s psychometric properties(Reference Trakman, Forsyth and Hoye11,Reference He, Sun and Fan16) .
A new electronic sports nutrition questionnaire named the ‘Platform to Evaluate Athlete knowledge of Sports Nutrition Questionnaire’ (PEAKS-NQ) has been previously developed by the research team and demonstrated good content validity(Reference Tam, Beck and Gifford17) using only qualitative techniques. Therefore, the aim of the study was to further test the reliability and validity of the PEAKS-NQ using a combination of CTT techniques and Rasch analysis that comprehensively assesses up-to-date sports nutrition consensus guidelines for a wide range of athletes.
Methods
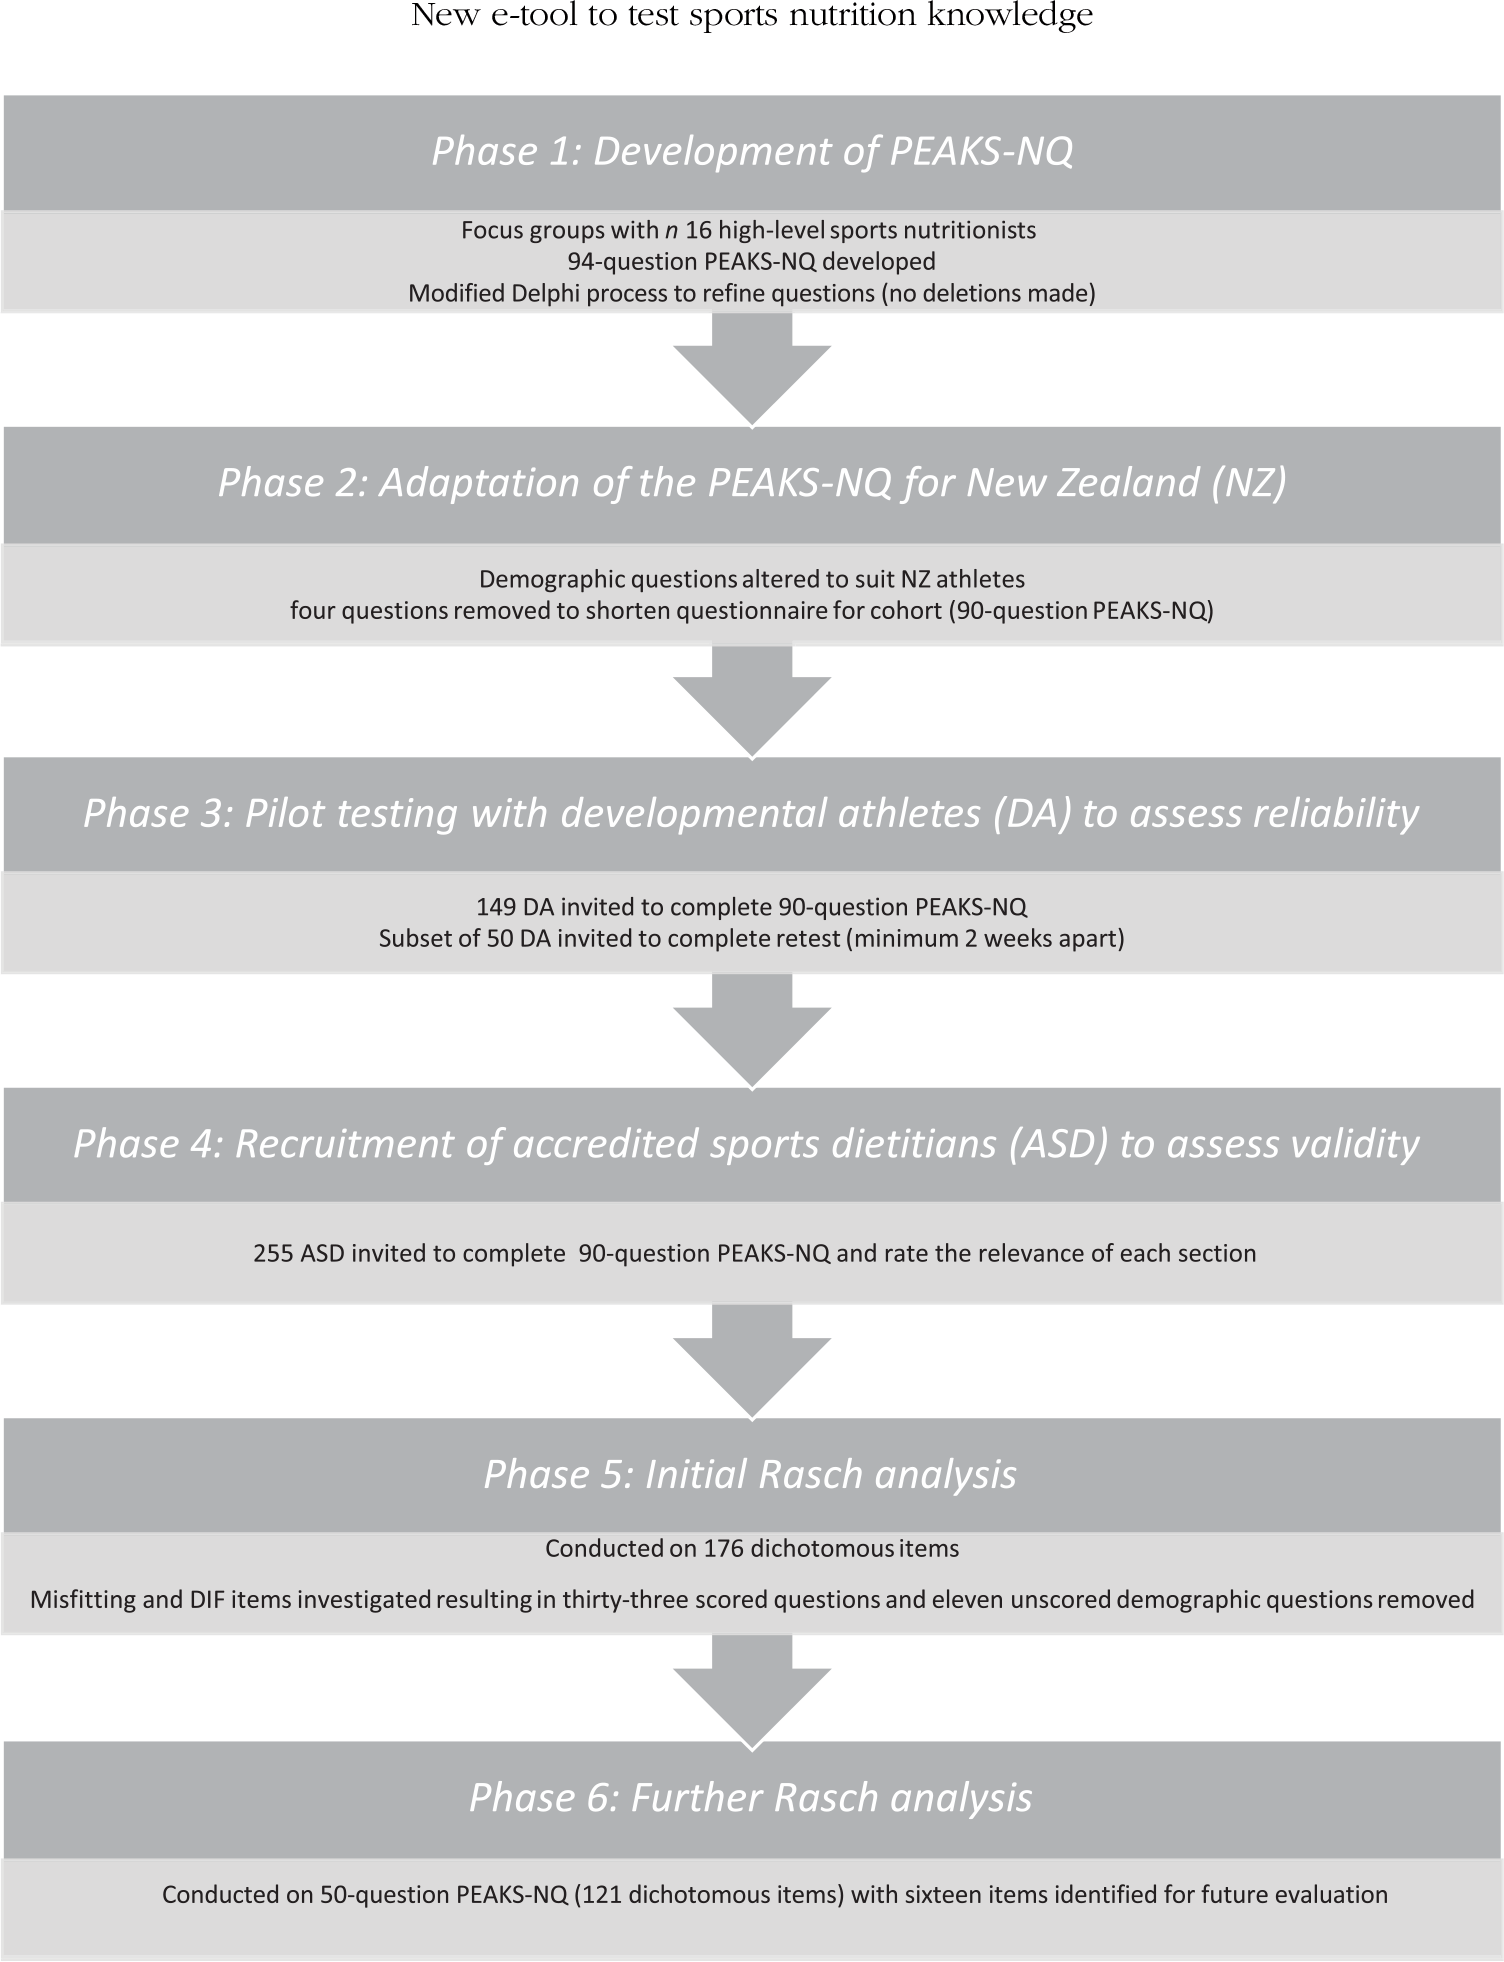
The development of PEAKS-NQ was undertaken in six phases (Fig. 1), consisting of (1) the development of the questionnaire, (2) adaptation of PEAKS-NQ for New Zealand, (3) pilot testing with developmental athletes (DA) to assess reliability, (4) validity testing with accredited sports dietitians (ASD), (5) initial Rasch analysis and (6) refinement of PEAKS-NQ by further Rasch analysis. Phase 1 has previously been reported in detail(Reference Tam, Beck and Gifford17), but a brief summary has been included to establish context.
Summary of the six-phase process for developing and testing the reliability and validity of PEAKS-NQ (Platform to Evaluate Athlete Knowledge of Sports Nutrition Questionnaire). NZ, New Zealand; DA, developmental athletes; ASD, accredited sports dietitians; DIF differential item functioning.
Phase 1: development of the Platform to Evaluate Athlete Knowledge of Sports Nutrition Questionnaire
The development of PEAKS-NQ was informed by focus group data, the scientific literature and an up-to-date sports nutrition position stand(Reference Thomas, Erdman and Burke18). The PEAKS-NQ was developed as an electronic instrument using Filemaker Pro 16 (Claris)(19) and deployed online enabling access via multiple platforms.
All items were developed in a multiple-choice format with the number of possible responses ranging between 2 and 6. A number of items (n 23) allowed the selection of multiple options as there was more than one correct response. A ‘not sure’ option was included with each item. Items in sections B–F scored one point per correct answer. Incorrect and ‘not sure’ responses resulted in zero points. For questions with multiple correct answers, participants received one point per correct answer and were deducted one point per incorrect answer to discourage selection of all available options. Negative scores were automatically adjusted and scored as zero for that item.
Following the development of PEAKS-NQ, a modified Delphi process was conducted to establish content validity(Reference Hasson, Keeney and McKenna20). A detailed description of this process has previously been published(Reference Tam, Beck and Gifford17). The PEAKS-NQ contained ninety-four questions, with a maximum score of 117 across six sections (sections A–F): (A) demographics, (B) food groups, (C) nutrients, (D) applied sports nutrition, (E) competition nutrition and (F) supplements and special concerns. The maximum scores for each section were 13 (section B), 41 (section C), 23 (section D), 23 (section E) and 17 (section F). Demographic questions (section A) (n 11) were not scored. Of the eighty-three scored questions, thirty-four (41 %) assessed sports nutrition knowledge, with twenty-three of these specifically focusing on assessing applied (‘how to’) sports nutrition knowledge, such as selecting food for specific scenarios (i.e. pre/post-training). The remainder assessed general nutrition knowledge that forms the basis for optimal sporting performance.
Phase 2: adaptation of the Platform to Evaluate Athlete Knowledge of Sports Nutrition Questionnaire for New Zealand
The instrument was modified in consultation with two experienced sports dietitians from High Performance Sport New Zealand to ensure relevance to the target group of DA. Changes were made specifically to demographic items (e.g. schooling structure and ethnicities) and four items from section E pertaining to pre-competition meal selection were removed to shorten the questionnaire as other items also assessed this knowledge domain. No further adaptation of the questionnaire was necessary as New Zealand dietitians were previously involved during the early stages of questionnaire development and had confirmed the appropriateness of foods assessed and terminology used within PEAKS-NQ for both Australian and New Zealand populations.
Phase 3: pilot testing with developmental athletes to assess reliability
To pilot test the PEAKS-NQ, purposive sampling was used for participants from the High Performance Sport New Zealand athlete pathway cohort (‘Pathway to Podium’), which targets athletes from thirteen sports that would ideally compete at the highest level within 8–10 years(21). In this paper, we refer to these participants as ‘DA’. Recruitment occurred between August 2018 and February 2019. Athletes were recruited at least 4 weeks prior to the scheduled training camps where they were to receive nutrition education. To test the reliability of the PEAKS-NQ, a subset of athletes was invited to complete the questionnaire on a second occasion with a minimum of 2 weeks between attempts prior to the scheduled training camps.
Phase 4: recruitment of accredited sports dietitians to assess validity
To assess construct and content validity, convenience sampling was used to recruit ASD registered with Sports Dietitians Australia (SDA) to complete the PEAKS-NQ. Dietitians completed an Australian-specific set of demographic questions, but the same question set (ninety questions) as New Zealand athletes. ASD registered with SDA are required to have university-level dietetic qualifications, have additional sports nutrition training, a minimum of 2 years of clinical experience and have completed minimum requirements for continuing professional development(22). An email invitation to participate was disseminated by SDA to 255 registered ASD between April and June 2019. Two separate reminder emails were sent by SDA to encourage participation during this period.
The content validity of PEAKS-NQ has previously been established qualitatively via a Delphi process(Reference Tam, Beck and Gifford17) using a select group of experts; however, to further provide evidence of content validity via quantitative methods across a larger sample, dietitians were asked to rate the relevance of each section on a four-point scale ranging from not relevant (1) to highly relevant (4), using the scale content validity index (S-CVI)(Reference Grant and Davis23). S-CVI universal agreement approach was used, where the score was calculated as a proportion of ratings that were a 3 or 4 compared with the number of experts providing a rating. A score of greater than 0·8 is acceptable(Reference Polit, Beck and Owen24). Overall S-CVI was calculated as the mean of scores across all sections.
Construct validity, defined as how well an instrument examines the construct being measured(Reference Evans, Elwyn and Edwards25), was assessed by the known-groups method (validation by extreme groups)(Reference Davidson and Michalos26). The ability of an instrument to discriminate between two groups expected to have different levels of nutrition knowledge(Reference Parmenter and Wardle10) can be used to support construct validity. Athlete scores were compared with university-qualified dietitians’ scores using independent samples median tests.
Phase 5: initial Rasch analysis
Rasch analysis is a type of item response theory, which is based on the premise that question difficulty and respondent skill are related to the probability of the question being correctly answered. Rasch requires that a scale only measures a single, unidimensional construct, in this case, nutrition knowledge. For PEAKS-NQ, Rasch can predict the probability of athletes of different knowledge levels answering items of varying difficulties (e.g. an athlete of a higher knowledge level has a greater probability of correctly answering more difficult questions and easier items will be easier for all respondents).
Data analysis using a Rasch approach
Rasch analysis, using a dichotomous model, was completed using Winsteps Software version (4.0.1)(Reference Linacre27). Questions allowing selection of multiple answers were split into individual dichotomous responses resulting in a total of 176 items. Unidimensionality was assessed using a principal component analysis of residuals. Misfitting items (infit or outfit mean square > 1·4) or those with point measure correlations <0·0 were flagged for further investigation, as these may suggest that the item is not aligned with the construct or is not well designed, for example, poorly worded, leading to confusion(Reference Fisher28). Differential item functioning (DIF) analyses were completed to explore systematic differences in responses to items between ASD and DA. Criteria for DIF were P < 0·05 and DIF contrast of +/−0·5 logits.
Reliability was assessed by the person and item reliability index on 176 items, with values >0·9 considered ‘very good’(Reference Fisher28). The person reliability index is a measure of the repeatability of placing persons along a scale measuring the same construct, whereas the item reliability index measures replicability of placing items along a scale if the sample was to remain similar(Reference Bond and Fox29).
Phase 6: refinement of Platform to Evaluate Athlete Knowledge of Sports Nutrition Questionnaire and further Rasch analysis
Using the criteria specified above, items flagged for further investigation were then individually assessed by two authors (R. T., H. O. C.) to improve question wording, ease of interpretation and to minimise ambiguity in images and response options. A summary of proposed changes was discussed with other authors (J. G., K. B.) to reach a consensus. A detailed record of items and reasons for being flagged was kept, with the final action to be taken recorded. A second Rasch analysis was then conducted with deleted items removed to evaluate changes in the validity and reliability of PEAKS-NQ. Items that were modified were kept in the analysis.
Ethical approval and consent
The research was approved by The University of Sydney Human Research Ethics Committee protocol number 2018/311. Upon commencement of the PEAKS-NQ, all participants reviewed the participant information statement and then provided consent to participate or opt-out of having their data included in the study.
Statistical analysis
Analysis of the results of PEAKS-NQ included summary statistics of means and standard deviations and numbers and percentages. Total and section scores for the PEAKS-NQ were converted to percentages to allow for comparison with other literature. For categorical data to compare the dietitians and athletes, Fisher’s exact test was used when the assumptions for the χ 2 test were not met. For quantitative data, if it was not possible to find a Box–Cox transformation so that the two-sample t test assumptions were met, the independent samples median test was used. The χ 2 goodness of fit test was used for testing proportions all being equal for competition level within DA. Internal consistency for total scores and sub-scores was assessed using Cronbach’s α. For the test–retest data, paired differences in total score and sub-scores were assessed using the non-parametric sign test as it was not appropriate to use a dependent t test due to the small sample size. Spearman’s rank correlation coefficient was used when it was not appropriate to use Pearson’s correlation to assess the relationship between the first attempt and second attempt for total score and sub-scores. Intraclass correlation (ICC) (two-way mixed-effects model, absolute agreement, single measures) was used to assess reliability between attempts. A Bland–Altman plot was used to determine mean bias and the limits of agreement, with the difference in total scores between attempts (first minus second completion) plotted against the mean total score of both attempts.
Results
The results of phase 1 (development of PEAKS-NQ) have been previously published(Reference Tam, Beck and Gifford17). After phase 2 (adaptation of the PEAKS-NQ for New Zealand), PEAKS-NQ contained a total of ninety questions, with four one-mark items removed from section E, resulting in a maximum score of 113.
Phase 3: pilot testing with developmental athletes to assess reliability
There were 149 invited athletes, of which 100 athletes completed the PEAKS-NQ at baseline. There were twelve DA who opted out of having their data collected for the study. Of the remaining eighty-eight athletes, mean age was 17·8 (sd 1·4) years and the majority (n 54, 61·4 %) were female (Table 1), of European ethnicity (n 72, 81·8 %), high-school educated (n 83, 94·3 %) and had previously received some form of nutrition education throughout their athletic career (n 72, 80·9 %). Athletes had most commonly competed at the Junior International level (n 30, 33·7 %). A variety of sports were represented; however, the majority played an intermittent/anaerobic power-based sport (athletics – power n 7; sprint cycling 6; netball 10; canoe racing 4; sailing 20 and hockey 5) (n 52, 59·1 %). Other sports were categorised as endurance sports (athletics – endurance 6; long-distance cycling 11; rowing 15 and triathlon 4). Median completion time for the questionnaire was 24·5 min.
Participant demographics (Mean values and standard deviations; percentages)
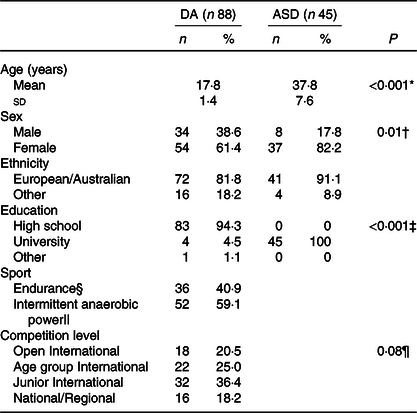
DA, developmental athletes; ASD, accredited sports dietitians.
* Box–Cox transformation (inverse age) used before performing two-sample t test.
† Independent samples t test using Box–Cox transformation of age.
‡ Fisher’s exact test, otherwise χ 2 test.
§ Endurance sports: triathlon, rowing, cycling – endurance, athletics – endurance.
|| Intermittent anaerobic power sports: netball, canoe racing, cycling – power, athletics – power, sailing, hockey.
¶ χ 2 Goodness of fit test (all proportions equal).
Athletes scored an average of 67·1 (sd 10·5) %. Athletes scored highest on section B – food groups (87·1 (sd 8·5) %), followed by section C – nutrients (73·7 (sd 10·5) %) and scored most poorly on section D – applied sports nutrition (51·1 (sd 13·8) %) (Table 2).
Comparison of scores of developmental athletes (DA) and accredited sports dietitians (ASD) (%) (Mean values and standard deviations)
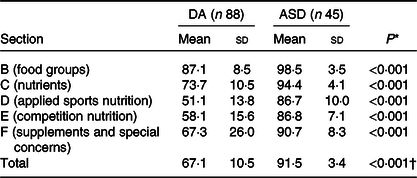
* P values for independent samples median test.
† P value for Box–Cox transformation of total score (λ = 4) and two-sample t test with unequal variances.
Test–retest reliability
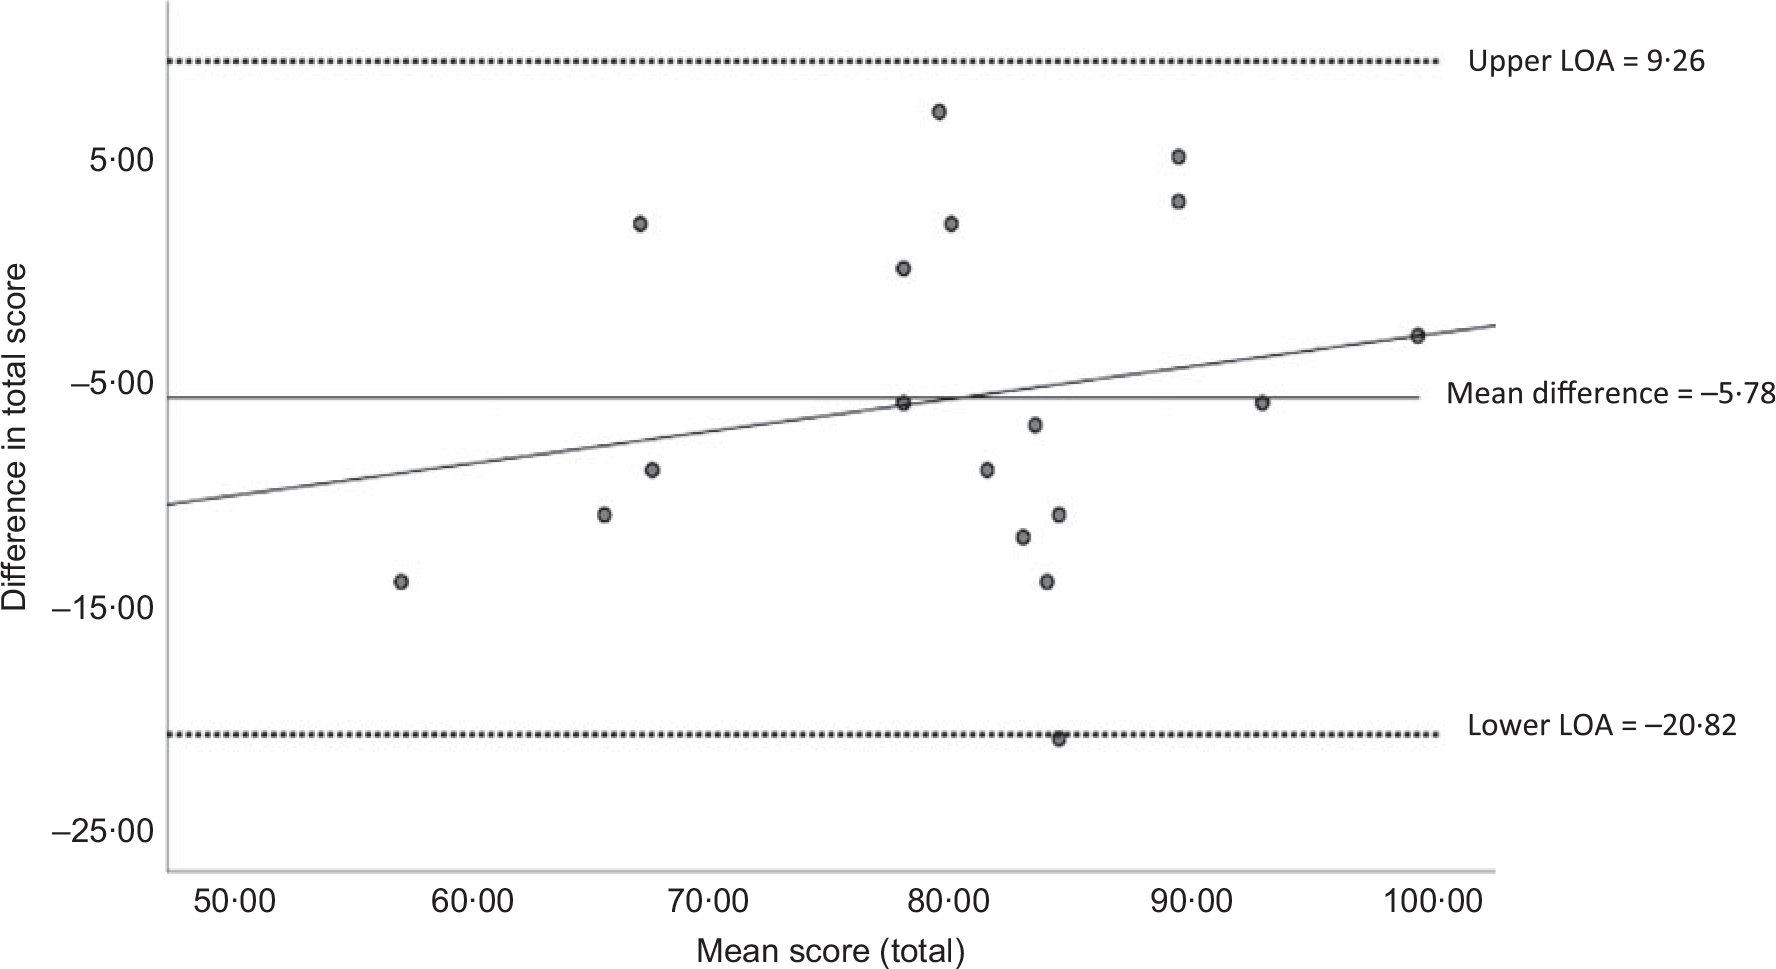
A subset of fifty-four athletes from rowing, canoeing, triathlon and athletics were invited to complete the PEAKS-NQ a second time to establish reliability, and eighteen (33·3 % response rate) completed the retest. Using matched data, no differences were observed across individual sections or total score, with athletes scoring an average of 68·5 (sd 10·5) % at baseline compared with 73·6 (sd 9·3) % at retest (P = 0·14). A strong positive relationship was found between the test and retest total scores (Pearson’s r = 0·77) as well as for each sub-score. ICC for overall score was moderate (ICC = 0·68, 95 % CI 0·22, 0·88) (Table 3). Fig. 2 shows the bias plot with the limits of agreement comparing the test and retest total scores(Reference Martin Bland and Altman30). Most measures fell between the 95 % limits of agreement with the fitted regression line (y = 0·14x−17·34) indicating no systematic bias between PEAKS-NQ attempts.
Test–retest data (n 18) (Mean values and standard deviations; correlation coefficients and 95 % confidence intervals)
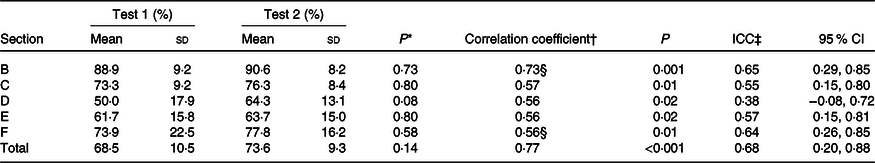
ICC, intraclass correlation.
* Non-parametric sign test applied to paired differences.
† Pearson’s correlation was used where Spearman’s correlation is not indicated.
‡ Two-way mixed-effects model, absolute agreement, single measures.
§ Spearman’s correlation was used as bivariate normality assumption did not hold.
Bland–Altman plot assessing the reliability of PEAKS-NQ (Platform to Evaluate Athlete Knowledge of Sports Nutrition Questionnaire) during test–retest. The plot shows the mean difference (____), 95 % limits of agreement (LOA; ……) and fitted regression line (____) for overall total score (test 1 – test 2), B = 0·14; P = 0·43, equation of line: y = 0·14x −17·34; R = 0·20.
Phase 4: recruitment of accredited sports dietitians to assess validity
A total of forty-five ASD completed the PEAKS-NQ, representing approximately 20 % of all accredited SDA dietitians at the time of data collection. ASD had a mean age of 37·8 (sd 7·6) years (Table 1), were mostly female (n 37, 82·2 %), of European ethnicity (n 41, 91·1 %) and with post-graduate qualifications (n 40, 88·8 %). The majority of ASD had at least 5 years of experience working with athletes (n 27, 60·0 %), were most commonly engaged as consultants to sporting teams, state-/national-level sporting institutes or organisations (n 30, 63·8 %) and worked most often with professional-, national- or international-level athletes (n 28, 59·6 %).
The mean score for ASD was 91·5 (sd 3·4) % (Table 2). Similar to the DA, ASD also scored highest on section B (98·5 (sd 3·5) %) and section C (94·4 (sd 4·1)) with the lowest score on section D (86·7 (sd 10·0) %). ASD scored higher overall (P < 0·001) and across each individual section (P < 0·001) compared with DA.
S-CVI was calculated for each section to quantitatively express relevance scores. Section C was rated highest (0·96), followed by section E (0·93), sections D (0·87) and F (0·87) and lastly section B (0·8). The average S-CVI overall was 0·88, indicating adequate relevance to support content validity. There were no ratings of 1 (not relevant) for any section.
Internal consistency
Cronbach’s α across the five scored sections of the PEAKS-NQ, calculated using combined DA and ASD data, was 0·86 (good), with scores >0·7 considered acceptable(Reference Nunnally31). Section C scored highest (0·83), followed by section D (0·72). Sections B, E and F had Cronbach’s α of 0·42, 0·50 and 0·54, respectively.
Statistical power
A post hoc calculation for power achieved was conducted using G*Power3(Reference Faul, Erdfelder and Lang32) with the calculated effect size of 3·1 and significance set at 0·05. A power of 1·0 was achieved. A previous systematic review on the effectiveness of nutrition education interventions in athletes reported a mean effect size (d) across interventions of 1·72. Based on this, it can be concluded that an adequate sample was recruited as further analysis found a 99·6 % chance of detecting a ‘large’ effect (d = 0·8) and a 85·7 % chance of detecting a ‘medium’ effect (d = 0·5)(Reference Cohen33).
Phase 5: initial Rasch analysis
The original PEAKS-NQ reported fit statistics of 1·88–0·62 for an infit mean square and an outfit mean square of 3·12–0·24. There were twenty-five items (14·2 % of items) that were flagged due to an in/outfit statistic of > 1·4 or had a negative point measure correlation (online Supplementary Material 1). Point measure correlations ranged from −0·34 to 0·75. The original PEAKS-NQ had an item reliability index of 0·92 and a person reliability index of 0·94. There were twenty-seven items within the initial analysis (15·3 %) that were identified as DIF when comparing ASD and DA.
Phase 6: refinement of Platform to Evaluate Athlete Knowledge of Sports Nutrition Questionnaire and further Rasch analysis
Revision of Platform to Evaluate Athlete Knowledge of Sports Nutrition Questionnaire
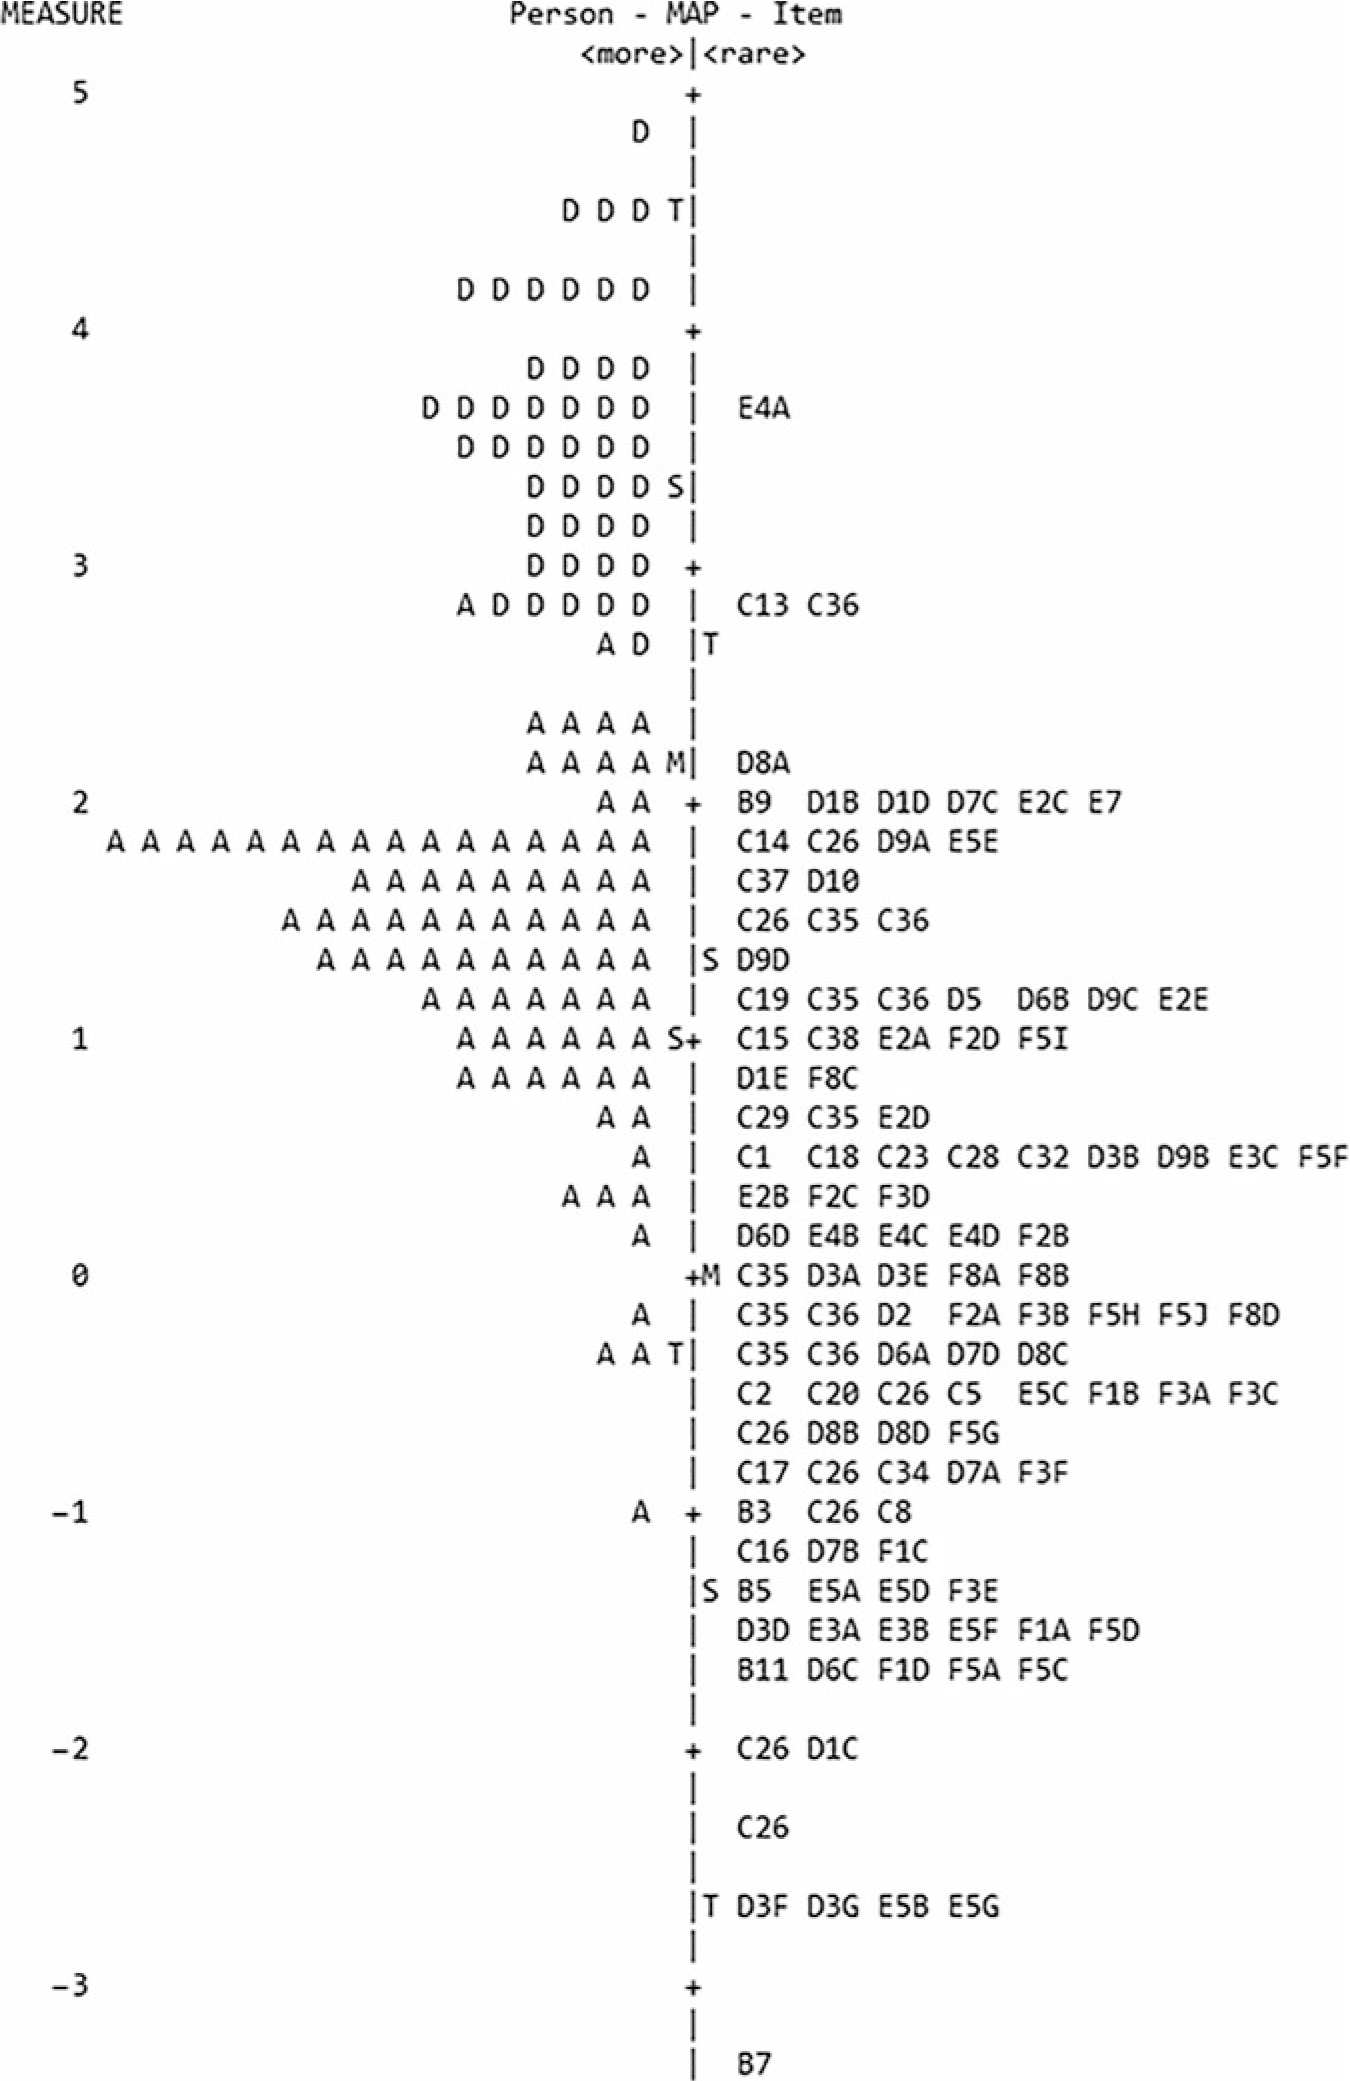
Following the initial Rasch, thirty-three questions were removed, and seven items were modified (online Supplementary Material 1). Most items (n 18) were removed from sections B (food groups) and C (nutrients) due to their level of difficulty, falling below the lowest scoring athletes, which meant they were ‘too easy’ and failed to discriminate between athletes within the cohort. Items flagged, modified or removed are summarised in online Supplementary Material 2. Several items (n 12) were removed as they were deemed as not relevant for most athletes such as nutrition for travel or nutrition for extreme environments. Item removals were also made with decreasing questionnaire completion time in mind, given that the median completion time from athlete data was approximately 25 min. Additionally, modifications were made to seven items that were flagged as DIF or misfit. These modifications included changes to wording to improve clarity such as including a time domain or exercise intensity within the question or changes to food images to reduce ambiguity. The final version of PEAKS-NQ contained fifty questions (not including demographic questions) with a maximum score of 75. To improve flow and reduce the number of screens a user had to click through, PEAKS-NQ was collapsed into two sections, general nutrition (sections B and C) and sports nutrition (sections D, E and F). The item-person map (Fig. 3) showed a logical hierarchy with the easiest items related to identifying food groups and classifying nutrients and their functions appearing at the lower end of the item map. More difficult sports nutrition concepts such as changing body composition and selecting appropriate recovery meals/nutrients appear towards the top of the map. The clear demarcation between dietitians and athletes supports PEAKS-NQ’s ability to distinguish between different knowledge levels.
Item-person map from further Rasch analysis (phase 6). Person map (left): D, accredited sports dietitian; A, developmental athletes. Persons are ranked by ability from top to bottom. Item map (right): Items are ranked by difficulty from top to bottom. ‘E4A’ corresponds to section E, question 4, option A (A/B/C… only appears for questions with multiple options). Items or persons on the same line indicate similar level of question difficulty/responder ability, respectively.
Further Rasch analysis
Following removal of several items due to results from this first analysis, a further Rasch analysis of the final version of PEAKS-NQ was conducted on fifty questions, with a maximum score of 75, which equated to 121 dichotomous items. Infit mean squares were between 2·03 and 0·73 and outfit mean squares were between 3·0 and 0·25, with thirteen items (10·7 %) flagged, compared with 14·2 % of items in the initial analysis. Point measure correlations ranged between −0·34 and 0·68. The final PEAKS-NQ had an item reliability index of 0·91 and a person reliability index of 0·92. A much smaller proportion of items (n 11) were identified as having DIF (9·1 %) compared with initial Rasch (15·3 %). A summary of questions identified for examination is available in online Supplementary Material 3.
Discussion
The aim of the study was to test the reliability and validity of an electronic sports nutrition knowledge questionnaire suitable for athletes. After using several different CTT techniques and Rasch analysis to refine the PEAKS-NQ, the final instrument contained fifty items with a total score of 75 across two sections (general nutrition and sports nutrition). The present study thoroughly tested reliability, content validity and construct validity of PEAKS-NQ, building on the content validity previously established during the development of the questionnaire(Reference Tam, Beck and Gifford17). Rasch analysis has previously been used in the development of a sports nutrition knowledge questionnaire on one occasion(Reference Trakman, Forsyth and Hoye34) and, therefore, remains a novel validation technique within this research area. In the development of PEAKS-NQ, the most up-to-date recommendations and position stands were used to ensure the relevance of questionnaire content(Reference Thomas, Erdman and Burke18).
In the present study, reliability was supported in four ways: via test–retest, internal consistency (Cronbach’s α), ICC and through Rasch analysis’ item and person reliability index. The temporal consistency of PEAKS-NQ was assessed using a test–retest protocol with a minimum of 2 weeks between assessments to minimise the effect of learning, the effect of memory and upskilling. Suggested interval between tests varies greatly from 2 days to 3 months, so long as this period is reasonably justified, and the aforementioned factors are accounted for(Reference Parmenter and Wardle10,Reference Nunnally31,Reference Streiner, Norman and Cairney35) . No significant differences were detected between tests, suggesting that the instrument would provide consistent, similar results between tests where there is no change in knowledge. The overall internal consistency was good (0·86); however, sections B, E and F had poor individual Cronbach’s α scores. The small number of questions within these individual sections may have been the cause, as it is often shown that fewer item numbers can result in lower Cronbach’s α values(Reference Streiner36). ICC indicated moderate reliability (0·68); however, this value can be affected by a lack of variability among the sampled subjects as well as small sample size(Reference Koo and Li37). Reliability was further assessed by Rasch analysis with excellent person and item reliability index scores on the original version of PEAKS-NQ (0·94 and 0·92, respectively) suggesting good precision in the placement of people along the nutrition knowledge scale and the consistency of item placement along the measure within the same population(Reference Bond and Fox29). These scores remained high in the final iteration of PEAKS-NQ (0·92 and 0·91) suggesting that the tool remained reliable even with items removed. Further assessment is needed to establish the reliability of the final PEAKS-NQ with its two section (general nutrition, sports nutrition) formats to help determine suitability for use as standalone assessments.
The content validity of the PEAKS-NQ was first assessed in the development of PEAKS-NQ, where nutrition experts completed a modified Delphi process to provide feedback and inform the instrument(Reference Tam, Beck and Gifford17). In the present study, the content validity of the instrument was further established by having forty-five ASD rate each section of the questionnaire for relevance. This represented a large proportion (almost 20 %) of all dietitians who have completed additional sports nutrition training within the Australian professional association. Section B (food groups) had the lowest relevance score and the lowest internal consistency. The former was likely due to the low difficulty of the items and, together with the lower internal consistency, resulted in the removal of seven items from this section. Conversely, section C (nutrients) which tested primarily general nutrition (e.g. identification of food sources of nutrients, macro- and micronutrient function) had the highest relevance (0·96), supporting findings from a previous study that indicated its importance to overall sports nutrition knowledge(Reference Tam, Beck and Gifford17). The high relevance score across each section and overall (0·88) is supportive of the content validity of the PEAKS-NQ. More importantly, input from these nutrition professionals is invaluable in ensuring that the tool is appropriate for use within day-to-day practice(Reference Grant and Davis23,Reference Davis38,Reference Zamanzadeh, Rassouli and Abbaszadeh39) and would suggest that the questionnaire would be positively received by the profession; however, a detailed process evaluation would help confirm its feasibility in practice. Future directions should include evaluation from both athlete and practitioner perspectives about the practicality, usefulness, length, feel and design of the tool to facilitate continual improvement and longevity of the instrument.
Construct validity was evaluated via the known-groups method(Reference Hattie and Cooksey40), by comparing DA who were expected to have a lower level of nutrition knowledge to sports nutrition professionals(Reference Parmenter and Wardle10). Construct validity of the PEAKS-NQ was established in the present study because the instrument clearly distinguished between the two groups, with ASD scoring better across each section and overall (P < 0·001). The construct validity of the tool was also supported by the item-person map (Fig. 3), which visually illustrates a distinct demarcation between DA and ASD as question difficulty increased.
Several items (n 23) were removed after the initial Rasch analysis due to lower relevance, difficulty, threat to unidimensionality and/or DIF, as well as to reduce the completion time of the questionnaire. Wording changes, such as the inclusion of training times, were made to improve the clarity of the questions, for example, ‘You are training twice a day…’ to ‘You are training twice a day, once at 9 am and again at 3 pm’. Images were also changed to reduce ambiguity, for example, ‘fluid’ originally represented by milk was replaced for water. Questions that were modified were not removed from the further Rasch analysis, but despite this, a much smaller proportion of items were flagged for misfit or DIF, indicating that the tool became more unidimensional, thus supporting the notion of the PEAKS-NQ as a valid instrument.
Strengths and limitations
A strength of the study was that the development of the questionnaire and the use of cohorts from both countries within the validation process demonstrated that the PEAKS-NQ was appropriate for use across both Australia and New Zealand. The results of the study also suggested that PEAKS-NQ would be appropriate for high-school-aged athletes and above and is applicable to a range of sport types. However, as has been done with other nutrition knowledge questionnaires(Reference Hendrie, Cox and Coveney41,Reference Ferro-Lebres, Moreira and Ribeiro42) , adaptation of questions is necessary to ensure relevance to the culture and food supply of the country where the questionnaire intends to be used. Therefore, the validity and reliability of PEAKS-NQ should be re-established prior to deployment within other countries. An additional strength is the use of a combination of CTT and item response theory techniques to assess reliability and validity that have not otherwise been utilised in the majority of recently developed questionnaires(Reference Blennerhassett, McNaughton and Cronin43–Reference Karpinski, Dolins and Bachman46). The PEAKS-NQ also uniquely utilises pictures and food photography to help improve comprehension and understanding of the questions(Reference Houts, Doak and Doak47,Reference Silk, Sherry and Winn48) and provides a visually appealing platform. Such platforms have seen positive results in clinical populations and have been reported as more user-friendly than paper-based equivalents(Reference Franklin, Holman and Tam49).
A primary limitation of the study is the relatively small sample size in which the PEAKS-NQ was administered. The sample of 133 (including both ASD and DA) is relatively small compared with that recommended within the literature for CTT validation techniques, suggested to be between five persons per item (where there are more than 100 subjects in the sample) and as large as ten persons per item(Reference McCoach, Gable and Madura50,Reference Osborne and Costello51) . Others have suggested an adequate sample to be more respondents than the number of questions(Reference Parmenter and Wardle10). However, for Rasch modelling, a sample size of 100 has been considered adequate(Reference Chen, Lenderking and Jin52), whereas other authors report that smaller sample sizes (n 20) did not differ significantly to large samples (n 200)(Reference Gregg and Peabody53). Logistical limitations including athlete’s lack of access to stable internet at training camps for the completion of PEAKS-NQ may have affected completion rate. Furthermore, athletes were not supervised during the completion of the questionnaire and may have received some assistance, possibly affecting the overall score. Although the sample was small, diverse sports were included within the present study suggesting that the PEAKS-NQ can be used across a range of sporting disciplines.
The final iteration of a fifty-item PEAKS-NQ is estimated to be completed in 15 min, down from the median completion time of 24·5 min for the original PEAKS-NQ; however, this needs further testing for confirmation. The literature is varied on the relationship between questionnaire length and response rate, with some finding no effect(Reference Bolt, van der Heide and Onwuteaka-Philipsen54) and others suggesting that it could possibly influence careless responding(Reference Gibson and Bowling55). One of the key considerations made for questionnaire length was to provide users a feasible and rapid snapshot of an athlete’s knowledge that could be easily incorporated into standard screening procedure. Other literature suggests that regardless of length, questionnaire content and motivation levels are the biggest moderators of completion(Reference Rolstad, Adler and Rydén56). Within the PEAKS-NQ, the use of visual aids and engaging interface may assist motivation and the reduced questionnaire length may result in an improved uptake by nutrition professionals into their regular practice.
The majority of DA included in the present study had some previous nutrition education. While PEAKS-NQ demonstrated the ability to distinguish between nutrition experts and DA, whether the instrument is sensitive enough to differentiate between those likely to have less sports nutrition knowledge such as less experienced, recreational or athletes without prior nutrition education is not known.
Conclusion
The present study resulted in the development of a valid and reliable fifty-item sports nutrition knowledge questionnaire for a wide range of athlete types. PEAKS-NQ demonstrated good content validity, construct validity and reliability with electronic deployment offering a visually appealing platform to drive user engagement and improved data capture. PEAKS-NQ fills a gap in the assessment of athlete’s knowledge of sports nutrition which has previously been difficult to evaluate due to the scarcity of valid and reliable instruments. The use of PEAKS-NQ will allow practitioners to identify gaps within knowledge, tailor education and give researchers the ability to evaluate the effectiveness of nutrition education interventions.
Acknowledgements
This paper is dedicated to the memory of Associate Professor Helen O’Connor, who sadly passed away during the preparation of this manuscript.
This research received no specific grant from any funding agency, commercial or not-for-profit sectors.
R. T., J. G., K. B. and H. O. C. formulated the research question and designed the study. R. T., T. H. and K. B. were responsible for the collection of data. T. P., J. N. S. and R. T. led the analysis of data and J. G. and V. F. contributed to the interpretation of findings. All authors revised and contributed to the manuscript. All authors (except H. O. C.) gave approval to the final version of the manuscript.
There are no conflicts of interest.
Supplementary material
For supplementary material referred to in this article, please visit https://doi.org/10.1017/S0007114520004286


