


Statement of Research Significance
Research Question(s) or Topic(s): This paper investigates the potential of cognitive dispersion as an early indicator of cognitive decline, with a focus on differentiating individuals likely to develop Alzheimer’s disease from those who are not. Main Findings: While cognitive dispersion distinguishes individuals with amnestic mild cognitive impairment who progress to Alzheimer’s disease from those who remain stable, it does not show the same sensitivity at the earlier stage of subjective cognitive decline. Study Contributions: As a low-cost, non-invasive metric readily obtainable from standard neuropsychological testing, cognitive dispersion provides insight into early cognitive alterations, offering a complementary tool to traditional measures for clinical interpretation.
Introduction
Mild cognitive impairment (MCI) represents a transitional stage between normal aging and the clinical phase of Alzheimer’s disease (AD) (Albert et al., Reference Albert, DeKosky, Dickson, Dubois, Feldman, Fox, Gamst, Holtzman, Jagust, Petersen, Snyder, Carrillo, Thies and Phelps2011), characterized by objective cognitive deficits without significant functional impairment in daily living, predominantly affecting memory in the case of AD (Albert et al., Reference Albert, DeKosky, Dickson, Dubois, Feldman, Fox, Gamst, Holtzman, Jagust, Petersen, Snyder, Carrillo, Thies and Phelps2011; Petersen, Reference Petersen and Petersen2003). About 10–15% of individuals with MCI progress to AD annually (Drew, Reference Drew2018), and neuropsychological assessment has proven useful in helping differentiate those who will convert from those who will not (Belleville et al., Reference Belleville, Fouquet, Hudon, Zomahoun and Croteau2017). Several studies have shown that episodic and semantic memory impairments represent the earliest manifestations of AD and occur alongside biomarkers such as amyloid burden and Tau pathology (Amieva et al., Reference Amieva, Le Goff, Millet, Orgogozo, Pérès, Barberger-Gateau, Jacqmin-Gadda and Dartigues2008; Bondi et al., Reference Bondi, Jak, Delano-Wood, Jacobson, Delis and Salmon2008; Didic et al., Reference Didic, Barbeau, Felician, Tramoni, Guedj, Poncet and Ceccaldi2011; Gleason et al., Reference Gleason, Norton, Anderson, Wahoske, Washington, Umucu, Koscik, Dowling, Johnson, Carlsson and Asthana2018). Unlike biomarkers, however, cognitive tests are non-invasive, widely available, and easy to administer.
In the past decade, research has increasingly focused on subjective cognitive decline (SCD), defined as a self-reported decline in cognition without objective impairment (Jessen et al., Reference Jessen, Amariglio, van Boxtel, Breteler, Ceccaldi, Chételat, Dubois, Dufouil, Ellis, van der Flier, Glodzik, van Harten, de Leon, McHugh, Mielke, Molinuevo, Mosconi, Osorio and Perrotin2014, Reference Jessen, Amariglio, Buckley, Van Der Flier, Han, Molinuevo, Rabin, Rentz, Rodriguez-Gomez, Saykin, Sikkes, Smart, Wolfsgruber and Wagner2020). Jessen et al. (Reference Jessen, Amariglio, Buckley, Van Der Flier, Han, Molinuevo, Rabin, Rentz, Rodriguez-Gomez, Saykin, Sikkes, Smart, Wolfsgruber and Wagner2020) further highlight memory complaints and concerns accompanying this self-perceived decline as potential risk markers for future decline. Progression rates are estimated at 27% from SCD to MCI and at 14% from SCD to dementia (Mitchell et al., Reference Mitchell, Beaumont, Ferguson, Yadegarfar and Stubbs2014), with longitudinal data suggesting that SCD may precede dementia by up to a decade (Verlinden et al., Reference Verlinden, van der Geest, de Bruijn, Hofman, Koudstaal and Ikram2016). SCD may therefore represent the earliest behaviorally detectable phase of AD (Sperling et al., Reference Sperling, Aisen, Beckett, Bennett, Craft, Fagan, Iwatsubo, Jack, Kaye, Montine, Park, Reiman, Rowe, Siemers, Stern, Yaffe, Carrillo, Thies, Morrison-Bogorad and Phelps2011), a view supported by evidence of AD-related pathology (Tau protein, Aβ42, gray matter loss) in non-MCI individuals reporting memory complaints (Barnes et al., Reference Barnes, Schneider, Boyle, Bienias and Bennett2006; Kryscio et al., Reference Kryscio, Abner, Cooper, Fardo, Jicha, Nelson, Smith, Van Eldik, Wan and Schmitt2014; Saykin et al., Reference Saykin, Wishart, Rabin, Santulli, Flashman, West, McHugh and Mamourian2006; Van Harten et al., Reference Van Harten, Visser, Pijnenburg, Teunissen, Blankenstein, Scheltens and Van Der Flier2013). However, memory complaints are not specific to AD and may reflect factors such as depression, medication, or sleep disturbances, leading to transient symptoms that resolve over time. SCD can also remain stable in older adults (Jessen et al., Reference Jessen, Amariglio, Buckley, Van Der Flier, Han, Molinuevo, Rabin, Rentz, Rodriguez-Gomez, Saykin, Sikkes, Smart, Wolfsgruber and Wagner2020). Consequently, identifying individuals at risk of progressing to AD remains challenging, particularly since standard neuropsychological tests are typically normal in SCD, underscoring the need for more sensitive markers of early change.
A neuropsychological marker that may aid early detection of AD is intra-individual variability (IIV), which reflects fluctuations in cognitive performance across or within domains for a single individual, providing an index of cognitive performance consistency (Roalf et al., Reference Roalf, Quarmley, Mechanic-Hamilton, Wolk, Arnold and Moberg2016). While some variability is expected, excessive IIV may indicate underlying pathology, and recent work has aimed to standardize its calculation and establish reference values for clinical use (Kiselica et al., Reference Kiselica, Kaser, Weitzner, Mikula, Boone, Woods, Wolf and Webber2024). IIV is typically operationalized in two ways: (1) dispersion (IIV-D), calculated as the standard deviation of z-transformed test scores across or within domains (Holtzer et al., Reference Holtzer, Verghese, Wang, Hall and Lipton2008; Kälin et al., Reference Kälin, Pflüger, Gietl, Riese, Jäncke, Nitsch and Hock2014), or (2) inconsistency (IIV-I), generally measured by the standard deviation of multiple trials on a reaction time task (Bielak et al., Reference Bielak, Hultsch, Strauss, MacDonald and Hunter2010). The present study focuses on IIV-D, as IIV-I is beyond the scope of this paper. Quantifying within-person variability provides a more subtle assessment of cognitive functioning, complementing traditional approaches that compare mean scores to a normative sample (i.e. inter-individual variability). IIV-D can be examined across multiple cognitive domains or within a single domain (DesRuisseaux & Suchy, Reference DesRuisseaux and Suchy2025). In the context of prodromal AD, within-domain IIV-D in verbal memory may be particularly informative. In this regard, the use of scores from the Rey Auditory Verbal Learning Test (RAVLT) appears particularly well suited. For instance, Thomas, Edmonds, et al. (Reference Thomas, Edmonds, Eppig, Salmon and Bondi2018) adopted a process score approach based on the RAVLT, focusing on specific learning features know to be affected in aMCI and early AD, including a flattened learning slope and an increased likelihood of interference and intrusion errors. The authors showed that individuals with subtle cognitive decline who exhibited impaired RAVLT process scores at baseline were more likely to progress to MCI. Building on this work, the present study uses RAVLT process scores to quantify within-domain IIV in verbal memory as a marker of early cognitive change.
Several studies have explored the relationship between high IIV-D on neuropsychological measures and neuropathology in aging (Aita et al., Reference Aita, Del Bene, Knapp, Demming, Ikonomou, Owen, Campbell, Wagaman, Borgogna, Caron, Roth and Hill2025). IIV-D has been shown to increase with dementia severity, within-domain IIV-D distinguishing cognitively healthy and MCI groups, and across-domain IIV-D differentiating MCI and AD (Kälin et al., Reference Kälin, Pflüger, Gietl, Riese, Jäncke, Nitsch and Hock2014). Elevated IIV-D has also been observed in other neurodegenerative disorders, including fronto-temporal dementia (Murtha et al., Reference Murtha, Cismaru, Waechter and Chertkow2002), dementia with Lewy bodies (Webber et al., Reference Webber, Kiselica, Mikula and Woods2022), and Huntington’s disease (Musso et al., Reference Musso, Westervelt, Long, Morgan, Woods, Smith, Lu and Paulsen2015). Longitudinal studies indicate that high baseline IIV-D predicts later AD (Bangen et al., Reference Bangen, Weigand, Thomas, Delano-Wood, Clark, Eppig, Werhane, Edmonds and Bondi2019; Gleason et al., Reference Gleason, Norton, Anderson, Wahoske, Washington, Umucu, Koscik, Dowling, Johnson, Carlsson and Asthana2018; Holtzer et al., Reference Holtzer, Verghese, Wang, Hall and Lipton2008) and Parkinson’s disease (Davis et al., Reference Davis, Sivaramakrishnan, Rolin and Subramanian2025; Jones et al., Reference Jones, Burroughs, Apodaca and Bunch2020), with prediction improved when IIV-D is combined with global cognitive scores (Roalf et al., Reference Roalf, Quarmley, Mechanic-Hamilton, Wolk, Arnold and Moberg2016; Watermeyer et al., Reference Watermeyer, Goerdten, Johansson and Muniz-Terrera2021). Moreover, higher IIV-D correlates with greater Aβ pathology and may serve as an early marker of AD-related brain changes (Holmqvist et al., Reference Holmqvist, Thomas, Edmonds, Calcetas, Edwards and Bangen2023; Meeker & Waring, Reference Meeker and Waring2019).
Although IIV-D is a promising marker of AD progression, longitudinal studies comparing progressors and non-progressors are scarce, particularly at the SCD stage, and the cognitive drivers of IIV-D are not well defined. Given early episodic and semantic memory disturbances in AD (Belleville et al., Reference Belleville, Fouquet, Hudon, Zomahoun and Croteau2017; Joubert et al., Reference Joubert, Gardy, Didic, Rouleau and Barbeau2021), these domains likely contribute to both IIV-D and progression. Using a longitudinal design, this study examines changes in IIV-D across the disease continuum, including SCD, and characterizes it using multiple within- and across-domain indices. We assessed IIV-D in healthy controls (HC), SCD, aMCI, and AD participants from the CIMA-Q (Belleville et al., Reference Belleville, LeBlanc, Kergoat, Calon, Gaudreau, Hébert, Hudon, Leclerc, Mechawar, Duchesne and Gauthier2019), with SCD and aMCI groups followed over 2–8 years. We compared baseline IIV-D across groups, expecting a gradual increase (HC < SCD < aMCI < AD), and between SCD and aMCI progressors versus non-progressors, hypothesizing higher IIV-D in progressors, particularly in episodic memory, using both standard neuropsychological measures and variability indices.
Methods
The data used in this article were obtained from the Consortium for the Early Identification of Alzheimer’s Disease – Quebec (CIMA-Q; Belleville et al., Reference Belleville, LeBlanc, Kergoat, Calon, Gaudreau, Hébert, Hudon, Leclerc, Mechawar, Duchesne and Gauthier2019), a research group founded in 2013 through initial funding from the Fonds de Recherche du Québec – Pfizer. The long term research effort of CIMA-Q is to build a cohort of elderly men and women characterized in terms of clinical outcomes, cognition, neuroimaging, and biological samples with the following objectives: (a) to establish early diagnosis of Alzheimer’s disease; (b) to provide the scientific community with a well-characterized cohort; (c) to identify new therapeutic targets allowing to prevent or slow down cognitive decline and Alzheimer’s disease (d) via subsequent clinical studies. CIMA-Q represents a common effort by several researchers from Quebec affiliated with Université Laval, McGill University, Université de Montréal, and Université de Sherbrooke. It is led by principal investigator and director Dr Sylvie Belleville from the Centre de recherche de l’Institut universitaire de gériatrie de Montréal, affiliated with the Centre Intégré Universitaire de Santé et de Services Sociaux du Centre-Sud-de-l’Île-de-Montréal. Since 2014, CIMA-Q has recruited over 400 participants with subjective cognitive impairment, MCI, or Alzheimer’s disease. Volunteers were recruited from memory clinics, through advertisements posted in the community, and among participants in the NuAge study (Gaudreau et al., Reference Gaudreau, Morais, Shatenstein, Gray-Donald, Khalil, Dionne, Ferland, Fülöp, Jacques, Kergoat, Tessier, Wagner and Payette2007). The present study was conducted in accordance with the Declaration of Helsinki and approved by the CER-VN_IUGM ethics board and CIMA-Q. Further details are available in the reference article by Belleville et al. (Reference Belleville, LeBlanc, Kergoat, Calon, Gaudreau, Hébert, Hudon, Leclerc, Mechawar, Duchesne and Gauthier2019).
Participants
The CIMA-Q protocol includes longitudinal neuropsychological, neuropsychiatric, and clinical assessments, neuroimaging, and biological sampling of participants. Prior to participation, participants completed a telephone screening during which the project was explained, informed verbal consent was obtained, and the presence of a memory complaint with or without concerns was documented. Exclusion criteria included age < 65 years, central nervous system disease, severe depression (Patient Health Questionnaire [PHQ-9] > 19; Kroenke et al., Reference Kroenke, Spitzer and Williams2001), significant functional impairment (Clinical Dementia Rating [CDR] > 1.0; Berg, Reference Berg1988), or severe cognitive impairment (Mini-Mental State Examination [MMSE] < 17; Folstein et al., Reference Folstein, Folstein and McHugh1975). At baseline, participants completed clinical evaluations and questionnaires assessing health, lifestyle, cognitive complaints, functional impact, and clinical, emotional and behavioral symptoms. During the second visit, blood samples were collected, followed by a standardized neuropsychological and neuropsychiatric evaluation administered by a CIMA-Q certified psychometrician. Consenting participants also underwent magnetic resonance imaging and/or positron emission tomography and/or lumbar puncture for cerebrospinal fluid (CSF) collection. CSF analyses measured levels of amyloid-β (38, 40, 42) and total Tau protein.
Because CIMA-Q aims to identify individuals at risk of developing AD, participants underwent comprehensive follow-up assessments every two years after baseline (2-, 4-, 6-, and 8-year visits), which included clinical, neuropsychological, and neuropsychiatric evaluations, as well as blood samples and neuroimaging when applicable. It must be noted however that not all participants completed every follow-up.
Participants were classified at baseline as healthy conrols (HC), subjective cognitive decline (SCD), amnestic mild cognitive impairment (aMCI), or Alzheimer’s disease (AD) based on a cognitive complaint question (Jessen et al., Reference Jessen, Amariglio, van Boxtel, Breteler, Ceccaldi, Chételat, Dubois, Dufouil, Ellis, van der Flier, Glodzik, van Harten, de Leon, McHugh, Mielke, Molinuevo, Mosconi, Osorio and Perrotin2014), Logical Memory delayed recall from the Wechsler Memory Scale – III (WMS-III; Wechsler, Reference Wechsler1997), the Montreal Cognitive Assessment (MoCA; Nasreddine et al., Reference Nasreddine, Phillips, Bédirian, Charbonneau, Whitehead, Collin, Cummings and Chertkow2005), the CDR, and NIA-AA criteria (Montine et al., Reference Montine, Phelps, Beach, Bigio, Cairns, Dickson, Duyckaerts, Frosch, Masliah, Mirra, Nelson, Schneider, Thal, Trojanowski, Vinters and Hyman2012). Detailed cut-offs are provided in Appendix A. Controls and SCD were distinguished using the question, “Do you think that your memory is getting worse?” Responding “No” or “Yes, but I’m not worried about it” indicated HC, whereas “Yes, and it worries me” indicated SCD. Early and late aMCI participants were combined into a single group for the purposes of this study. Moreover, the AD group consisted of participants with mild Alzheimer’s disease. SCD and aMCI participants were further categorized as progressors (advancing to a more severe stage at follow-up) or non-progressors (remaining stable or returning to normal). Progression status was determined by comparing diagnoses at baseline and at final follow-up. SCD progressors were individuals who converted to aMCI or AD, whereas aMCI progressors were those who converted to AD or progressed from early to late aMCI. The final sample included 308 participants with at least one follow-up: HC (n = 67), SCD (n = 126; 34 progressors, 92 non-progressors), aMCI (n = 79; 29 progressors, 50 non-progressors), and AD (n = 36). Further details on progression are provided in Appendix B.
Clinical assessment
Clinical assessment included questionnaires covering cognitive reserve (Bartres Cognitive Reserve questionnaire; Rami González et al., Reference Rami González, Valls Pedret, Bartrés Faz, Caprile Elola-Olaso, Solé Padullés, Castellví Sampol, Olives Cladera, Bosch Capdevila and Molinuevo Guix2011), including factors such as education, language, and occupation; cognitive complaint (Questionnaire d’auto-évaluation de la mémoire [QAM]; Clément et al., Reference Clément, Belleville and Gauthier2008); daytime sleepiness (Epworth Sleepiness Scale; Johns, Reference Johns1991); perceived cognitive change in domains such as memory, attention, and executive function (Cognitive Change Index [CCI]; Rattanabannakit et al., Reference Rattanabannakit, Risacher, Gao, Lane, Brown, McDonald, Unverzagt, Apostolova, Saykin and Farlow2016); insomnia (Insomnia Severity Index [ISI]; Morin, Reference Morin1993); anxiety (Geriatric Anxiety Inventory [GAI]; Pachana et al., Reference Pachana, Byrne, Siddle, Koloski, Harley and Arnold2007); depression (Geriatric Depression Scale [GDS-30]; Yesavage et al., Reference Yesavage, Brink, Rose, Lum, Huang, Adey and Leirer1982); and vascular dementia risk (Hachinski Ischemic Scale; Hachinski et al., Reference Hachinski, Iliff, Zilhka, Du Boulay, McAllister, Marshall, Russell and Symon1975).
Neuropsychological assessment
Tests included in the neuropsychological assessment were selected for their strong predictive value for identifying MCI or AD. In the current study, these tests were grouped into four composite indices based on cognitive domain: (1) an episodic memory composite index comprising two delayed recall scores – one from the Logical Memory subtest of the WMS-III (Wechsler, Reference Wechsler1997), and another from the RAVLT (Rey, Reference Rey1958); (2) a language composite index including scores from the Categorical Verbal Fluency test (animals; Delis et al., Reference Delis, Kaplan and Kramer2001) and the Vocabulary subtest of the Wechsler Adult Intelligence Scale – 3rd Edition (WAIS-III; Wechsler, Reference Wechsler2019); (3) a frontal/subcortical composite index consisting of the Trail Making Test (TMT; Army Individual Test Battery, 1944) B/A time ratio and the WAIS-III Digit Symbol Substitution subtest total score; and (4) a visuospatial functioning composite index comprising the Object Decision and Line Orientation subtests from the Birmingham Object Recognition Battery (BORB; Riddoch & Humphreys, Reference Riddoch and Humphreys1993).
IIV indices
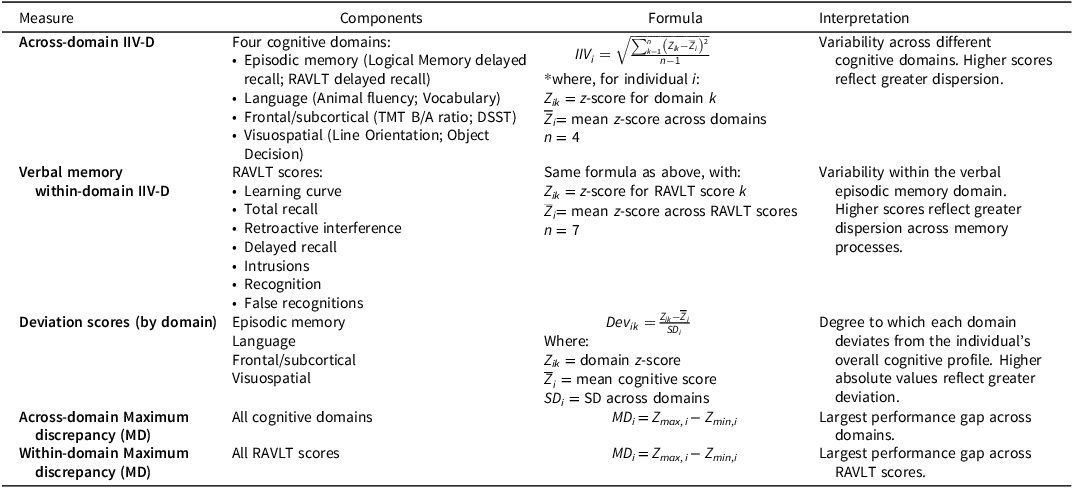
Details for each variability measure are provided in Table 1. Across-domain dispersion was calculated by converting raw scores to z-scores based on the CIMA-Q healthy control group, averaging the two subtests within each domain to obtain composite z-scores, and computing their standard deviation, following the established method by Holtzer et al. (Reference Holtzer, Verghese, Wang, Hall and Lipton2008).
Description of all variability measures

Table 1. Long description
The table presents a detailed description of variability measures across different cognitive domains, verbal memory, and deviation scores by domain. It includes four main components: across-domain variability, verbal memory within domains, deviation scores by domain, and across-domain performance variability. Each component is broken down into specific measures and formulas used to calculate them. For example, across-domain variability includes episodic memory, executive function, language, and visuospatial domains, with formulas for computing variability within these domains. Verbal memory within domains focuses on RAVLT scores, including learning curve, retroactive interference, and episodic memory. Deviation scores by domain measure how each domain deviates from the individual’s overall cognitive profile. Across-domain performance variability includes measures like maximum discrepancy and intra-individual variability across all cognitive domains and RAVLT scores.
Note: DSST = Digit Symbol Substitution Test, IIV-D = intra-individual variability – dispersion, MD = maximum discrepancy, RAVLT = Rey Auditory Verbal Learning Test, TMT = Trail Making Test.
*Following established method by Holtzer et al. (Reference Holtzer, Verghese, Wang, Hall and Lipton2008).
Within-domain episodic memory variability (verbal memory IIV-D) was derived from seven RAVLT scores, including both standard and process scores: learning curve (difference between trial 5 and trial 1), total recall across trials, retroactive interference (list A recall after list B), delayed recall, intrusions, recognition, and false recognitions. Dispersion was computed using the same procedure as across-domain dispersion, relying instead on the standard deviation of z-score-converted RAVLT scores. Although the RAVLT delayed recall score contributed to both within- and across-domain indices, this was considered acceptable for the purposes of this study as these were not directly compared. Deriving IIV-D from both standard and process scores enables the assessment of subtle within-domain fluctuations. In this context, the RAVLT serves as the most detailed and sensitive memory measure in the CIMA-Q battery, offering multiple indices derived from a single test.
To determine which cognitive domains contributed most to the observed dispersion, we also computed domain-specific deviation indices. A global cognitive score was calculated for each participant by averaging z-scores across all cognitive domains. Each domain z-score was then standardized relative to this global score using a z-score formula, allowing us to identify domains that diverged most strongly from an individual’s overall cognitive profile.
Finally, maximum discrepancy (MD) indices were computed as the difference between highest and lowest z-scores for each cognitive domain (across-domain) and for each RAVLT score (within-domain). This measure reflects the greatest variation within an individual’s performance and represents another way of measuring IIV-D (Aita et al., Reference Aita, Del Bene, Knapp, Demming, Ikonomou, Owen, Campbell, Wagaman, Borgogna, Caron, Roth and Hill2025).
Statistical analysis
We conducted a retrospective longitudinal analysis of baseline data from SCD, aMCI, AD, and HC, with progression status defined by changes between baseline and final follow-up. Analyses were performed in IBM SPSS 29.0, with scores reverse-coded where necessary so that higher scores reflected better performance.
Group differences in baseline demographic and clinical variables were examined using chi-square tests and univariate analyses of variance (ANOVA) with Tukey-corrected post hoc tests, and for non-normally distributed variables, Kruskal-Wallis tests with Mann-Whitney post hoc comparisons, after verification of the homogeneity of variance assumption. For significant chi-square tests, pairwise comparisons of column proportions were conducted using Bonferroni-corrected z-tests. Univariate analyses of covariance (ANCOVA) were used with diagnostic group (HC, SCD, aMCI, or AD) as the main effect to examine group differences in IIV-D indices (across- and within-domain dispersion; across- and within-domain MD; domain-specific deviation) adjusting for age, sex, depression, and insomnia, following verification of the homogeneity of slopes assumption, with Sidak-corrected post hoc tests. Separate ANCOVAs controlling for age compared variability indices between progressors and non-progressors (SCD-p vs. SCD-np; aMCI-p vs. aMCI-np). To account for multiple tests, we applied the false discovery rate (FDR) Benjamini-Hochberg correction, controlling the FDR at 0.10 given the exploratory nature of the study and the goal of minimizing the risk of overlooking potentially meaningful effects. Sensitivity and specificity for each IIV-D measure were then calculated as the area under the receiver operating characteristic (ROC) curve (AUC), with comparisons between measures conducted using DeLong’s test. Finally, exploratory Pearson correlations examined associations between IIV-D and cognitive reserve, neuropsychiatric symptoms, medical history, and cognitive complaint.
Results
Demographic data
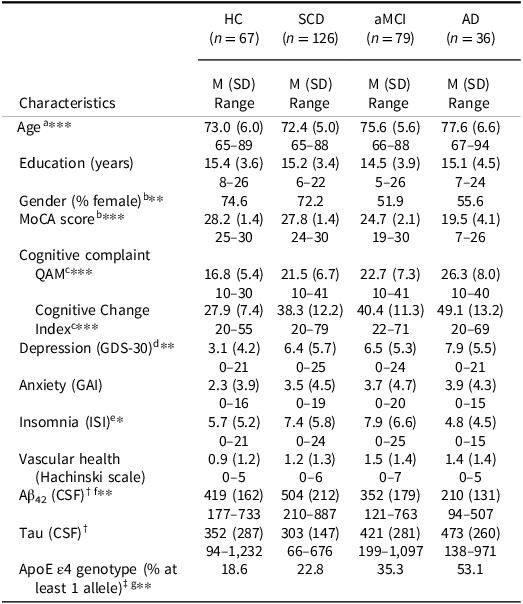
Results for the four groups of participants (HC, SCD, aMCI, AD) are presented in Table 2. As expected, groups differed on cognitive complaint score, F(3, 301) = 17.54, p < .001, ϵ 2 = 0.14; perceived cognitive change, F(3, 302) = 30.60, p < .001, ϵ 2 = 0.23; and MoCA score, F(3, 304) = 182.71, p < .001, ϵ 2 = 0.64. Groups also differed by age, F(3, 304) = 11.34, p < .001, ϵ 2 = 0.09; depressive symptoms, H(3) = 32.95, p = .006, ϵ 2 = 0.11; insomnia, F(3, 303) = 3.71, p = .012, ϵ 2 = 0.03; proportion of males and females, χ 2 = 13.05, p = .005, ϕ c = 0.21; and ApoE ϵ4 genotype, χ 2 = 15.38, p = .002, ϕ c = 0.24. No significant group differences were found for education, F(3, 302) = 0.79, p = .503, ϵ 2 = 0.00; anxiety, H(3) = 6.92, p = .370, ϵ 2 = 0.02; or vascular health, H(3) = 10.13, p = .103, ϵ 2 = 0.03. Regarding biomarkers, Aβ42 was lower in the AD group compared to SCD, F(3, 52) = 5.40, p = .003, ϵ 2 = 0.19, whereas no group differences were observed for total tau, H(3) = 3.73, p = .293, ϵ 2 = 0.07. However, these results should be interpreted with caution given the limited biomarker sample size (see Table 2 for details on number of participants).
Demographic and clinical characteristics for all groups

Table 2. Long description
The table presents demographic and clinical characteristics for four groups: healthy controls (HC), subjective cognitive decline (SCD), amnestic mild cognitive impairment (aMCI), and Alzheimer’s disease (AD). It includes data on age, education, gender, MoCA score, cognitive complaint, cognitive change index, depression, anxiety, insomnia, vascular health, Aβ42, tau, and ApoE ϵ4 genotype. The table has 15 rows and 8 columns, with each row representing a different characteristic and each column representing a different group. Notable trends include differences in cognitive complaint scores, perceived cognitive change, MoCA scores, age, depressive symptoms, insomnia, gender proportion, and ApoE ϵ4 genotype among the groups. No significant differences were found in education, anxiety, and vascular health. Biomarker data shows lower Aβ42 levels in the AD group compared to the SCD group, with no significant differences in total tau levels.
Note: Data are from participants’ baseline assessment. Aβ42 = amyloid-beta 42, AD = Alzheimer’s disease, aMCI = amnestic mild cognitive impairment, ApoE = apolipoprotein E, GAI = Geriatric Anxiety Inventory, GDS-30 = Geriatric Depression Scale, HC = healthy controls, ISI = Insomnia Severity Index, MoCA = Montreal Cognitive Assessment, QAM = Questionnaire d’auto-évaluation de la mémoire, SCD = subjective cognitive decline.
† Data available for: n HC = 13; n SCD = 20; n aMCI = 15; n AD = 8.
‡ Data available for: n HC = 59; n SCD = 101; n aMCI = 68; n AD = 32.
Post hoc tests indicated significant differences for aHC/SCD vs aMCI/AD; bHC/SCD vs aMCI vs AD; cHC vs SCD/aMCI vs AD; dHC vs all other groups; eaMCI vs AD; fSCD vs AD; gAD vs all other groups.
*p < .05; **p < .01; ***p < .001.
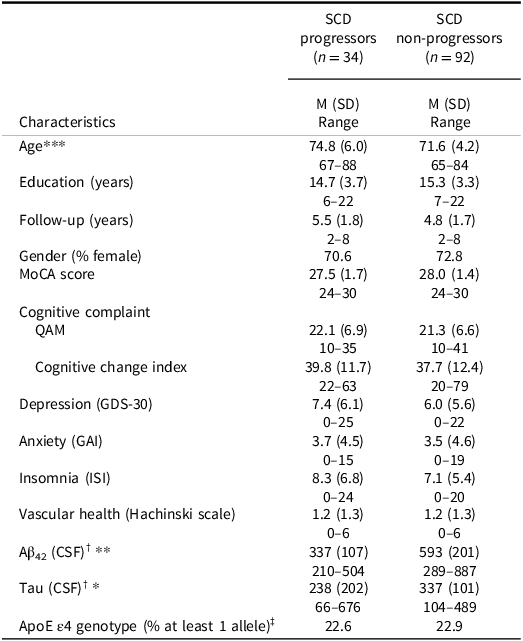
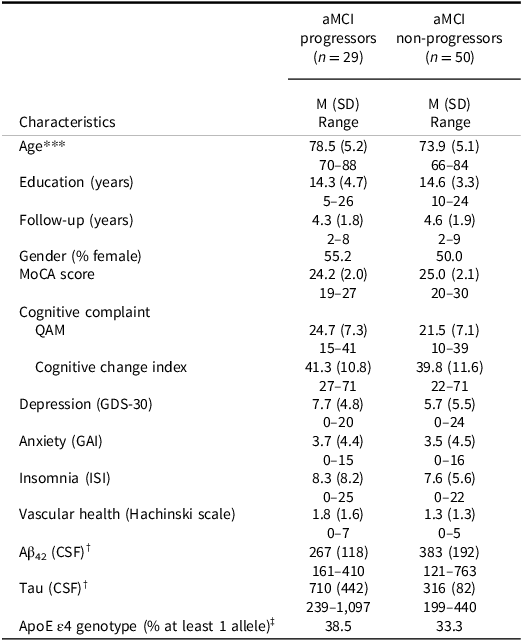
Results comparing progressors and non-progressors (SCD-p, SCD-np, aMCI-p, aMCI-np) are presented in Tables 3 and 4. Participants had similar follow-up times, both in SCD, t(124) = -1.88, p = .063, d = 0.37 (M SCD-p = 5.48, SD = 1.76; M SCD-np = 4.83, SD = 1.72) and aMCI, t(77) = 0.64, p = .523, d = 0.15 (M aMCI-p = 4.30, SD = 1.79; M aMCI-np = 4.58, SD = 1.95). Overall, progressors were older than non-progressors, both in SCD, t(124) = -3.38, p < .001, d = 0.68 and aMCI, t(77) = -3.77, p < .001, d = 0.88. SCD progressors had lower Aβ42, t(18) = 3.13, p = .006, d = 1.47, as well as lower total tau levels, U = 19, p = .036, r = 0.58, than non-progressors, while no significant differences were found on biomarker data for MCI groups. However, these findings should be interpreted with caution given the small subsample available for these data. No significant differences were found between groups on all other demographic and clinical variables.
Demographic and clinical characteristics for SCD groups

Table 3. Long description
A table with two columns and multiple rows comparing demographic and clinical characteristics of SCD progressors and non-progressors. The columns are labeled SCD progressors and SCD non-progressors, with the number of participants in each group indicated. The table includes data on age, education, follow-up duration, gender percentage, MoCA score, cognitive complaint, cognitive change index, depression, anxiety, insomnia, vascular health, Aβ42 levels, tau levels, and ApoE ϵ4 genotype. Notable trends include older age and lower Aβ42 and tau levels in SCD progressors compared to non-progressors.
Note: Data are from participants’ baseline assessment. Aβ42 = amyloid-beta 42, ApoE = apolipoprotein E, GAI = Geriatric Anxiety Inventory, GDS-30 = Geriatric Depression Scale, ISI = Insomnia Severity Index, MoCA = Montreal Cognitive Assessment, QAM = Questionnaire d’auto-évaluation de la mémoire, SCD = subjective cognitive decline.
† Data available for: n SCD progressors = 7; n SCD non-progressors = 13.
‡ Data available for: n SCD progressors = 31; n SCD non-progressors = 70.
*p < .05; **p < .01; ***p < .001.
Demographic and clinical characteristics for aMCI groups

Table 4. Long description
A table with two columns and multiple rows comparing demographic and clinical characteristics of aMCI progressors and non-progressors. The table includes data on age, education, follow-up years, gender percentage, MoCA score, cognitive complaint, cognitive change index, depression, anxiety, insomnia, vascular health, Aβ42 (CSF), Tau (CSF), and ApoE ϵ4 genotype. The progressors group has 29 participants, while the non-progressors group has 50 participants. Notable trends include higher average age and different levels of biomarkers between the two groups.
Note: Data are from participants’ baseline assessment. Aβ42 = amyloid-beta 42, aMCI = amnestic mild cognitive impairment, ApoE = apolipoprotein E, GAI = Geriatric Anxiety Inventory, GDS-30 = Geriatric Depression Scale, ISI = Insomnia Severity Index, MoCA = Montreal Cognitive Assessment, QAM = Questionnaire d’auto-évaluation de la mémoire.
† Data available for: n aMCI progressors = 4; n aMCI non-progressors = 11.
‡ Data available for: n aMCI progressors = 26; n aMCI non-progressors = 42.
***p < .001.
Neuropsychological tests and intraindividual variability
Results on IIV-D measures across groups and based on progression status are presented in Figure 1. Controlling for age, gender, depressive symptoms, and insomnia, results revealed a significant difference between groups at baseline on across-domain dispersion, F(3, 296) = 39.51, p < .001, η p 2 = 0.29. As hypothesized, the AD group had higher IIV-D (p < .001) than aMCI, SCD, or HC groups (M AD = 1.22, SD = 0.37; M aMCI = 0.79, SD = 0.33; M SCD = 0.62, SD = 0.29; M HC = 0.52, SD = 0.27), and aMCI had higher IIV-D than SCD (p = .005) and HC (p < .001). However, across-domain IIV-D did not differ between SCD and HC (p = .217). Similarly, verbal memory within-domain dispersion differed between groups, F(3, 294) = 33.55, p < .001, η p 2 = 0.26, with the AD group showing higher IIV-D (p < .001) than aMCI, SCD, or HC groups (M AD = 1.43, SD = 0.67; M aMCI = 0.86, SD = 0.41; M SCD = 0.68, SD = 0.27; M HC = 0.65, SD = 0.31). aMCI had higher IIV-D than SCD (p = .014) and HC (p = .021), but SCD and HC groups did not differ on within-domain IIV-D (p = 0.999).
Box and whisker plots presented for (a) across-domain dispersion and (b) verbal memory within-domain dispersion in all groups at baseline regardless of progression, and (c) across-domain dispersion and (d) verbal memory within-domain dispersion in SCD and aMCI progressors and non-progressors. Boxes represent the interquartile range (IQR), the horizontal line indicates the median, the X indicates the mean, and whiskers extend to the most extreme values within 1.5 × IQR; outliers are plotted individually. Data are from participants’ baseline assessment. AD = Alzheimer’s disease; aMCI = amnestic mild cognitive impairment; HC = healthy controls; SCD = subjective cognitive decline. *p < .05; **p < .01; ***p < .001.

Figure 1. Long description
The image contains four box and whisker plots. The first plot (a) shows across-domain cognitive dispersion in all groups at baseline, including healthy controls, subjective cognitive decline, mild cognitive impairment, and Alzheimer’s disease. The second plot (b) displays verbal memory within-domain dispersion in the same groups. The third plot (c) compares across-domain cognitive dispersion between progressors and non-progressors in subjective cognitive decline and amnestic mild cognitive impairment. The fourth plot (d) shows verbal memory within-domain dispersion in the same groups. Boxes represent the interquartile range, the horizontal line indicates the median, the X marks the mean, and whiskers extend to the most extreme values within 1.5 times the interquartile range. Outliers are plotted individually. Data are from participants’ baseline assessment. Significant differences are marked with asterisks.
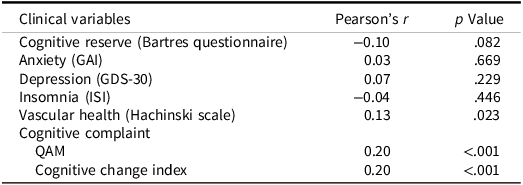
Additionally, results from Pearson’s correlations showed weak positive correlations between across-domain IIV-D and variables of vascular health, r = 0.13, p = .023, cognitive complaint, r = 0.20, p < .001, and perceived cognitive change, r = 0.20, p < .001, such that greater dispersion was associated with a higher vascular burden as well as a more marked cognitive complaint (Table 5). Dispersion was not associated with cognitive reserve, anxiety and depressive symptoms, nor insomnia.
Pearson’s correlations between clinical variables and across-domain dispersion

Table 5. Long description
The table presents Pearson’s correlations between various clinical variables and across-domain dispersion. It includes eight rows and three columns. The columns are labeled ‘Clinical variables’, ‘Pearson’s r’, and ‘p Value’. The clinical variables listed are Cognitive reserve, Anxiety, Depression, Insomnia, Vascular health, Cognitive complaint, QAM, and Cognitive change index. Each row provides the Pearson’s correlation coefficient and the corresponding p-value for the relationship between the clinical variable and across-domain dispersion. Notable trends include a weak positive correlation between across-domain dispersion and vascular health, cognitive complaint, and perceived cognitive change, with p-values indicating statistical significance for these correlations.
Note: Data are from participants’ baseline assessment. GAI = Geriatric Anxiety Inventory, GDS-30 = Geriatric Depression Scale, ISI = Insomnia Severity Index, QAM = Questionnaire d’auto-évaluation de la mémoire.
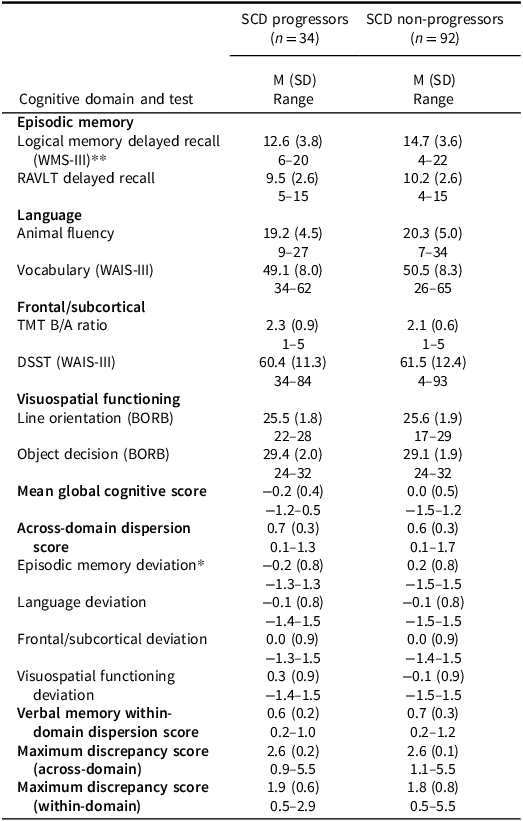
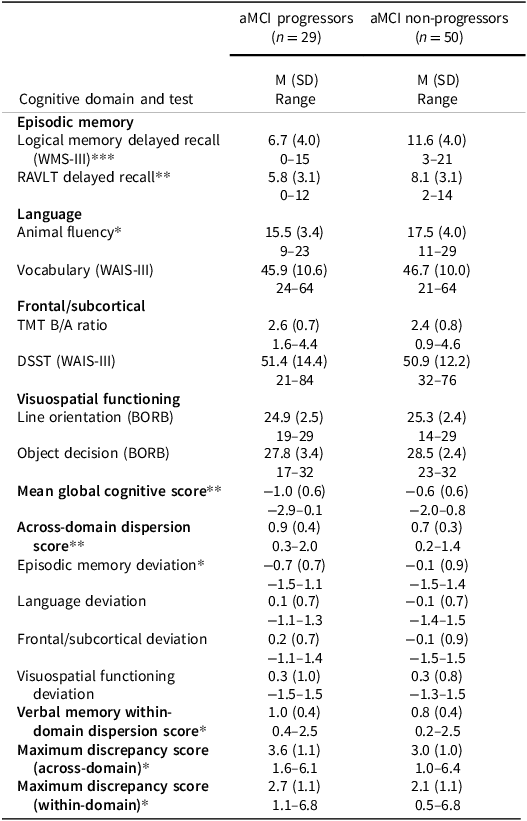
Results comparing SCD and aMCI progressors and non-progressors on neuropsychological tests are summarized in Tables 6 and 7. Logical Memory delayed recall was lower in progressors for both SCD, F(1, 122) = 7.09, p = .009, η p 2 = 0.06, and aMCI groups, F(1, 76) = 22.81, p < .001, η p 2 = 0.23, but only aMCI groups differed on RAVLT delayed recall, F(1, 76) = 8.25, p = .005, η p 2 = 0.10. In the language domain, aMCI progressors produced fewer words in the Category fluency task, F(1, 76) = 4.46, p = .038, η p 2 = 0.06. No group differences emerged in frontal/subcortical and visuospatial functioning domains. Global cognition was lower in aMCI-p, F(1, 76) = 10.81, p = .002, η p 2 = 0.13, but did not differ in SCD. Controlling for age, across-domain dispersion did not differ between SCD groups, F(1, 123) = 0.90, p = .345, η p 2 = 0.01, and neither did verbal memory within-domain dispersion, F(1, 123) = 0.04, p = .834, η p 2 = 0.00, whereas aMCI progressors showed higher IIV-D than non-progressors, both across-domain, F(1, 76) = 8.49, p = .005, η p 2 = 0.10, and within-domain, F(1, 76) = 4.54, p = .036, η p 2 = 0.06. Regarding domain-specific deviation, episodic memory was the only domain showing group differences in both SCD, F(1, 123) = 5.01, p = .027, η p 2 = 0.04, and aMCI, F(1, 76) = 6.06, p = .016, η p 2 = 0.07. MD measures differed only between aMCI-p and aMCI-np, both across-domain, F(1, 76) = 4.66, p = .034, η p 2 = 0.06, and within-domain, F(1, 76) = 4.04, p = .048, η p 2 = 0.05.
Cognitive performance of SCD progressors and non-progressors

Table 6. Long description
A table comparing cognitive performance of SCD progressors and non-progressors across various domains. The table has 15 rows and 6 columns. The columns are labeled as Cognitive domain and test, Episodic memory, Language, Frontal/subcortical, Visuospatial functioning, Mean global cognitive score, Across-domain dispersion score, Episodic memory deviation, Language deviation, Frontal/subcortical deviation, Visuospatial functioning deviation, Verbal memory within-domain dispersion score, Maximum discrepancy score (across-domain), Maximum discrepancy score (within-domain). The rows provide data for SCD progressors and non-progressors, including mean scores, standard deviations, and ranges for various cognitive tests. Notable trends include differences in logical memory delayed recall and animal fluency between the two groups.
Note: Data are from participants’ baseline assessment. All analyses included age as a covariate. BORB = Birmingham Object Recognition Battery, DSST = Digit Symbol Substitution Test, RAVLT = Rey Auditory Verbal Learning Test, SCD = subjective cognitive decline, TMT = Trail Making Test, WAIS-III = Wechsler Adult Intelligence Scale – 3rd Edition, WMS-III = Wechsler Memory Scale – III.
*p < .05; **p < .01.
Cognitive performance of aMCI progressors and non-progressors

Table 7. Long description
The table presents a comparison of cognitive performance between aMCI progressors and non-progressors across several domains, including episodic memory, language, frontal/subcortical, visuospatial functioning, and global cognition. It consists of 15 rows and 6 columns, with the first column listing the cognitive domains and tests, and the subsequent columns displaying mean scores, standard deviations, and ranges for both groups. Notable trends include lower logical memory delayed recall and RAVLT delayed recall scores in progressors, as well as higher across-domain and within-domain dispersion scores. The table highlights significant differences in episodic memory deviation and maximum discrepancy scores between the two groups.
Note: Data are from participants’ baseline assessment. All analyses included age as a covariate. aMCI = amnestic mild cognitive impairment; BORB = Birmingham Object Recognition Battery, DSST = Digit Symbol Substitution Test, RAVLT = Rey Auditory Verbal Learning Test; TMT = Trail Making Test; WAIS-III = Wechsler Adult Intelligence Scale – 3rd Edition; WMS-III = Wechsler Memory Scale – III.
*p < .05; **p < .01; ***p < .001.
ROC analysis
For ROC curve analyses, we examined whether IIV-D measures (across- and within-domain) provided better classification accuracy than standard memory measures (delayed Logical Memory and RAVLT), as well as the MoCA. We also tested whether combining IIV-D with variables that most strongly differed between groups improved predictive value. Area under the curve (AUC) values were classified as poor (<0.7), fair (0.7–0.8), good (0.8–0.9), or excellent (>0.9; Nahm, Reference Nahm2022).
ROC curves for SCD and aMCI are shown in Figure 2. None of the variables showed strong predictive accuracy in distinguishing SCD-p from SCD-np. Only the Logical Memory delayed score reached statistical significance (AUC = 0.67, p = .003) and combining it with across-domain IIV-D did not improve classification (D = 1.20, p = .230).
Receiver operating characteristic curves for (a) SCD and (b) aMCI. Data are from participants’ baseline assessment. aMCI = amnestic mild cognitive impairment; IIV-D = intra-individual variability – dispersion; MoCA = Montreal Cognitive Assessment; RAVLT = Rey Auditory Verbal Learning Test; SCD = subjective cognitive decline.

Figure 2. Long description
The line graph consists of two panels labeled (a) SCD and (b) aMCI. Each panel features multiple lines representing different cognitive assessments: MoCA, RAVLT, Delayed Logical Memory, Across-domain IIV-D, Within-domain IIV-D, and Logical Memory plus Across-domain IIV-D. The x-axis represents one minus specificity, ranging from 0.00 to 1.00, while the y-axis represents sensitivity, also ranging from 0.00 to 1.00. The lines show varying levels of sensitivity and specificity for each assessment. In panel (a), the MoCA line is solid red, RAVLT is dashed green, Delayed Logical Memory is dotted yellow, Across-domain IIV-D is dashed blue, Within-domain IIV-D is dotted light blue, and Logical Memory plus Across-domain IIV-D is dashed pink. In panel (b), the same color scheme is used for the corresponding assessments. The lines indicate how well each assessment discriminates between individuals with SCD and aMCI. All values are approximated.
When distinguishing aMCI-p and aMCI-np, both dispersion measures demonstrated significant predictive accuracy. Across-domain IIV-D showed poor classification ability (AUC = 0.68, p = .005), while verbal memory within-domain IIV-D reached a fair level (AUC = 0.71, p = .001). Adding across-domain IIV-D to raw test scores did not improve classification performance, for both Logical Memory (D = 0.67, p = .502) and RAVLT (D = 1.33, p = .182).
Discussion
With the rising prevalence of neurocognitive disorders, particularly AD, there is growing interest in identifying early markers of cognitive decline. The present study examined intra-individual variability (IIV-D) as a potential early indicator of AD progression using data from the CIMA-Q cohort, comparing HC, SCD, aMCI, and AD groups, and assessing whether baseline IIV-D distinguished progressors from non-progressors. IIV-D increased with disease severity, with AD showing the highest levels, followed by aMCI. Progressors showed higher IIV-D in aMCI but not in SCD, both across and within domains, and greater episodic memory deviation in both groups. However, predictive accuracy was modest, as IIV-D did not outperform standard neuropsychological measures in identifying aMCI progressors, consistent with previous findings (Fatima et al., Reference Fatima, Schaffert, Carlew, Thakkar, Lacritz, Rossetti and Cullum2025).
Most dementia research focuses on average group-level differences in cognition, often overlooking within-person variability. Our findings suggest that, although IIV-D did not outperform traditional neurocognitive measures, it offers a quantitative index of intra-individual cognitive heterogeneity that complements normative assessments and may support clinical interpretation. As expected, IIV-D was highest in AD, followed by aMCI, reflecting greater heterogeneity with disease severity, consistent with prior findings (Kälin et al., Reference Kälin, Pflüger, Gietl, Riese, Jäncke, Nitsch and Hock2014; Roalf et al., Reference Roalf, Quarmley, Mechanic-Hamilton, Wolk, Arnold and Moberg2016). IIV-D may also differ across dementia types in both magnitude and underlying cognitive domains. For instance, Webber et al. (Reference Webber, Kiselica, Mikula and Woods2022) reported elevated variability in both AD and dementia with Lewy bodies (DLB), alongside syndrome-specific profiles (greater memory impairment in AD and executive dysfunction in DLB), highlighting the value of domain-level analyses as used in the present study. In our sample, episodic memory deviation was the primary contributor to across-domain dispersion and the only variability measure distinguishing SCD progressors from non-progressors, consistent with the early involvement of episodic memory in AD (Bondi et al., Reference Bondi, Jak, Delano-Wood, Jacobson, Delis and Salmon2008).
Global IIV-D distinguished aMCI progressors from non-progressors, but not in SCD. In aMCI, progressors showed higher across-domain IIV-D and greater episodic memory deviation, consistent with poorer performance on delayed recall measures. Although aMCI-p also performed worse on Category Fluency, as reported previously (Chasles et al., Reference Chasles, Tremblay, Escudier, Lajeunesse, Benoit, Langlois, Joubert and Rouleau2020), no group differences emerged in the language domain. This may be because only two tests were used and the Vocabulary subtest may lack sensitivity. Contrary to our hypothesis, across-domain IIV-D was not elevated in SCD progressors. This may reflect that IIV-D does not emerge at such an early stage, when cognition remains largely within normal limits. Alternatively, the relatively short follow-up may have limited long-term outcomes, as most SCD progressors converted only to aMCI, and few reached AD. Given that SCD can precede dementia by up to 10 years (Verlinden et al., Reference Verlinden, van der Geest, de Bruijn, Hofman, Koudstaal and Ikram2016), longer follow-up is needed to clarify the prognostic value of IIV-D at this stage. Nonetheless, greater episodic memory deviation in SCD progressors suggests that domain-specific indices may still be informative even when global IIV-D is not.
Although SCD is defined by the absence of objective impairment on standard neuropsychological tests (Jessen et al., Reference Jessen, Amariglio, Buckley, Van Der Flier, Han, Molinuevo, Rabin, Rentz, Rodriguez-Gomez, Saykin, Sikkes, Smart, Wolfsgruber and Wagner2020), subtle differences may distinguish future progressors from stable individuals. Inconsistent findings across SCD studies likely reflect variability in SCD criteria and assessment methods, ranging from single questions to detailed questionnaires (Reid and MacLullich, Reference Reid and MacLullich2006). Associations with objective cognition and predictive value for future cognitive decline also vary across studies. Moreover, most studies have not separated progressors from non-progressors. Using a retrospective approach, we identified subtle differences that may otherwise be obscured when groups are combined.
Although across-domain dispersion was our primary focus, we also examined within-domain IIV-D in verbal episodic memory using RAVLT scores and MD indices. These measures showed similar patterns, with greater variability in aMCI and AD, and in aMCI progressors compared to non-progressors, but not in SCD or controls. Prior work suggests that process and error scores from word-list learning memory tasks can capture subtle cognitive inefficiencies in preclinical AD before clear impairment is evident in total scores. For instance, Thomas, Eppig, et al. (Reference Thomas, Eppig, Edmonds, Jacobs, Libon, Au, Salmon and Bondi2018) reported increased intrusion errors in cognitively normal individuals who later developed MCI despite intact overall performance. Few studies have directly compared within- and across-domain IIV-D. Kälin et al. (Reference Kälin, Pflüger, Gietl, Riese, Jäncke, Nitsch and Hock2014) found that within-domain IIV-D distinguished controls from MCI, whereas across-domain IIV-D emerged later at the AD stage. In Alzheimer’s disease, global across-domain IIV-D may be less sensitive than domain-specific deviations, as episodic memory deviation was greater in SCD progressors than non-progressors, likely reflecting early medial temporal lobe pathology (Malek-Ahmadi et al., Reference Malek-Ahmadi, Lu, Chan, Perez, Chen and Mufson2017). Scott et al. (Reference Scott, Austin, Royall and Hilsabeck2023) further suggest that inefficient attentional and executive control processes may cause fluctuations in task performance.
We found a weak but significant positive correlation between IIV-D and vascular health, in line with evidence linking across-domain variability to vascular-related neural inefficiencies, including regional hypoperfusion in AD-vulnerable areas (Holmqvist et al., Reference Holmqvist, Thomas, Brenner, Edmonds, Calcetas, Edwards, Bordyug and Bangen2022) and white matter dysconnectivity within frontal-subcortical circuits (MacDonald et al., Reference MacDonald, Li and Bäckman2009). Given the established vascular contributions to AD (Iturria-Medina et al., Reference Iturria-Medina, Sotero, Toussaint, Mateos-Pérez and Evans2016; Villeneuve & Jagust, Reference Villeneuve and Jagust2015), inefficient top-down control processes may partly explain increased across-domain IIV-D, although this mechanism is less likely to account for within-domain episodic memory variability, which may be more dependent on medial temporal structures such as the hippocampus, suggesting distinct neuropathological substrates for different cognitive variability patterns. No associations emerged between IIV-D and cognitive reserve or neuropsychiatric symptoms, contrary to prior findings (Botto et al., Reference Botto, Callai, Cermelli, Causarano and Rainero2022; MacDonald et al., Reference MacDonald, Li and Bäckman2009), possibly due to limited variability in the present sample. Overall, the neural correlates of IIV-D remain unclear, with mixed evidence linking it to neurofibrillary tangles (Malek-Ahmadi et al., Reference Malek-Ahmadi, Lu, Chan, Perez, Chen and Mufson2017) and inconsistent associations with CSF biomarkers (Watermeyer et al., Reference Watermeyer, Marroig, Ritchie, Ritchie, Blennow and Muniz-Terrera2020), underscoring the need for further research.
Strengths of this study include a well-characterized longitudinal sample of older adults, with up to eight years of follow-up, allowing for a comprehensive view of cognitive trajectories over time. The relatively large sample spanned the full AD continuum, from cognitively healthy individuals to those with AD, enhancing generalizability. Participants completed a thorough neuropsychological assessment, with the primary IIV-D index based on eight cognitive tests evenly sampling multiple domains. Relevant individual characteristics such as cognitive reserve, anxiety, and depression, were also considered, providing a nuanced understanding of factors influencing IIV-D.
Several limitations should be acknowledged. Diagnostic classification relied solely on participants’ final diagnosis, potentially overlooking intermediate diagnostic transitions. Moreover, classifying individuals moving from early to late MCI as progressors may overestimate progression. It should also be noted that IIV-D estimates depend on the characteristics and score distribution of the healthy control group used as a reference, which may influence between-group comparisons. Although this group was selected to be representative of the target population, this reference dependency should be considered when interpreting the results. Neuroimaging data and postmortem confirmation were unavailable, limiting links to underlying brain changes and diagnostic accuracy. Long-term trajectories of SCD and aMCI remain uncertain. For instance, SCD progressors converted to aMCI but not to AD, potentially explaining the absence of increased IIV-D in this group. Longitudinal studies with longer SCD follow-ups may help to address this issue. In addition, results regarding episodic memory deviation in the SCD progressor group did not survive a stricter FDR-corrected threshold of 0.05 and should therefore be interpreted with caution. Furthermore, self-reported complaints in SCD may reflect other factors beyond memory decline such as mood disturbances, personality traits, psychosocial factors such as loneliness, or general health concerns. Finally, the specific tests in the CIMA-Q cohort may have also influenced IIV-D sensitivity, and alternative test combinations might yield more robust indicators of cognitive variability.
Conclusion
This study examined intra-individual variability (IIV-D) as potential indicator of progression toward Alzheimer’s disease (AD). IIV-D is a low-cost, non-invasive measure easily derived from standard neuropsychological assessments, making it accessible in both clinical and research settings. While IIV-D may help characterize cognitive profiles and subtle changes preceding overt decline, particularly at the aMCI stage, its contribution to diagnostic precision appears limited. To facilitate its broader clinical application, future research should aim to standardize IIV-D calculation and establish reference values to guide its clinical use.
Supplementary material
The supplementary material for this article can be found at https://doi.org/10.1017/S1355617726102082.
Acknowledgments
None.
Funding statement
JM was supported by a doctoral grant from the Fondation Famille Lemaire. CIMA-Q was funded by FRQS Pfizer, FRQ Cohort, RQRV, CCNV, Fondation Courtois (projet Neuromod), and Fondation Famille Lemaire.
Competing interests
The authors declare no known conflicts of interest.



 Open access

