

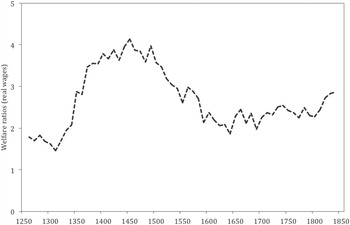
The trends in men's wages in the centuries after the Black Death are now well accepted. As shown in Figure 1, real wages rose for nearly a century and a half, fell to a plateau in the seventeenth and eighteenth centuries, and then improved slightly by 1850. These trends have been held to track wellbeing, account for demographic transformations, and, recently, even explain the causes and chronology of the Industrial Revolution. Yet not all wage workers were men and not all families had male breadwinners. Women worked as single women, married women, and widows. They played a role in the decision when to marry (and hence the size of families) and they participated in the workplaces of industrialising Britain, but we know little about their labour markets. Researchers have recognised this gap. Several have tried to document women and children's economic experience in different times and places (Snell Reference Snell1985; Berg Reference Berg1993; Horrell and Humphries Reference Horrell and Humphries1995; Burnette Reference Burnette2008; Schneider Reference Schneider2013), but to date none have attempted to match the well-known evidence on the long-run evolution of male wages with comparable series for women workers. Women's economic activities are hard to capture. Data on their remuneration is fragmentary and difficult to interpret. Women were more likely paid as part of a team, by task, or in kind. Day wages, where they exist, must be compared with longer-term contracts that usually involved board and lodging for which a value has to be imputed. Yet a female wage series is vital to our understanding of British economic history.
THE REAL WAGES OF UNSKILLED MALE FARM LABOURERS (BY DECADE)
We have compiled evidence on women's wages and sought to circumvent the problems noted earlier. The result is the first long-run wage series for unskilled English women workers, acknowledging that we stand on the shoulders of other economic historians who have assembled data for particular periods (for example, Whittle, Burnette, and Field). While some of our work involved linking this material with other secondary sources, we have uncovered many new sources and use over 6,000 observations of wage payments spread over 600 years to generate this first long-run series of unskilled women's wages.
We begin with a discussion of our sources, explaining the methods used to construct the series and introduce the main findings. There were two distinct forms of female employment: daily wage labour, often on a casual basis, and annual service, which usually involved living in and so was, therefore, partially remunerated in the form of room, board, and other perquisites. We have collected and processed wage data relating to both kinds of employment and so provide two separate series: daily wages and the equivalent remuneration implicit in longer-term contracts. The former is comparable with the wages of unskilled men and can be used to track the gender gap over time. In addition, we can show when women could benefit by opting for one or other form of employment. Our findings here are striking. For long periods of time, in fact from the Black Death until the late 1500s, women's daily or weekly wages from casual or short-term work exceeded the implicit equivalent available from annual service. Of course, casual employment did not provide the continuity of support available via annual service; the question is whether these higher wages compensated for the risk of periods without work. Our evidence puts on a firm empirical footing the view that medieval and early early modern labourers could collect higher sums by working day rates than from a yearly wage (Richie Reference Richie and Carus Wilson1962, p. 93; Penn and Dyer Reference Penn and Dyer1990, pp. 368–70; Poos Reference Poos1991, pp. 222–5; Youngs Reference Youngs1999, p. 158). In the era of industrialization, we find this relationship reversed with the daily wages implicit in longer-term contracts outstripping falling or flattening casual day rates for women workers. More generally, the differences between women's daily and longer-term wages reveal the working of the market for female labour and cast light on several unresolved debates in economic history as we discuss later.
DATA AND METHODOLOGY
Various problems are endemic to the historical record on women's wages. The data are fragmentary, and difficult to interpret, often involving team work, piece-rates and remuneration in the form of perquisites. Here we explain how we have dealt with these problems to build our series. We began by assembling material from well-known secondary sources based on particular bodies of primary data. Several authorsFootnote 1 who worked on the late eighteenth and nineteenth centuries generously shared their data files and, because of their work, the period after 1750 is particularly well documented (see Figure 2). Material was also extracted from classic accounts by, for example, James Edwin Thorold Rogers and William Beveridge. We then searched other secondary sources, as listed in the bibliography, for additional observations. However, as Figure 2 demonstrates evidence from secondary sources is patchy, especially for earlier centuries.
THE FREQUENCY OF PAYMENTS (BY DECADE)
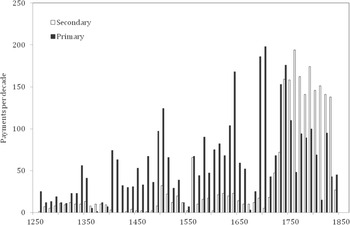
We put considerable effort into generating additional evidence adding material from diverse primary sources, both archival and printed primary, including: manorial accounts, farm accounts, wage books, household accounts, Chamberlains’ accounts, Churchwardens’ accounts, settlement examinations, diaries, and memoirs. Gainsaying the view that women's wages are insufficiently documented, we have uncovered substantial evidence as noted in Figure 2 in the black bars.Footnote 2 Our sources cover provincial and peripheral areas, making it comparable to the authoritative series for unskilled male farm labourers provided by Gregory Clark (Reference Clark2007).Footnote 3
This new material shatters stereotypes of women's work as purely domestic or less physically demanding. For example, several sources record women employed on early modern construction sites, including that of Blenheim Palace. To illustrate, the account book of New Haven, Chester, 1567–1568, records women involved in preparatory tasks: moving stones at a standard rate of 3d per day. Later, when a “crane” was installed to lift the stones into place, many women were regularly employed to set the machinery in motion via a sort of treadmill, with “mayds in the craine” becoming a regular charge in the accounts (Rideout Reference Rideout1928).
Building a wage series from such heterogeneous sources requires care and consistency. Geographically, seasonally, and occupationally diverse sources must be treated with care to ensure consistency in composition, especially as in some periods we are forced to rely on few observations. We tried to limit such dangers first by excluding London, which had a distinctive high wage labour market, and second by dropping payments recorded as harvest and haymaking wages. We then sought a wide but consistent geographical coverage, drawing as a rule on several sources per time period;Footnote 4 following other authors (notably Clark) we use decadal averages and linear interpolation to cover (infrequent) gaps, and focus exclusively on relatively homogenous adult unskilled workers.
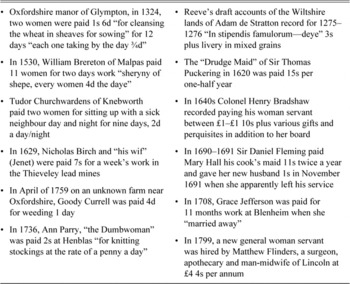
To separate skilled from unskilled workers in our data sources, we use the so-called HISCO/HISCLASS system. HISCO categorizes more than one thousand historical occupations by the type of work performed (van Leeuwen, Maas, and Miles Reference van Leeuwen, Maas and Miles2002). These coded occupations were later ranked based on an assessment of the working skills required (van Leeuwen and Maas Reference Broadberry, Campbell, Klein, Overton and van Leeuwen2011). We use this HISCLASS taxonomy to ensure that all wages in our database were paid to women whose work was categorised as unskilled. We have, therefore, excluded observations that relate to domestic servants with managerial responsibility (housekeepers, ladies’ maids, nurses), ignoring also skilled domestic manufacturers (weavers, lacemakers, glovers) and midwives, schoolteachers and governesses.Footnote 5 Thus Sir Thomas Puckering's wife's “waiting gentlewoman” paid the princely sum of £6 per annum in 1620 is excluded while his “Drudg Maide” paid £1 10s, and his chamber maids, working maid, dairy maid, laundry maid and “Malt-maide and Powltrie-Crammer” are all captured in our series (Merry and Richardson Reference Merry and Richardson2012).
A more fundamental issue as illustrated by the examples in Table 1 comes in the comparison of day wages with annual contracts. Those appearing in the left-hand column relate to day wages even when a specific task is reported as in the case of Ann Parry. Those on the right refer to annual contracts where remuneration almost always included other perquisites: board, lodging, and clothing allowances. We collected both kinds of wage data, including, for example, the women Puckering hired casually to help with the washing, weed his garden, and rake up the fallen leaves in his orchard as well as the female servants mentioned previously and in Table 1 (Merry and Richardson Reference Merry and Richardson2012). Across all our sources, daily wages represent 31 percent, weekly wages 3 percent, and annual wages 66 percent of total observations (totalling 6,017 payments).
We understand daily and weekly payments as remuneration for casual work. This was sometimes for one-off employment as when Sir Thomas Aubrey employed a large number of men and women “for the repairing of the sea banke” on his estate in 1638 (Bowen Reference Bowen2006). At the same time, such casual work could involve extended employment, as in the case of Avis Starling who (though with various spelling of her name) crops up regularly in the Earl of Bath's household accounts in 1640–1649 paid for washing clothes, cleaning the house, and performing outdoor farm work (Gray Reference Gray1996). Casual employment was not limited to agricultural tasks; women were employed by the week, day, or half-day as garden labour, cleaners, scourers, laundresses, messengers, construction workers, and transport workers.
Importantly for this analysis, we associate casual employment with married women, since female workers were often (though not always) described as such in the sources. Thus, a “uxor” was paid for preparing thatch for repairs at All Souls College, Oxford in 1456 (All Souls Domestic Accounts); “John Wilson's wife” was employed for 16 days in December 1698 “salveing and tobaccoing of sheep” according to the estate and household accounts of Sir Daniel Fleming (Tyson Reference Tyson2001); “Peter Hearder's wife” worked for ten days mowing in 1649 in the household accounts of Henry Fifth Earl of Bath (Gray Reference Gray1996); “Jenet the wiffe of Nic Birch” appears regularly in the accounts of the Thieveley Lead Mines, 1629–1635 (France Reference France1951); and, “Richerd Postilthwaitt wiff” in the household and demesne farm accounts at Millom in 1513–1514 (Winchester Reference Winchester1982). Many of these women accessed their employment through husbands, occasionally working alongside them in trades or crafts or recruited by them to work for the same employer. In medieval and early modern England, marriage rather than excluding women from economic activity often actually provided them with the means to work productively. In contrast, single women may have had fewer opportunities to work especially by the day because the authorities discouraged the independence this implied and considered annual service more appropriate (Roberts Reference Roberts, Ågren and Louise Erickson2005; Whittle Reference Whittle, Ågren and Louise Erickson2005; Speechley Reference Speechley1999).
OBSERVATIONS OF WOMEN'S WAGES
Of course this was not always true; our own “mayds in the craine” sound like some of the many single women who also took up casual work. Medievalists, in particular, have been careful to point out that both older married and younger single women were involved in day labour, John Langdon, for example, illustrating this point with reference to an “ancilla” or maidservant paid 7½d for collecting moss for five days in 1293 (Langdon Reference Langdon, Dodds and Liddy2011, p. 35). Nonetheless, Langdon finds many “mulieri”, older and likely married women, in his “reserve workforce,” and Lawrence R. Poos, explicitly challenged the ahistorical assumption that day work was only undertaken by spinsters, widows, or others “unencumbered with the domestic demands of married life or in economically precarious households” noting that a significant minority of female day labourers in his sample were explicitly referred to as wives (Poos Reference Poos1991, p. 217). Our case is simply that married women were strongly represented among this group.
The majority of wage observations relate to annual service. Women were employed on an annual basis for outdoor agricultural work and as indoor domestics and indeed often appear to have performed both kinds of work on a regular basis. Such employment did not necessarily involve a commitment to a specific employer. Many servants changed jobs annually and a significant number even within the year contrary to agreed terms. There were, exceptions, like Margaret Moorhouse, who served Sir Daniel Fleming in various domestic capacities from 1689 to 1696 and then “came again” for three further years in 1697 (Tyson Reference Tyson2001), but such stalwarts aside, annual service appears to have been dominated by the short-term engagement of unmarried women.
Again, the mapping from type of contract to marital status is not fail-safe. Some married women (and certainly some widows and deserted wives) sought refuge as resident domestic or farm servants, but this was relatively uncommon given the logistic difficulties of combining living in with family life and the hostility of employers towards female staff with dependent children (for a discussion of this point see, Whittle Reference Whittle, Ågren and Louise Erickson2005, pp. 97–98). Women generally left annual service on marriage as in the cases of Mary Hall and Grace Jefferson cited in Table 1.
Putting casual rates and annual stipends on the same footing to enable comparison involves assumptions about the length of the work week. As is common in the literature, we opted for a five-day working week that with 52 weeks per year, amounts to 260 annual work days, virtually matching the usual assumption of a pre-modern working year of 250 days (Allen and Weisdorf Reference Allen and Weisdorf2011). The few sources that specify the number of days worked per week, suggest that five or six days was the norm, depending on the season. While the assumption of a six-day working week would reduce imputed daily rates for women on annual contracts and change the relationship to casual rates, our conclusions remain robust to the length of the work week.
A more challenging complication arises in that nearly all our stable (and a few of our casual) contracts came with payments in kind. Some (although very few) contracts entailed no cash payments, their holders entirely reliant on in kinds. In the medieval period, in-kind payments were allowances in mixed grains, although famuli (as the Lord's servants were called) often though not always resided in the manor and may also have enjoyed other perquisites such as additional food, particularly at harvest time, and the use of manorial equipment and draft animals on their own smallholdings (Poos Reference Poos1991; Hilton Reference Hilton1975; Hanawalt Reference Hanawalt1986; Dyer Reference Dyer1988, Reference Dyer1989). Additionally, wages that might be contracted for in cash could sometimes be paid in food and clothing (Youngs Reference Youngs1999); certainly advances against wages were common (e.g., Bird Reference Bird2013; Wiltshire Record Office 811/207). In the early modern period and on into the nineteenth century, most farm and household servants continued to live in and room and board was an essential part of the employment bargain.
Ideally, such in-kind rewards should be valued and added to cash payments to determine overall remuneration. Unfortunately the evidence needed to support such an exercise is rarely provided. An alternative way to “monetize” in-kind payments is to assume that they covered a worker's subsistence and so can be valued via a historical consumer price index. Robert C. Allen's “respectability” consumption basket provides a tool for capturing and valuing the goods commonly consumed by an average person during the pre-modern era (Allen Reference Allen2009). Table 2 lists the commodities included and their quantities, and the daily cost from 1264 to 1850 is reproduced in Table A1 from Allen's website.Footnote 6 The basket does not include housing costs, but Allen adds five percent of overall costs to capture rent. We assume that in-kind benefits were equal to 100 percent of the value of the basket.
The next step is to turn the remuneration from an annual contract (the cash and the imputed values of the in-kind payments) into a day rate comparable to female casual day rates. First, we estimate the value of the in-kind payments per year by multiplying the daily cost of Allen's basket by 365 days. To that, we then add the cash wages recorded in our sources. This gives us the monetized value of the annual contract. Then, we divided that number by the assumed work year, i.e., the 260 days, to arrive at a day rate. Take the year 1600 as an example. We have two different sources for this year with two annual payments each. One is the household papers of Henry Percy Ninth Earl of Northumberland, which records two women in receipt of annual stipends of £1 and £1 13s 4d (Batho Reference Batho1962). The other is the house and farm accounts of the Shuttleworths of Gawthorpe in which two women receive annual stipends of 15s and £1 6s 8d, respectively (Harland Reference Harland1856–1857).Footnote 7 Our four women all lived in. The implied value of their board and lodging in 1600 was £3 13s 5d (Allen's basket at 2.42d x 365 days), considerably more than the cash wages. The total value of the cash wages and the imputed value of board and lodging were then £4 8s 5d, £4 13s 5d, £5 0s 1d and £5 6s 9d, respectively for the four women. Spread out across the 260 total working days, we find these maids received daily rates of 4.08d, 4.31d, 4.62d, and 4.93d or an average of 4.49d, which can then be compared with the observed day rate of women for the same year.
ALLEN'S “RESPECTABILITY” CONSUMPTION BASKET (FOR ONE ADULT PERSON)
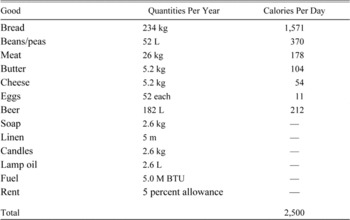
Source:
Allen, British Industrial Revolution, pp. 36–37.
It is possible that Allen's respectability basket misestimates the value of in-kind payments or trends in the value of the basket do not follow trends in the value of the perquisites attached to annual contracts. Occasionally in-kind benefits are described in sufficient detail to be able to calculate (or at least approximate) their absolute value which can then be checked against Allen's estimate for a comparable year. In the medieval period, when long-term contracts often included payments in grain, we use a procedure similar to that of Simon A.C. Penn and Christopher Dyer (Reference Penn and Dyer1990, p. 369). For example, Rogers's account of the standard perquisites of a dairymaid has her lose her livery of wheat for the harvest month when she was fed in the manor house. At other times her allowance of wheat was a quarter (grain measure equivalent to 8 bushels) every 14 weeks or approximately 0.08 bushels per day. Around 1300, a bushel of wheat cost close to 8d (Rogers 1866–Reference Rogers1902). So the daily allowance was worth 0.64d, while the cost of Allen's basket in 1300 was 0.55d per day.
Similarly, on the manor of Cuxham in 1278–1279, a dairymaid received a quarter of mixed grains every 14 weeks (i.e., 30 bushels per year) as well as four bushels of wheat and four bushels of barley but no meals at harvest time at the lord's table and no cash (Harvey Reference Harvey1960). The mixed grains would probably have consisted mainly of inexpensive sorts, for example, one-third peas, one-third rye, and one-third oats. We estimate the value (using 1300 prices) of her grains comes to 13s 9d per year.Footnote 8 Allen's basket cost 0.51d per day in 1278, or 15s 8d per year, this time slightly more but not completely adrift from the value of the in-kinds.
On rare occasions the sources themselves cost up room and board: for instance, on the Manor of Mote in 1474–1475, Agnes atte Wode fell ill for a month and was lodged with another servant, who received 2s 8d for looking after the old woman (Gardiner and Whittick Reference Gardiner and Whittick2008). The average monthly cash payment to women servants at the Mote was 16d so assuming that this was the cost of Agnes's nursing care, it leaves 16d to cover her board and lodging. The cost of Allen's basket in 1474–1475 was 0.64d day or 19d for one month, once again not far from the allowance her employer made for Agnes's room and board.
In the late sixteenth century when it became common for casual wage workers to demand food as well as wages (Richie Reference Richie and Carus Wilson1962, p. 97), careful stewards often accounted for these provisions with an eye to working out the most cost effective bargain. Thus, in the 1590s a series of bargains were struck with teams of women hired to work the hemp at Gawthorpe and Smithils. These sometimes included meals but sometimes left the women “upon their hone table,” that is to provision themselves out of higher wages (Harland Reference Harland1856, p. 46, p. 61, p. 108). Comparisons suggest that the food was valued around 3d per day, not far off the average cost of Allen's basket in the 1590s of 2.3d per day.
Later, explicit references to board wages, provide a direct indication of the value of living-in.Footnote 9 For example, in 1745 Lord Hatton's Steward paid Hannah Hoycock and Ann Hawkins £4 9s each for 25 weeks and three days “bord and wages,” that is 6d a day (Northamptonshire Record Office, FH 291). However, we also know from earlier in the accounts that these women's annual cash pay was £3 per annum i.e., 2d per day (with 260 days of work), implying that their board was valued at 4d per day. The daily cost of Allen's basket that year was 3d.
Agricultural wage assessments are often given with and without meat and drink which indicates the value of diet. Thus the Assessment of Wages and other Regulations made by the Justices of the Peace for Buckinghamshire in 1561 posted the maximal rate for women “Rakers & Cockers & such lyke” at 2d with “meate & drinke” but 5d without (Tawney and Power Reference Tawney and Power1924; Evans Reference Evans1936; Thompson Reference Thompson1904) suggesting that food and drink was expected to cost 3d per day. In 1561, the basket cost 1.5d per day, or about one-half of the cost implied in the difference between the assessment with tabling and the assessment without, a gap closed partially by the fact that the wage assessments were considered maxima, and partially by recognition that the food offered to workers in the harvest season was likely at the apex of working-class consumption, in quantity and quality better than anything obtained in the rest of the year.
Turning to another kind of source: Chancellor's farm accounts for 1766–1767 have the annual cost of housekeeping at £39 8s, and with five working residents (three women and two men) this means board cost 5d per person per day (Munckton Reference Munckton1994). Allen's basket costs close to 4d per day at this time, again a slight underestimate of the actual value of the in-kinds, which were probably boosted here by the presence of the farm manager and his wife at table. All in all, using the costs associated with Allen's basket provides a reasonable measure for the costs of board.
Overall our spot checks build confidence in our necessary approximation; though sometimes in the low end, we do not think that our valuations of the in-kind benefits associated with service contracts are misleading. In any case, the estimated daily costs of living simply capture the expenses that an average woman faced had she not been living in. The great benefit of our strategy is that it facilitates the separate computation of the daily remuneration in cash and kind for women working on a casual basis and those working on annual contracts, and so facilitates a comparative analysis as well as a first-round depiction of long run trends in women's wages.
THE DAILY WAGES IN PENCE OF UNSKILLED MEN AND WOMEN (BY DECADE)
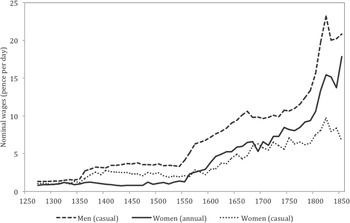
Figure 3 presents our main findings in terms of the evolution of both types of female wages. All wages (decadal averages) are reported in Table A1 in the Appendix. Clark's series for male farm labourers’ wages is shown alongside, and when compared with women's day rates, illustrates trends in the gender gap. Unfortunately our series for female servants has no direct male comparator since there is no series for male farm and domestic servants on annual contracts. Figure 3 shows women's daily remuneration from annual contracts remains roughly constant from 1300 to 1500. There is some evidence of improvement in the immediate aftermath of the Black Death but this is neither sustained nor significantly different from certain pre-plague years. In well documented cases such as Cuxham in Oxfordshire, remuneration returned to pre-1349 levels by 1353 (Harvey Reference Harvey1960, Reference Harvey1976). Women's casual daily rates, on the other hand, are clearly boosted by the labour scarcity that followed the Black Death, and track the trend in male rates all the way up until the late fifteenth century. The gap between the daily wages implicit in annual service contracts and those earned casually persists to 1550. Thereafter, in contrast to the medieval era, for some decades in the 1600s annual service contracts became more rewarding than casual work. Casual work made a comeback in the late seventeenth century (relative to stable payments but also in absolute terms) but this was not sustained and annual service became consistently better paid from the early 1700s against the backdrop of the industrial revolution.
THE CASUAL WORKING YEAR NEEDED TO EARN THE ANNUAL CONTRACT INCOME (BY DECADE)
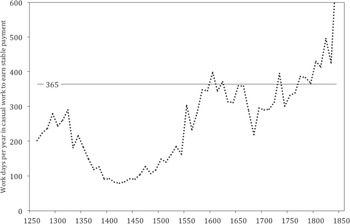
Figure 4 offers a different perspective on these trends, illustrating the number of days of casual employment that a woman would have had to work to earn the income that her peer could get in annual service. In the aftermath of the Black Death, women working casually by the day could match their servant sisters with many fewer days of labour than the 260 we assumed were required in annual contracts. After 1550 women earning casual rates almost always had to work more than 260 days to keep up and, indeed, sometimes would have had to work more days than there are in the calendar year. With these findings, we explore two important debates in economic history: first the Black Death and the European Marriage Pattern, and then industrialization.
THE BLACK DEATH, THE EUROPEAN MARRIAGE PATTERN, AND WESTERN ECONOMIC GROWTH
The initial visitation of the Black Death killed between 30 and 45 percent of the population. Recurrences meant that by the 1370s the population had been halved. Recovery was slow. Male survivors experienced a dramatic increase in (real and nominal) wages apparent in Figures 1 and 3, especially (but not only) in agriculture as landowners struggled to recruit and retain labourers. Medievalists have debated the extent to which women shared in this “golden age of the English peasantry.” Some have argued that women's gains were even more marked as they could now find employment in jobs which had earlier been reserved for men, migrate to towns to work in the growing textile industries or commercial service sectors, or become members of an expanding class of household servants and so enjoy “a high degree of economic independence” (Goldberg Reference Goldberg1986; Reference Goldberg1992; see also Barron, Reference Barron1989). Others have suggested that whatever the implications of the Black Death for male workers, the rigid grip of the sexual division of labour prevented women from seizing or consolidating the opportunities created by the labour shortage. “[W]omen tended to work in low-skilled, low-paid jobs… This was true in 1300 and it remained true in 1700” (Bennett Reference Bennett1988, p. 278, Reference Bennett1996; Mate Reference Mate1998). The debate has devolved into an argument about the continuities of gender subordination even in a world where labour was at a premium, with feminist historians arguing for the “triumph of patriarchal structures … over demographic crisis” and their opponents contending that “a situation where women's labour was both excessively cheap and reluctantly and sparingly used by farmers, is hard to sustain” (Bardsley Reference Bardsley1999, p. 29, Reference Bardsley2001; Hatcher Reference Hatcher2001, p. 195; see also Rigby Reference Rigby2000; and Langdon Reference Langdon, Dodds and Liddy2011).
Our findings of different trends in casual and service wages support, indeed quantify, the claim by both contemporaries and labour historians that workers in the late Middle Ages preferred employment on a daily or weekly basis because it offered the possibility of higher returns and more leisure (Bailey Reference Bailey and Horrox1994, p. 162; Dyer Reference Dyer1980, pp. 367–9; Kenyon Reference Kenyon and Carus Wilson1962; McIntosh Reference McIntosh1986; Poos Reference Poos1991, pp. 218–20). At the same time, our evidence suggests that women lost out by annual service contracts. Deborah Youngs has shown that on the late medieval demesne of Newton Cheshire, although male and female workers were both employed on long–term contracts, women appear to have been more dissatisfied by the terms and conditions offered; they were less likely to renew after a year, and more likely to leave early (Youngs Reference Youngs1999, p. 149). Examples of women's anticipated or actual dissatisfaction with the returns to annual service contracts and employers’ recognition of this are evident in many of the sources, which depict the latter seeking to reward maidservants for working to term and the former quitting prematurely nonetheless.
Given the apparent disadvantages associated with annual service contracts and the auxiliary evidence of women's discontent with them, why did the gap between casual and annual rates persist? Why did women not reject the longer-term contracts with higher frequency and arbitrage the labour market into convergence? Obviously one important reason is that annual contracts carried with them security of employment. If women were unsure of sufficient casual work for their support, they would be prepared to accept the drawbacks of annual service. Undoubtedly this was partially the case. But consider how many days work would have been needed at casual rates to match the annual pay (including in-kinds) on service contracts: in the medieval period, working one-half the year was usually more than enough. Certainly in cash terms it would seemingly not have taken many weeks’ work at the rates prevailing in the late fourteenth and fifteenth centuries to accumulate as much as many servants earned in an entire year (Ritchie Reference Richie, Mary and Wilson1962, p. 93; Dyer Reference Dyer1989, pp. 222–5). Young and healthy women might be persuaded that occasional labouring jobs, in addition to harvest, haymaking, and other seasonal demands for agricultural work or opportunities in cloth production and subsistence agriculture, would see them through.
On the other hand, some doubt whether there was enough employment throughout the calendar year to match servants’ earnings in cash and kind. Poos found women at Porter's Hall on average worked only 6.5 days, earning just 13.1d (Poos Reference Poos1991, p. 219) and Langdon is similarly pessimistic about opportunities in Woodstock (Langdon Reference Langdon, Dodds and Liddy2011). These figures relate to a single employer/place and so may well underestimate the work available to more enterprising and mobile women. Thus, although uncertainties about the availability of work bedevil attempts to interpret casual wages (Hatcher Reference Hatcher, Dodds and Liddy2011), in a context where women provided about one-third of all days worked (Broadberry et al. Reference Broadberry, Campbell, Klein, Overton and van Leeuwen2011), some would surely have seized the more rewarding option.
A second answer reaches beyond a model of the labour market that features rational and mobile workers and invokes the legal response to the Black Death in the form of the provisions of the Ordinance and Statute of Labourers. Most economic historians are agreed that the surviving labourers and artificers were not slow to take advantage of the post-plague scarcity by demanding more wages and higher prices for their crafts and wares (Putnam Reference Putnam1939; but see also Cohen Reference Cohn2007). Bertha Putnam, in her classic account, while acknowledging the likely hyperbole of the chroniclers, agreed that the “ ‘malice of servants’ appeared to employers the only appropriate phrase to describe the attitude of the labouring classes” (Reference Putnam1908, pp. 91–92). However, the reason we know about the peasantry's “malice” in demanding higher wages is because the state too was in reaction to the labour shortage. In England, as elsewhere, the ruling class's response to the sudden increase in the peasantry's power was a mix of concession and repression, with the latter exemplified by legislation to hold wages and prices down to levels prevailing before the Black Death, thereby preventing peasants and craftsmen from exploiting their scarcity. Thus on the manor of Cuxham response to the dislocation of 1349 involved both additional payments of 1s to the famuli “to do the lord's business the better” but then putting up stocks within which to punish recalcitrant workers as required by the Ordinance and Statute of Labourers (Harvey Reference Harvey1960, p. 89). Two hundred years later, the Shuttleworths of Gawthorpe contributed to the fabrication of a new “cook-stole and whipp-stock” (Harland Reference Harland1856, p. 246). The proceedings before Justices of Labourers and Quarter Sessions of Justices of the Peace with their long lists of labour offences testify to the intensity of this struggle (Putnam Reference Putnam1908, Reference Putnam1939; Sillem 1937; Kimball Reference Kimball1969; Thompson Reference Thompson1904; Penn Reference Penn1987; Penn and Dyer Reference Penn and Dyer1990).
While the extent of legislative enforcement remains debatable, the law's intentions were clear. First, all able-bodied men and women, free and bond, without definite means of support, were commanded to accept service at the rate of wages that had existed before the Black Death: the compulsory service clause. Second, reapers, mowers, and other workmen or servants were forbidden to leave their masters within the term of their contracts, without reasonable cause or permission, and other masters were forbidden to eloign workers or employ runaways: the contract clause. Third, nobody was permitted to give or receive higher wages than were customary: the wages clause (Putnam Reference Putnam1908). The provisions “stand out lucidly” (Putnam Reference Putnam1908, p. 71). They were intended to prevent workers from exploiting labour scarcity and, more particularly, holding up employers at key moments in the agricultural crop cycle. For our purposes what is important in the Statutes is that the provisions applied to women as well as men, that agricultural labourers were described by their occupations and their maximum legal wage specified, and that the contract of service was to be by the year or other usual term and never by the day (Putnam Reference Putnam1908; Richie Reference Richie and Carus Wilson1962). Service in summer was to be in the same place as in winter with the exception of labourers in certain districts in harvest time.
Even if these regulations were poorly enforced, they raised the costs of mobility and involved risks for recalcitrant workers, some of whom were whipped, humiliated in the stocks, returned to vindictive masters, and perhaps ultimately cowed. Among those falling foul of the Statutes were many women. Putnam references penalties imposed on women who had gone to another town in the autumn even though suitable service had been offered in their native place, or had reneged on a contract made with an employer, or had to be delivered back to masters to serve out their term at the command of the Justices (Putnam Reference Putnam1908, p. 198, p. 192, p. 214). In the lists of offenders against the Statute in Wiltshire in 1349, women loom large, singled out for harsh treatment (Thompson Reference Thompson1904). More recently Simon Penn has concluded that in both the proceedings before the Justices of Labourers and those before the County Quarter Sessions “women appear, often in substantial numbers, among those indicted” (Penn Reference Penn1987, p. 3). Significantly one-half of those described as common labourers were women and as Judith M. Bennett has recently argued “Equal numbers of women and men in presentments (court records) probably translated, in the world outside the courtroom, into a practice of compulsory service that was predominantly, perhaps overwhelmingly, female” (Reference Bennett2010, p. 23). Moreover, Poos (Reference Poos1991) provides examples of the Statutes brought to bear on a newly mobile female harvest workforce, penalized not just for taking excess wages but explicitly for moving from place to place. It is of course possible that presentments were selective and reflected the belief that wage demands by women were particularly offensive. On the other hand, it may be that indictments underestimate female offences because women workers were considered less important. Does women's strong representation among the resistance suggest that they were particularly restive or that they were selected for oppression? We agree with Bennett (Reference Bennett2010) that the compulsory service clause was particularly oppressive to women: infringing their geographical and occupational mobility, inhibiting their working casually by the day, and pressing them into annual service. The results are manifest in the relative trajectories of our two wage series and their failure to converge.
The Statute created a precedent and set the law in motion towards both the Elizabethan Statute of Artificers which also sought to impose maximum wages and restrict workers freedom of movement and the poor law which distinguished between the able bodied and those who could not work, and through settlement sought to penalise mobility. Both developments adversely impacted on women as the long lists of women removed, whipped, or imprisoned for vagrancy under the Tudor legislation suggest (for example, see Anderson Reference Anderson1931).
These ideas are speculative and further work is needed on the gender implications of the labour regulations. Support, however, is forthcoming from those who have seen the late medieval and early modern periods as eras of increasing suspicion of masterless persons with unmarried women working and living on their own the most mistrusted. As Bennett notes “… compelling a free-standing woman into service not only put her to work but also put her under supervision” (Reference Bennett2010, p. 38). Women who migrated to cities in search of employment were particularly distrusted; any woman travelling alone was suspected of immorality. Wiesner notes that in 1659, the city of Dublin ordered that “a large cage [be] set up in the corn market to imprison all beggars, idle women and maids selling apples and oranges” (Reference Wiesner1993, p. 89, p. 99). Michael Roberts suggests that single women seeking independent work were viewed with alarm in towns “whose authorities assumed the only suitable ‘place’ for such a woman was as a servant” (Reference Roberts, Ågren and Louise Erickson2005, p. 247) while women working alone in a trade were viewed as presenting unwarranted competition for householders with children to support (Froide Reference Froide, Bennett and Froide1999, pp. 249–50). Authorities’ coercion of those “out of service” back into subordinate employment aimed to maintain social order and keep wage levels down. Almost all the people prosecuted in Norwich before 1632 for living “at their own hand,” that is not as servants, were women, feared particularly because they had “not any man to controle them” (Roberts Reference Roberts, Ågren and Louise Erickson2005, p. 248; Griffiths Reference Griffiths1996, p. 356–8).
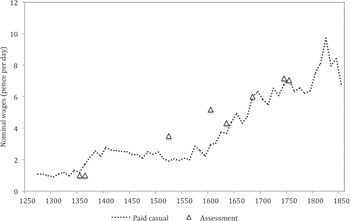
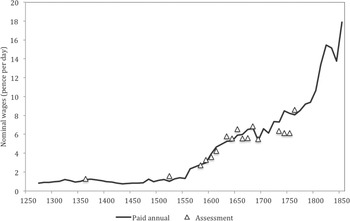
Figure 5 benchmarks our casual wages against surviving records of assessments. In the immediate aftermath of the Black Death legal prescriptions could not hold down wages in a labour market denuded of one-half the usual workers, and they rose steeply unhindered by the level of assessments. Thereafter, assessments primarily relate to harvest wages, the main concern of the Justices, and show that women rarely earned at the assessed level and fell well short in the 1500s. In contrast, Figure 6 suggests that in the medieval period remuneration from longer-term contracts was successfully held down by the legal ceiling, and although Justices of the Peace adjusted the assessed annual wages of women servants upwards in line with prices after 1560, the legal limits appear to have acted as a drag on wage growth until around 1700 (for a supporting view see, Roberts Reference Roberts1981).
UNSKILLED WOMEN'S NOMINAL CASUAL WAGES AND NOMINAL DAY WAGE ASSESSMENTS (BY DECADE)
Our decomposition of female wages into those earned casually, which included many married women, and those earned on annual contracts, by and large by younger unmarried women, has powerful implications for theories that see western European economic acceleration as the product of the European Marriage Pattern (EMP), itself founded on the gendered legacy of the Black Death (Hajnal Reference Hajnal, Glass and Eversley1965). The logic of these theories is unassailable. As Tine de Moor and Jan Luiten van Zanden see it “a strong increase in real earnings especially for women … accelerated the general adoption of the EMP… particularly among servants” (Reference De Moor and Luiten van Zanden2010, p. 11). Women's improved position in the post-plague labour market and especially the growth of opportunities as servants in husbandry linked to the relative expansion of “horn” that is pastoral agriculture (in which women had a comparative advantage) versus “grain” (in which they did not) allegedly pushed up female wages and labour force participation. Nico Voigtländer and Hans-Joachim Voth see fertility restriction emerging as an indirect consequence of the abundance of land after 1348–1350. The Black Death “raises land-labor ratios and thus wages … raising female employment opportunities outside the peasant household … increased the average age at first marriage for women, reducing fertility rates. This in turn lowered population pressure in a Malthusian setting and helped to keep wages high …” (Voigtländer and Voth Reference Voigtländer and Voth2013, p. 2229, p. 2260).
WOMEN'S UNSKILLED ANNUAL WAGES AND ANNUAL WAGE ASSESSMENTS (BY DECADE)
However attractive these historical hypotheses, they lack empirical foundation. Our unpacking of the wage trajectories, while consistent with medievalists’ accounts of workers’ preferences for daily work and gender historians’ recognition that women workers faced increasing difficulties in the 1400s, offers little support for these models. Women's gains in the post Black Death labour market were subdued as far as annual service is concerned with wages held down by an institutional heavy hand and maybe, outside the towns, by insufficient work. This offered little in the way of inducement to remain independent, postpone marriage and so reduce fertility. Ironically, the patterns in our wages suggest the opposite: it was married women who gained to the extent that they were often able through their husbands to access better-paid casual labour and share in the boost that demographic collapse gave to men's remuneration and family incomes. This appears consistent with the fragmentary evidence we have on age at marriage in the late medieval period; Jeremy Goldberg, for example, suggests that for women in towns, an independent living was “harder to find and more precarious as the fifteenth century drew to a close” and as a result he speculates that they may have married earlier (Goldberg Reference Goldberg1986, p. 20). As for women in the countryside, their situation had always been less rosy. In short, the empirical record is more consistent with this less optimistic account of the gendered legacy of the Black Death and offers little in support of an English version of a “girl-powered” economic breakthrough.
THE ERA OF INDUSTRIALIZATION
Whether or not women benefitted from the industrial revolution is a question that has attracted even more attention than has the legacy of the Black Death. Optimists have argued that industrialization in both its protoindustrial and its factory phase, benefitted women, providing them with new opportunities and higher paid work (Pinchbeck 1981; McKendrick Reference McKendrick and McKendrick1974); indeed this view lies at the core of Jan de Vries influential account of an “industrious revolution” as the precursor of industrialization proper (De Vries Reference de Vries2008). In contrast, pessimists have argued that industrialization by taking work out of the home into formalized and centralized workplaces disadvantaged women who became less able to support themselves and more dependent on men and male wages (Horrell and Humphries Reference Horrell and Humphries1995). Some historians draw the line at domestic manufacturing: outworking promoted women's independence and wellbeing; formalized industry disadvantaged them (Berg and Hudson Reference Berg and Hudson1992; Berg Reference Berg1993). Another distinction is between married women who could not adapt to regular hours and centralized workplaces and unmarried women who could, though here again the causes and timing of changes in behaviour are debated (Burnette Reference Burnette2008; Sharpe Reference Sharpe1998; Verdon Reference Verdon2002; Shaw-Taylor Reference Shaw-Taylor and Goose2007; Goose Reference Goose2007).
Ivy Pinchbeck's classic (1981) work precipitated a discussion of the extent to which the capitalist development of English agriculture displaced women workers and whether this was interrupted in the late 1700s and early 1800s by added-worker effects prompted by inadequate male wages, enlistment in the French wars and changes in the generosity of poor relief (Horrell and Humphries Reference Horrell and Humphries1995; Burnette Reference Burnette1997, Reference Burnette1999, Reference Burnette2004; Verdon Reference Verdon2002). Even if there were short run interruptions, the long run decline in women's opportunities seems incontrovertible with women fieldworkers working less than one-half of a year by the mid-eighteenth century (Burnette 2007).
Most recently, Allen has extended his “High Wage Economy” explanation of the industrial revolution to include women and children (Allen Reference Allen2015). Women's wages are particularly moot for Allen argues explicitly that it was the high cost of spun yarn, in turn a product of high spinners’ wages, that made the spinning jenny a profitable investment and so precipitated the macro inventions in textile machinery (Allen Reference Allen2009). While our series exclude spinners’ wages as their computation on comparable terms raises specific problems, the ubiquity of hand spinning and its relatively unskilled nature implies that the daily rewards from hand spinning should move in line with casual wages. Can we find evidence of a spinners’ high wage economy in our evidence or reciprocally of the collapse in wages when hand spinning came into competition with machines from 1760 onwards?
The expansion of the factory system created new jobs for women workers. Even if machine spinning eventually became a man's job when the heavier mules were introduced, women and children dominated the early factory workforce. According to Stanley Chapman “[T]he cotton mills of the Arkwright era typically employed about 200 to 250 people, mostly unskilled juveniles and females who proved easy to train and manage” (Reference Chapman1992, p. viii; see also Minoletti Reference Minoletti2011). Such work did however require commitment and regularity and is perhaps best understood as competitive with annual service, especially as some evidence suggests that younger unmarried women became a particularly important component of the workforce as the nineteenth century wore on. How does our annual wage series compare with wages earned by women spinning on jennies in the late 1700s or employed in the new Arkwright-type mills in the early nineteenth century?
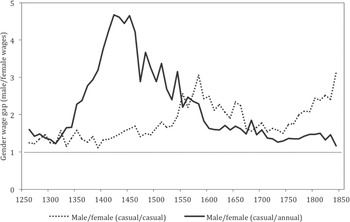
After 1550, although both casual and annual wages for women increased, their trajectories relative both to each other and to the wages of unskilled men diverged. Women's casual rates, which had tracked men's wages after the Black Death, fell away, creating a widening gender gap after 1500 and, although there was some recovery in the seventeenth century, there was a further relative decline after 1750 that appears sustained (see Figure 7). These findings are consistent with an account that emphasizes the secular decline in opportunities for women in agriculture, relieved to some extent by protoindustrial development, particularly in the seventeenth and early eighteenth centuries, but relative to their male peers, women's casual wages appear adrift from a “High Wage Economy.” The widening gender gap from around the 1760s coincides neatly with the onset of competition from spinning machinery and the catastrophic fall in spinners’ potential earnings (Eden Reference Eden1797; Valenze Reference Valenze1995; Muldrew Reference Muldrew2012).
THE GENDER WAGE GAPS OF UNSKILLED WORKERS (BY DECADE)
Our mean wage for 1780–1790, 6.37d is close to the 6.25d that Arthur Young suggested was typical for women spinning wool in the late 1780s (cited in Allen, Reference Allen2015, p. 9). At this point the wool trade was in depression, exacerbated by the displacement of cotton spinners already affected by mechanization into wool and wages had been falling. Allen suggests that earlier in the century, spinners were able to earn as much as 8–10d though for a 10 to 12 hour day (Allen 2012). His sources are more circumspect, wary of regional variations, differences by types of fibre and periods of slack trade (Pinchbeck 1981, p. 138, p. 142; see also Sharpe Reference Sharpe1996, pp. 30–37). Young said that women cotton spinners around Manchester in 1768 earned a more modest wage between 2s and 5s per week (cited in Pinchbeck 1981, p. 139), the mid-point of which is more congruent with our nominal wages. Moreover, these good times, associated with the demand for cotton yarn only began in the second quarter of the eighteenth century and soon after 1770 were superseded by the inventions, while woollen spinners in the seventeenth century appear for the most part to have been badly paid (Pinchbeck 1981, p. 140; Clark Reference Clark1919, p. 95). Perhaps any high wage economy for women working casually, underpinned by spinners’ potential earnings, was as Pinchbeck suggests “not of long duration” (Pinchbeck 1981, p. 140).
Given our association of casual work with married women's employment, this interpretation chimes with accounts which emphasize the narrowing of opportunities for wives and mothers to contribute to the family incomes of labouring men and the development of a male breadwinner family structure in the absence of sufficiently high men's wages (Horrell and Humphries Reference Horrell and Humphries1995). The widening gap shown in Figure 7 between the wages of male farm labourers and those of women casually employed sends a clear signal: married women and their children became increasingly dependent on husbands and fathers, who as Francis Moore wrote in 1773 “alone must wield the labouring oar” (quoted in Pinchbeck 1981, p. 141).
On the other hand, women's remuneration from annual contracts, flat for most of the medieval period, improved dramatically thereafter (Figures 4 and 6). Although comparison with Clark's series for male day labourers is tendentious, in the absence of any series for men servants it is used in Figure 7 to provide a relative perspective. This comparison rests on the common assumption that men worked 260 days per year. In comparison with the huge wage gap characteristic of the middle ages, the early modern and early industrial eras saw greater equality. For women able to accept annual contracts, young unmarried women, the late eighteenth and early nineteenth centuries appear to have afforded opportunities, or at least their wages stayed in touch with those of their unskilled male counterparts, underpinned by the rates available in the emerging factories and centralised workplaces of industrializing Britain. In nominal terms, by the end of our period, our daily earnings on long-term contracts are in line with the 19p or 15p per day which cotton or woollen factory workers could expect (Pinchbeck 1981, pp. 190–4), and although other textile factory workers did not fare so well the new opportunities kept wages ahead of living costs. Domestic servants whose wages had been stable for decades (Wark Reference Wark1997; Field Reference Field2013) started to see an improvement. Perhaps women even began to demand recompense for the loss of liberty implicit in residential service, reversing the old differential whereby secure employment and a place to live had apparently offset relatively low cash wages.
CONCLUSION
The main contribution of this article is a new wage series for unskilled English women workers from 1260 to 1850 comparing casual day wages with annual contracts. The two series exhibit secular differences in levels and trends, which help answer some outstanding questions in British economic history. The series suggests that while women who had access to the casual labour market did share in the post plague “golden age” with their male counterparts, women who worked on annual contracts did not. There is little evidence to support the view that the late medieval and the beginning of the early modern era provided new opportunities for young unmarried women tempting them to delay marriage and reduce fertility, with the resulting EMP raising incomes and promoting further growth. If the Black Death did create the west via the EMP it is not evident, as logic suggests it should be, in the relative wages of female servants.
The series also casts light on the long-running debate about the effects of industrialization on women's economic opportunities and wellbeing as well as the more recent claims about women's participation in an eighteenth-century “High Wage Economy.” Although there is some evidence for relative improvement in women's casual wages in the late seventeenth and early eighteenth centuries, perhaps generally underpinned by protoindustrial development, and opportunities in spinning in particular, this was only a temporary interruption to a longer run decline. The failure of pay in the casual female labour market to keep up with male wages suggests that for those women who were unable to commit to full time annual work, industrialization offered few gains. Married women and their children likely became increasingly dependent on men. In contrast, women who were able to commit to long hours of continuous work outside the home either as farm or domestic servants or increasingly as factory girls and then later shop and office workers saw their relative position improve. It was largely then single women free from family responsibilities who could profit from the momentous economic changes of the era of industrialization.
Appendix
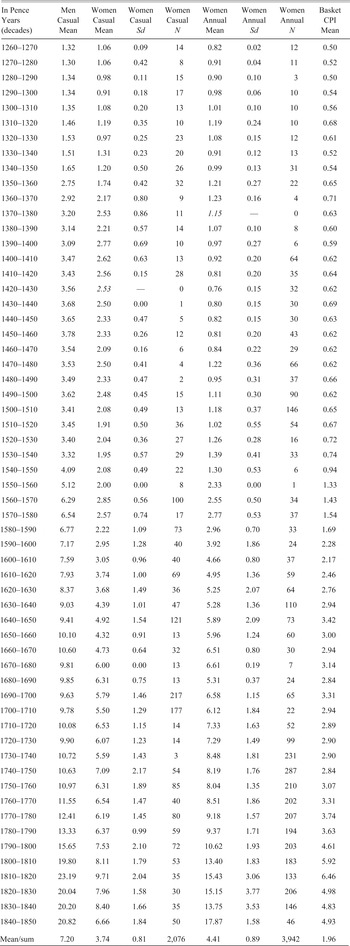
THE WAGES IN PENCE PER DAY OF UNSKILLED MEN AND WOMEN (BY DECADE)
PRIMARY SOURCES
All Souls College
Domestic Accounts
Bedfordshire Record Office
Wrest Park Collection,
L31/223.
Blenheim (Records in Situ)
XXIII 77/6, 77/9, 77/10.
Bodleian Library
-
Ms. Eng. e. 3855, unknown Oxfordshire farm accounts, 1756–1762.
-
Gough Lond. 53(1), Papers from Middlesex County Hospital for Smallpox.
-
Ms. Latin Misc c 66, account books of Sir Humphrey Newton, 1498–1506 and 1519.
-
North Papers,
-
MS. North c. 58-9.
-
MS. North e. 25.
-
Harcourt Estate Papers,
-
MS. D.D. Harcourt b.11.
-
MS. D.D. Harcourt c.135–8.
-
MS. D.D. Harcourt c. 143.
-
MS. D.D. Harcourt c. 173.
-
MS. D.D. Harcourt d.3.
-
MS. D.D. Harcourt e. 1-2.
British Library
-
Blenheim Collection,
-
Add MS 61349.
-
Add MS 61420.
-
Add MS 61436.
-
Add MS 61472.
-
Add MS 61656.
-
Add MS 61678.
-
Add MS 61679.
-
Add MS 61680.
Buckinghamshire Record Office
-
Chester Collection,
-
D/C/2/45, D/C/4/5.
-
Drake Collection,
-
D/DR/2/48, D/DR/2/89, D/DR/2/164, D/DR/2/176/, D/DR/5/121, D-X/963, D-X/762.
-
Fortescue of Salden House Collection,
-
D-X/1280/11.
-
Hampden Collection,
-
D/MH/30/5, D/MH/30/19, D/MH/33/1-28.
-
Paget of Marlow Collection,
-
D-X/728.
-
Nether Winchendon Estate Collection,
-
D/SB/PFA/9/4.
-
D/SB/PFA/5/1(b).
-
D/SB/PFA/5/12.
-
D/SB/PFA/7/11.
-
D/SB/PFA/7/28.
London Metropolitan Archive
-
Osterley Park Estate Collection,
-
ACC/0510/727.
-
ACC/1128/094.
-
ACC/1128/098-101.
-
ACC/0510/719-726.
-
ACC/0331/033.
-
ACC/0331/041.
Hampshire Record Office
-
Highclere/Pinniger Collection,
-
75M91.
-
15M52.
Huntington Library
-
Hastings Collection,
-
HAF/25/48, HAF/34/41, HAF/52/16, HAF/53/10, HAF/56/7, H.L.
-
HAF/46/9, HAF/48/2, HAF/49/4, HAF/53/7, HAF/71/Unsorted Bundle, HAF/75/Unsorted Bundle.
Northampton Record Office
-
Apethorpe Collection,
-
W(A) box 4/ parcel iv/ No 5 /b.
-
Brooke of Oakley Collection,
-
B/56, B/99.
-
Brudenell Collection,
-
BRU Household Accounts.
-
Cartwright Collection,
-
C(A)/5430.
-
Finch Hatton Collection,
-
FH/287, FH/288, FH/291, FH/475, FH/481, FH/482, FH941, FH/Box X1194/YZ1503.
-
Fitzwilliam (Milton) Collection,
-
Miscellaneous volumes: FM/8, FM/106, FM/190/1645, FM/6, FM/20, FM/50, FM/106, FM/X175, FM/74, FM/23, FM/ 8/X1753.
-
Paget of Marlow Collection, D-X 728
Oxfordshire Record Office
-
Lee-Dillon Collection,
-
DIL I/L/ 33 (a-v).
-
DIL I/L/103 (a+b).
-
DIL I/O 8-13.
-
DIL I/O 30, 33, 37, 58.
-
Chastleton Estate Collection,
-
E24/1/F2/5.
-
E24/1/F2/8.
-
Bletchington Park Collection,
-
E6/2/F1/1-3.
Shakespeare Birthplace Trust Library
-
Compton Verney Collection,
-
DR98/1799-1816.
-
Archer Collection,
-
DR 37/3/13.
-
DR 37/3/9.
Wiltshire Record Office
-
Enford Collection, 415/86
-
Ballard Collection, 1195/22
-
Chippenham Collection, 811/207
-
Duke of Somerset Collection, 1332/2/1/2


