Introduction
Comprehending fluent speech in a nonnative language is one of the greatest challenges for any language learner. When trying to understand what someone is saying, listeners—native (L1) and nonnative (L2)—make use of a variety of multisensory information that could potentially be helpful, including both linguistic and nonlinguistic (e.g., gestural) cues. One potential source of information is the talker’s mouth. Research on speech perception has shown that being able to see the talker’s mouth generally improves comprehension (Grant & Bernstein, Reference Grant, Bernstein, Lee, Wallace, Coffin, Popper and Fay2019). This has been attributed to the fact that listeners automatically integrate spatiotemporally congruent auditory and visual cues from mouth movements (McGurk & MacDonald, Reference McGurk and MacDonald1976) and that the integration of multisensory cues leads to more salient communicative signals (Partan & Marler, Reference Partan and Marler1999). Concurrent visual cues from the mouth—variably referred to as audiovisual (AV) or visual speech cues—have been found to benefit comprehension especially when listening conditions are challenging, due to either internal reasons such as hearing impairment or external factors such as noise (Sumby & Pollack, Reference Sumby and Pollack1954). Under such adverse conditions, listeners tend to increase their attention to the talker’s mouth (Vatikiotis-Bateson et al., Reference Vatikiotis-Bateson, Eigsti, Yano and Munhall1998). As Lecumberri et al. (Reference Lecumberri, Cooke and Cutler2010) noted, “If listening in adverse conditions is hard, then listening in a foreign language is doubly so: non-native listeners have to cope with both imperfect signals and imperfect knowledge” (p. 864). Thus taken together, if listeners increase their attention to the mouth in adverse listening conditions and listening to a nonnative language constitutes an adverse listening condition, this naturally leads to the hypothesis that nonnative listeners will look more at a talker’s mouth than native listeners do. Moreover, on the assumption that with increasing familiarity and proficiency in the nonnative language listening to that language becomes less challenging, we may further hypothesize that L2 proficiency will modulate attention to the mouth, with attention to the mouth decreasing with increasing proficiency.
These two hypotheses were recently put to the test by Birulés et al. (Reference Birulés, Bosch, Pons and Lewkowicz2020). The findings of this study (described in more detail below) showed significantly more looks to the mouth among L2 learners than among native listeners; however, there was no evidence that proficiency within the L2 group modulated learners’ attention to the mouth. The lack of modulation by proficiency was surprising and remained unexplained. It was this unexpected empirical finding that provided the original motivation for our attempt to replicate Birulés et al.’s experiment. Visual attention to the mouth has been investigated quite extensively in the speech perception literature with native adult listeners as well as in the literature on early childhood development (monolingual: Lewkowicz & Hansen-Tift, Reference Lewkowicz and Hansen-Tift2012; and bilingual: Morin-Lessard et al., Reference Morin-Lessard, Poulin-Dubois, Segalowitz and Byers-Heinlein2019). Birulés et al. were the first to extend these lines of research to adult L2 learners, with their hypotheses firmly grounded in previous work in cognitive science and developmental psychology. Yet this inquiry also appears of relevance to the wider field of second language acquisition (SLA) and applied linguistics, where research on L2 listening comprehension has shown benefits of visual speech cues in both laboratory and classroom contexts (e.g., Hardison, Reference Hardison1996, Reference Hardison2003; Sueyoshi & Hardison, Reference Sueyoshi and Hardison2005), and the role of visuals in language assessment is an area of active inquiry (for review, see Suvorov & He, Reference Suvorov and He2022). Furthermore, from a more applied perspective, the wearing of face masks during the COVID-19 pandemic has drawn broader attention to the role of visual speech cues from the face during communicative interactions in general and in educational settings in particular (e.g., Schwarz et al., Reference Schwarz, Li, Sim, Zhang, Buchanan-Worster, Post, Gibson and McDougall2022). In the context of equity in education, understanding if and how students with lower proficiency in the language of instruction might be disproportionately influenced by teachers wearing face masks has practical implications for deciding to what extent such students may be in need of extra support.
We thus believe that probing the validity and generalizability of Birulés et al.’s (Reference Birulés, Bosch, Pons and Lewkowicz2020) findings through a conceptual replication is important for both theoretical and applied reasons. We further hope that this study will contribute toward a more integrated interdisciplinary discussion of the role audiovisual speech cues in language comprehension in the fields of cognitive science, developmental psychology, and SLA.
The role of visual speech cues in L1 and L2 listening
Based on several decades of research in the field of speech perception (for review, see Grant & Bernstein, Reference Grant, Bernstein, Lee, Wallace, Coffin, Popper and Fay2019), it is now well established that when listeners are able to see a talker’s face, speech perception and comprehension generally improve. The effects of visual speech cues—that is, seeing lip and mouth movements synchronously with the acoustic signal—are particularly apparent under adverse listening conditions. In a classic study, Sumby and Pollack (Reference Sumby and Pollack1954) showed that speech intelligibility was greater for listeners facing the talker than for those faced away and the difference between the two increased as noise levels increased. More recent work has investigated listeners’ attention to the talker’s mouth directly by monitoring their eye gaze while listening. Vatikiotis-Bateson et al. (Reference Vatikiotis-Bateson, Eigsti, Yano and Munhall1998) recorded L1 adults’ eye movements while they watched videos of talkers reading short conversational monologues overlaid with different levels of noise. Results showed that although listeners predominantly fixated on the talker’s eyes, looks to the mouth increased with increasing noise, suggesting that the more degraded the acoustic signal becomes, the more listeners look for potentially helpful information from other sources, such as visual cues from the mouth.
Notably, Vatikiotis-Bateson et al. (Reference Vatikiotis-Bateson, Eigsti, Yano and Munhall1998) tested both native English speakers listening to monologues in English and native Japanese speakers listening to monologues in Japanese. They observed the same overall shift of attention to the mouth with increasing noise in both groups, indicating that increased attention to visual speech cues under adverse listening conditions appears to generalize across linguistic and cultural contexts. In a series of studies, however, Sekiyama and colleagues found that when compared with English speakers, Japanese speakers consistently paid less attention to the mouth and more attention to the eyes both during and before the presentation of auditory stimuli (Hisanaga et al., Reference Hisanaga, Sekiyama, Igasaki and Murayama2016; Sekiyama & Burnham, Reference Sekiyama and Burnham2008). Sekiyama and Burnham (Reference Sekiyama and Burnham2008) provided a potential linguistic explanation for this difference, suggesting that the smaller (vocalic) phoneme inventory of Japanese might make the potential contribution of visual speech cues less relevant to speech perception in Japanese. Meanwhile, research on emotion processing has reported cross-cultural differences whereby “Eastern” participants tend to pay greater attention to the eyes than “Westerners” do (Jack et al., Reference Jack, Blais, Scheepers, Schyns and Caldara2009). Whether linguistic or cultural (or both) in origin, such cross-population differences must be borne in mind as a potentially confounding factor when comparing nonnative, especially Japanese, with native English listeners. Importantly, however, despite Japanese listeners’ reduced reliance on visual speech cues in noise-free conditions, Sekiyama & Tohkura (Reference Sekiyama and Tohkura1991) found that Japanese listeners, like their English-speaking counterparts, increased reliance on visual cues with increased noise. This suggests that more adverse conditions lead to increased reliance on visual speech cues in listeners across cultural backgrounds. Thus to the extent that processing a nonnative language constitutes an adverse condition, we may expect that nonnative listeners will increase attention to the mouth regardless of cultural background; in other words, the observed cross-cultural differences should not present a confound when testing the hypothesis that proficiency modulates L2 listeners’ attention to the mouth, as long as L2 participants come from the same cultural background.
In a study with both native and nonnative (L1 German) speakers of Dutch, Drijvers et al. (Reference Drijvers, Vaitonytė and Özyürek2019) observed that noise increased looks to the mouth among both L1 and L2 listeners, thus demonstrating that increased reliance on visual speech cues in a noisy environment extends to nonnative listening as well. Although no direct statistical comparisons between L1 and L2 listeners’ looks to the mouth were reported, data visualizations (Figure 7, p. 16) suggest that relative attention to the mouth may have been greater among L2 listeners. A more direct investigation of the role of language familiarity on relative attention to the mouth was conducted by Barenholtz et al. (Reference Barenholtz, Mavica and Lewkowicz2016), who found that monolingual English-speaking adults fixated on the talker’s mouth more when listening to a language they did not know (Icelandic or Spanish) than when listening to English. When they conducted the same experiment with a group of Spanish-English bilinguals, the authors found the bilingual participants looked equally at the mouth when listening to an English or to a Spanish talker. Taken together, these findings indicate that language familiarity, operationalized in categorical terms as high/native fluency or complete unfamiliarity, modulates the extent to which listeners seek information from visual speech cues.
Birulés et al. (Reference Birulés, Bosch, Pons and Lewkowicz2020, Experiment 1) presented further evidence for modulation of attention to visual speech cues by language familiarity operationalized in categorical terms: Spanish-Catalan bilinguals with no or very limited knowledge of English looked more at a fluent trilingual talker’s mouth when that talker spoke English than when she spoke either Spanish or Catalan. In a second experiment (Birulés et al., Reference Birulés, Bosch, Pons and Lewkowicz2020, Experiment 2), instead of manipulating the language of the talker while holding listeners’ language background constant, the authors held the language of the talker constant and explored the variability in listeners’ language backgrounds. More specifically, a group of native English speakers as well as three groups of Spanish-Catalan bilingual L2 learners of English divided by proficiency level (n = 19 per group) watched three 20-s videos of a female native speaker of American English deliver short monologues on different topics while their eye gaze was recorded. Each video was followed by three multiple-choice comprehension questions. For the analysis of the eye-gaze data, the authors defined three areas of interest (AOIs) in the videos: the talker’s eyes, mouth, and face. They then calculated proportion of total looking time (PTLT) to the eyes and mouth, respectively, by dividing each participants’ total dwell time on the eyes/mouth by their total dwell time on the face. These PTLT scores constituted the dependent variable in a 4 (Group) × 2 (AOI: eyes, mouth) mixed repeated-measures analysis of variance (ANOVA), which critically yielded a significant interaction, indicating that the four groups differed in their relative attention to the eyes versus the mouth. Follow-up independent t tests showed that L1 speakers looked significantly less at the mouth—and more at the eyes—than all three groups of L2 learners, yet no significant differences emerged between the three L2 groups. Although L2 participants were assigned to subgroups based on self-reported proficiency levels in the Common European Framework of Reference (CEFR), they also completed the Cambridge General English Test (hereafter Cambridge Test), a freely available 25-item multiple-choice test intended as a quick proficiency diagnostic for general placement purposes (https://www.cambridgeenglish.org/test-your-english/general-english/). To further explore potentially modulating effects of proficiency among L2 listeners, Birulés et al. examined correlations between relative attention to the eyes versus the mouth (PTLTeyes minus PTLTmouth) and scores on the Cambridge Test as well as participants’ performance on the postviewing comprehension tests. No meaningful correlations emerged (|r| ≤ .10, p > .40).
As noted above, the absence of proficiency as a modulating factor in L2 listeners’ relative attention to the mouth is a surprising finding in light of evidence from different lines of research consistently indicating that the more challenging the listening condition, the greater listeners’ attention to visual speech cues. A limitation of Birulés et al.’s study is that proficiency was measured with only a single, small-scale comprehension test. It is thus possible that the measure of proficiency used did not capture sufficient relevant variability to allow for a relation between proficiency and attention to the mouth to emerge. An additional potential limitation lies in the nature of the listening materials, which consisted of three very short (20 s) passages, two of which contained “politically incorrect opinion pieces” as part of a larger project on morality (Joan Birulés, personal communication, June 12, 2021). As it is impossible to determine whether and how specific properties of these materials affected participants’ listening behavior, a replication with different passages appeared advisable. In the present study, we therefore included different listening passages as well as two additional measures of proficiency. The experiment we report thus constitutes a conceptual replication of Birulés et al.’s (Reference Birulés, Bosch, Pons and Lewkowicz2020) Experiment 2 because it contains “more than one change to one or more significant variables” (Marsden et al., Reference Marsden, Morgan-Short, Thompson and Abugaber2018, p. 367).
This Study: Conceptual replication of Birulés et al. (Reference Birulés, Bosch, Pons and Lewkowicz2020, Experiment 2)
The goal of the present study was to test to what extent the two main findings from the original study—(1) greater attention to the mouth in L2 vs L1 listeners and (2) no modulation of relative attention to the mouth by L2 proficiency—could be replicated with a different group of participants, different listening materials, and different proficiency measures. It thus addresses the same two research questions as the original study:
-
• RQ1: Do nonnative listeners look at a talker’s mouth more than native listeners?
-
• RQ2: Among nonnative listeners, does L2 proficiency modulate attention to the talker’s mouth?
Differences between the participants in the original and the replication study were determined primarily by the locations in which the respective studies were conducted, and thus they were largely beyond experimenter control. Differences in the materials, on the other hand, were open to more targeted manipulation. As noted by the authors of the original study, the brevity of their 20-s passages made it difficult to create meaningful comprehension questions, which led them to suggest that it might be better to include a longer passage and questions from a validated listening comprehension test (Joan Birulés, personal communication, June 12, 2021). Attempting to incorporate these insights while also keeping materials as comparable as possible to those in the original study in other respects, we created a 1-min video based on an existing listening comprehension passage (described in more detail below) with a speech rate and talker similar to the original study (Video 1). In addition, largely as a result of discussions concerning what a talker “similar” to that in the original study should look and sound like, we decided to include a second 1-min video (Video 2, described in more detail below) to further explore the generalizability of the effects under investigation with a different talker and with materials that were somewhat more divergent from those in the original study.
To further probe the potentially modulating role of L2 proficiency (RQ2), we included three independent measures of proficiency, acknowledging that proficiency is a complex construct (e.g., Hulstjin, Reference Hulstjin2012) that is unlikely to be captured comprehensively by a single short test. In addition to the Cambridge Test used in the original study, we included two other measures of general English proficiency often used in SLA research: the LexTALE English test (Lemhöfer & Broersma, Reference Lemhöfer and Broersma2012) and participant self-ratings (e.g., Marian et al., Reference Marian, Blumenfeld and Kaushanskaya2007). The choice of these tests was determined by the availability of reliability and external validity reports for both of these measures (Lemhöfer & Broersma, Reference Lemhöfer and Broersma2012; Marian et al., Reference Marian, Blumenfeld and Kaushanskaya2007) as well as by practical constraints that limited the total time of the test session that participants (drawn from a university subject pool) could attend. Although it would have been more ideal to include a more comprehensive measure of English proficiency, previous research in our lab found moderate to strong correlations between self-ratings, LexTALE English, and overall scores on the Versant English Test (Pearson, 2011), a comprehensive proficiency assessment involving all four subskills; Grüter & Rohde, Reference Grüter and Rohde2021). Thus we had some evidence to support the assumption that both self-ratings and the LexTALE English test would tap into at least some variability relevant to the complex construct of proficiency. In the hopes of capitalizing on the different aspects of variability captured by each of the three measures, we calculated an index of relative proficiency for our L2 sample from the combined scores. We hypothesized that such a combined measure would capture a greater amount of relevant variance in proficiency and may thus yield the modulation of attention by proficiency that Birulés et al. (Reference Birulés, Bosch, Pons and Lewkowicz2020) had predicted but not observed.
Power analysis and data collection strategy
We used the data from the original experiment, generously made available by Joan Birulés, to conduct an a priori power analysis to determine the minimum sample sizes needed for detecting a significant interaction between group (L1, L2) and AOI (eyes, mouth) of the size reported in Birulés et al. (Reference Birulés, Bosch, Pons and Lewkowicz2020) with .80 power and α = .05. Given that Birulés et al. found no reliable differences between the three nonnative groups split by proficiency, and considering that splitting a continuous distribution into categorical factor levels generally reduces power (Plonsky & Oswald, Reference Plonsky and Oswald2017), we did not plan to split L2 participants in this study into subgroups. We thus recalculated the mixed ANOVA on the original data with group as a 2-level (native, nonnative) instead of a 4-level factor.Footnote 1 This yielded an interaction effect of F(1,74) = 20.00, p < .001, η p 2 = .213. We also used the original data to calculate the correlation among repeated measures (r = −.82). These values were entered into G*power (Faul et al., Reference Faul, Erdfelder, Lang and Buchner2007) to compute required sample size given α, power, and effect size for a within-between interaction in a repeated-measures ANOVA. This indicated a minimum total sample size of N = 30 (15 per group). Considering that the real effect may be somewhat smaller than what was observed in Birulés et al., we reran the same calculation with a smaller η p 2 of .14, the lower bound of what is generally considered a large effect. This yielded a required total sample size of N = 46. To ensure sufficient power for replicating the effect critical for addressing RQ1, we thus planned to include a minimum of 30 native and 30 nonnative speakers of English.
The study was open for enrollment on the University of Hawai‘i at Mānoa participant pool from November 2021 until May 2022, with no restrictions on language background. We expected to reach or exceed the required sample size for the native but not the nonnative group by the end of this period. We thus also actively recruited students from short-term English language programs at the same institution during this same period. We specifically targeted Japanese learners of English so as to keep learners’ L1 background largely constant, as in the original study, and to probe the generalizability of Birulés et al.’s (Reference Birulés, Bosch, Pons and Lewkowicz2020) findings from a European to an Asian L2 learner population.
Participants
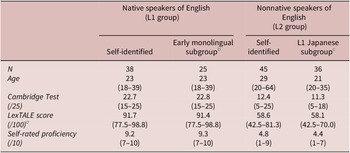
A total of 88 participants completed the study. Five were excluded due to unsuccessful eye-gaze calibration. Of the remaining 83, 38 identified as native (24 female, 14 male) and 45 as nonnative speakers of English (41 female, 4 male). Inspection of their language background profiles revealed that of the 38 self-identified native speakers, 13 would traditionally be classified as early bilinguals, as they indicated the presence of at least one language in addition to English in their childhood homes. All indicated English as their currently dominant language. Table 1 presents descriptive statistics for the entire group of self-identified native speakers (N = 38) and for the subset of participants traditionally included in L1 groups in language research—that is, those with no reported exposure to other languages during childhood (N = 25). In light of the fact that the subgroup differed little from the entire group on all measures and acknowledging that many self-identified native speakers are not early monolinguals, we decided to include all 38 self-identified native speakers in the L1 group.Footnote 2
Participant information (means and ranges)

a LexTALE scores are missing for one native and one nonnative participant.
b These constitute a subset of the self-identified native group.
c These constitute a subset of the self-identified nonnative group.
Of the 45 self-identified nonnative speakers, 36 were native speakers of Japanese. Of the remaining nine, seven were speakers of East Asian languages (Chinese, Korean) and two were speakers of European languages (Dutch, Italian). Table 1 presents descriptive statistics for all 45 as well as for the subgroup of L1 Japanese speakers. For the sake of generalizability and power, we included all 45 self-identified nonnative speakers in the analysis. We note that based on the general correspondence between LexTALE scores and CEFR proficiency levels indicated in Lemhöfer and Broersma (Reference Lemhöfer and Broersma2012), more than half of our nonnative speakers (n = 24) were situated at levels B1 or lower (LexTALE scores < 59%) and only one at C1 or above (≥80%). Our nonnative group is thus most comparable to the low- and intermediate-proficiency groups in the original study.
Materials
Video 1
Instead of creating three 20-s listening passages as in the original study, we followed suggestions from the authors of the original study (see above) and adapted an existing passage from a study of item properties on an L2 listening comprehension test (Papageorgiou et al., Reference Papageorgiou, Stevens and Goodwin2012), which we estimated to yield an approximately 60-s recording if delivered at a fast speech rate. We also included the four multiple choice comprehension questions for this passage from Papageorgiou et al. To match the total number of questions in Birulés et al. (Reference Birulés, Bosch, Pons and Lewkowicz2020; three passages, each followed by three questions), we created an additional five questions in the same format. All materials are available on OSF (https://osf.io/pua45/).
As in the original study, the talker was a female, Caucasian, self-identified native speaker of American English. Although it is now widely recognized, at least in academic circles, that there are many different types of native English speakers around the globe (e.g., Canagarajah, Reference Canagarajah2007), the stereotype of the native English speaker as White and from an inner-circle country persists, especially in Asian countries (e.g., Ruecker & Ives, Reference Ruecker and Ives2015). As the target nonnative participant group in this study was Japanese, we felt it was important for the talker to conform to this stereotype, given that social expectations about talkers based on factors such as ethnicity have been shown to affect speech perception (e.g., McGowan, Reference McGowan2015). The talker was video-recorded from the shoulders up while reciting the script from memory. The talker was instructed to speak naturally as if addressing the person behind the camera, minimize head and body movement, and speak for a total duration of approximately 1 min. The duration of the final recording was 57 s, with an average speech rate of 249 words per minute (wpm).Footnote 3
Video 2
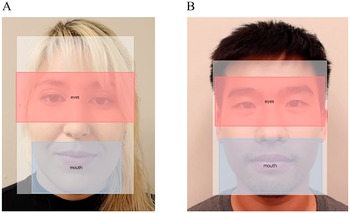
Video 2 differed from Video 1 in two potentially important respects: the nature of the passage and the talker. The passage and comprehension questions for Video 2 were written for the purpose of this study, with the goal of creating a listening passage that is closer to casual speech in terms of both content (a student talking about his daily life) and speech rate (190 wpm). The talker in Video 2, unlike the talker in Video 1, did not fit the stereotype of the native English speaker discussed above (see Figure 1 for screenshots of both talkers, with overlaid AOIs). This talker self-identified as Chinese American and as a native speaker of English, with self-rated overall proficiency of 8/10 and a reported age of acquisition (AoA) of 6 years. He also indicated early exposure and high proficiency in two other languages: Cantonese (AoA: 0; proficiency 9/10) and Mandarin (AoA: 3; proficiency 7/10). We decided to include this talker because we felt that he was more representative of English speakers in the environment in which this study was conducted. In order to gauge to what extent participants’ perception of this talker aligned with his self-identification, we asked participants to rate both talkers’ nativeness on a 10-point scale (10 = most native) after having watched both videos. Whereas the talker in Video 1 received average ratings of 8.7 (SD = 2.0) and 8.4 (2.2) from the L1 and L2 groups, respectively, the talker in Video 2 received mean scores of 6.1 (2.7) and 6.5 (2.6), indicating that he was perceived as overall less native.
Screenshot of talkers in Video 1 (Panel A) and Video 2 (Panel B) with areas of interest superimposed. (Photographs included with talkers’ written consent).

Participants completed a language background questionnaire online before coming to the test session in the laboratory, during which the two videos were presented on an SMI RED250 eye tracker sampling at 60 Hz. Video 1 was always presented first to allow for the most direct comparison between Video 1 and the original study. Prior to each video, participants’ eye gaze was calibrated in a nine-point calibration routine. After each video, participants completed a nine-item multiple-choice comprehension test in Google Forms. After the second comprehension test, they were asked to rate both talkers’ nativeness on a 10-point scale. As in the original study, participants then completed the Cambridge Test. Finally, they completed the LexTALE English test (https://www.lextale.com/takethetest.html).
Analysis
Prior to analysis, eye-gaze data were inspected for calibration accuracy and tracking ratio. Data from participants with deviation values of more than 2 degrees of visual angle or tracking ratios lower than 75% were excluded. This led to the exclusion of Video 1 data from three participants and Video 2 data from four participants; we thus report Video 1 data from 80 (37 L1, 43 L2) and Video 2 data from 79 (37 L1, 42 L2) participants.
For each video, we defined three AOIs: the mouth, the eyes, and the face (Figure 1). Following procedures in the original study, we calculated proportion of total looking time (PTLT) to the eyes and to the mouth by dividing total dwell time on the eyes and mouth, respectively, by total dwell time on the face. Following the analysis approach in the original study, PTLT values served as the dependent variable in mixed, repeated-measures ANOVAs, with Group (L1, L2) as a between-subjects factor and AOI (eyes, mouth) as a within-subjects factor. These ANOVAs served to address RQ1, and were conducted separately for Video 1 and Video 2.
To address RQ2, we calculated (as in the original study) PTLT difference scores (PTLTeyes − PTLTmouth) as an index of an individual participant’s relative attention to the talker’s eyes and mouth and examined the correlations between these difference scores and (a) scores on the Cambridge Test and (b) the postviewing comprehension tests. In addition, we also examined correlations with scores on the LexTALE English test and participants’ self-ratings of their overall English ability (10-point scale). Finally, we calculated a combined measure of proficiency by z-scoring values from the Cambridge Test, LexTALE, and self-ratings and calculating an average z-score for each participant (mean proficiency z-score). As in the original study, analyses involving proficiency were conducted on the data from the L2 participants only.Footnote 4 Data and analysis scripts are available on OSF (https://osf.io/pua45/).
Results
RQ1: Between-group differences
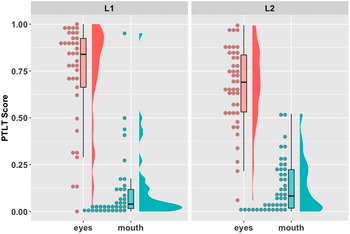
Figures 2 and 3 illustrate the distribution of PTLT values by group for Videos 1 and 2, respectively. Visual inspection indicates substantial variability among participants in both groups and videos. Participants primarily attended to the talkers’ eyes, with this preference appearing somewhat stronger in the L1 than in the L2 group. For Video 1, ANOVA results showed that the overall preference to look at the eyes, F(1,78) = 184.43, p < .001, η p 2 = .703, was not statistically different between L1 and L2 participants, as indicated by a nonsignificant interaction between group and AOI, F(1,78) = 0.97, p = .329, η p 2 = .012. Thus despite a numerical difference in the predicted direction between L1 and L2 listeners’ attention to the eyes (L1: M = .73, SD = .27; L2: M = .67, SD = .21) and to the mouth (L1: M = .11, SD = .19; L2: M = .13, SD = .14), we observed no statistically robust between-group difference in Video 1, thus failing to replicate the finding from the original study.
Video 1: Mean proportion total looking time (PTLT) scores to the eyes and mouth for the native (L1) and nonnative (L2) groups.

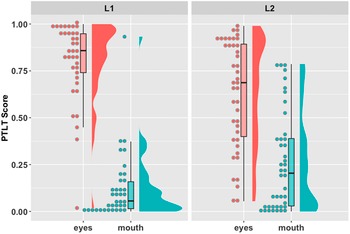
Video 2: Mean PTLT scores to the eyes and mouth for the L1 and L2 groups.

For Video 2, ANOVA results yielded an overall preference to look at the eyes, F(1,77) = 92.52, p < .001, η p 2 = .546, modulated by a significant interaction with group, F(1,77) = 8.64, p = .004, η p 2 = .101. Follow-up independent-samples t tests showed more looks to the eyes among L1 (M = .80, SD = .21) than L2 (M = .63, SD = .29) listeners, t(74.7) = 3.11, p = .003, d = 0.687, and fewer looks to the mouth among L1 (M = .12, SD = .18) than L2 (M = .26, SD = .26) listeners, t(72.0) = −2.82, p = .006, d = 0.620.Footnote 5 Thus contrary to the findings from Video 1, results from Video 2 fully replicated the findings from the original study with respect to RQ1.
RQ2: Modulation by L2 proficiency
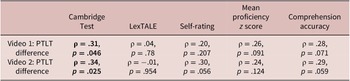
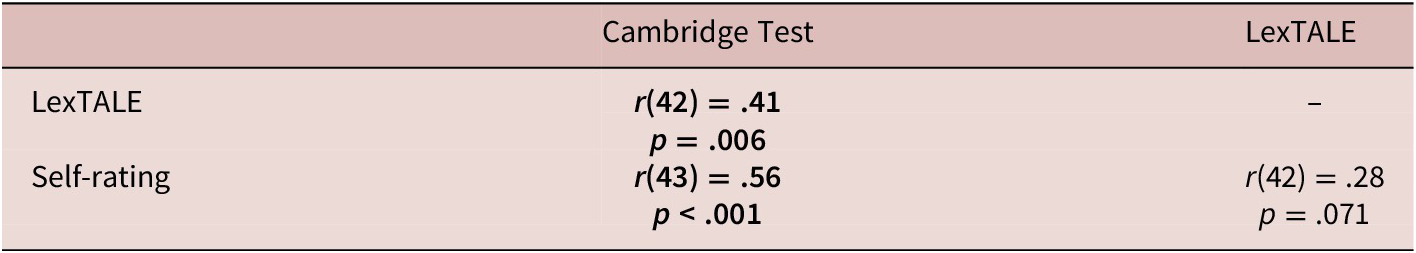
The three primary measures of proficiency intercorrelated with moderate effect sizes as shown in Table 2. Although the distributions for these three measures met the assumption of normality (Shapiro–Wilks tests, all p > .05), the distribution for PTLT difference scores did not. We therefore report Spearman’s rho (ρ) for correlations involving these scores (Table 3). For both videos, we observed moderate and significant correlations between PTLT difference scores and participants’ performance on the Cambridge Test (Figures 4 and 5, Panel A). This stands in notable contrast to the null effect, r(55) = .07, p = .615, reported in the original study. Correlations with participants’ self-rated proficiency and with our combined measure of proficiency (mean z score) trended in the same direction with slightly smaller effect sizes but were not significant at α = .05. No meaningful correlations were observed with LexTALE scores.
Intercorrelations between proficiency measures within the L2 group (Pearson’s r)
Correlations between proficiency measures and PTLT difference scores in the L2 group (n = 45; Spearman’s rho, ρ)

Video 1: Correlation between PTLT difference scores (PTLTeyes − PTLTmouth) and scores on the Cambridge Test (Panel A) and on the postviewing comprehension test (Panel B) in the L2 group (n = 43).

Video 2: Correlation between PTLT difference scores (PTLTeyes − PTLTmouth) and scores on the Cambridge Test (Panel A) and on the postviewing comprehension test (Panel B) in the L2 group (n = 42).

L2 participants’ performance on the postviewing comprehension tests showed substantial variability in both Video 1 (M = 3.58, SD = 1.94 vs. L1 group: M = 6.97, SD = 1.52) and Video 2 (M = 5.21, SD = 2.07 vs. L1 group: M = 8.00, SD = 0.88). Cronbach’s alpha was .72 and .71 for the comprehension tests following Videos 1 and 2, respectively, indicating acceptable reliability. Comprehension scores correlated robustly with scores from the Cambridge Test (Video 1: ρ = .69, p < .001; Video 2: ρ = .56, p < .001). Correlations between comprehension scores and PTLT difference scores trended in the predicted direction, with small-to-moderate effect sizes and marginal significance (Table 3; Figures 4 and 5). This trend in the predicted direction differs from the null effect, r(55) = .10, p = .444, observed in the original study.
Discussion, limitations, and conclusions
In this conceptual replication of Birulés et al. (Reference Birulés, Bosch, Pons and Lewkowicz2020, Experiment 2), we were able to replicate the first main finding of the original study—greater attention to the talker’s mouth among L2 versus L1 listeners—albeit only in one of the two videos. Surprisingly, the predicted effect emerged only in the video that was more divergent from the original materials in terms of the nature of the passage and the talker. Although we can only speculate about the reasons why we failed to replicate the effect in Video 1, we note that L2 participants found the passage in Video 1 difficult to comprehend, as indicated by overall low performance on the comprehension test (mean of 3.58 out of 9). It is possible that some learners simply gave up and did not attempt to seek additional support from visual speech cues. It is also possible that the difficulties many L2 participants encountered on the comprehension test following Video 1 prompted them to pay closer attention while listening to Video 2, potentially resulting in more looks to the mouth.Footnote 6 Because, for reasons noted above, the order of presentation of the two videos was not counterbalanced, this explanation must remain speculative. Another potential reason for the failure to replicate the between-group effect in Video 1 is the previously observed general tendency of Japanese listeners, compared with Western English-speaking listeners, to pay more attention to a talker’s eyes (Hisanaga et al., Reference Hisanaga, Sekiyama, Igasaki and Murayama2016; Jack et al., Reference Jack, Blais, Scheepers, Schyns and Caldara2009, discussed above). This culturally and/or linguistically grounded bias to look at the eyes among the mostly Japanese participants in our L2 group may have masked the predicted opposite bias to look at the mouth in the more challenging context of listening to a nonnative language. It is notable, however, that the predicted between-group difference emerged in Video 2, thus demonstrating that the effect observed by Birulés et al. (Reference Birulés, Bosch, Pons and Lewkowicz2020) with Western L1 and L2 groups is at least partially replicable even with a (mostly) Asian L2 group.
The effect observed in the original study, although replicable, may thus depend at least in part on the specific listening context. For a better understanding of the relevant factors involved, future work would benefit from manipulating factors such as speech rate, passage difficulty, and properties of the talker in a more controlled manner. With respect to properties of the talker, we conducted exploratory analyses on the data from Video 2 to examine whether the variability in participants’ nativeness ratings of the nonstereotypical native talker correlated with their selective attention to the mouth and found no systematic relations (see Supplementary Materials, Appendix B). Future studies including both native and nonnative talkers with variable levels of accentedness could provide further insight into the role of (perceived) nativeness and accent as potentially modulating factors in listeners’ reliance on visual speech cues.
With respect to RQ2, concerning potential modulation of attention by L2 proficiency, our findings diverged from those in the original study: In both videos, we observed a moderate correlation between L2 proficiency as measured by performance on the Cambridge Test and selective attention, with greater attention to the mouth among lower proficiency L2 listeners. Yet this relation did not emerge robustly with the other measures of proficiency we had included, such as the LexTALE English test. The null correlation with LexTALE scores may be due to this test not functioning as well with intermediate proficiency learners as with advanced learners (Lemhöfer & Broersma, Reference Lemhöfer and Broersma2012) and thus not capturing relevant variance in the present L2 sample. Our hypothesis that a combined proficiency score, based on averaged z scores from the three short proficiency measures we were able to include in this study, would capture more relevant variability and thus better allow for a relation between proficiency and attention to the mouth to emerge was not confirmed. The absence of a more comprehensive measure of proficiency, especially listening proficiency, is a clear limitation of the present study. Future work including such measures would further increase our understanding of the modulating role of L2 proficiency on selective attention to visual speech cues during L2 listening.
A question that remains is why the correlation with Cambridge Test scores emerged in this study, in both videos, but not in Birulés et al.’s (Reference Birulés, Bosch, Pons and Lewkowicz2020) original experiment. We have no good answer to this question. It is possible that statistical power is at issue. Assuming the effect size of the correlations observed in our study approximates the real effect (r ≈ .30), a sample of N = 84 would be required for 80% power (α = .05) to detect the effect. This indicates that both the original and the present study were underpowered to detect this correlation, and we may have just had better luck than Birulés et al. in observing it. Larger samples will be needed in future work to further explore this relation.
Taken together, the findings that have emerged from this replication study generally lend support to the core hypothesis addressed by the original study—namely, that less proficient language users are more likely to seek additional support from visual speech cues when trying to understand spoken language. At the same time, our findings suggest that this effect is subject to the influence of a number of additional factors that remain to be further explored and that the size of the effects involved will require sample sizes larger than those in both the original and the present study in future investigations.
The observation that L2 proficiency modulates adult L2 listeners’ selective attention to the mouth aligns well with findings from studies on the development of selective attention in infancy and early childhood, which have shown that infants’ attention to a talker’s mouth increases around the age of 6 to 8 months, coinciding with the emergence of canonical babbling, and decreases again around the end of the first year of life (Lewkowicz & Hansen-Tift, Reference Lewkowicz and Hansen-Tift2012). These timelines have been shown to vary, however, depending on the child’s familiarity with the talker’s language, their vocabulary skills, and bilingualism (e.g., Król, Reference Król2018; Morin-Lessard et al., Reference Morin-Lessard, Poulin-Dubois, Segalowitz and Byers-Heinlein2019). It thus appears that variability associated with language skill and experience is characteristic of selective attention to visual speech cues in both early childhood and adult L2 development. To what extent the nature and sources of this variability are shared remains for future work to explore.
The accumulating evidence from laboratory-based studies, such as those reported and discussed here, that access to visual speech cues benefits L2 listeners and that lower proficiency learners may be particularly reliant on such cues, is of theoretical relevance to models of L2 listening comprehension (e.g., Field, Reference Field, Geranpayeh and Taylor2013) as well as of practical relevance for understanding the needs for additional support that lower-proficiency language users may have in contexts where audiovisual speech cues are not available. Although we hesitate to draw direct inferences from laboratory-based findings to implications for pedagogical contexts, we believe that these findings warrant further experimental investigation of the role of visual speech cues and listeners’ attention to the talker’s mouth during L2 listening in real-life instructional and assessment contexts.
Acknowledgments
We are very grateful to Joan Birulés for generously sharing materials and data from the original study and for offering advice for this replication, as well as to our two talkers, Robin Caselli and Yuan Zhi (Owen) Ou, for their patience and permission to use their video recordings. Many thanks also to the audiences at the 4th International Symposium on Bilingual and L2 Processing in Adults and Children (ISBPAC 2022) and the 47th Annual Boston University Conference on Language Development (BUCLD), as well as the reviewers and editors of this journal for helpful feedback and suggestions, which have made this manuscript better.
Data Availability Statement
The experiment in this article earned Open Data and Open Materials badges for transparent practices. The materials and data are available at: https://osf.io/pua45/.
Supplementary Materials
To view supplementary material for this article, please visit http://doi.org/10.1017/S0272263123000086.
Competing interests
The authors declare none.