

Introduction
Hunting and associated forms of consumptive utilization of wildlife were banned in Kenya in 1977 because they were seen as potential threats to many wildlife species (KWS, 1990). Consumptive utilization typically refers to the taking of wildlife for food, skins, ivory and other products (Barnett, Reference Barnett1997). Kenya has since maintained a restrictive stance, with policy focused on the promotion of non-consumptive forms of utilization, such as photography tourism (Ottichilo, Reference Ottichilo1995). Although poaching was significantly reduced initially, it was later exacerbated by the commercial demand for wildlife products and by people's resentment over restrictions on resource use (Carter, Reference Carter1989). Kenya lacked the policy framework to ensure that benefits from non-consumptive utilization of wildlife reached the local people living adjacent to protected areas (KWS, 1990) and poaching is still rampant in these areas, except where community-based conservancies (e.g. Kimana, Mwalunganje and II Ngwesi) have been established (African Pro-poor Tourism Development Centre, 2013).
Bushmeat hunting has taken place in Ruma National Park, Kenya, since the Park was established in 1966 (Allsopp, Reference Allsopp1979; Waweru et al., Reference Waweru, Alina and Musyoki1995). Population viability analysis of the roan antelope Hippotragus equinus langheldi in the Park (Kimanzi, Reference Kimanzi2012) identified poaching as the main cause of the decline from 200 in 1979 to 37 in 2009. Poaching using wire snares has been observed and documented by the Park authorities over the last 30 years (Kones, Reference Kones2005; Kimanzi, Reference Kimanzi2012). Other methods of poaching, such as using dogs and bows and arrows, were used in the 1970s (Allsopp, Reference Allsopp1979) but are no longer practised. The aim of our study is to provide a better understanding of the snaring patterns to inform the development of effective methods of wildlife protection. Our specific objectives are to (1) map the spatial distribution of snares in Ruma National Park, (2) identify the factors influencing the distribution of snares in the Park and (3) recommend methods of mitigating the effects of snaring in the Park, to promote recovery of the roan population and other threatened antelopes.
Study area
Ruma National Park lies in western Kenya (Fig. 1), in a valley between the Gwasi Hills to the west, the Kanyamwa Escarpment to the east and the Gembe and Ruri Hills to the north. The 120 km2 Park lies at an altitude of 1,170–1,750 m. The vegetation in the Park is dominated by savannah grassland and woodland, with extensive acacia thickets and bushes (Waweru et al., Reference Waweru, Alina and Musyoki1995). The mean annual temperature and rainfall are 28–30 °C and 1,200–1,400 mm, respectively (Omoto, Reference Omoto1994). The long rainy season typically occurs during March–June, and there is a shorter rainy season during September–November.
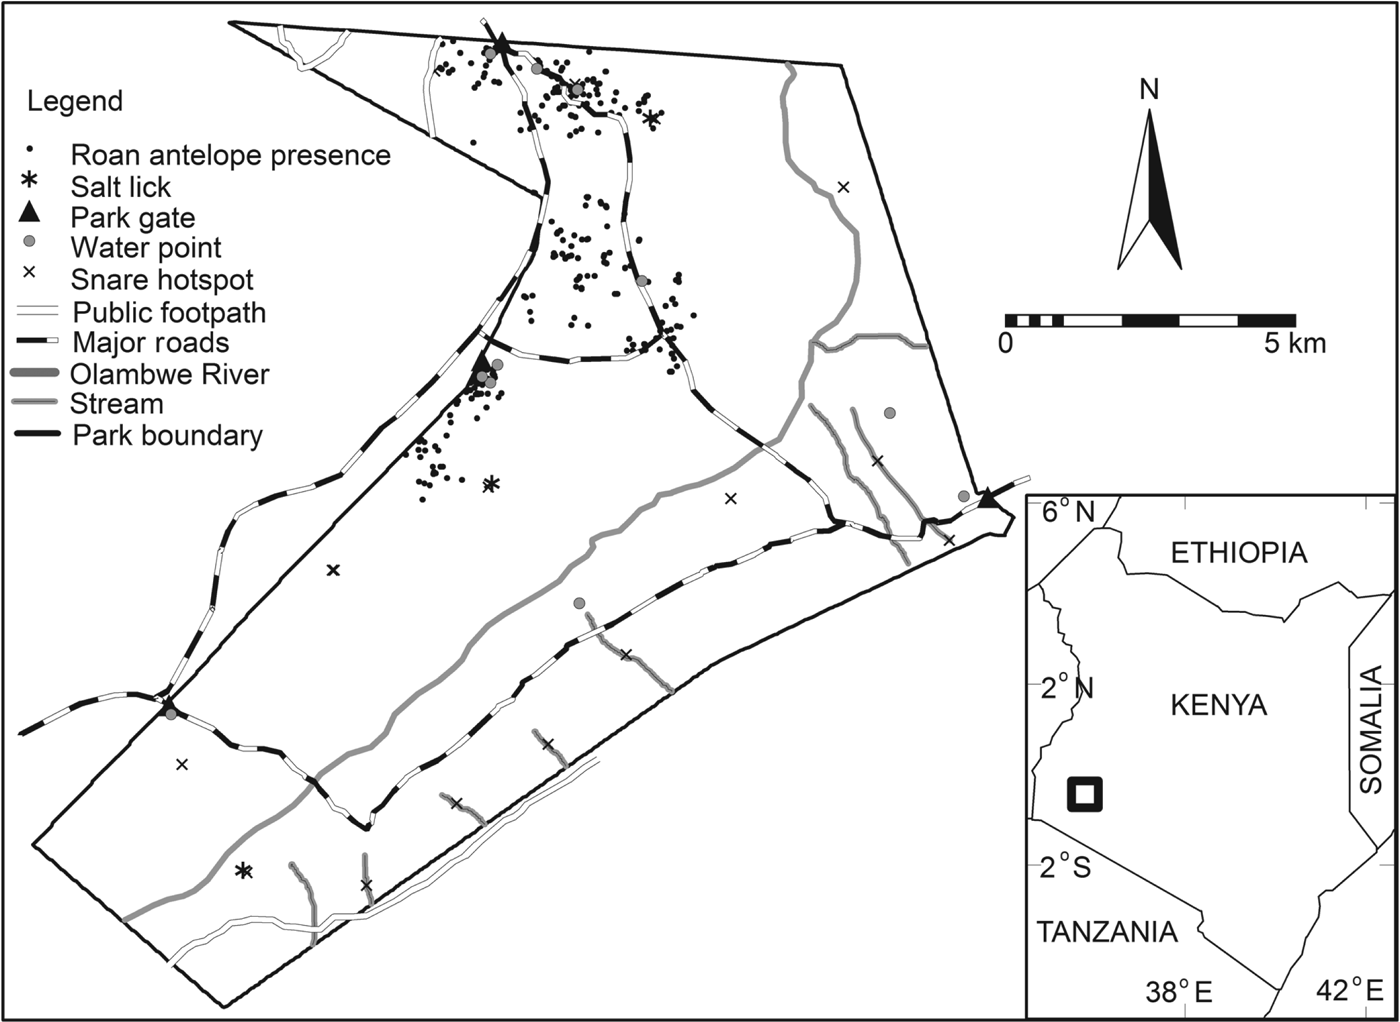
The distribution of roan antelope Hippotragus equinus langheldi (indicated by black dots) in Ruma National Park. The rectangle on the inset shows the location of the Park in Kenya.
The Park was initially established as the Lambwe Valley Game Reserve in 1966 and was designated a National Park in 1983 (KWS, 1990), mainly to protect the threatened endemic roan antelopes, which are not found anywhere else in Kenya (KWS, 2006). Ansell (Reference Ansell, Meester and Setzer1971) described six subspecies of H. equinus (H. equinus koba, H. equinus bakeri, H. equinus charicus, H. equinus equinus, H. equinus cottoni, and H. equinus langheldi) but the validity of most of these is unconfirmed and genetic studies have shown that only the West African subspecies (H. equinus koba) is genetically distinct from roans in the rest of Africa (Alpers et al., Reference Alpers, Van Vuuren, Arctander and Robinson2004). The exact range of the East African subspecies (H. equinus langheldi) is still unknown. Although roans are categorized as Least Concern on the IUCN Red List (IUCN, 2008), if current trends continue, the roan's status may eventually decline as it disappears from large parts of its range as a result of poaching and loss of habitat.
Methods
Data collection
Park rangers collected data on snares while on routine patrols during 2006–2008. The patrol routes were designed to cover all areas of the Park and they followed all existing roads and firebreak tracks. The Park was divided into 10 blocks, similar to animal census blocks (Kimanzi, Reference Kimanzi2011), and each patrol route covered one block. The patrol design ensured that all blocks were visited five times per year for 3 years, amounting to 150 patrols. Patrols were carried out once per week throughout the year but for a total of 4 months during the 3-year study period they were carried out once every fortnight as a result of vehicle breakdown or lack of fuel. To ensure that all parts of the Park were covered, vehicle patrols were combined with foot patrols to reach areas that were inaccessible to vehicles. Four rangers were transported by vehicle to an area within the target block, which they subsequently searched on foot. During the 3 years 651 snares were recorded in 56 locations. Each patrol covered a circular plot with a radius of c. 150 m. There were 1–74 snares recorded per location. All snares were small (with a wire diameter < 5 mm), suggesting that they were targeted at small- to medium-sized animals such as antelopes.
Potential variables
We considered 11 variables in our analysis of factors influencing the distribution of snares: wildlife density, slope, elevation, vegetation type, vegetation burned status, and distances from roan locations, water points, salt licks, security gates, the Park boundary and roads.
Studies have shown that hunters target different species depending on their main reason for hunting (subsistence or commercial), animal body size and species’ abundance (Noss, Reference Noss1998; Fa et al., Reference Fa, Ryan and Bell2005). Snare hunting tends to overexploit the most common species (Noss, Reference Noss1998), and therefore the density of snares is predicted to be high in areas with a high density of targeted species. As most herbivores prefer habitats of low to moderate slope and elevation (Kimanzi, Reference Kimanzi2011) hunters may lay more snares in such areas. Hunters may also use their indigenous knowledge about suitable habitats for targeted species when placing snares (Gadgil et al., Reference Gadgil, Berkes and Folke1993). For example, many snares may be set in burned vegetation to target grazers attracted by the fresh grass that sprouts after fires. There may also be a higher density of snares in grasslands than non-grasslands if poachers are targeting grazers. Water and salt licks are essential resources for many wildlife species, and therefore setting snares in areas close to these resources could be rewarding for hunters. To avoid being caught, hunters may lay snares away from gates and outposts and relatively near the edge of the Park so that they can escape if they encounter rangers on patrol. Knowing how snaring patterns correlate with the road network in the Park can help rangers to ascertain whether vehicle patrols are deployed effectively or whether they need to be combined with foot patrols (Arcese et al., Reference Arcese, Hando, Campbell, Sinclair and Arcese1995).
We mapped each variable in a geographical information system (GIS) at a spatial resolution of 30 m. Vegetation and slope maps were prepared by Kimanzi (Reference Kimanzi2011) using a 2005 Landsat 7 ETM+ image and a digital elevation model, respectively. We included vegetation type and burned status as categorical variables in models; the other variables were continuous. The vegetation map layer was classified into grasslands and non-grasslands. Vegetation burned status was included as a single factor with two levels: burned and unburned. To compute the wildlife density we divided the mean wildlife estimates for 3 years (2006–2008) for each of the 10 animal counting blocks by the corresponding area. We derived all other distance maps from Ruma National Park boundary and infrastructure maps, using ILWIS (ILWIS, 2009).
Variable selection
To avoid the risk of including collinear explanatory variables we calculated the variance inflation factor for each variable: one explanatory variable is selected as the response variable and all the others are set as explanatory variables within a linear regression (Montgomery & Peck, Reference Montgomery and Peck1992). We calculated the variance inflation factor as VIF = 1/(1−R 2), obtaining R 2 from a linear regression. We performed a series of regression analyses, using a different explanatory variable as the response variable in each regression, and calculated the variance inflation factor for every explanatory variable. A high variance inflation factor indicates collinearity because it means that the variation in the response variable is accounted for by the other variables (Zuur et al., Reference Zuur, Ieno and Smith2007, Reference Zuur, Ieno and Elphick2010). However, all variance inflation factor values were < 10, which implied that there were no highly correlated explanatory variables. As there is no standardized cut-off value this decision is partly subjective. Some statisticians suggest that values > 10 are too high (Montgomery & Peck, Reference Montgomery and Peck1992).
Data analysis
We carried out data analysis in R v. 2.9.0 (R Development Core Team, 2010). We used Ripley's K and L functions for spatial point pattern analysis to describe the distribution of snares in the Park, and the negative binomial regression to analyse the probability of snare occurrence.
Ripley's K and L functions
Ripley's K function quantifies the spatial pattern intensity of points for a circular search window (Ripley, Reference Ripley1976). Points correspond to the locations of discrete events, in this case snares. The function computes the mean number of points lying within a circular search window of radius t (Ripley, Reference Ripley1976): $\hat K(t) = {\textstyle{{\lambda ^{ - 1} \sum _{i = 1}^n \sum _{\,j = 1}^n I_t (e_i e_j )/W_{ij}} \over n}}$
for i ≠ j and t > 0, where the point intensity, λ, is estimated as the number of snares per unit area (n/A), I
t
is an indicator function that has a value of 1 when e
j
is within distance t of snare e
i
(and 0 otherwise), n is the total number of snares and A is the area of the study plot. W
ij
is a fraction of the area, used to correct for edge effects. By using a circular window the function provided an isotropic cumulative count of all points at distances of 0–t. The expected number of snares under complete spatial randomness is πt
2, the area of the search region.
$\hat K(t) = {\textstyle{{\lambda ^{ - 1} \sum _{i = 1}^n \sum _{\,j = 1}^n I_t (e_i e_j )/W_{ij}} \over n}}$
for i ≠ j and t > 0, where the point intensity, λ, is estimated as the number of snares per unit area (n/A), I
t
is an indicator function that has a value of 1 when e
j
is within distance t of snare e
i
(and 0 otherwise), n is the total number of snares and A is the area of the study plot. W
ij
is a fraction of the area, used to correct for edge effects. By using a circular window the function provided an isotropic cumulative count of all points at distances of 0–t. The expected number of snares under complete spatial randomness is πt
2, the area of the search region.
To linearize and stabilize the variances the $\hat K(t)$
function was modified to the
$\hat K(t)$
function was modified to the $\hat L(t)$
function (Venables & Ripley, Reference Venables and Ripley2002), with
$\hat L(t)$
function (Venables & Ripley, Reference Venables and Ripley2002), with $\hat L(t)$
calculated using the formula
$\hat L(t)$
calculated using the formula $\hat L(t) = \sqrt {\hat K(t)/\pi} $
. We used Monte Carlo simulations of the Poisson point pattern process (i.e. complete spatial randomness) to provide a confidence envelope for the L(t) function (Venables & Ripley, Reference Venables and Ripley2002). For complete spatial randomness the plot of L(t) against distance lies within the confidence envelope; plots above the envelope indicate an aggregated snare pattern and plots below the envelope indicate a regular pattern of snares. We used a Poisson cluster process to test for significance of the spatial clustering, using the Matern cluster process (Baddeley & Turner, Reference Baddeley and Turner2005).
$\hat L(t) = \sqrt {\hat K(t)/\pi} $
. We used Monte Carlo simulations of the Poisson point pattern process (i.e. complete spatial randomness) to provide a confidence envelope for the L(t) function (Venables & Ripley, Reference Venables and Ripley2002). For complete spatial randomness the plot of L(t) against distance lies within the confidence envelope; plots above the envelope indicate an aggregated snare pattern and plots below the envelope indicate a regular pattern of snares. We used a Poisson cluster process to test for significance of the spatial clustering, using the Matern cluster process (Baddeley & Turner, Reference Baddeley and Turner2005).
Negative binomial regression
The probability of snare occurrence in the Park, determined using negative binomial regression as an initial generalized linear model with a Poisson error distribution, indicated that overdispersion was a problem (Crawley, Reference Crawley2007). We investigated the significance of year of snare collection and clumped distribution of snares as random effect factors, using a generalized linear mixed model with a penalized quasi-likelihood (glmmPQL; Bolker et al., Reference Bolker, Brooks, Clark, Geange, Poulsen, Stevens and White2009). However, these two random effects had no significant effect on snare occurrence. We therefore used the negative binomial regression to complete our analysis of the probability of snare occurrence in the Park. This method has been shown to yield good results with overdispersed data (Crawley, Reference Crawley2007).
Model assessment
We used a bootstrapping technique (Manly, Reference Manly2007) to validate the results of the negative binomial regression model. The technique was performed by resampling (with replacement) the snare data to construct bootstrap samples, leaving out 20 of the 56 data values at a time. We ran the bootstrap model 999 times and used its coefficients to assess the variability and bias in the coefficients of the original model.
Results
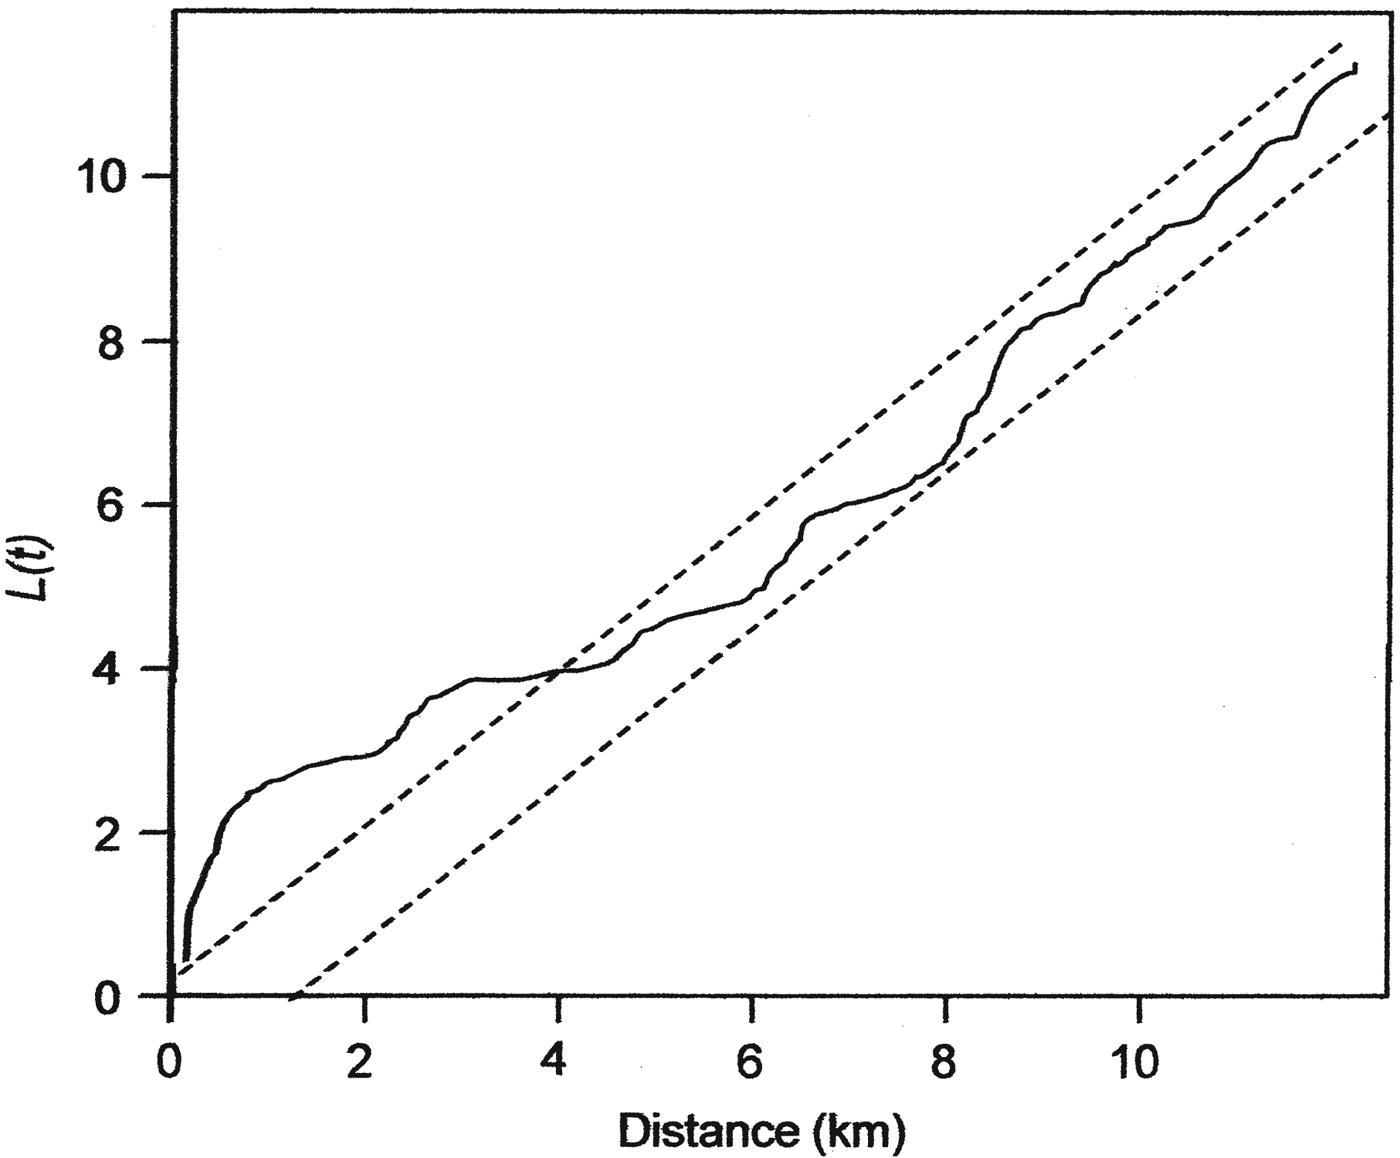
Analysis using Ripley's L function showed that the snares in Ruma National Park have an aggregated pattern, occurring in clumps at distances up to 4 km (Fig. 2). A Poisson cluster process showed significant spatial clustering, as indicated by a κ value of 5.91 × 10⁻⁸ and a mean cluster size of 3.84 snares per point. The distribution of these snare clumps (hereafter referred to as snare hotspots) seems to be related to the distribution of several Park features, with many occurring near water points, salt licks and the Park boundary (Fig. 1).
Ripley's L function for assessing complete spatial randomness of snares in Ruma National Park (Fig. 1). The dotted lines define a 95% confidence envelope such that plots within the confidence envelope cannot be differentiated from complete spatial randomness, plots above the envelope are aggregated and plots below the envelope have a regular pattern.
We did not analyse the snare hotspots as independent points because of their limited number (n = 15). Instead we modelled snare density at the pixel scale (30 m grid resolution) for the whole Park, using the number of snare locations (n = 56) rather than the number of snare hotspots as the sampling unit. To avoid pseudo-replication we included the number of hotspots as a random factor but found it to be insignificant.
The most parsimonious negative binomial model had a selection probability of 0.986 and explained about two thirds (R 2 = 0.66) of the variation in snare densities in the Park. Assessment of this model, using bootstrapping techniques, showed that its parameter coefficient estimates were similar to those obtained via the bootstrap cross-validation (Table 1). The similarity of the two models implies that the same model would be identified as the best model if the analysis were repeated under similar conditions, using a different field dataset. Therefore, the model can be used for predicting snare densities in the Park reliably.
Predictive model results (best and bootstrap) for 10 variables, based on negative binomial regression for the distribution of snares in Ruma National Park, Kenya (Fig. 1).
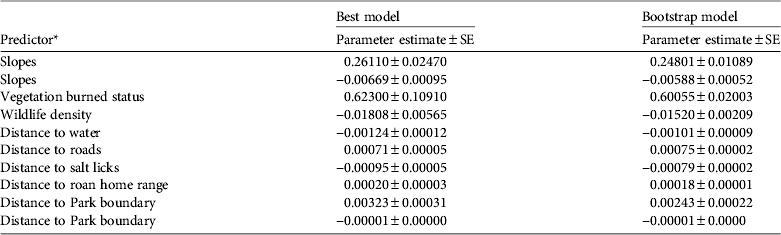
* Slopes and Distance to Park boundary showed a curved relationship with snare density, unlike the other variables, which showed a linear relationship.
The results of the most parsimonious model indicated eight significant drivers of snare density in the Park: burned status of the vegetation, wildlife density, slope, and distances to surface water resources, roads, roan home range, salt licks and the Park boundary (Table 1). High snare densities occurred in burned vegetation, in areas with low wildlife density and far away from roan antelopes and roads, and in areas near water resources and salt licks. The density of snares increased with slope from 9.6 snares per km2 at 0° up to a maximum of 17.5 snares per km2 at 11° and then decreased as the slopes became steeper (Fig. 3a). There were no snares on slopes > 25°. The density of snares also increased with distance from the Park boundary up to 17.2 snares per km2 at 1.5 km and then decreased continuously beyond this threshold (Fig. 3b).
Relationship between snare density and (a) slope and (b) distance from the Ruma National Park boundary. Points indicate the observed relationship and the line represents the result of the best negative binomial model.

We used the best model of snare distribution to map the risk of snaring and found that 46% of the Park area has a high snaring risk and 77% has moderate to high snaring risk (Fig. 4). A roan habitat suitability map prepared by Kimanzi (Reference Kimanzi2011) indicated that 30% of the suitable habitat for roan antelopes is located in areas of high snaring risk. Furthermore, 96% of the moderately to highly suitable roan habitat is located in the areas of moderate to high snaring risk.
Habitat suitability (a) and risk of snaring (b) for roan antelope in Ruma National Park. The habitat suitability map was obtained from Kimanzi (Reference Kimanzi2011) and the snaring risk map was derived from negative binomial regression models.

Discussion
The clumped snare patterns suggest that poachers have identified sites with high potential for catching their targeted species, based on their experience or indigenous knowledge of the species’ behaviour (Gadgil et al., Reference Gadgil, Berkes and Folke1993). This implies that if these sites are well documented and mapped the Park's limited security team will be able to combat illegal hunting more effectively by focusing their patrol efforts on these few snare hotspots instead of on the whole Park. If a snare is found in a new area it can be a clue for the security team to search the surrounding area for snares within a radius of 4 km.
Understanding the factors that influence snare distribution is a vital prerequisite for formulating effective anti-poaching interventions. High densities of snares were located in burned areas of vegetation, which suggests that poachers burn the vegetation with the intention of poaching the animals that are attracted by the consequent sprouting of green grass. However, we detected no significant difference in the snare density in grassland and non-grassland habitats (bushland and forested areas), which may indicate that poachers are targeting both grazers and browsers that utilize grasslands and non-grasslands. Wato et al. (Reference Wato, Wahungu and Okello2006) made similar findings for Tsavo National Park, which harbours relatively equal proportions of grazers and browsers.
Our results showed that snare density was negatively associated with wildlife density and distance to roan locations, which may be an indicator that animals are deliberately avoiding snared areas. For example, Kimanzi (Reference Kimanzi2008) observed that a particular roan group in the Park behaved in a scared manner near thick vegetation but was calm when encountered in open grasslands. This suggests that roan antelopes are aware of areas with high poaching risk as a result of past experience and may choose to avoid such areas. Joubert (Reference Joubert1976) found that roan antelopes avoid thick vegetation in Kruger National Park, South Africa. Similarly, analysis of habitat selection by Kimanzi (Reference Kimanzi2012), using compositional analysis, indicated that roan antelopes avoid habitats near thick vegetation in Ruma National Park. The negative correlation between snare density and wildlife density may also be an indicator that wildlife has been eliminated from areas that have experienced high levels of poaching over a long period. Wire snares can remain functional for up to 2 years (Noss, Reference Noss1998) and hence the occurrence of high snare density in some parts of the Park may be an indicator that wildlife density was once high in those areas, although it may now be low as a result of hunting.
Although there was a negative correlation between snare density and the occurrence of roan antelopes, mapping of the overall snaring risk in the Park showed that some areas of high risk were located in the roan home range. Population viability analysis of roan antelopes in the Park (Kimanzi, Reference Kimanzi2012) indicated that the decline in the roan population was mainly a result of poaching and that the population could not recover to healthy levels unless annual mortality rates attributed to poaching were reduced to < 15%, compared to current losses of 21% (Kimanzi, Reference Kimanzi2012). Although the roan antelope may not be the main species targeted by hunters it appears to be the worst affected by poaching because of the small population. Edroma & Kenyi (Reference Edroma and Kenyi1985) found that some species in small protected areas in East Africa were potentially at risk of local extinction from illegal hunting. In North America overhunting is the leading cause of endangerment and extinction among mammals (Hayes, Reference Hayes1991). The problem of poaching needs to be resolved to ensure sustainable conservation of the threatened roan antelope in Ruma National Park.
Other significant factors influencing the distribution of snares included slope and the distances to water, roads, salt licks and the Park boundary. The highest numbers of snares were mainly found in areas with slopes of 0–20°, which appears to be the optimum range for most species of grazing animals. Kimanzi (Reference Kimanzi2011) showed that the roan antelope prefers areas with slopes of 0–10°. Some parts of the Park have steep slopes that are inaccessible to many grazers.
Snare hotspots occurred near essential resources such as water and salt licks, which animals visit frequently. Therefore, concentrating routine security patrols on areas near water sources and salt licks rather than patrolling the whole Park could be more effective for curbing illegal hunting.
Although roads can facilitate access by hunters to snare sites, most snares were far from the roads, probably to avoid being seen by rangers on routine security patrols. This means that vehicle-based security patrols by road will not be effective unless complemented by intensive foot patrols. A study by Arcese et al. (Reference Arcese, Hando, Campbell, Sinclair and Arcese1995) confirmed that a combination of vehicle and foot patrols is more effective in combating bushmeat hunting than either by vehicle or foot patrol alone.
The last factor influencing snare distribution was the distance from the Park boundary; snare density increased up to 1.5 km and then decreased with increasing distance. This supports the findings of Wato et al. (Reference Wato, Wahungu and Okello2006), who found that trap abundance increased with distance from the Park boundary and peaked at 4 km, then decreased rapidly. This trend in snare abundance is consistent with the behaviour of local bushmeat hunters in Africa. Snares must be checked frequently to ensure that ensnared animals do not break free and escape or are not eaten by other predators or lost to decomposition (Wato et al., Reference Wato, Wahungu and Okello2006). Noss (Reference Noss1998) estimated that a quarter of snared wild animals are lost to decomposition or scavenging, which makes trapping a wasteful and destructive method of utilizing wildlife. Furthermore, poachers need to carry snares and their catch, which makes it impractical for them to travel far from their homes to set the traps (Fitzgibbon et al., Reference Fitzgibbon, Hezron and Fanshawe1995). Therefore, maintaining a fully functional fence around the Park boundary can reduce access by poachers. About one-quarter of the Park is unfenced and in other areas the fence has been vandalized to supply wire for snares.
In summary, snares in Ruma National Park occur in clumps (hotspots) up to 4 km apart. These hotspots occur (1) near water resources, salt licks and the Park boundary, (2) far from locations of roan antelopes and roads, (3) in areas with low slopes and low wildlife density, and (4) in areas with burned vegetation. Therefore, for effective control of bushmeat hunting in the Park, law enforcement efforts need to be concentrated around these hotspots.
Apart from increasing the frequency of security patrols around snare hotspots, security could be improved by the construction of a road around the Park boundary to facilitate movement of the security team. Improved roads can also increase the frequency of tourist vehicles throughout the year and thus reduce poaching.
We presented our research at a workshop organized by Kenya Wildlife Service for national roan antelope conservation strategy stakeholders in September 2011. Our findings are being used by the national roan antelope conservation task force to develop a conservation strategy for sustainable conservation of roans in Kenya. Meanwhile, security in Ruma National Park has improved following the translocation of 20 black rhinoceros Diceros bicornis from Mugie Rhino Sanctuary and Solio Ranch in January 2012 (The Star, 2013).
Acknowledgements
We thank the Commonwealth Scholarship Commission for funding this research, the Kenya Wildlife Service for granting permission to conduct research in Ruma National Park, and the Regional Centre for Mapping of Resources for Development and the Ruma National Park authorities for providing secondary data.
Biographical sketches
Johnstone Kimanzi is interested in applying GIS and remote-sensing tools to solve biodiversity conservation and wildlife management problems. Roy Sanderson is interested in modelling complex ecological systems across a wide range of spatio-temporal scales. Stephen Rushton is interested in analysing the structure and dynamics of complex biological and clinical systems to develop approaches for investigating spatially and temporally heterogeneous processes. Mware Mugo has worked as a forest ecologist in Kenya for over 15 years.


