


Introduction
Although hot water drilling is a well-known technique for subglacial access, and has taken place in Antarctica since the late 1970s (Browning and Somerville, Reference Browning and Somerville1978; Talalay, Reference Talalay2020), instrumentation for measuring the borehole itself is rarely used. A few borehole measurements have been made, for instance on the Amery Ice Shelf (Craven and others, Reference Craven2004), however these are usually made after the drilling has been completed. In this case a borehole calliper and inclinometer were used to check the integrity of the borehole for minimum diameter and verticality at the exit into the ocean cavity (although no results were presented). Other measurement systems have been discussed by Makinson (Reference Makinson1993) and Schwerzmann (Reference Schwerzmann, Funk and Blatter2006). More recently the ‘IceCube enhanced hot water drill’ included an instrumented drill head (Benson and others, Reference Benson2014). The diameter was measured by eight calliper springs symmetrically arranged around the drill body. Other measurements were: supply water temperature, water supply pressure, water column pressure, load exerted on the hose, heading and inclination. All these data were collected and returned to the surface in real time using a tethered RS485 communication line. This real-time information allowed the drillers to see when the drill head touched the bottom of the borehole. One major downside of this system was that it did require the drill cable and drill hose to be taped together at regular intervals to provide mechanical support for the hose and data cable. Systems like these are not compatible with hot water drilling operations conducted by the British Antarctic Survey (BAS), primarily due to their size, weight and power requirements. The addition of a real-time data line to the surface is valuable, but adds complexity and risk to deployments.
The hot water drilling borehole measurement system (BMS) presented here was designed and built primarily to provide information on fabric and sediment content within the ice, as well as borehole geometry, verticality and cavity connectivity (Anker and others, Reference Anker, Makinson, Nicholls and Smith2021). It would have the additional benefit of helping to understand and resolve problems with borehole formation during the drilling operations (Siegert and others, Reference Siegert, Makinson, Blake, Mowlem and Ross2014). The BMS is small, lightweight (~35.5 kg) and low power using only 6 ‘D’ cell sized lithium batteries, making it ideal for transport and use in remote field sites. The BMS was designed to be attached to the hot water drill hose behind the drill nozzle (see Anker and others, Reference Anker, Makinson, Nicholls and Smith2021) or standalone on a deployment line, and measures borehole diameter (non-contact), water column pressure, heading and inclination. Three cameras, two sideways looking and one vertical, are also included in the instrument package and aid in assessing the data recorded by the instruments. The system is programmed to operate autonomously after leaving the surface, and data are logged on-board for review after returning to the surface.
An overall system description of the BMS is presented below. The various subsystems are then described in more detail before some results from the BEAMISH Project (Smith and others, Reference Smith2020) are presented. Finally, modifications and future improvements are described.
Measurement system overview
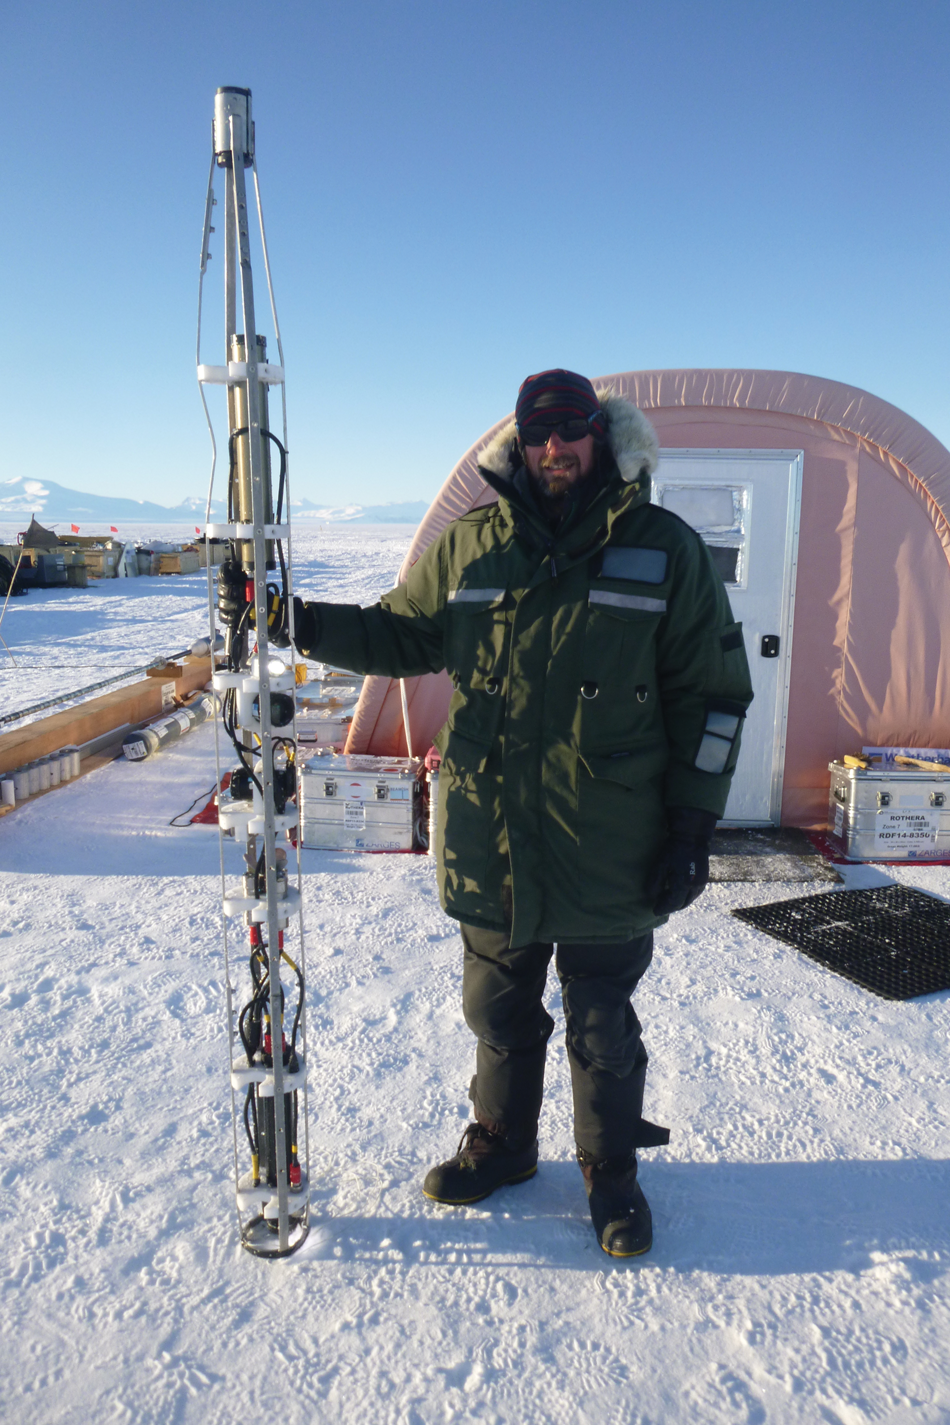
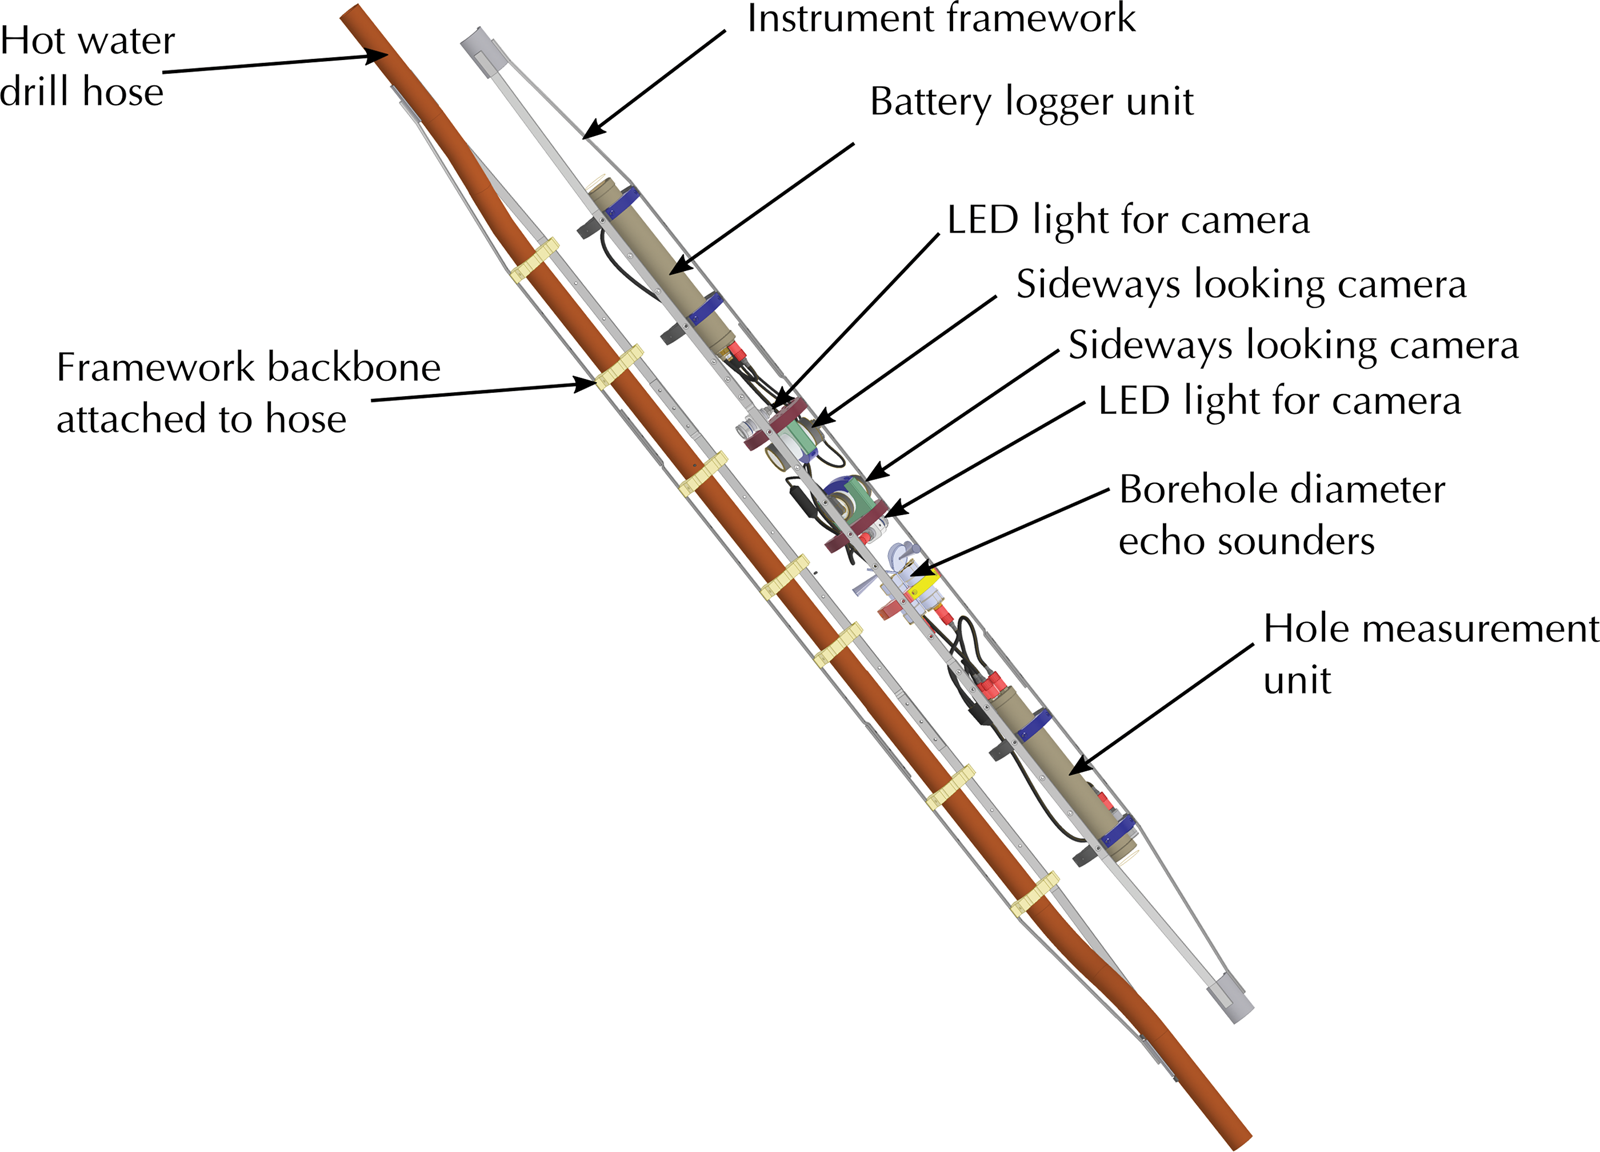
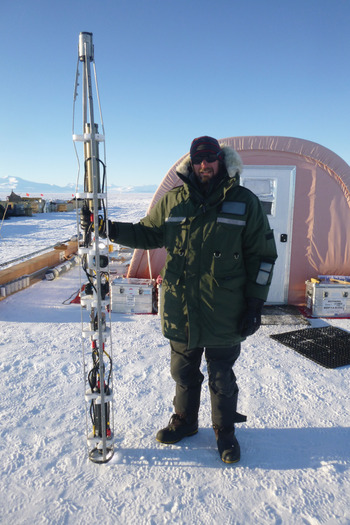
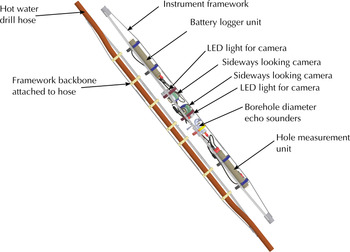
Figure 1 shows the BMS post deployment on the BEAMISH Project, and Figure 2 shows an expanded CAD drawing of the system. The system consists of a number of separate electronic sub systems attached to a two-part mechanical frame. The BMS is attached to a hot water drilling hose (or to a separate deployment line) and lowered down the borehole. The BMS is programmed at the surface to turn on and operate (autonomously) at specified times or depths. The system measures the hole diameter, depth, orientation as well as recording video and pictures of the hole walls (two side facing cameras) and below (downward facing camera). A list of the sensors used in the system are shown in Table 1. The system is designed to record data down to a depth of 2000 m, but can be upgraded to 3000 m.
Physical measurement system after being used in the field. The figure also shows the size of the system with a person for scale.
Mechanical assembly of the measurement system. Two separate assemblies of stainless steel framework with acetal clamps allows the instrument package to be securely attached to the drill hose.
Sensors incorporated within the measurement system
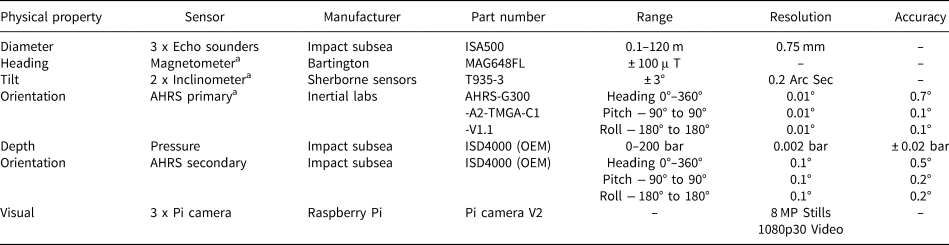
a These instruments were not integrated in the BMS for the BEAMISH field season.
The intention of the system was to use the magnetometer, inclinometer, attitude and heading reference system (AHRS) sensors, paired with a pressure sensor, to determine where and how the hole is drilled through the ice, and thus verify hole verticality. It is worth noting that development of the internal analogue to digital converter (ADC) used to measure the magnetometer and inclinometers was not completed. Additionally, the primary AHRS was not fully integrated in to the system before leaving for the field. These sensors and their measurement capability have been presented here to show what the system will be able to measure in future hot water drilling operations. As an alternative method of determining hole verticality during the BEAMISH field season, we used a secondary lower resolution AHRS unit (located in the pressure sensor), and the downward facing camera for visual confirmation.
Mechanical installation (prototype frame)
The instruments and loggers within their housings were attached to a stainless steel framework. Figure 2 shows how this framework can be split into two sections: a backbone which can be pre-attached to the drill hose and an instrumentation half. This allows all the instruments to be attached, electrically connected and tested before being mated to the backbone framework which is already on the hose. Custom acetal clamps are used to attach instrument pressure housings and cabling. Acetal half shells are used at each end to attach the framework to different diameter hose or to a tether if not deployed during drilling. Maximum diameter of the framework is 165 mm, with a total length of 2.81 m and an approximate weight of 35.5 kg.
Electronic systems
The measurement system is made up of three subsystems. The battery logger unit (BLU), camera systems and hole measurement unit (HMU). Figure 3 shows how these subsystems interact. The BLU is the master controller of the system, and controls when and how the HMU and camera systems operate. Each of these subsystems will be discussed separately.
System diagram showing communication and power line connections between system components. Diagram does not show external camera lights, or the external ranging echo sounders connected to the HMU.

Battery logger unit
The BLU is a single sub-sea enclosure that houses the system batteries, a printed circuit board (PCB) for system control and an integrated pressure sensor. The control PCB is controlled by the Adafruit Adalogger M0, which has a ATSAMD21G18 ARM Cortex M0 processor (48 MHz). The Adalogger is a development board that was chosen due to its small form factor, low-power requirements and the built-in micro SD card holder. Additionally, these units are mass produced, easily available and easy to program using an Arduino interface. The control board adds a number of important features to the system: Real Time Clock (RTC), three controllable power outputs (HMU, camera 1, camera 2), battery power monitor, battery temperature monitor, pressure sensor communications (depth and AHRS) as well as external RS232 (TX and RX) communications. In theory the BLU could be used as a stand-alone measurement system, capable of logging time, depth and AHRS data on to the Adalogger SD card. However, its main purpose is to control when or where the HMU and camera systems are turned on.
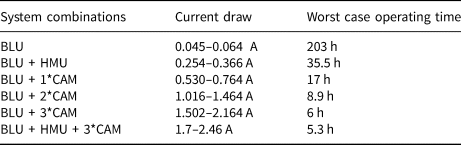
The logger houses six LSH20 (SAFT, ‘D’ cell, lithium) batteries connected in series. This provides a battery pack with 21.6 V, 13 Ah capacity, and a specified maximum current draw of 1.8 A. The operating times of the system in different configurations are shown in Table 2, assuming batteries are 80% efficient. With the HMU and all the cameras recording, the system would last approximately 5.3 h. In the case of the BEAMISH project the hole was surveyed after drilling, which would take an ideal time of at least 1.2 h (2150 m depth with 1 m s−1 winch speed). However, field drilling rarely operates to an ideal time scale, and things inevitably take longer. Additionally, there are cases for wanting to survey during the drilling, or to slowly measure areas of interest through the hole.
System operating configurations with current draw and operating times
Without the ability to control the measurement system from the surface, the BLU needed the ability to control when or where it would switch on the HMU and/or cameras (with lights) in order to save power and avoid the loss of data. To achieve this, the Adalogger SD card is loaded with control scripts for the HMU, camera 1 (CAM1) and camera 2 (CAM2). Each script contains a list of instructions for the Adalogger defining when each system should turn on, and how long it should stay on for. Each instruction either provides a time to turn on, referenced to power on time, or a depth. This allows for flexibility during pre-deployment operations, as the system can be powered up and waiting for deployment, and only start the HMU or cameras (and lights) once the measurement package reaches a specified depth.
Communications protocol
As shown in Figure 3, the HMU and camera units act as slaves to the master controller in the BLU. They rely on the BLU to provide power, as well as meta data on how to operate (commands). It is important to note that the camera systems are only able to listen for command messages from the BLU, and are not able to reply or confirm operation. The HMU unit listens to the same communication line as the cameras, but is able to reply to the BLU. This is a non-standard way of dealing with the RS232 communications protocol, which typically has only two devices communicating over a TX (Transmit) and RX (Receive) line. In this system there are four separate devices listening to command messages from the BLU, and acting on those commands. This has the potential to cause problems if a listening device acts on the commands meant for a different device. To overcome this the system uses its own communications protocol with the following format:
$XXXX,YYMMDD,HH:MM:SS,DATA,...,DATA;
Every message sent from the Adalogger controller in the BLU has this message format. The $XXXX defines who the message is for, and could be ‘$HMU1’, ‘$CAM1’ or '$CAM2’. All the slave devices listen to these messages and ignore ones meant for other devices. This method of device communication is not ideal, and non-standard, but proved adequate for this system's needs. There are alternative communications standards, such as I2C, SPI and RS485 that will allow multiple devices to communicate over two wires, and in future device development these may be considered. Alternatively, it may be possible to provide dedicated hardware communication lines to each of the four systems. This would require a significant redesign of the control board as the Adalogger has no more communication ports available on the PCB.
Camera systems
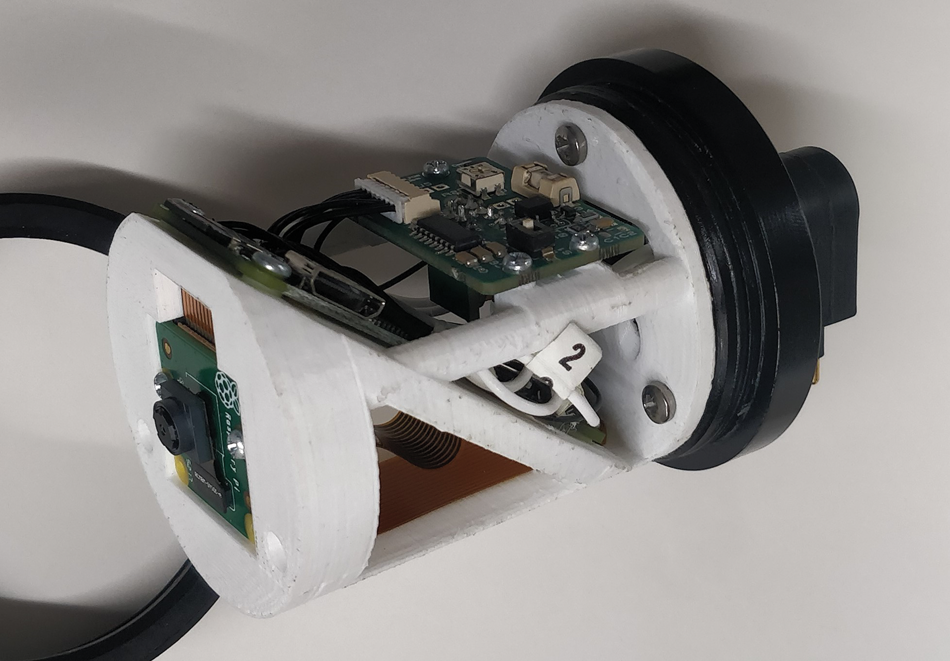
The cameras are important to this system as they add visual verification of the measurements made by the sensors, and imagery of the sediments within and at the base of the ice. In this design there is one camera system (CAM1) installed in the HMU enclosure facing down the borehole, and there are two side facing cameras (CAM2A and CAM2B) rotated 180° apart. Each camera system is made up of the same four parts: Pi camera module V2 (camera unit), Raspberry Pi Zero W (camera controller and recorder), external LED light and a power management board. The Pi camera and Pi Zero W are widely available, and well documented in the hobbyist electronic community but should not be overlooked as strictly for the amateur setting. The camera has a Sony IMX219 8-megapixel sensor, and is capable of recording video at full high definition (1080p30). The Raspberry Pi Zero W (the Pi) has a 1 GHz single core processor with 512 MB RAM, a useful set of IO pins, and uses ~32 mA (at 21 V) during normal usage. Additionally, the electronics for these units come in a small PCB form factor. This allows flexibility in how they are installed in enclosures, as compared to a manufactured camera that comes in its own pre-built housing. Figure 4 shows the internal structure of the side facing camera, and Figure 5 shows the placement of the same camera components for CAM1 in the HMU enclosure. The most convenient and valuable reason for using a Raspberry Pi camera system is the ease in setting up a customisable control script. The first system design planned on using a ‘GoPro Hero Session’, however this version did not have USB control available. There was no option for sending start or stop recording commands without a Wi-Fi link. Additionally, there was no option to overlay meta data information, such as depth, on to the recorded images and video. This would restrict usage to manually starting the camera recording at the start of a deployment, and hoping that the SD card would not fill up. Additionally, this would waste power from the BLU. All of these issues were overcome by using the Pi camera.
Side facing camera internals, showing novel use of space available for electronic installation.
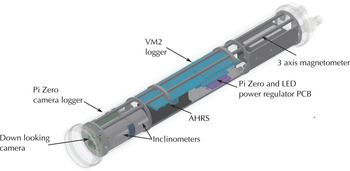
Internal layout of the HMU enclosure, showing the VM2 logger and the downward facing camera. Also shows where inclinometers, magnetometer and primary AHRS instruments will be installed in future improvements.

In this system the Pi is setup to operate in a slave manner to the BLU. Once the BLU provides power to the system, the Pi boots up and goes into one of two modes of operation. The first is the standard operating mode, where the Pi waits to receive serial messages from the BLU and starts recording. These serial messages contain the current depth and time information, which are then overlaid on to the pictures and video recorded by the Pi. It is worth making it clear that the BLU does not differentiate between the two side facing cameras (CAM2A and CAM2B). These cameras are powered from the same supply line, and operate in the same manner at the same time (as seen in Fig. 3). This is why there is only one control script loaded for ‘CAM2’, rather than individual units.
The second operating mode occurs if power is supplied to the camera system, but there is an issue with the incoming serial data. If no message is received then the camera defaults to recording 5 min videos repeatedly. A countdown timer is overlaid on the video, but no other meta data is available to add value to the video stream.
The Pi is also responsible for controlling the lights. Each camera has an external sub-sea LED installed to provide light in the depths of the borehole. The light units are ‘LUXUS Compact LED’ from MacArtney Underwater Technology (400 Lumen, 6.5 W), and operate from a 15–32 V source. The camera system is powered by the BLU at ~21.6 V. This voltage is too high for the camera electronics, but is ideal for the camera lights. The power management board is responsible for dropping the voltage for the Pi supply and for powering the LED, where the Pi uses a digital IO pin to provide the On/Off signal. This is an important feature for testing correct Pi operation, and for saving power. An early design of the system powered the lights directly from camera supply line, which meant that the lights were on continuously, regardless of whether the Pi was recording. We also had cases where the Pi would fail to boot properly. With this design the LED will only turn on when the Pi is operating correctly and recording, which now forms part of the pre-deployment system testing.
Hole measurement unit
The internals of the HMU are shown in Figure 5 with the placement of the external ranging echo sounders shown in Figures 2 and 6. The HMU enclosure also houses the downward facing camera (CAM1) and the ‘VM2 logger’ control board. This enclosure also has space for the inclinometers, magnetometer and primary AHRS that will be integrated in future versions of the BMS. The VM2 logger PCB is responsible for powering and recording data from the three external echo sounders. The VM2 logger is controlled by the VM2 microprocessor from Venom Control Systems, which was chosen due to its very low-power requirements, and quantity of serial ports.
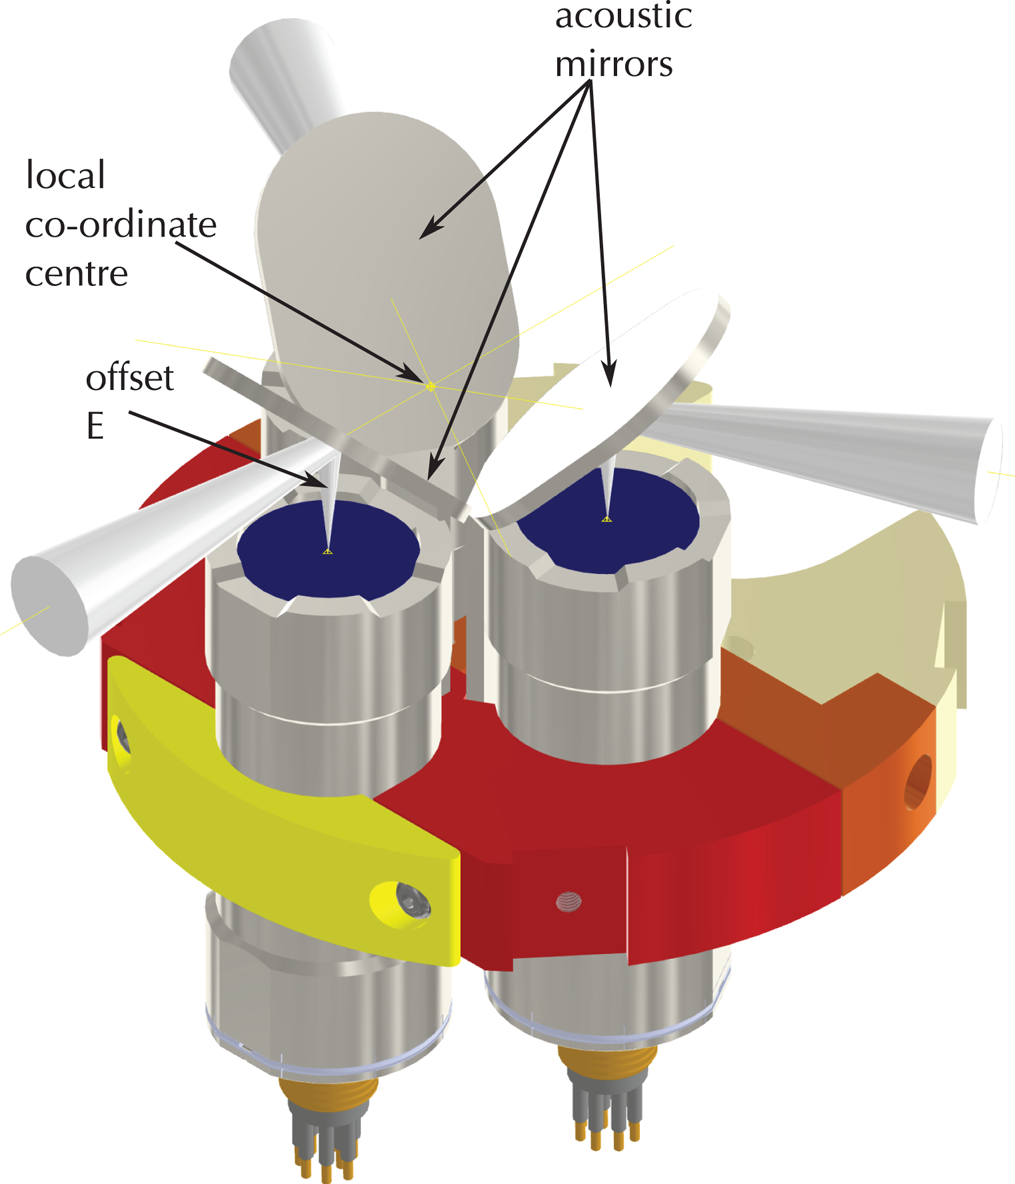
Close-up of echo sounders held in position by acetal clamping blocks. Each echo sounder is mounted vertically however, an acoustic mirror is used to turn this into a radial measurement. Note that the radial measurement directions intersect at a point that can be used as the local co-ordinate centre.The offset in the measured range due to having the acoustic mirror E is also shown.
The VM2 logger board operates in a slave manner to the BLU. Once powered up, the VM2 runs through a process of updating the on-board RTC from BLU messages. It then begins a process of collecting data from the external echo sounders by simultaneously triggering the ping lines of the sensors. In doing this all the echo sounders measure and store their range at the same time, rather than sequentially as the system moves down or up the hole. To avoid signal interference, all the echo sounders operate at a different frequency: 450, 500 and 550 kHz. The calculations involved in determining the hole diameter are discussed later in this section. The echo sounder readings are then collected by the VM2 sequentially and saved to two SD cards on the VM2 logger PCB. These data are also sent back to the BLU where it is saved to the main SD cards. These data then exist in three locations, and offers redundancy if there were to be an issue with an SD card.
The only difference in the stored data is the frequency of the measurements. Both the Adalogger and VM2 operate in a continuous loop, and aim to record as much data as possible. They do not operate in a synchronous manner, and loop times will vary depending on the processors operational load. On average the HMU samples at 6 Hz and the Adalogger samples at 4 Hz. With a maximum winch speed of 1 m s−1 (Anker and others, Reference Anker, Makinson, Nicholls and Smith2021), this equates to measurements being made at least every 167 mm through the borehole. From Table 1 the accuracy of the pressure sensor is ± 0.02 bar (~± 200 mm), so this is an acceptable sampling rate.
Hole diameter measurements
One aim of the BMS is to achieve non-contact diameter measurements of the borehole, as this reduces the risk of freezing to hole walls, and of possibly deviating the drilling nozzle during melting. To achieve this the system uses three ranging echo sounders to measure the distance from the local co-ordinate centre of the BMS to the walls of the borehole. These ranging echo sounders use the principals of ‘Sound Navigation and Ranging’ (SONAR) to measure distance in water. This is done by emitting an acoustic pulse in to the water and measuring the time between receiving an echo response. Therefore, the echo sounder ranges are dependent on the speed of sound in water. The geometry associated with this measurement is shown in Figure 7. From these ranges, a triangle with sides A, B and C is calculated, and used to describe a circumscribed circle representing the borehole diameter. This theory relies on the assumption that the borehole is round, and will only work in the water-filled section of the borehole as the echo sounders do not work in air.
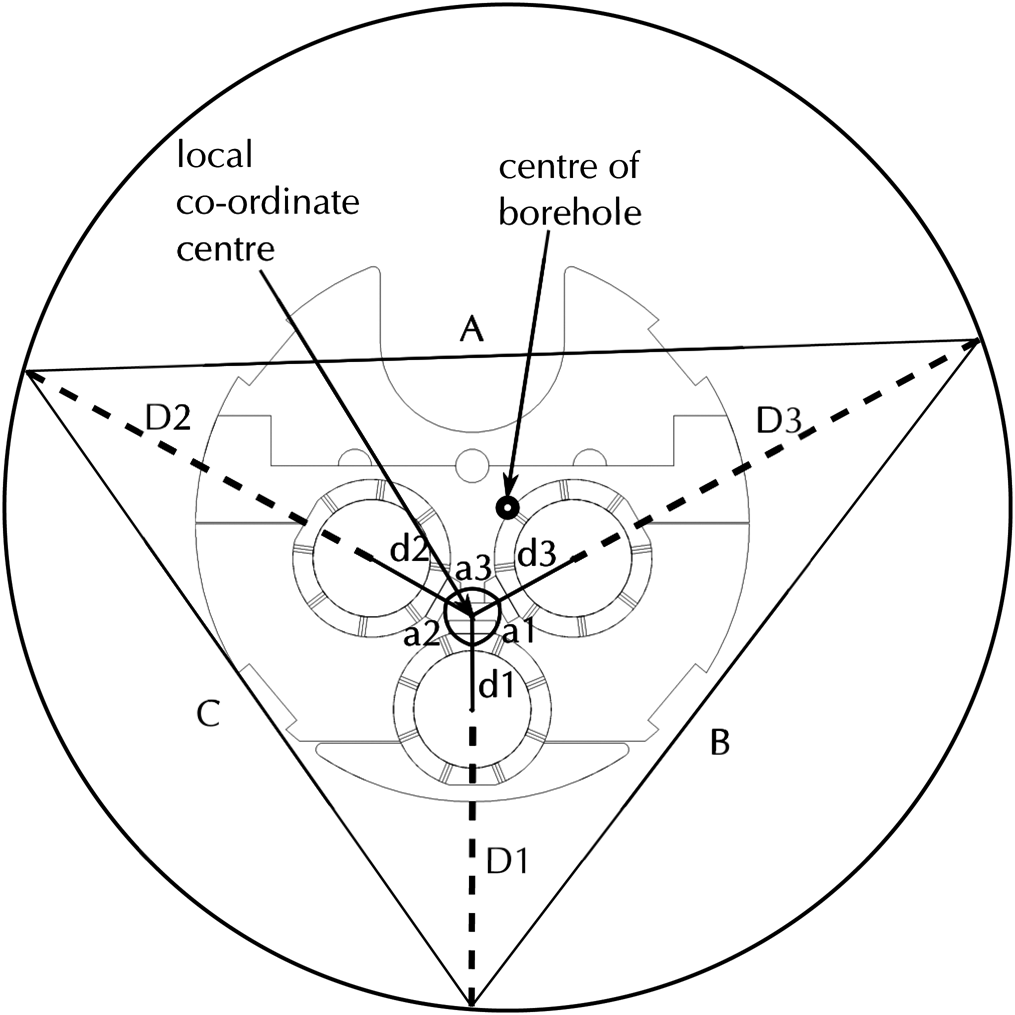
Diagram showing how borehole diameter is calculated. A circular borehole is shown with the instrument package in an arbitrary position. Readings from the echo sounders (D1, D2, D3), distance from the instrument centres to the local co-ordinate centre (d1, d2, d3), angles between the measurement paths (a1, a2, a3) and lengths of the inscribed triangle (A, B, C) are shown.
The physical layout of the echo sounders is shown in Figure 6. The echo sounders have a maximum diameter of 47 mm and are 144.5 mm long, even without a mating connector. Because of this dimension they need to be mounted vertically to fit within the desired overall framework diameter. A 45° acoustic mirror is used to obtain a radial measurement, and has the added benefit of increasing the acoustic path to a distance greater than the minimum measurable range of 100 mm. The three echo sounders are fixed within acetal clamps that carefully mount the acoustic mirrors 120° relative to each other so that the radial measurement directions intersect. This is not necessary but makes the borehole diameter calculation simpler.
The known geometry of the instruments shown in Figure 7, paired with the range measurements are then used to obtain the borehole diameter. In this layout a1 = a2 = a3 = 120°, d1 = 27.68 mm and d2 = d3 = 34.64 mm. To get the radial distances (D1, D2, D3) the vertical offset between the echo sounder face and acoustic mirror (E) needs to be removed from the raw range readings (R1, R2, R3), where E = 25.33 mm. The distance from the borehole wall to the local co-ordinate centre is calculated in Eqns (1) to (3).


The lengths of the sides of the inscribed triangle (A, B, C) are calculated using the cosine rule, as shown in Eqns (4) to (6).
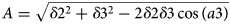
These lengths are used to calculate the radius of the borehole (R) using Eqn 7 below.
Due to the minimum range of the echo sounders, the minimum diameter measurable by the system is 214 mm.
BEAMISH results
In order to showcase the capabilities of the BMS, this section will show data collected from one deployment at the BEAMISH project field site. The chosen deployment occurred between 23:40 UTC on 10 February 2019, and 01:38 UTC on 11 February 2019 (Smith and others, Reference Smith2020). This deployment is informally documented as Hole 3, Deployment 2. During this event the BMS was deployed alone (without the drill hose attached) after the main borehole had been drilled. At this site three boreholes were drilled next to each other, spaced 600 mm apart. Two holes were drilled to a depth of 235 m from the surface to form a water cavity for water storage and circulation, and the third formed the main borehole down to the base of the Rutford Ice Stream. After creating the cavity with the first two holes the borehole water pump was lowered to a depth of 235 m from the surface, and was used to pump water to the surface, maintain the cavity with hot water, control the water level in the hole, and measure the head height of water pressure from the cavity (Anker and others, Reference Anker, Makinson, Nicholls and Smith2021). Creating a cavity linking all three holes is critical to the success of the drilling operation.
Camera data
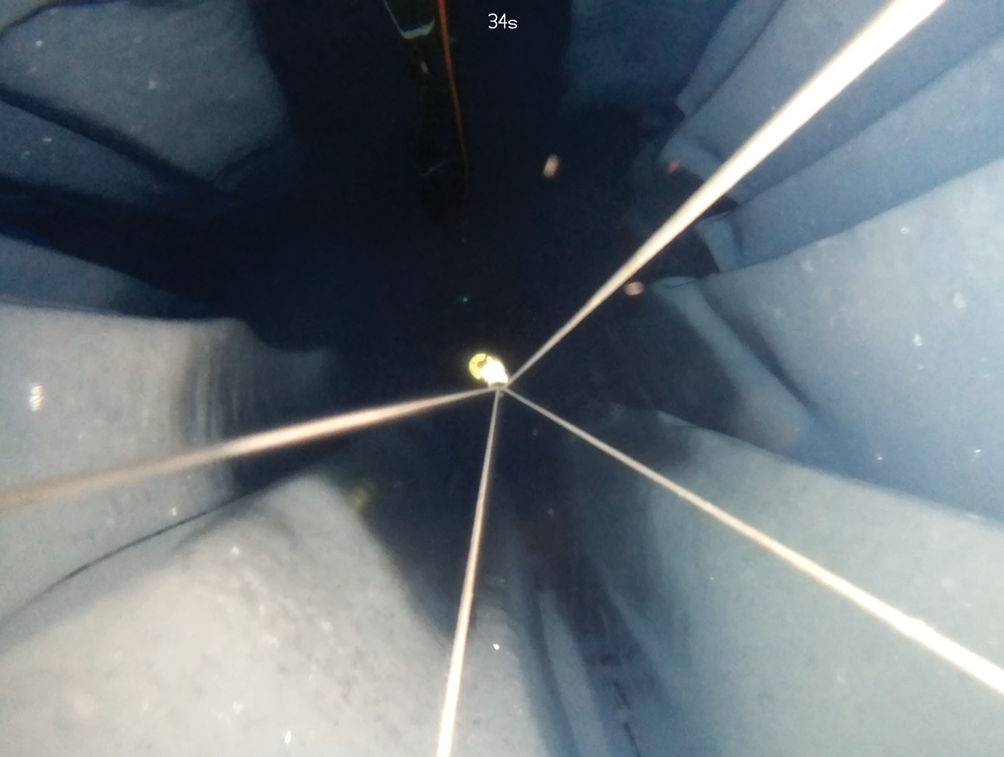
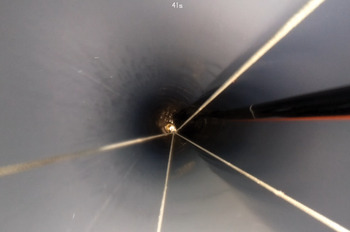
Figures 8–10 show a selection of images taken from the video files of the downward facing camera (CAM1) in the HMU. All these images show a weight hanging below the BMS. This weight added stability to the system as the drilling hose and nozzle were not attached for this deployment. These images should show depth and time information at the top, however there was a hardware failure and the camera defaulted to operating in its error state where it recorded on loop. The numbers at the top of the images indicate the loop time in seconds of individual video files. The side facing cameras operated correctly during the cast, and the video files could be correlated in order to approximate the depth of the images shown.
Hole 3, Deployment 2, CAM1: Image shows parallel vertical shafts in the dry section of the borehole. Approximately 183 m below the surface.
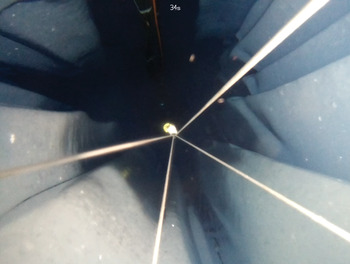
Hole 3, Deployment 2, CAM1: The wall grooves are formed by the side facing jets of the borehole pump, used to melt and maintain the linking cavity, as it was moved in to place for the cavity. Approximately 230 m below the surface.
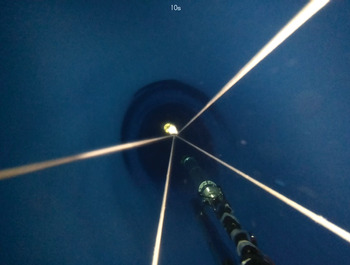
Hole 3, Deployment 2, CAM1: Image shows the borehole pump located in the cavity linking the three boreholes. Approximately 232–237 m below the surface.

Figure 8 shows the BMS in the dry section of the main borehole, approximately 5 m above the water line, and 183 m below the surface. From this image it is clear that there is an adjacent borehole with a connection to the cavity borehole pump. These boreholes run adjacent to each other all the way from the surface, and adds confidence in the assertion that both boreholes were drilled straight down under gravity assistance without deviation to hole path.
Figure 9 shows the borehole wall formation in the region above the borehole pump, at ~230 m below surface. The wall grooves are formed from the side facing jets of the borehole pump as it was slowly manoeuvred in to place to melt and maintain the linking cavity. This is also important as this section of the hole wall is not round like the rest of the borehole. Therefore, the calculations used to determine borehole diameter through this section are not valid, and may produce erroneous diameter measurements.
Figure 10 shows the borehole pump situated in the linking cavity. This was at a water depth between 55 and 60 m during the downcast, which is ~232–237 m below the surface. The image shows the walls of the borehole are out of focus, and narrowing down to a more consistent diameter below the pump.
All these images (and videos) aid in gaining confidence in the measurements being made by the HMU, as well as interpreting the results. The side facing camera footage was reviewed, and compared with the downward facing camera data. Unfortunately, due to winch speed, most of the footage was unclear for the majority of the deployment. In addition to this the camera lights operated intermittently after descending deeper down the borehole, lowering the quality of the footage. This was later traced to water ingress in the lights, and has been resolved for future operations.
HMU data
Data from the HMU and cameras are compared to data collected by the surface winch, and the results are as follows. The side facing camera data indicated that the linking cavity was located between 55 and 60 m water depth during the downcast, and between 60 and 65 m water depth during the upcast. This change in depth was verified by the field drillers (Smith and others, Reference Smith2020). On this site, the primary borehole failed to break through at the base of the ice stream, even after considerable time was spent at the base attempting to melt through. Therefore, during the BMS deployment, the drillers decided to increase water height, which would increase water pressure and assist in breaking through the base. Figure 11 shows the water height above the fixed position borehole pump during the deployment. This explains why the cavity depth recorded by the camera footage changed during the deployment. In order to compare features along the borehole wall, it is best to correlate the data back to the distance measured by the winch payout depth (distance from the surface), as this will not vary as water height in the hole is changed.
Hole 3, Deployment 2: Water head height pressure measured from the borehole cavity during the cast. Water level in borehole increased during the cast.
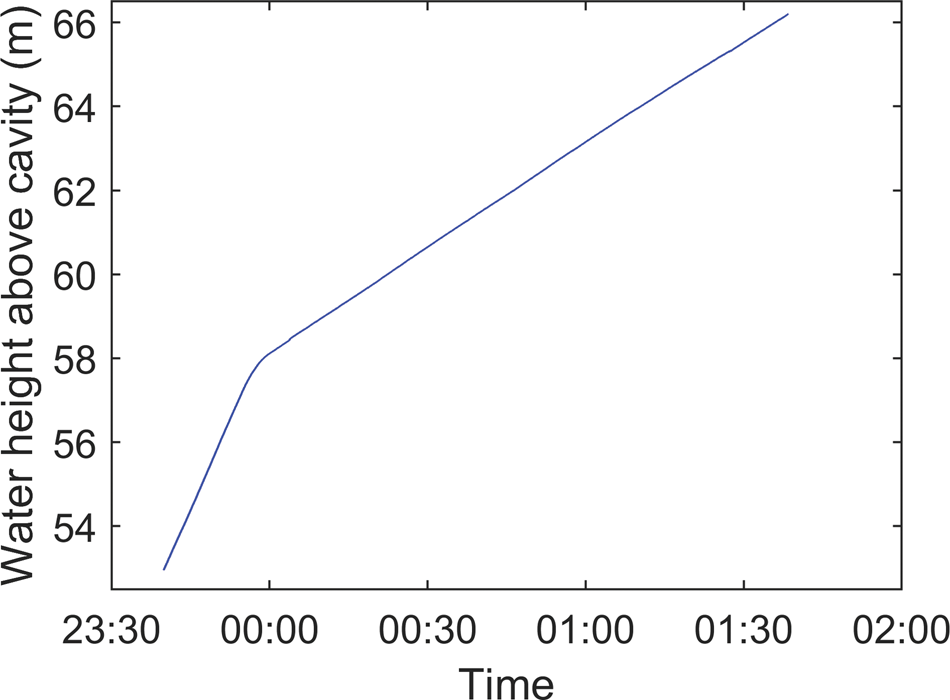
Figure 12 shows the winch payout depth plotted with the depth calculated from the BMS pressure sensor data. The calculated BMS depth assumes fresh water (zero salinity) in the hole, compensates for the increase in the hole water level shown in Figure 11, and accounts for the dry section of the borehole. This plot shows that the winch payout depth agrees well with the calculated depth from the BMS pressure sensor.
Hole 3, Deployment 2: Winch payout depth and pressure sensor calculated depth plotted over time. Graph shows agreement between depth measurement methods.
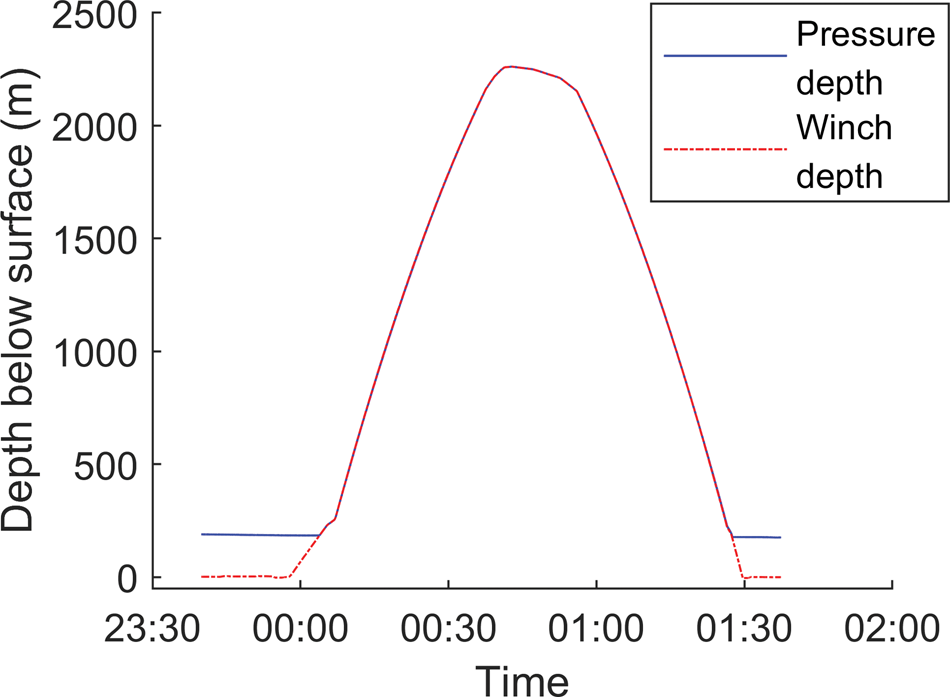
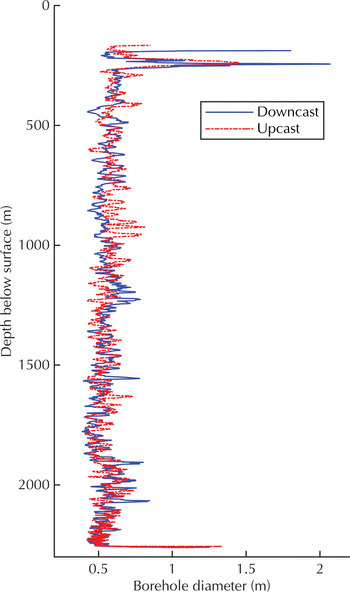
Figure 13 shows the calculated ideal hole diameter during the downcast and upcast at depth below the surface. This plot accounts for the change in water height during the cast, and the dry section of the hole where no data were measured. The range values reported by the echo sounders are dependent on the speed of sound in the water through the borehole, which vary depending on salinity, temperature and pressure. The sea water library of EOS-80 was used to calculate the sound speed at depth, where the salinity was fixed to zero salinity and temperature was fixed to 0°C.
Hole 3, Deployment 2: Figure shows the ideal hole diameter calculated from measurements through the borehole over the full deployment depth. Figure shows separate plots for the downcast and upcast during the deployment. Top section is empty due to dry borehole section.
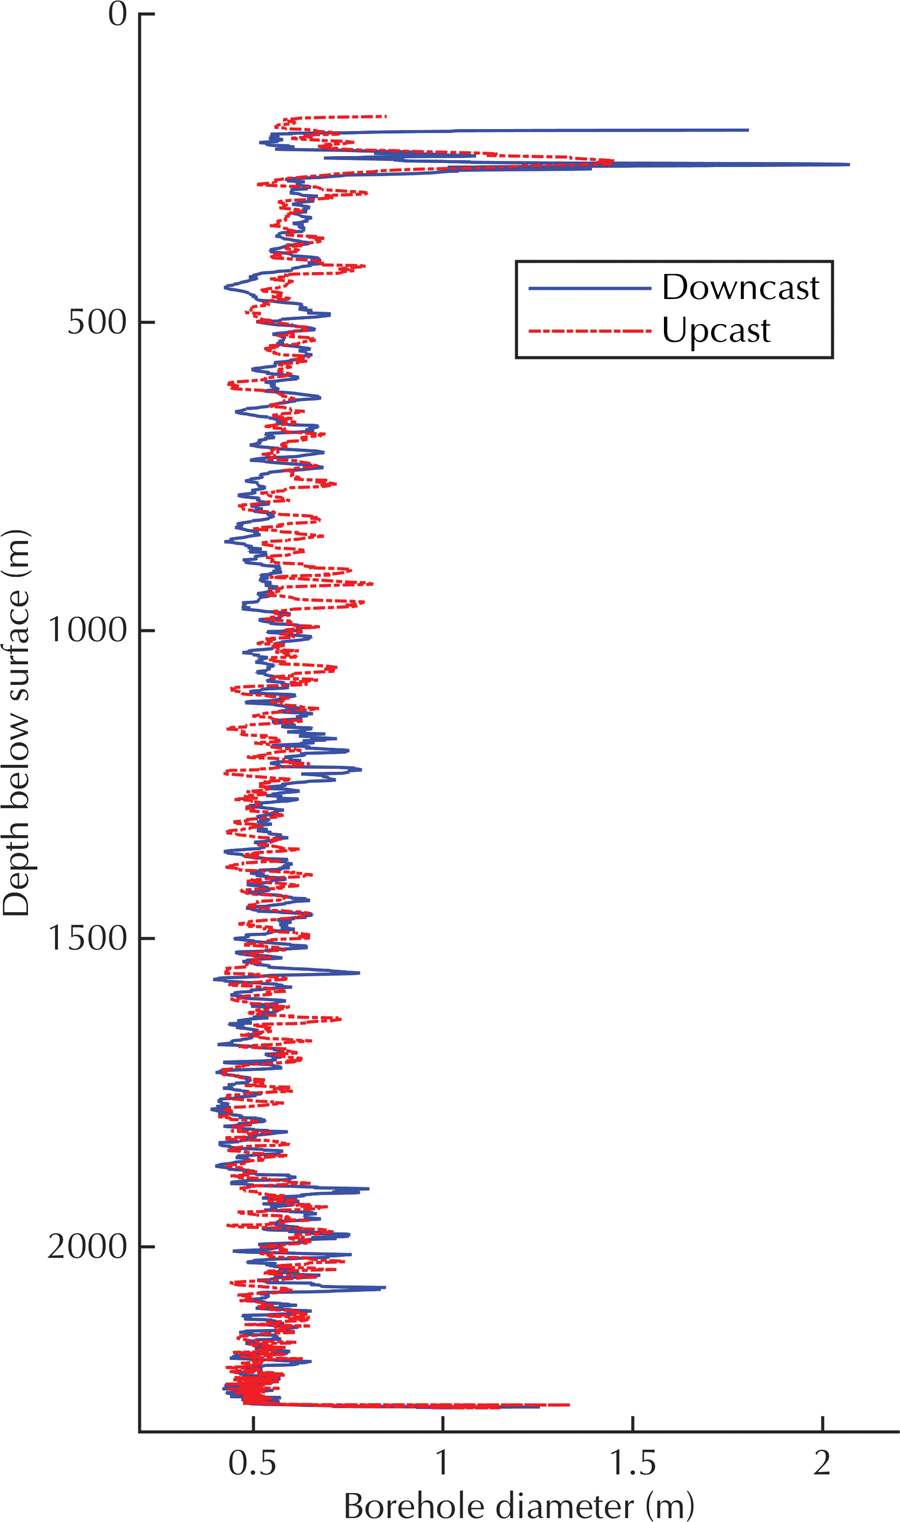
The plots in Figure 13 have a number of noteworthy features. Firstly the downcast and upcast trace each other well over the depth of the borehole, indicating that similar hole features are measured. Near the top of the hole, the diameter begins to increase at 217 m peaking at 241 m and slowly dropping to a norm at 268 m. This correlates well with the expected cavity depth of 235 m, and the approximate depth noted by the camera images. At the bottom of the borehole there is a very clear increase in hole diameter. This aligns with the drilling notes, as the drillers spent extra time at this location attempting to melt through the base (Smith and others, Reference Smith2020).
However, Figure 13 also indicates that the approximate diameter of the borehole is 0.55 m. This is wider than expected from the melt models, and indicates that although the hole diameter profile looks promising, the exact value of the measurements may not be correct. It was noted after returning from the field that the echo sounders had not been configured correctly for short distance readings, which may be an explanation for the incorrect scale on the measurements. Additionally, it was noted that one of the echo sounders acoustic mirrors was loose, contributing to null readings being made periodically throughout the deployment. Data matching this pattern were removed, and the remaining data were filtered to remove noise in the measurements, however this may have had a substantial effect on all of the sensors data. The variability of sound speed was considered by assuming a constant temperature and salinity, however as there were no measurements available it may be possible that the assumed values were not correct. Improvements to the measurement are under review.
BLU data
Figure 14 shows the data from the secondary AHRS unit located in the pressure sensor of the BLU. Note that the pitch and roll values appear to have fixed offsets of ~− 2° and − 6°, respectively. This is caused by the centre of mass of the mechanical frame not being in the centre of the frame. This causes the entire installation to hang at a slight angle when not connected to the drilling hose. It is possible to calibrate this offset out of the data by hanging the system upright for a period before deployment, however this was not done here. Ideally the pitch and roll values should have remained zero throughout the deployment, however the data indicate periodic fluctuations in X and Y tilt. From camera footage it is clear that the BMS does not make contact with the borehole walls, and is therefore not deviating direction as it travels through the hole. This is also verified by the verticality of the boreholes seen in Figure 8. One explanation for the noisy data could be that the package vibrates while moving through the water, however this is unlikely given the frequency of variation.
Hole 3, Deployment 2: Figure shows heading, pitch and role of the BMS during the deployment. Data collected from secondary AHRS unit located in BLU. Fluctuating pitch and roll data indicates an issue with the measurement approach.
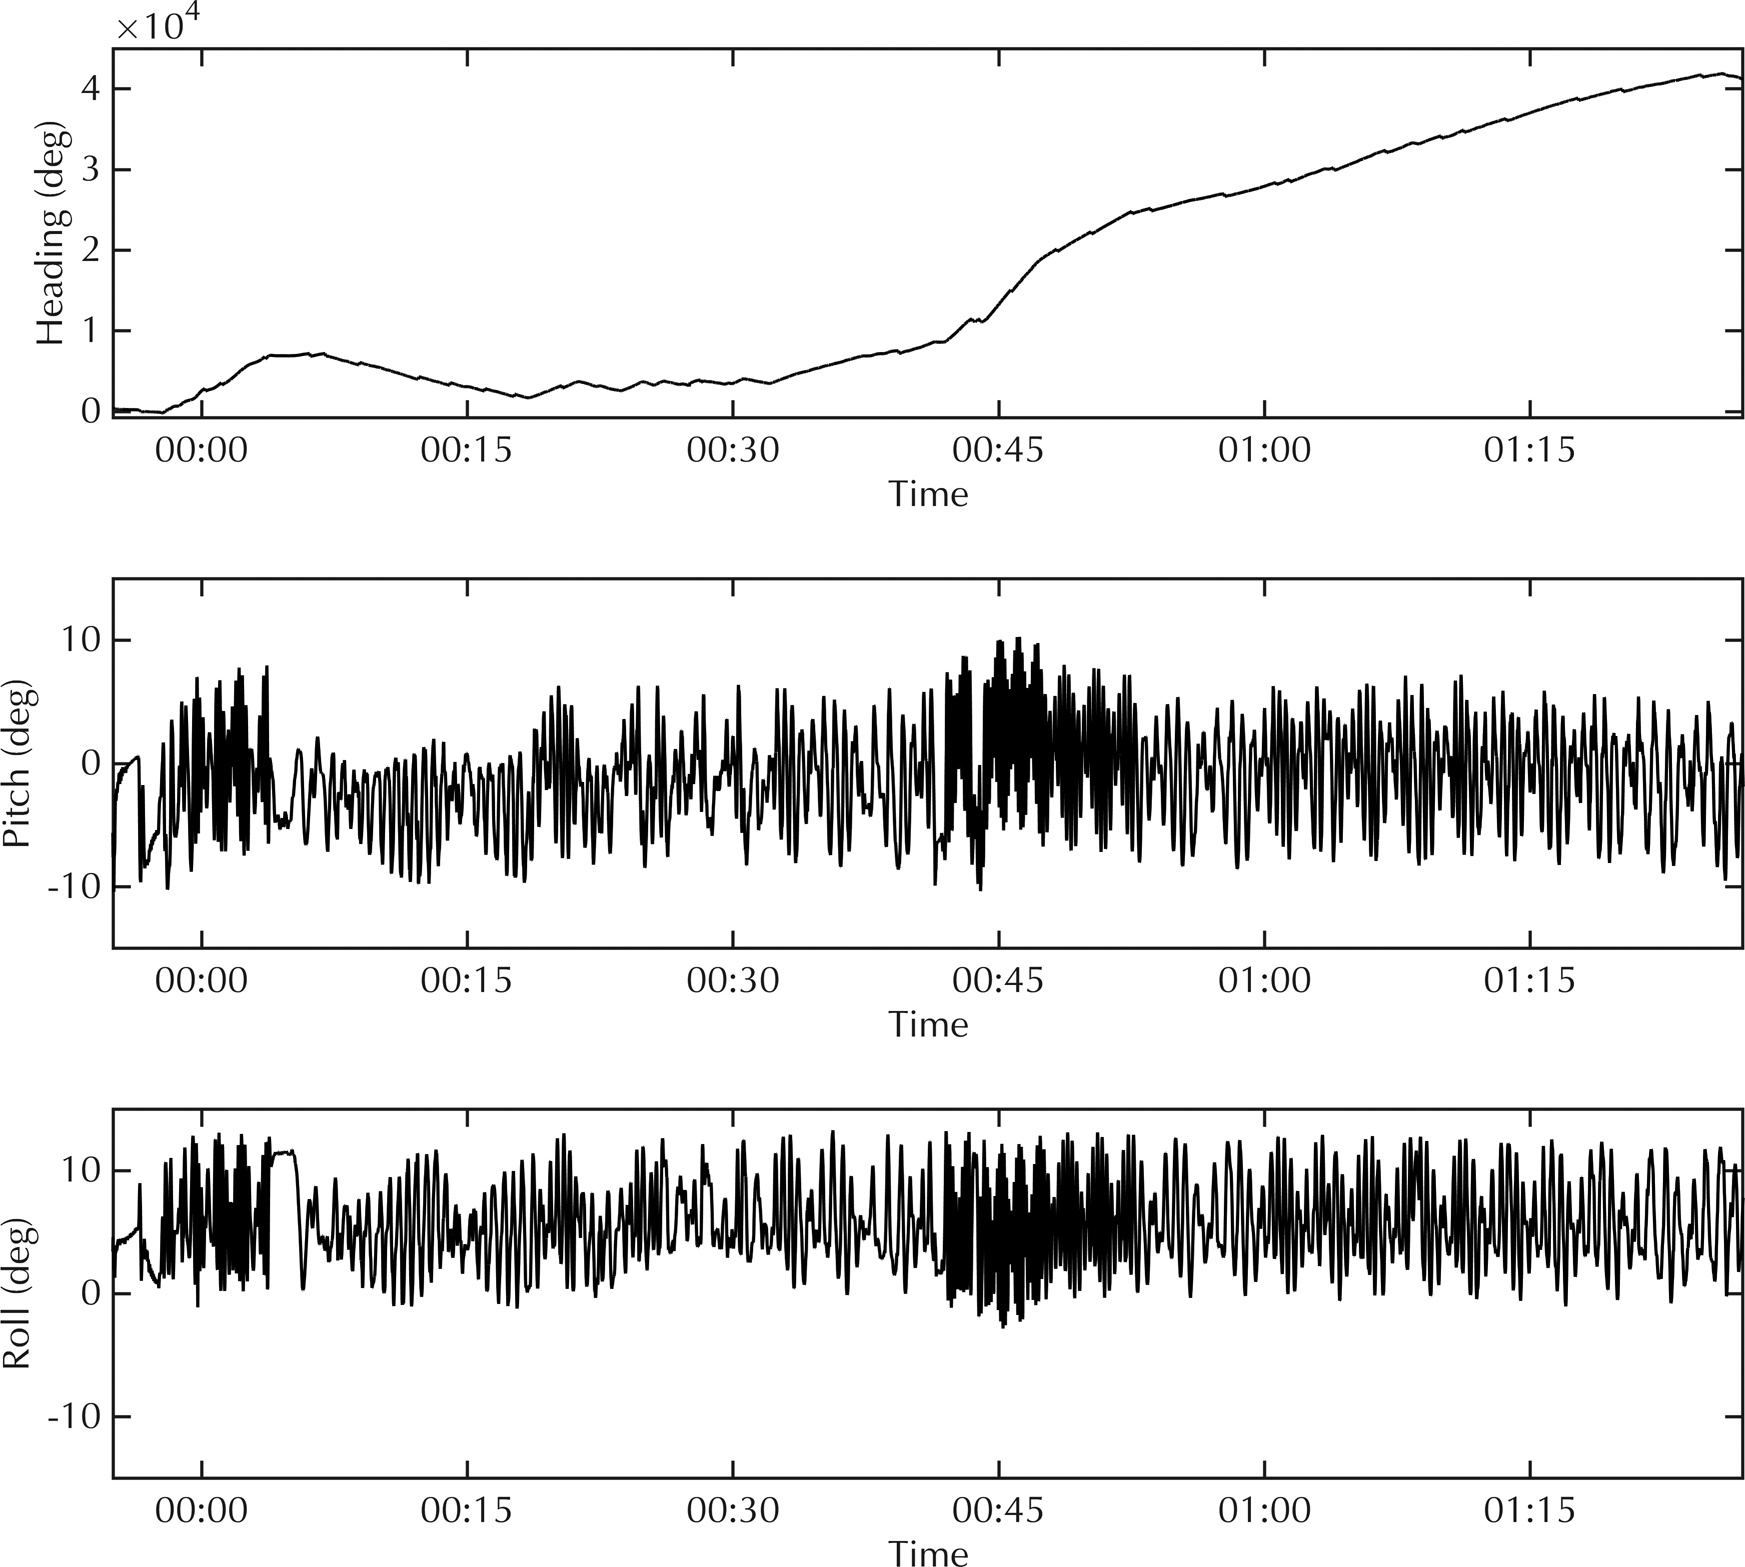
From these data, it is clear that an AHRS unit alone is not sufficient to measure hole verticality. Verification of AHRS data using a magnetometer for heading and inclinometers for tilt (pitch and roll) measurements is essential. It is also necessary for the BMS to be deployed in a vertical position. The inclinometers have a range of ± 3°, and if the frame hangs at an angle greater than this then the sensors will not measure correctly.
Future improvements
The next field testing opportunity for the BMS will be during the planned test season for the Subglacial Lake CECs (Centro Estudios Cientificos) Clean Hot Water Drill project (see Makinson and others, Reference Anker, Makinson, Nicholls and Smith2021). This project will primarily require the hole diameter measurements, however the full functionality would be beneficial. The following list summarises the elements of the system that need to be improved:
-
One of the echo sounder reflector plates came loose in the field, and affected the diameter measurements. An alternative fixing method needs to be used.
-
It is necessary to include salinity measurements and water temperature measurements to the BMS in order to improve sound speed corrections.
-
The hole diameter measurement using echo sounders needs to be extensively tested before deployment, and configured correctly. The technique shows promise, but needs to prove measurement accuracy.
-
The process to setup and calibrate the system needs to be simplified and shortened for field use.
-
The ADC available on the VM2 logger PCB is the AD7779 from Analog Devices, which is an 8 channel, 24 bit simultaneous sampling ADC. The development for the ADC electronics was not completed before the start of the BEAMISH field season, and the BMS was shipped unfinished. This meant that the inclinometers and magnetometer could not be sampled during the field season. This needs to be completed and integrated with the current operating software.
-
The AHRS unit was not fully integrated with the VM2 logger board and needs to be integrated with the current operating software.
-
The mechanical frame needs to balance the centre of mass to the centre of the frame.
-
The Raspberry Pi Zero W (cameras) are not rugged enough for field use, and caused failures. The cameras need to be ruggedised and simplified further, or find alternative camera solutions.
Conclusion
The BMS used for hot water drilling has been presented. The hardware and design considerations have been discussed, reviewing the strengths and weaknesses of the system. The package is currently capable of recording three camera streams (two side facing, one downward facing), as well as borehole diameter (non-contact), AHRS values and water column pressure. Future improvements will allow the system to measure high-resolution inclinometer data and magnetometer data in order to verify AHRS measurements. The system is programmed to operate autonomously after lowering down the borehole, and has flexibility in how it controls its measurement systems (controlling cameras and HMU separately). This allows the system to optimise its energy usage, and extend measurement time during field visits. The system is small, lightweight (~35.5 kg) and low power using only 6 ‘D’ cell sized lithium batteries, making it ideal for transport and use in remote field sites.
Data collected from this system during the BEAMISH project (Rutford Ice Stream) have been presented and discussed. These data demonstrate that the system adds value to drilling operations in the field and after for hole evolution models. The combination of visual and measured data is used to assess hole verticality as well as cavity connection during drilling, and therefore meets the needs of future hot water drilling operations.
Acknowledgements
This technical development was supported by the UK Natural Environment Research Council under AFI grant NE/G014159/1, Basal Conditions on Rutford Ice Stream: Bed Access, Monitoring and Ice Sheet History (BEAMISH) and NERC grant NE/R016038/1, National Capability – Polar Expertise Supporting UK Research.


 Open access