

Introduction
Political divisions often extend beyond disagreements over policy into deeper emotional hostility between groups, a phenomenon known as affective polarization (AP). More specifically, AP refers to the tendency for individuals to feel substantially more negative toward members of an opposing group (the “out-group”) than toward members of their own group (the “in-group”). Such animosity manifested in reduced trust, lower willingness to cooperate, and resistance to dialogue, can undermine both economic policymaking and democratic governance (Harteveld, et al. Reference Harteveld, Berntzen, Kokkonen, Kelsall, Linde and Dahlberg2022a; Hetherington and Rudolph Reference Hetherington and Rudolph2015; Lee Reference Lee2022).
While one might assume that AP is caused by the ideological differences between the two groups, a growing literature identifies false polarization—the phenomenon where individuals overestimate the actual ideological differences between the in-group and the out-group—as a central driver of AP. Prior studies often measure false polarization as the gap between average in-group and out-group positions, a metric often called “perceived polarization” (Westfall et al. Reference Westfall, Van Boven, Chambers and Judd2015; Fernbach and Boven Reference Fernbach and van Boven2022). However, we argue that what matters most for an individual’s behavior is not this aggregate gap, but the distance between the individual’s own ideological position and their perception of the average position of the out-group, which we term perceived ideological difference. This individual-level measure simultaneously captures misperception of the out-group’s position and a respondent’s own ideological alignment, and we hypothesize that it is a more precise predictor of out-group animosity. Moreover, in fragmented media environments, perceived ideological difference may become especially magnified by echo chambers which tend to depict out-groups negatively, reinforcing both perceived distance and hostility (Levendusky Reference Levendusky2013; Yang et al. Reference Yang2016; Lau et al. Reference Lau, Andersen, Ditonto, Kleinberg and Redlawsk2017; Lu et al. Reference Lu, Ray, Ha and Chen2020).
This paper investigates: (1) how perceived ideological differences influence out-group animosity; (2) the extent to which echo chambers amplify these perceptions and the resulting animosity; and (3) whether actual ideological differences continue to have explanatory power for out-group animosity once perceived ideological differences are taken into account. We examine these questions using an original survey of 2,016 Thai respondents conducted in August–September 2021, during mass protests calling for constitutional and monarchy reform. Thailand provides a compelling case: a country with entrenched partisan divisions, recurrent military intervention, and a highly partisan media environment that spans both traditional and digital platforms.
Our findings show that perceived, rather than actual, ideological differences are the dominant predictor of out-group animosity, and that echo chambers tend to amplify AP. These results highlight how misperception and selective exposure can intensify political hostility.
This paper contributes to the literature in several ways. First, while most studies on AP have been conducted in the context of countries with more developed economies and stable democracies, little is known about AP in developing and semi/non-democratic countries. We address this gap by examining Thailand during a non-democratic period with pronounced political polarization. Second, we propose “perceived ideological differences” as an alternative measure that incorporates both perceived polarization and an individual’s political alignment relative to the in-group. We show that this measure more effectively predicts out-group animosity at the individual level compared to existing metrics, such as perceived polarization used in Westfall et al. (Reference Westfall, Van Boven, Chambers and Judd2015).
The remainder of the paper proceeds as follows. The next section reviews the relevant literature and develops our hypotheses. The following section outlines the political and media context in Thailand. We then describe the survey design, variables, and empirical strategy, before presenting descriptive statistics. The subsequent section reports the main results and robustness checks, followed by a discussion of their implications. The final section concludes the paper.
Literature review and theoretical predictions
The drivers of AP have been widely studied in political science and, increasingly, in political economy. Three strands of literature are particularly relevant to our analysis. The first examines the role of perceived ideological difference in shaping political attitudes and behavior. The second explores how media environments and selective exposure influence these perceptions and deepen political animosity. The third highlights that perceived ideological differences may be a stronger driver of AP than actual ideological polarization.
Perceived ideological differences and out-group animosity
Social identity theory (Tajfel and Turner Reference Tajfel, Turner, Jost and Sinaius2004) posits that individuals derive part of their self-concept from group membership. This identification fosters in-group favoritism and out-group bias, even when material interests are not at stake. In politics, partisan identity shapes perceptions of rationality and ideological distance, heightening hostility and limiting cooperation between groups (Hetherington and Rudolph Reference Hetherington and Rudolph2015). Experimental evidence also supports these theoretical predictions: perceptions of out-group extremity amplify out-group animosity (Webster and Abramowitz Reference Webster and Abramowitz2017), while reducing perceived extremity—particularly via in-group endorsements—attenuates out-group animosity (Duong et al. Reference Duong, Small, Hawkins and Xu2023). Heightened perceived polarization also erodes social trust (Lee Reference Lee2022). These findings underscore the role of perceived ideological differences as a key driver of affective polarization.
Media environments and echo chambers
Individuals create echo chambers when they only consume media from sources that align with their views. Amplified by platform algorithms, these chambers constantly reinforce like-minded perspectives and exaggerate how extreme the opposing side is (Yang et al. Reference Yang2016; Lu et al. Reference Lu, Ray, Ha and Chen2020). This dynamic increases the perceived ideological distance between groups, making opponents seem much farther away on the political spectrum than they might be in reality.
Moreover, research indicates that exposure to the negative framing and one-sided portrayals in partisan media generates strong negative emotions, which intensify hostility and fuel animosity toward out-groups (Levendusky Reference Levendusky2013; Lau et al. Reference Lau, Andersen, Ditonto, Kleinberg and Redlawsk2017; Lelkes et al. Reference Lelkes, Sood and Iyengar2017; Hasell and Weeks Reference Hasell and Weeks2016). This anger, in turn, facilitates the rapid spread of divisive content on social media, further perpetuating partisan echo chambers. Together, these findings suggest that echo chambers contribute to AP indirectly by amplifying perceived ideological differences and directly by heightening out-group hostility.
Perceived versus actual ideological differences
Perceived ideological gaps often diverge from actual polarization. Individuals tend to overestimate the extremity of opposing groups (Levendusky and Malhotra Reference Levendusky and Malhotra2015; Westfall et al. Reference Westfall, Van Boven, Chambers and Judd2015). This gap matters because perceived polarization is more strongly associated with affective polarization than actual ideological distance. Evidence from both US and cross-national studies consistently shows that perceptions of ideological distance predict hostility more robustly than objective ideological differences (Lelkes Reference Lelkes2016; Armaly and Enders Reference Armaly and Enders2021; Wagner Reference Wagner2021; Reiljan Reference Reiljan2020). These findings highlight the importance of perceptions in shaping animosity, suggesting that identity-driven beliefs rather than objective divide underpin AP.
Building on these strands, we set out three hypotheses:
Hypothesis 1: Perceived ideological differences are the primary driver of AP. In other words, individuals who perceive the out-group’s ideology as significantly different from their own are more likely to exhibit greater out-group animosity.
Hypothesis 2: Echo chambers affect out-group animosity through two distinct channels: indirectly, by amplifying perceived ideological differences, and directly, through exposure to one-sided, negative content targeting the out-group.
Hypothesis 3: Once perceived ideological differences are accounted for, actual ideological difference has no statistically significant effect on out-group animosity.
We test these predictions using individual-level measures of perceived and actual ideological difference, combined with variation in media exposure, while controlling for demographics, economic security, political extremity, and political alignment.
Background on Thailand
Political polarization in Thailand
Thailand’s modern political polarization can be traced to the mid-2000s, with tensions intensifying after Prime Minister Thaksin Shinawatra’s second electoral victory in 2005. Following that election, media entrepreneur Sondhi Limthongkul and other critics mobilized mass protests under allegations of corruption and abuse of power, culminating in the formation of the People’s Alliance for Democracy (PAD) or the “Yellow Shirts” in early 2006. The Yellow Shirts drew support from conservative royalists, urban middle classes, and segments of the bureaucracy and military, and they often endorsed military intervention to preserve stability and uphold traditional institutions (Thabchumpon and McCargo Reference Thabchumpon and McCargo2011; Hewison Reference Hewison2015; Sinpeng Reference Sinpeng2021).
In response to the 2006 military coup that removed Thaksin, his supporters organized the United Front for Democracy Against Dictatorship (UDD) or the “Red Shirts.” This movement drew heavily from rural and working-class voters, advocating for electoral representation, economic redistribution, and institutional reforms to reduce elite dominance (Nishizaki Reference Nishizaki2014; Thabchumpon and McCargo Reference Thabchumpon and McCargo2011).
Polarization deepened in the years that followed, with cycles of mass mobilization, violent street clashes, and repeated military interventions. The most recent coup in 2014, led by General Prayuth Chan-o-cha, brought a pro-military government to power and further entrenched divisions between pro- and anti-military camps. By the late 2010s, the emergence of the Future Forward Party (FFP)—and later its successor, the Move Forward Party (MFP)—added an “Orange” progressive bloc to the anti-military coalition. While distinct from the Red Shirts in demographic base and policy focus, the Orange bloc shared key goals such as constitutional reform and reducing military influence in politics (Thananithichot Reference Thananithichot2021).
The dissolution of FFP by court order in 2020 triggered a new wave of protests, many led by younger activists. These protests reached an unprecedented scale in 2021, calling for constitutional reform, curbing military power, and, notably, reform of the monarchy—issues rarely addressed so openly in Thai politics. In August 2021, during our survey period, protest leader Anon Nampa delivered a landmark speech advocating repeal of Section 112 (the lèse-majesté law) and was arrested shortly thereafter. This sequence of events marked a historically rare moment of sustained, large-scale mobilization against the pro-military regime.
The role of media in Thai politics
Thailand’s media landscape is deeply intertwined with its political divides. Since the early 2000s, both pro- and anti-Thaksin camps have built extensive media networks. On the Yellow side, outlets such as ASTV provided platforms for anti-Thaksin activism (McCargo Reference McCargo2017). On the Red side, channels like PTV, Asia Update, and Voice TV amplified pro-Thaksin and anti-military perspectives (Pathmanand Reference Pathmanand, Phongpaichit and Baker2016). These partisan outlets not only reported news but actively promoted partisan agendas and delegitimized opposing viewpoints, reinforcing political cleavages (Sombatpoonsiri Reference Sombatpoonsiri, Carothers and O’Donohue2020).
The rise of social media intensified these patterns. By 2021, Thailand had among the highest social media penetration rates globally—around 70 percent—and users spent an average of 2.5 hours per day online (DataReportal 2024). Partisan content migrated online, where it was amplified through user sharing and algorithmic recommendation (Grömping Reference Grömping2014; Reuters Institute 2025). This created fertile ground for echo chambers where individuals encountered content aligned with their preexisting beliefs, both reinforcing and skewing their perceptions of political opponents.
Methodology
The objective of this paper is to test the following hypotheses: (H1) perceived ideological differences are the primary driver of negative affect toward out-groups; (H2) echo chambers amplify out-group animosity through two channels: indirectly by increasing perceived ideological differences and directly by shaping affective responses toward out-groups; and (H3) when perceived ideological differences are taken into account, actual ideological differences do not have significant effects on out-group animosity. In this section, we describe the survey we conducted, which is our main data source. We then lay out the econometric models used to test our hypotheses.
Survey
The data used in this study were collected through an original online survey conducted in August and September of 2021. A total of 2,016 respondents completed the survey. We conducted the survey online for several reasons. First, the COVID-19 pandemic made face-to-face interviews difficult—if not impossible—to conduct. Second, the survey contained questions some might consider sensitive, and an online survey can help reduce social desirability bias compared to an interviewer-administered survey (Koivula et al. Reference Koivula, Räsänen, Sarpila and Kurosu2019). Third, an online survey allowed us to reach a larger and more diverse group of respondents under the budget and time constraints compared to face-to-face or telephone interviews. The main variables used in the analysis and their definitions are discussed below. Descriptive statistics are provided in the next section. The full survey questionnaire is available in Appendix A.
Political inclination
We first need to determine each respondent’s political inclination. While political inclination, especially in the US context, is typically delineated by asking individuals if they identify themselves as a liberal or a conservative,Footnote 1 within the Thai context, such terms could have different connotations. For example, the term “liberal” in the Thai context is often associated with the pro-democracy movement, which is not necessarily equivalent to the Western concept of liberalism. Moreover, the term can mean different things to different people.
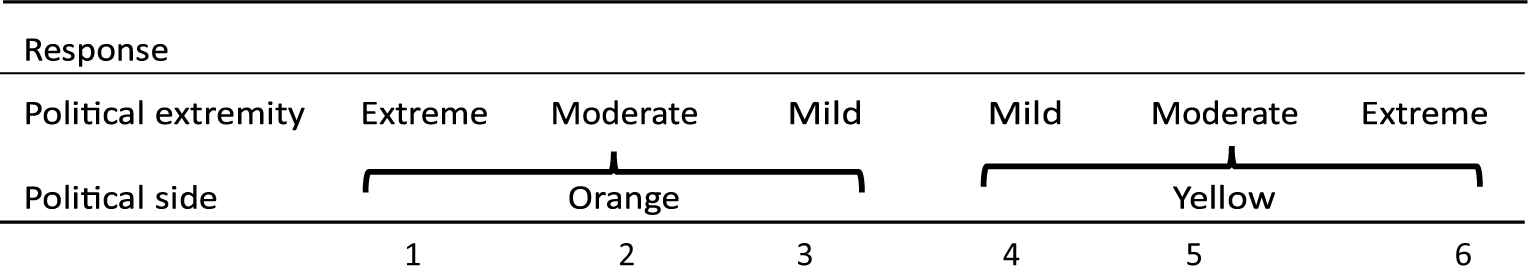
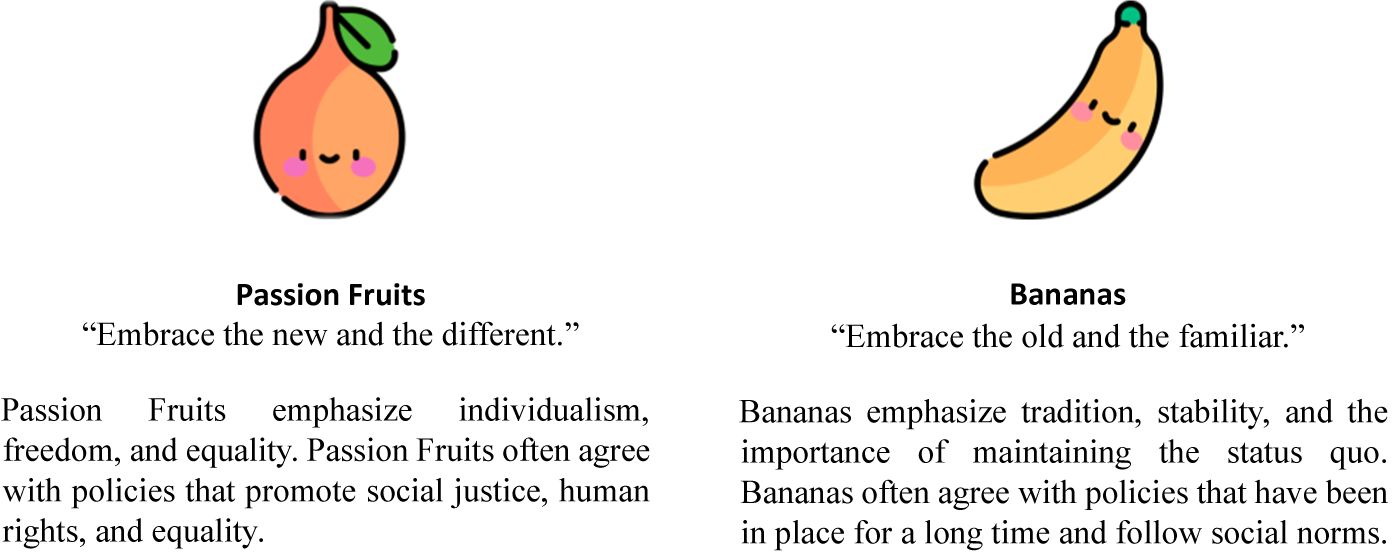
To mitigate potential misunderstandings, we have devised new groups that capture the two main opposing groups during the time of the interview. We designate the two groups as “Passion Fruits” (Orange) and “Bananas” (Yellow).
In addition to group names and colors that could cue political associations with the “Red and Orange Shirts” (the coalition against military-backed government) and the “Yellow Shirts” (supporters of military-backed government), we also list the values that each group adheres to, as shown in Figure 1, and ask the respondent where they stand on the scale of 1 (extreme Orange) to 6 (extreme Yellow).Footnote 2 We then convert this into two variables: political extremity and political side, as shown in Table 1 below.
Definitions of Orange and Yellow groups provided in the survey.

Conversion of political inclination response into political extremity and political side variables
Demographics and socioeconomic security
The survey collects respondents’ demographic information such as age, gender, education, occupation, household income, and whether the respondent lives in a municipal or non-municipal area. We also ask respondents to rate their socioeconomic security on a five-point Likert scale, assessing their concerns and exposure to economic insecurity and adverse events.
Out-group animosity
We measure respondents’ feelings toward “members of the out-group” (henceforth MO) by asking how they feel across five different contexts using five-point Likert scales. The respondents who identified themselves as Yellow were asked about their feelings toward Orange which constitutes their out-group, and vice versa. These 1–5 scores are then scaled down into the range of 0–1.
The first question asks about the overall feeling whether the respondent dislikes MO. This will be our primary measure of out-group animosity. To help us understand what this positive or negative feelings toward the MO might mean in both non-political and political contexts, we asked four additional questions, namely, (i) Fairness: whether the respondent will offer legal help to MO if MO is innocent, (ii) Sympathy: whether the respondent will offer help when MO is under bodily harm, (iii) Policy: whether the respondent trusts in the competency of MO in policymaking, and (iv) Exchange: whether the respondent is comfortable having political dialogue with MO.
Perceived ideological difference
We solicit respondents’ positions on ideological/political issues by asking whether they agree or disagree with a set of contextual statements (e.g. “A military coup is acceptable”) using a five-point Likert scale. Additionally, we ask the respondents what they believe the average out-group’s position on the issue to be. We then scale these scores down to the range of 0–1. From this set of questions, we are able to measure perceived ideological differences—how much the respondent thinks the out-group’s position differs from their own position.
Actual ideological difference
In contrast to perceived ideological difference, we measure the actual ideological difference by calculating the difference between the respondent’s reported position and the average position of the out-group as reported by respondents of the opposing group.
Media consumption
The media plays an important role in shaping individuals’ political attitudes and perceptions (Levendusky and Malhotra Reference Levendusky and Malhotra2016; Prior Reference Prior2013). To examine its effects on polarization, we include detailed questions on respondents’ news consumption. Each respondent was presented with a list of 32 major news agencies, both traditional and online, spanning a wide political spectrum, and was asked which outlets they regularly consume.
To classify media outlet’s political alignment, we estimate the association between outlet audiences and respondents’ political alignment in our survey, following findings in Gentzkow and Shapiro (Reference Gentzkow and Shapiro2006) and Ribeiro et al. (Reference Ribeiro, Henrique, Benevenuto, Chakraborty, Kulshrestha, Babaei and Gummadi2018). Outlets whose audiences are statistically more likely to identify with one political side are coded as either “Yellow” or “Orange,” while those without significant skew are coded as “Neutral” (see Appendix B). Using these outlet-level classifications, we construct an individual-level echo chamber index, defined as the proportion of same-side outlets consumed relative to a respondent’s total media consumption. This measure also captures exposure to opposing-side and neutral outlets, providing a direct measure of selective exposure and echo chambers. We then use this index in our regression analysis to examine how media environments contribute to out-group animosity.
While classifying outlet leanings based on respondents’ self-reported consumption and political alignment may introduce some endogeneity, the index effectively shows how much a respondent consumes outlets most favored by others who share their political alignment. Future work could address this limitation by classifying outlets using external audience or news content data. Further details on the construction of the index are provided in Appendix B.
Model
In our analysis, we employ regression models to investigate the potential impact of perceived ideological differences, echo chamber, and actual ideological differences, on out-group animosity. All variables were collected at the individual level. Our primary dependent variable is out-group animosity, defined as participants’ self-reported affective responses toward members of the out-group (OverallFeeling i). Our main independent variables of interest are perceived ideological difference (PerceivedDiff i), echo chamber index (EchoChamber i), and actual ideological differences (ActualDiff i) of the respondent. Our main empirical specification is as follows:
 $$ {\mathrm{OverallFeeling}}_i={\beta}_1\hskip0.3em {\mathrm{PerceivedDiff}}_i+{\beta}_2\hskip0.3em {\mathrm{EchoChamber}}_i+{\beta}_3\hskip0.3em {\mathrm{ActualDiff}}_i+\Gamma {\mathrm{X}}_i+{\varepsilon}_i, $$
where X i represents the control variables commonly identified in the literature as drivers of out-group animosity. These include political extremity, political side, and socioeconomic security, and demographic characteristics such as gender, age, income, region, occupation, and education level.
Furthermore, we examine several alternative indicators of out-group animosity, using the same set of independent and control variables described above. As previously noted, these include willingness to provide legal assistance to out-group members (Fairness i), willingness to help when the out-group is harmed (Sympathy i), trust in the out-group’s role in policymaking (Policy i), and comfort engaging in political dialogue with the out-group (Exchange i).
Table 2 provides an overview of the variables included in the empirical specification, indicating their respective roles in the regression analysis.
Mapping of variables to their roles in the regression specification
Descriptive statistics
This section begins with a brief overview of the statistics of our sample, focusing on political extremity and demographic characteristics. We then present the stylized facts derived from our key variables, which include out-group animosity, perceived ideological difference, and media consumption.
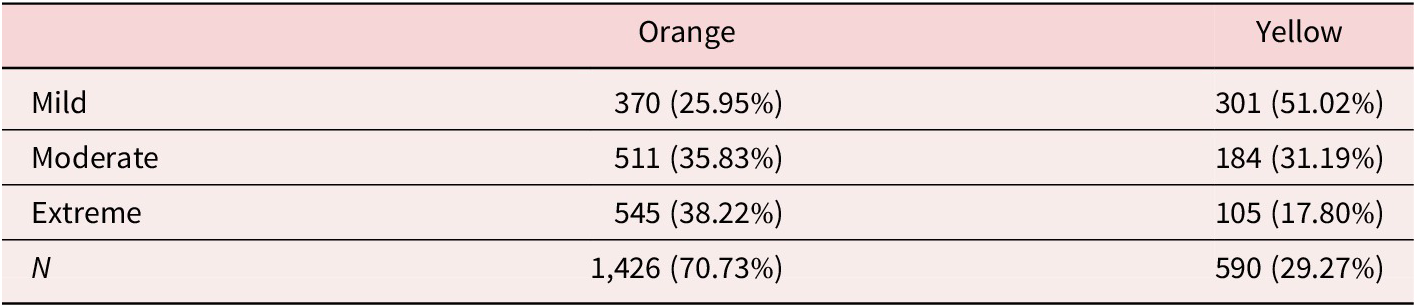
Table 3 presents the summary statistics for political extremity, showing a heavy skew toward the Orange group (71 percent) compared to the Yellow group (29 percent). Notably, the largest group of the Orange respondents falls on the Extreme end of the spectrum, while the majority of the Yellow respondents are Mild. These observations could arise for two reasons: (i) our online survey may have attracted Orange respondents who tend to be younger and more digitally proficient, and (ii) Orange respondents may find our anonymous survey to be a safe space to express their views and discontent, especially under political suppression by the government at the time.Footnote 3
Summary statistics for political extremity variable

Note: The numbers in parentheses represent the percentage share of each category within the respective column.
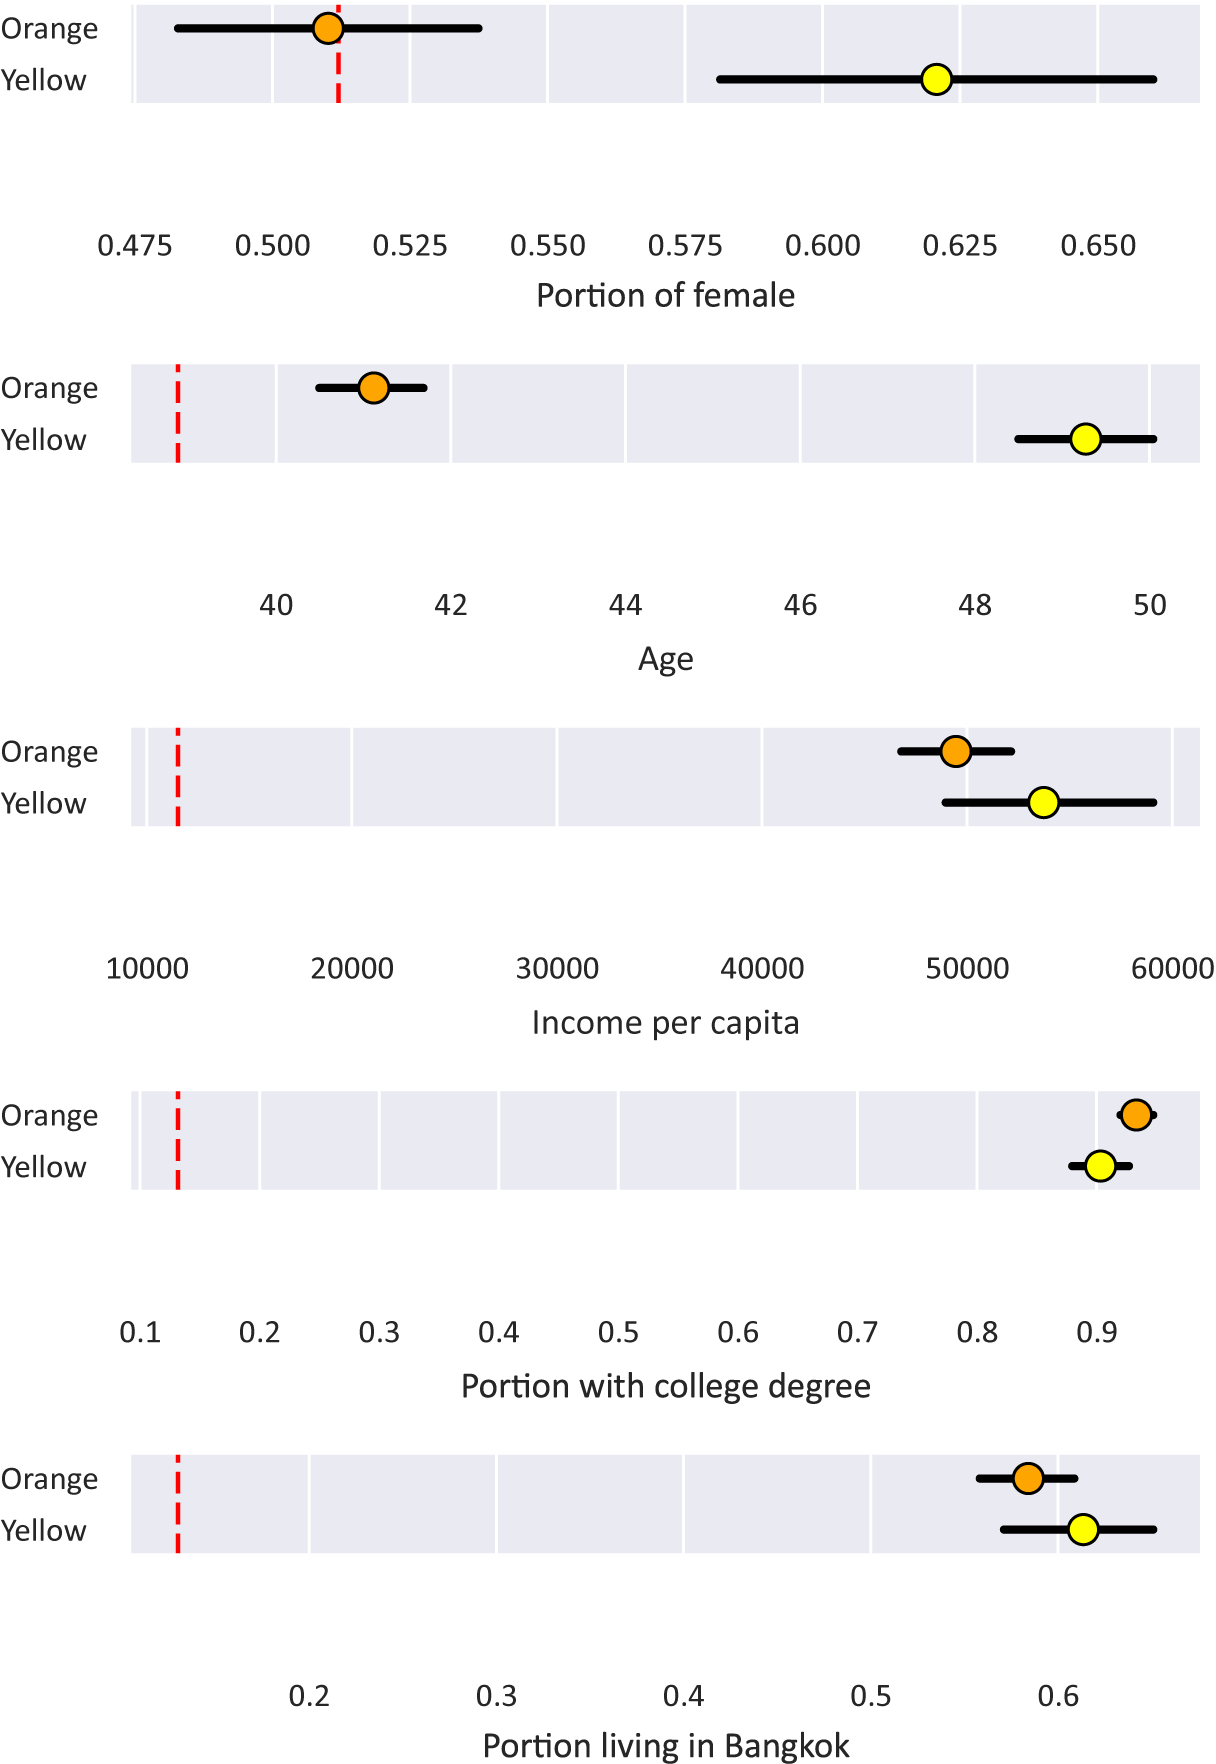
Figure 2 shows that the characteristics of our survey respondents differ from the national population in most aspects. Notably, they tend to be older, wealthier, more highly educated, and more secure in socioeconomic positions. These patterns are likely influenced by the nature of our online survey. However, we do not find statistically significant differences between the two groups, except that Yellow respondents are significantly older. Full details of summary statistics for demographic and socioeconomic variables are provided in Appendix C.
Demographic characteristics for respondents in each group. Circles indicate group average for each variable. Black whiskers provide a 95 percent confidence interval of those averages. Red dashed indicates national averages, according to National Statistical Office of Thailand (2022).

Red dashed line indicate national averages
Out-group animosity
Figure 3 shows the summary statistics of out-group animosity across five contexts, with full question wording provided in the caption. Note that some values reported are flipped so that higher values indicate a greater degree of out-group animosity. As mentioned earlier, we scaled the original response (values from 1 to 5) to 0–1, so that an average score of 0.5 means that the respondents in that group neither agree nor disagree with the statement in the survey.
Summary statistics for out-group animosity scores for respondents in each group. Higher values indicate greater degrees of out-group animosity. Circles indicate group average for each variable. Black whiskers provide a 95 percent confidence interval of those averages. The questions are: (i) Overall—You dislike MO; (ii) Non-political: Fairness—[Flipped] If you are a lawyer and you realize that MO is innocent, you would represent them; (iii) Non-political: Sympathy—[Flipped] You would offer help to MO if they were in an accident; (iv) Political: Policy—[Flipped] You could trust MO in policy making; and (v) Political: Exchange—[Flipped] You feel comfortable exchanging political ideas with MO. Note that, aside from Overall, values reported are flipped.
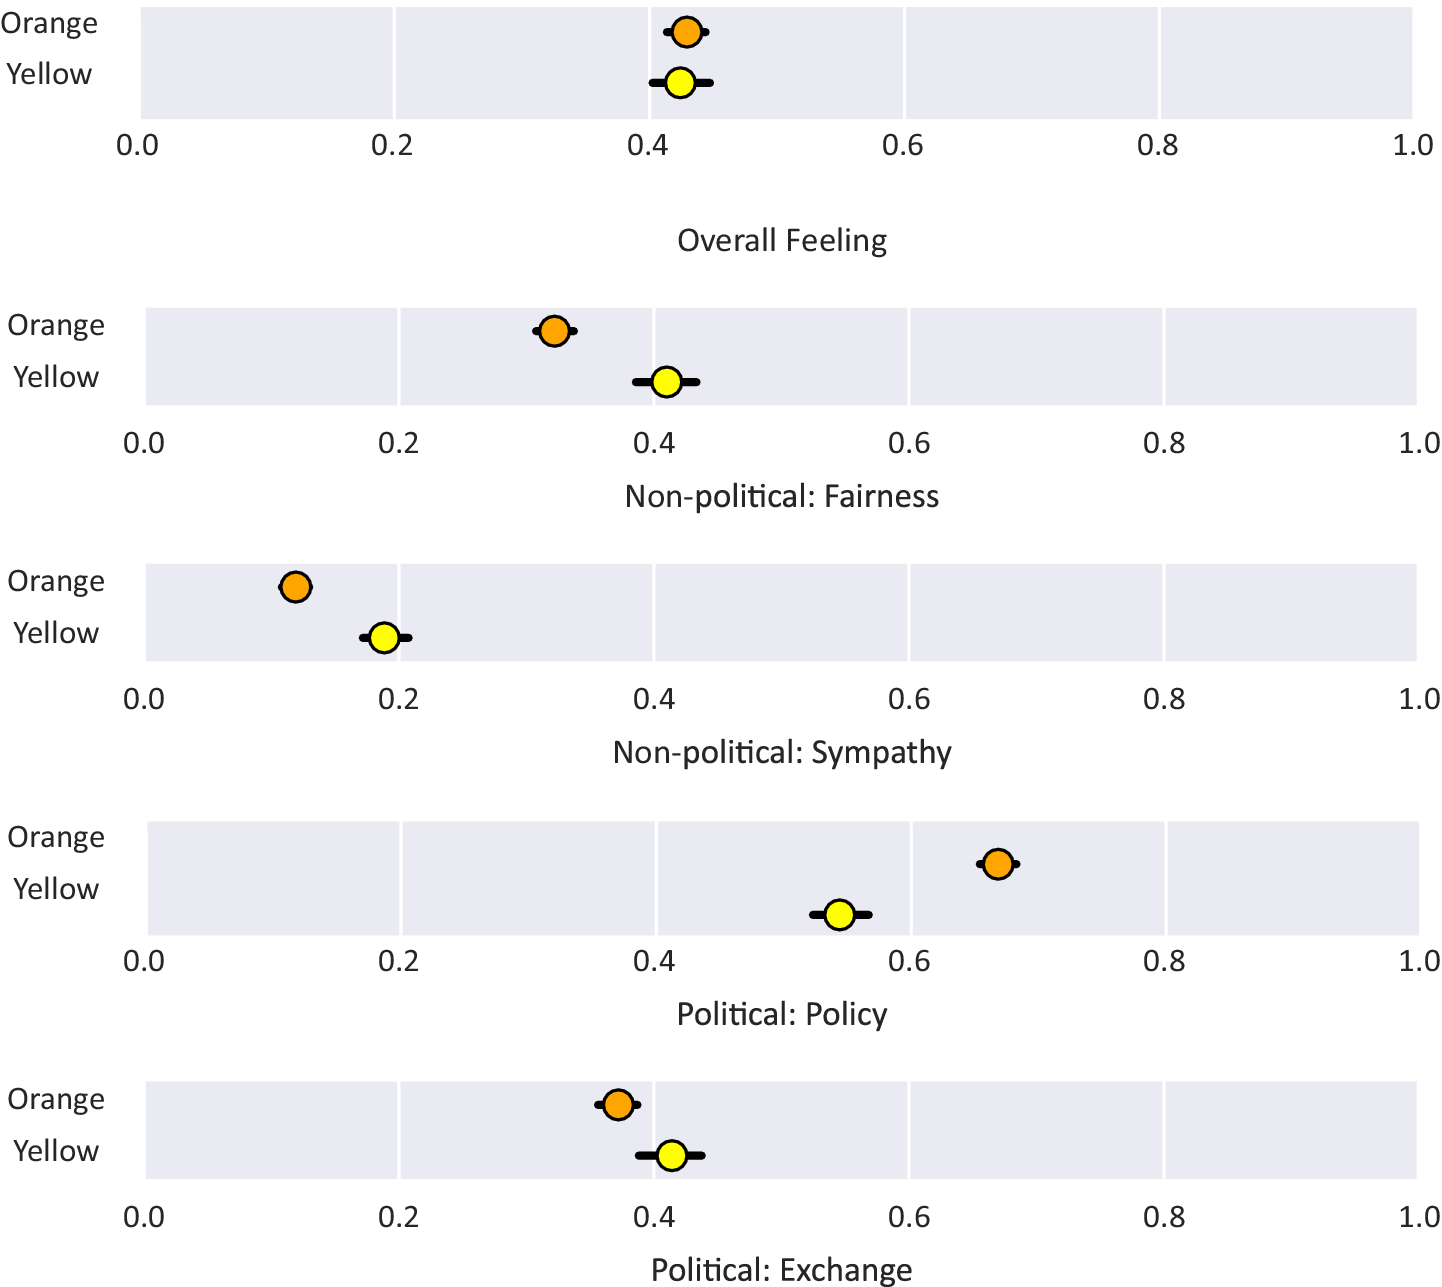
Among the five contexts, the Policy question exhibits the highest out-group animosity for both sides, while the Sympathy question shows the lowest level. Even though both groups show some degree of out-group animosity in most contexts, the animosity does not appear to go as far as not helping MO in life-threatening situations.
Between the two groups, while there is no significant difference in overall out-group animosity as measured by the first question, we find that Yellow consistently exhibits a slightly higher degree of out-group animosity toward Orange when asked about specific situations.Footnote 4 This is broadly in line with what is known as the “rigidity of the right” hypothesis, where conservatives are thought to be more intolerant and exhibit more inter-group bias (Prooijen et al. Reference Prooijen, André, Boiten and Eendebak2015).Footnote 5 The only exception to this is the Policy measure where Orange shows a higher degree of distrust toward Yellow in policy making. This could be attributed to the political context at the time of the survey, in which the party aligned with the Yellow group held power, leaving Yellow with little reason to distrust Orange, which lacked political influence.
Lastly, we find a strong positive correlation between overall out-group animosity and perceived ideological difference, which supports H1. Specifically, out-group animosity increases as the difference between an individual’s self-reported ideology and their perception of the out-group’s ideology widens. Full details are available in Appendix D.
Perceived versus actual ideological difference
Figure 4 reports perceived and actual ideological differences between the two groups. The left panel shows the actual ideological positions of the Orange group (solid orange circles), their perceptions of the Yellow group (yellow X markers), and the Yellow group’s actual positions (solid yellow circles). The right panel shows the corresponding information for the Yellow group. Note that some reported values have been intentionally flipped for consistency, ensuring that views typically associated with Orange values are closer to zero, while views aligned with Yellow values are closer to one.
Perceived and actual ideological difference for each question in the survey. Solid circles represent the average actual responses of each group, and X markers represent the group’s average perceived responses of the out-group. Average perceived ideological differences for each group are shown by the dotted arcs in the respective panels, while the distance between two circles represents actual ideological differences. Some questions are flipped so that the views that are closer to Orange values are closer to zero, and the views that are closer to Yellow values are closer to one.
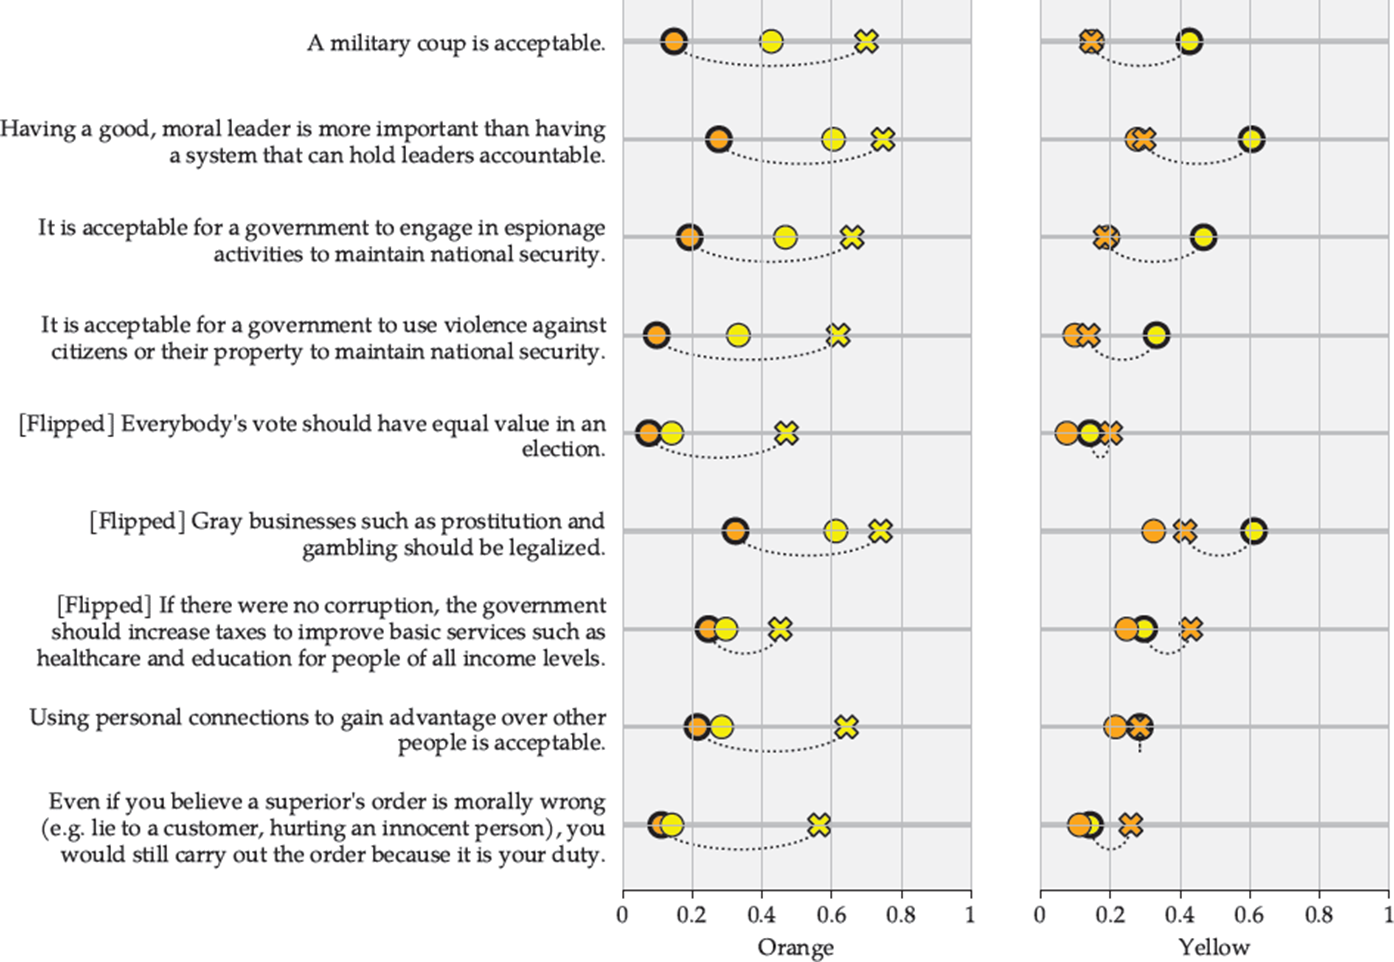
For each question, the arc indicates average perceived ideological difference, while the distance between the two circles represents the actual ideological difference. When this distance between the circles exceeds the arc, perceived ideological difference is greater than the actual difference—a pattern consistent with false polarization (Fernbach and Boven Reference Fernbach and van Boven2022).
The figure shows that the Orange group in our sample has, on average, higher perceived ideological differences than the Yellow group, indicated by the longer arcs in the left panel. Moreover, the Orange group consistently perceives the Yellow group to be more conservative than the Yellow group actually is, as indicated in the left panel by the yellow X markers being on the right of the solid circles. The two questions where this effect is least pronounced are the questions regarding a moral leader and legalizing gray businesses, where the Yellow group’s responses happen to also be the most extreme.
The Yellow group, on the other hand, does not exhibit false polarization: in seven out of nine questions, Yellow’s perception of the Orange group is actually less extreme than the Orange group’s actual response. The greater accuracy of the Yellow group’s perceptions suggests that they may have more exposure to a broader range of political discourse, or that their information sources provide a more balanced representation of the Orange group’s views.Footnote 6 We will explore this further in the next subsection.
Media Consumption
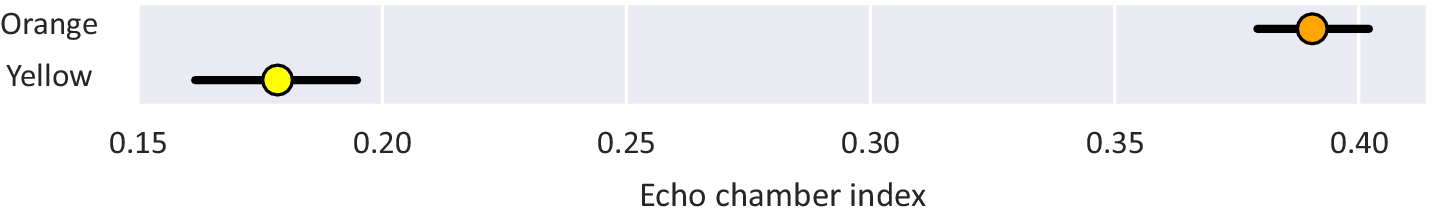
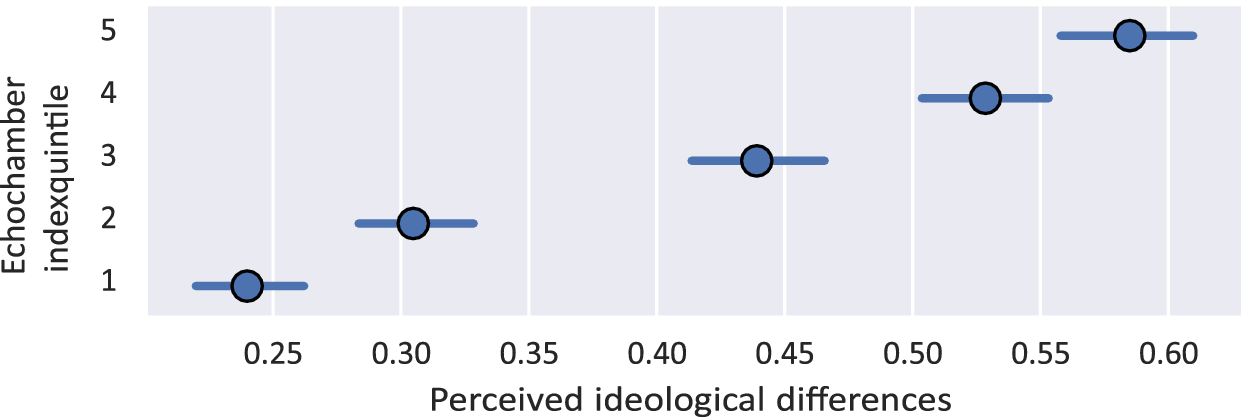
We calculate the echo chamber index following the procedure described in Appendix B. The index ranges from 0 to 1, where a value of zero indicates that the respondent consumes only neutral or opposing-side outlets and a value of one indicates that the respondent consumes only same-side outlets. Intermediate values capture more balanced media diets, with exposure to both same-side, opposing-side, or neutral outlets. Figure 5 reports the average echo chamber index for each group. Respondents in the Orange group exhibit a higher average echo chamber index than those in the Yellow group, indicating more concentrated consumption of ideologically aligned outlets. This pattern is consistent with the larger perceived ideological differences observed among the Orange group, as discussed previously. Additionally, summary statistics indicate that individuals with a higher echo chamber index are more likely to perceive the out-group as holding political views further from their own (Figure 6).
The echo chamber index by political side. Solid circles represent the group means; black whiskers indicate the 95 percent confidence intervals.

.Perceived ideological differences by quintile of the echo chamber index. Blue circles represent the average perceived ideological differences in each quintile. Black whiskers indicate the 95 percent confidence interval of those averages.

These descriptive patterns provide preliminary support for our theoretical framework. As formalized in H2, echo chambers are expected to affect out-group animosity indirectly by amplifying perceived ideological differences: individuals with a higher level of exposure to same-side media are more likely to view the opposing side as more distant from themselves, compared to those who consume a more balanced media mix.
Results
In our regression analysis, we first examine overall out-group animosity as measured by the first question (“You dislike MO”) as it gives us an overall picture of sentiment toward the out-group. We then perform robustness checks of our results to potential biases, and turn to different contextual measures of out-group animosity.
Overall out-group animosity
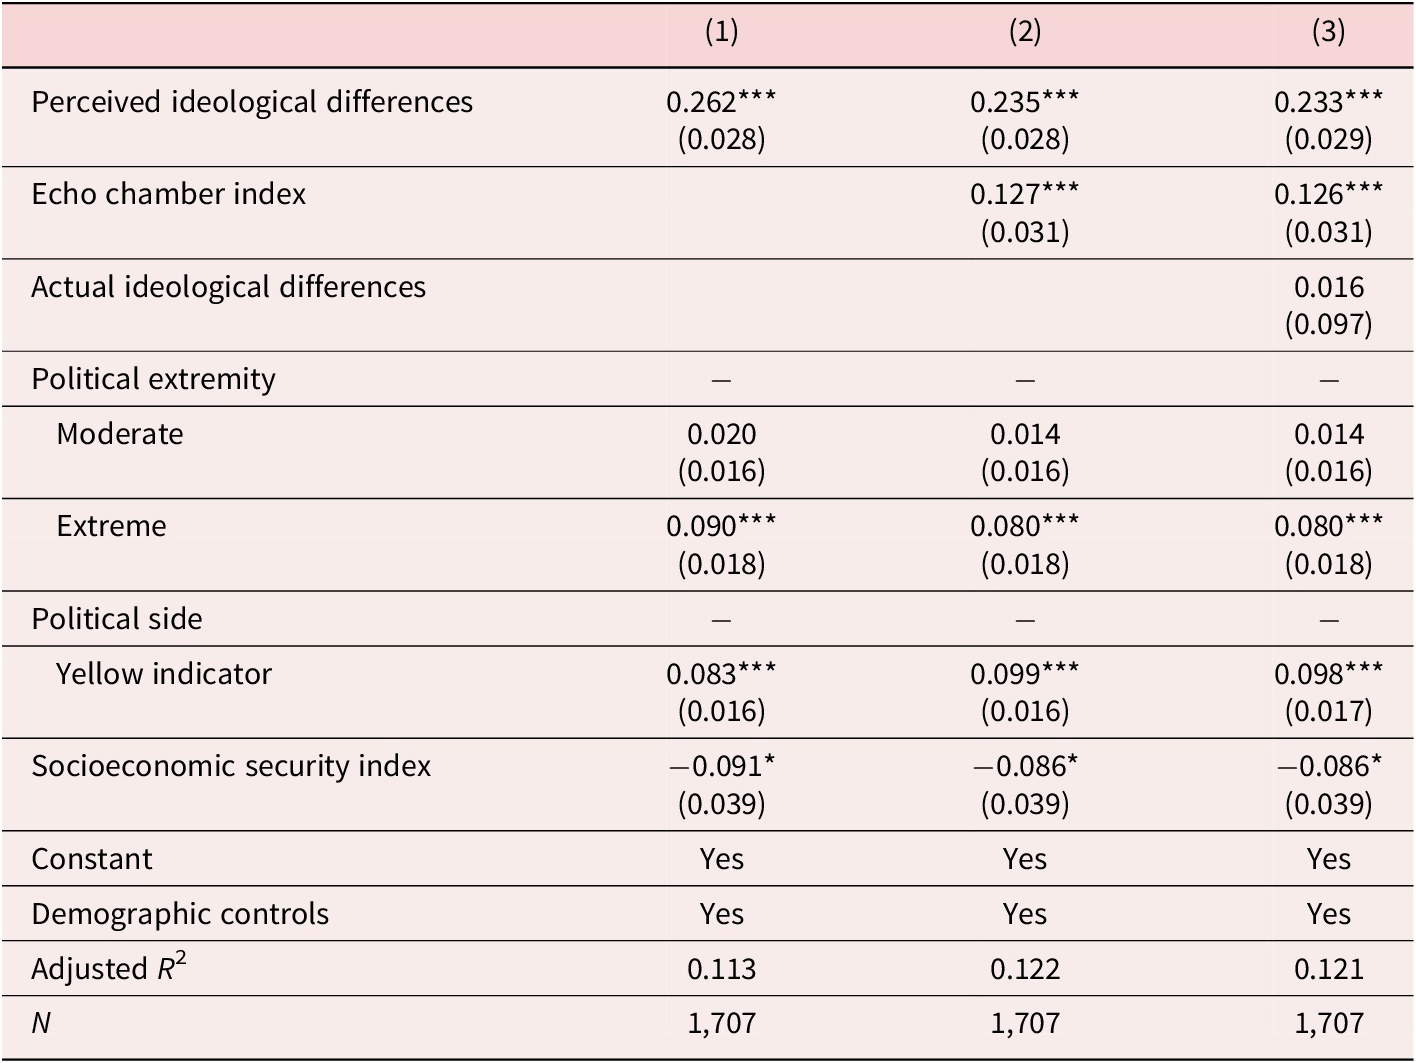
Table 4 presents our key findings. Each specification is designed to test each of our three hypotheses. Looking at specification (1), we find that perceived ideological difference is the largest driver of out-group animosity. Specifically, the more individuals perceive that MO thinks differently from themselves, the stronger their negative feelings toward MO. This is consistent with H1.
Factors associated with the overall measure of out-group animosity (OverallFeeling)
Note: Standard errors are shown in the parentheses. Markers *, **, and *** denote statistical significance at 5, 1, and 0.1 percent confidence levels respectively.
When we include the echo chamber index into the regression model in specification (2), we find that it is positively associated with out-group animosity. Additionally, while the effect of perceived ideological differences remains significant, it is slightly attenuated. This suggests that while echo chambers directly influence out-group animosity, they also do so indirectly through perceived ideological differences. This is consistent with H2.
Lastly, in specification (3), we introduce actual ideological differences to examine their role in determining out-group animosity. When controlling for perceived ideological differences, we find that actual ideological differences offer no additional explanatory power for out-group animosity. This finding confirms H3, emphasizing the dominant role of perception over actual ideological differences in driving out-group animosity.
Aside from verifying our three main hypotheses, our findings also indicate that respondents with stronger political extremism demonstrate higher levels of out-group animosity. This aligns with existing literature on social identity and affective polarization, which shows people who have strong political identity tend to harbor greater dislike toward the out-group on average (Mason Reference Mason2015; Iyengar et al. Reference Iyengar, Lelkes, Levendusky, Malhotra and Westwood2019). Notably, the effect is not linear; it is more pronounced among individuals with extreme political stances, as reflected in the coefficients for Moderate and Extreme political extremity.
Political affiliation also influence out-group animosity. Specifically, Yellow supporters exhibit higher levels of out-group animosity even after controlling for other factors. While a number of studies have found in non-Thai context that conservatives are likely to be disliked more intensely by liberals than vice versa (Harteveld, et al. Reference Harteveld, van der Brug, de Lange and van der Meer2022b; Reiljan Reference Reiljan2020; Gidron, et al. Reference Gidron, Adams and Horne2023), our results are in line with the “rigidity of the right” hypothesis, which posits that conservatives tend to express stronger out-group hostility (Prooijen et al. Reference Prooijen, André, Boiten and Eendebak2015).
In addition, we also find that the socioeconomic security index is negatively associated with out-group animosity. That is, the more secure one feels about their socioeconomic status, the less negative feeling they have toward the out-group, aligning with existing literature on affective polarization, where socioeconomic security is found to be associated with affective polarization (Gidron, et al. Reference Gidron, Adams and Horne2018; Iversen and Soskice Reference Iversen and Soskice2015). Hence, improving overall socioeconomic security and reducing income inequality may lead to lower out-group animosity.
Robustness checks
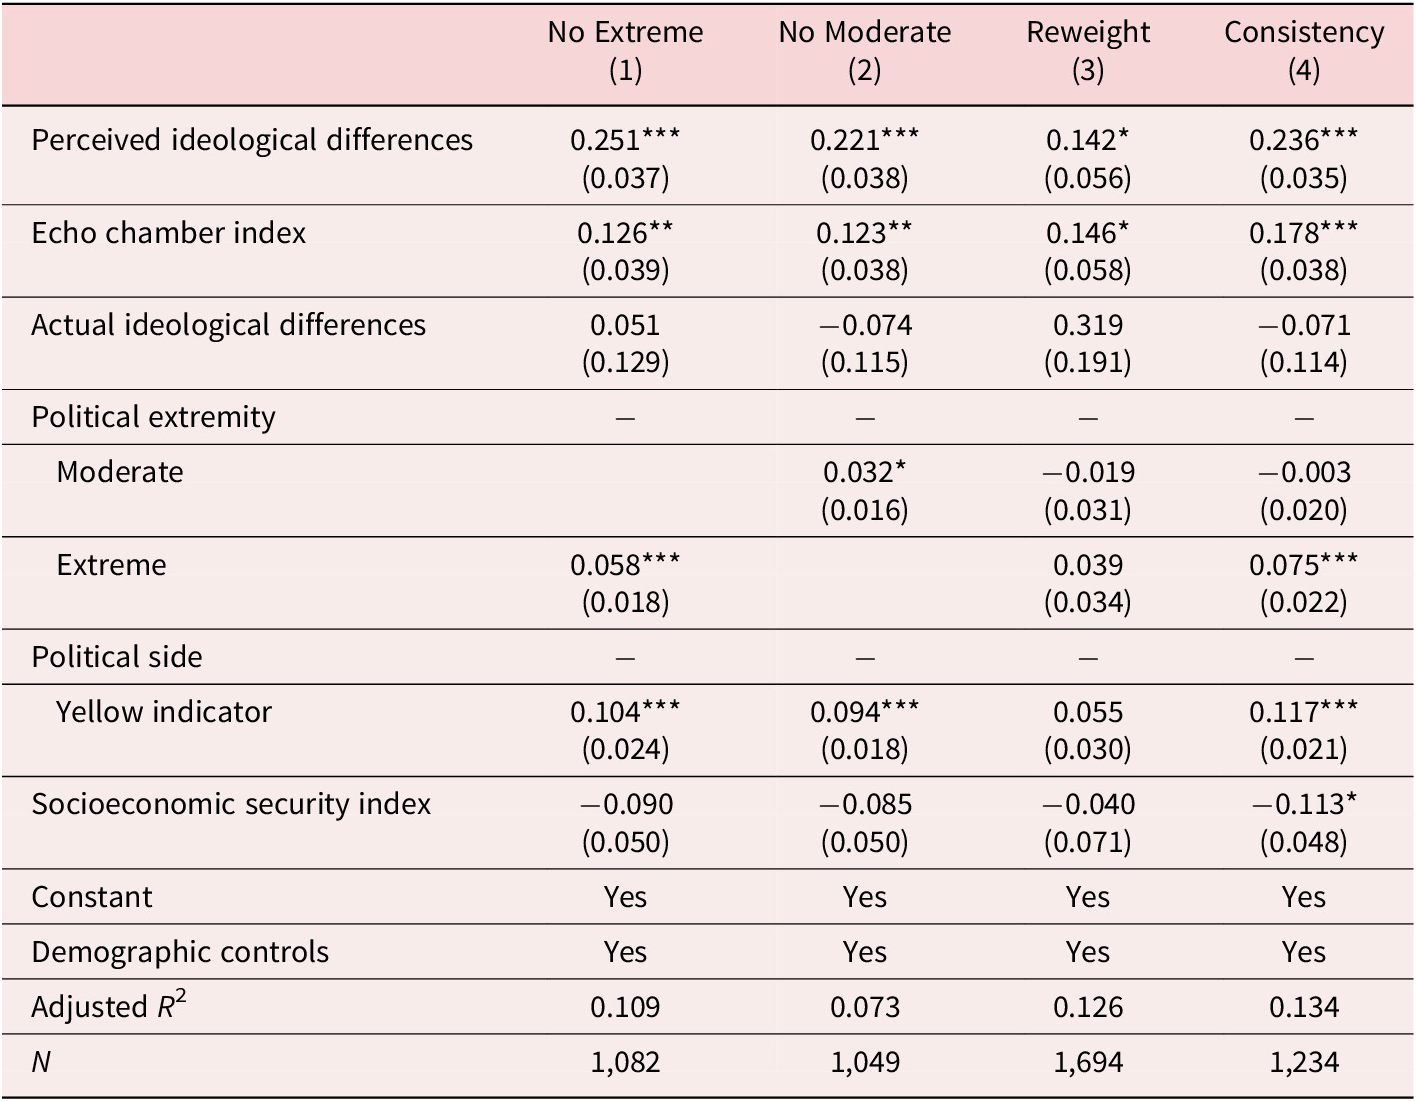
Since our survey is conducted online and is non-probabilistic, our results are likely subjected to selection and non-response biases. The descriptive statistics confirm that our respondents are more likely to be highly educated and have higher incomes than the general population. Due to non-response bias, our example is likely to be more politically active than average. To address these biases, we conduct several robustness checks. The results are shown in Table 5.
Robustness checks: factors associated with out-group animosity (OverallFeeling)
Note: Standard errors are shown in the parentheses. Markers *, **, and *** denote statistical significance at 5, 1, and 0.1 percent confidence levels respectively.
First, to test whether our results are affected by non-response bias where individuals with extreme views are more likely to finish the survey, we exclude responses from individuals who label themselves as Extreme from our analysis in specification (1). Second, since we deliberately exclude a “neutral” political stance from the survey, individuals who would have answered “neutral” were forced to place themselves as either Mild Orange or Mild Yellow. To see whether this survey design choice affects our results, we exclude Mild Orange and Mild Yellow from the analysis in specification (2). Third, to address the issue of sampling bias, we reweigh the sample to match the population in terms of age and income per capita, according to data from National Statistical office of Thailand (2021), in specification (3). Lastly, to ensure the credibility of respondents’ answers, we include attention checks in the survey, asking similar questions about gray businesses in two different places.Footnote 7 Roughly 29 percent of the respondents did not answer consistently. We exclude these individuals for our last robustness check in specification (4). Across all robustness checks, our main results hold.
Out-group animosity in other contexts
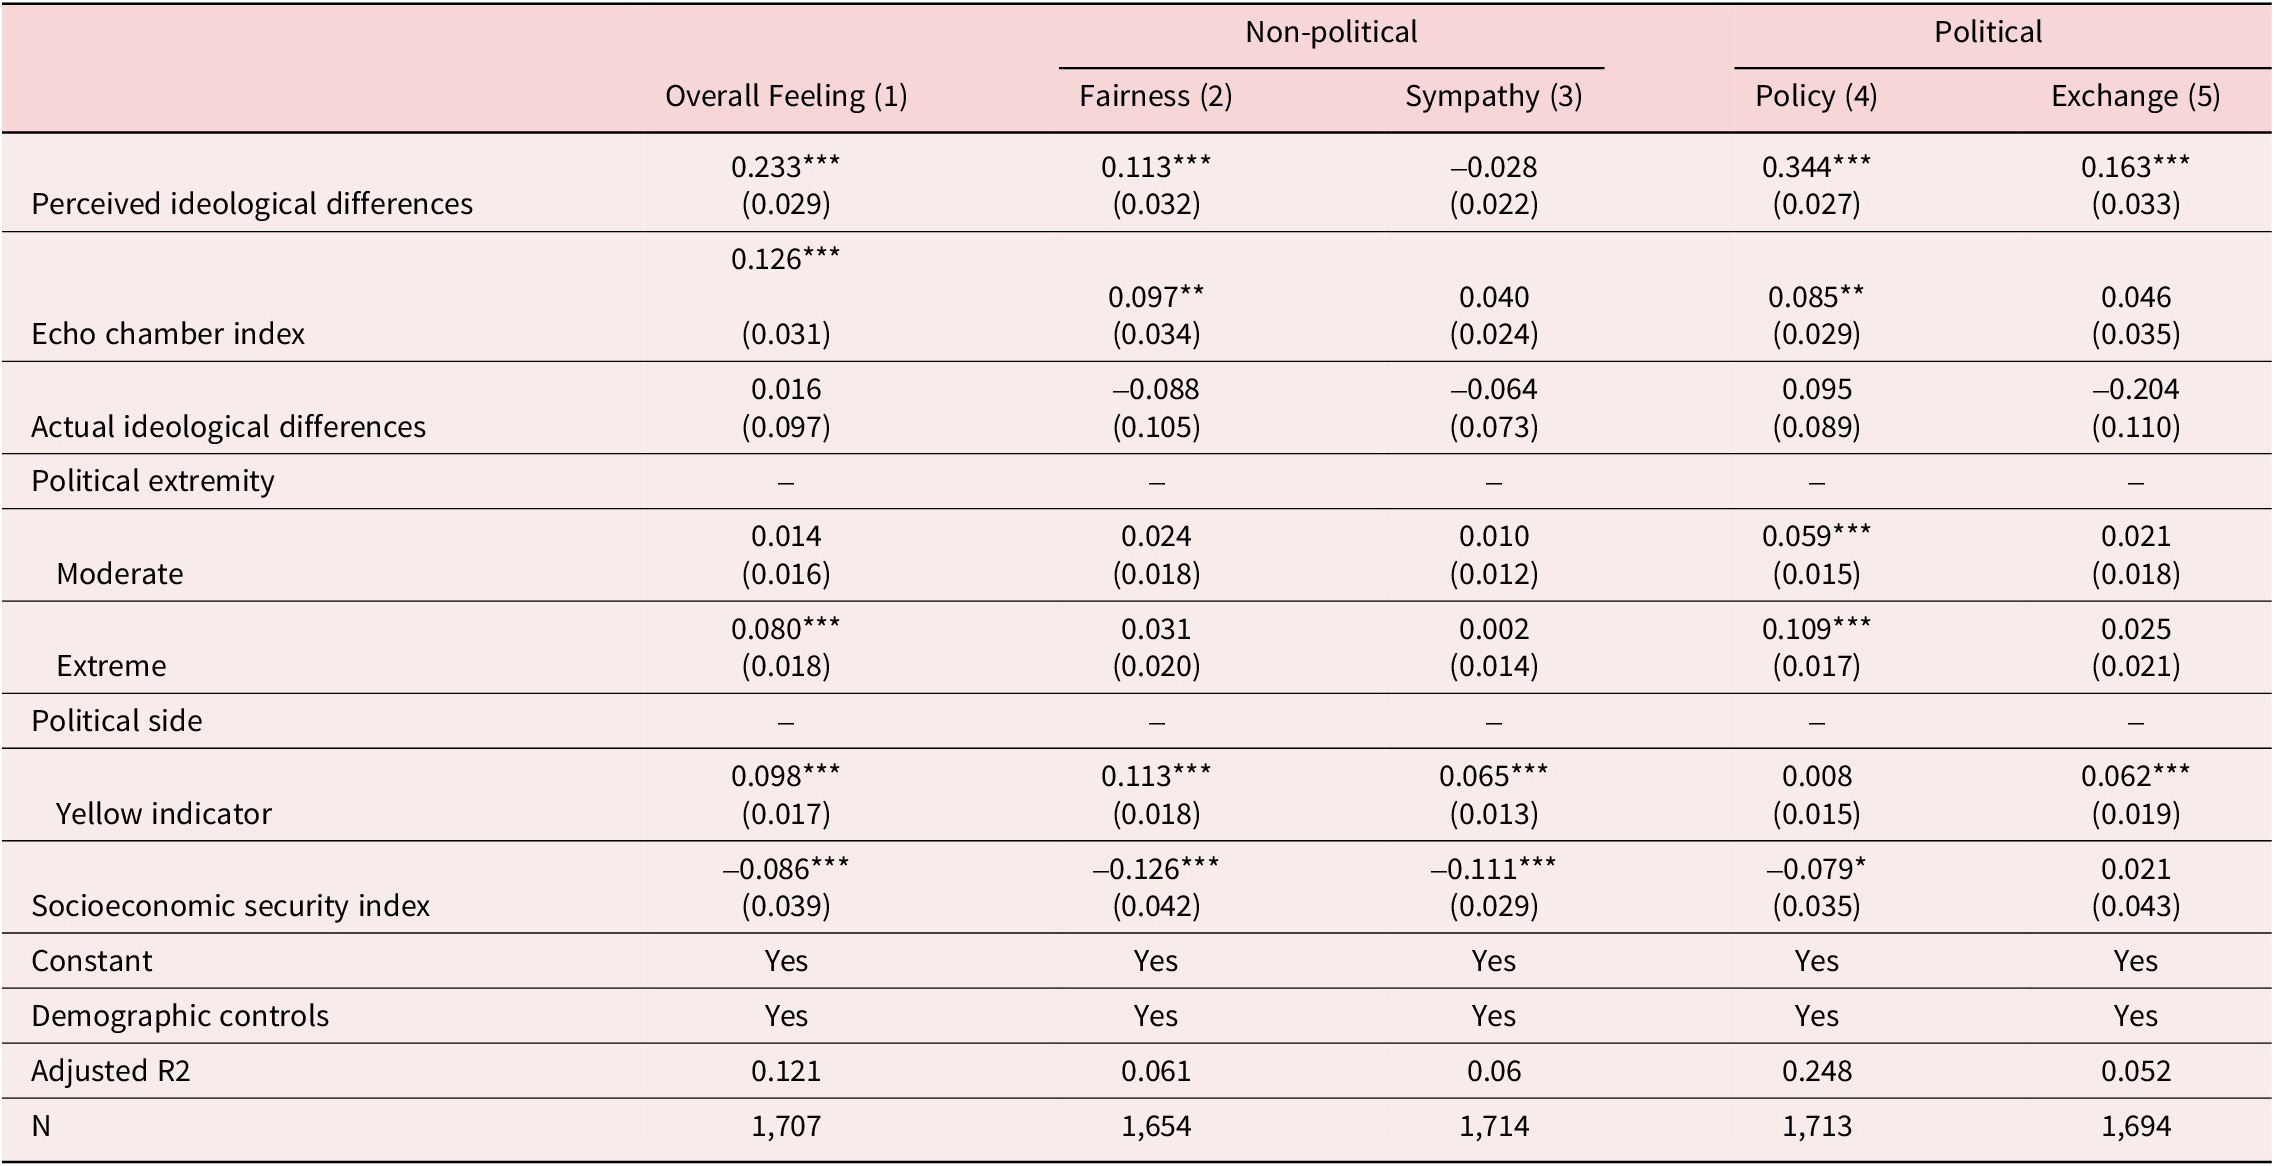
We now turn to alternative measures of out-group animosity in both the non-political contexts (which include Fairness and Sympathy questions) and political contexts (which include Policy and Exchange questions). The results are reported in Table 6.
Factors associated with various measures of out-group animosity
Note: Standard errors are shown in the parentheses. Markers *, **, and *** denote statistical significance at 5, 1, and 0.1 percent confidence levels respectively.
Among the four additional contexts, we find perceived ideological differences to have the highest effects in the Policy context (whether the respondent trusts MO on policy decisions). This finding shows that perceived ideological differences could pose a major barrier to effective policymaking. People may dismiss proposals from the other side out of distrust, even if those proposals align with their own views. Additionally, hesitation to engage in dialogue (Exchange) creates barriers to both democratic processes and economic policymaking. Without open communication, reaching mutual understanding becomes significantly more challenging.
In non-political contexts, our findings show that individuals with high perceived ideological differences may allow their biases to influence their judgment in the Fairness context, such as deciding whether to help MO in a dispute when they are known to be innocent. However, when it comes to assisting the out-group in situations involving physical harm (the Sympathy context), perceived ideological differences do not extend to this domain, suggesting that partisan biases may be less influential in matters of physical well-being.
Counterfactual exercise
Given the significant role of perceived ideological differences, a natural question arises: What would happen to out-group animosity if individuals accurately perceived the out-group’s actual ideological stance?
We proceed with this exercise by first calculating actual ideological differences. This is done by replacing the value of what the respondent thinks the out-group’s stance is with the out-group’s actual stance. We find that while the actual differences average 0.300, perceived differences averages 0.420, a 12 percentage points error. This is in a similar range as the 17 percentage points error found by Westfall et al. (Reference Westfall, Van Boven, Chambers and Judd2015) using nationally representative US data.
A back-of-the-envelope calculation suggests that if perceived ideological differences were to decrease by 12 percentage points—aligning with actual ideological differences—overall out-group animosity (as measured by OverallFeeling from model (1) in Table 6) would decline by approximately 0.233×12 = 2.8 percentage points, lowering the average value of OverallFeeling from 0.428 to 0.400. On the policymaking dimension (model (4) in Table 6), realizing the out-group’s actual position would decrease distrust by 0.344×12 = 4.1 percentage points, lowering the average value of Policy from 0.633 to 0.592. In summary, narrowing the gap between perceived and actual ideological differences could meaningfully reduce out-group animosity and distrust.
Discussion
In this study, we examine how perceived ideological differences and echo chambers shape out-group animosity during the period of non-democratic political landscape of Thailand. Our findings show that affective responses are closely tied to both perceived ideological distance and media echo chambers, whereas actual ideological differences play a much smaller role. Higher levels of perceived ideological difference are associated with greater out-group animosity across domains such as trust in policymaking, willingness to exchange political ideas, and readiness to defend justice, which impedes consensus building even where there is potential agreement. However, this relationship does not extend to sympathy toward out-groups in situations involving physical harm or injury.
These patterns should be interpreted in light of the extraordinary political environment at the time of our survey. In August 2021, Thailand experienced sustained large-scale protests, including open calls for constitutional and monarchy reform and the arrest of prominent protest leaders such as Anon Nampa, events that may have heightened both perceived ideological differences and affective polarization, particularly in measures related to political trust and willingness to engage across groups.
Our study makes three main contributions. First, we offer a new individual-level measure, “perceived ideological difference,” that captures both misperception of out-group extremity and respondents’ own ideological alignment, improving upon the traditional perceived polarization measure, which compares only the average in-group and out-group positions. Second, we highlight the central role of perceived, rather than actual, ideological differences, in predicting out-group animosity in Thailand. Third, we demonstrate the significant role of media echo chambers in shaping these perceptions. Whereas previous research (e.g. Yang et al. Reference Yang2016; Lu et al. Reference Lu, Ray, Ha and Chen2020; Lelkes, et al. Reference Lelkes, Sood and Iyengar2017) has often relied on indirect proxies for media exposure (such as general online or social media use), we construct a direct “echo chamber index” by asking respondents about the specific outlets they consume on traditional and online platforms.
We acknowledge that our study has limitations that provide avenues for future research. First, our data was collected via an online snowball sample. While we employed quota criteria and performed robustness checks to mitigate potential biases, this method may affect the generalizability of our findings. Replicating this study with a nationally representative random sample similar to Webster and Abramowitz (Reference Webster and Abramowitz2017) and Lee (Reference Lee2022) would therefore be a valuable next step. Second, the cross-sectional nature of our survey limits our ability to draw definitive causal inferences. Collecting longitudinal data to track affective polarization and ideological perceptions over time in Thailand would also be valuable. Finally, future work could explore the impact of perceived ideological differences through behavioral or implicit measures (see Iyengar et al. Reference Iyengar, Lelkes, Levendusky, Malhotra and Westwood2019, for discussions).
Conclusion
This paper shows that misunderstandings, rather than actual ideological differences, drive out-group animosity in the polarized context of Thailand. Our new measure of “perceived ideological difference” demonstrate how distorted perceptions, rather than objective gaps, explain negative affect toward political opponents.
We further find that these dynamics are intensified by fragmented media environments and echo chambers, which reinforce selective exposure and misperception of opposing groups. By making individual-level perceptions and media exposure explicit, our study contributes a more precise understanding of affective polarization in a non-democratic setting. Recognizing the impact of exaggerated perceptions, echo chambers, and partisan sorting can help Thai society, and other similarly situated polities, work toward bridging divides and fostering more constructive discourse across political camps.
Supplementary material
The supplementary material for this article can be found at http://doi.org/10.1017/jea.2025.10020.
Acknowledgments
We would like to thank two anonymous reviewers for their insightful comments and suggestions. This paper also benefits from discussions with Krislert Samphantharak, Sommarat Chantarat, Nada Wasi, Stithorn Thananithichot, Thanee Chaiwat, Chayanit Poonyarat, Wasimon Tosuratana, Rongbo Jin, Mary Pimrapaat Dusadeeisariyakul, and comments from seminar participants at PIER Research Exchange. We would also like to thank survey respondents as well as those who generously assisted in the dissemination of our survey, without whom this research project would not have been possible. During the preparation of this manuscript, the authors used generative AI tools, specifically ChatGPT, Gemini, and Copilot, to assist with refining language and proofreading. The authors reviewed and edited the content generated by the AI tool to ensure accuracy and appropriateness. All intellectual contributions, interpretations, and conclusions are solely those of the authors, who take full responsibility for the final content of the manuscript.
Competing interests
The authors declare none.


 Open access