


Introduction
Perovskite ferroelectrics are among the most versatile functional materials. This is related to the various physical phenomena present in these materials, including piezoelectricity, pyroelectricity, high permittivity, polarization switching, and electro-optic and electrocaloric effects. One of the most widely utilized properties is piezoelectricity [Reference Heywang, Lubitz and Wersing1], which enables the coupling between electrical and mechanical signals and makes perovskite ferroelectrics vital parts of electronic applications, such as actuators, sensors, and transducers. Moreover, piezoelectricity is the basis for many emerging technologies, including electronic body implants, micro/nanorobotics, energy harvesters, and sensors for the Internet of Things, etc. It thus comes as no surprise that piezoceramics were identified as vital materials for the future and one of the fastest growing electroceramic market segments [Reference Gagliardi2].
Single crystals of perovskite ferroelectrics are of high interest from the application point of view and from the scientific perspective. For example, crystals enable full exploitation of the piezoelectric anisotropy to enhance the properties by domain engineering. This results in some of the largest known piezoelectric coefficients [Reference Li, Cabral, Xu, Cheng, Dickey, LeBeau, Wang, Luo, Taylor, Hackenberger, Bellaiche, Xu, Chen, Shrout and Zhang3], which are one order of magnitude higher than those of their polycrystalline counterparts. On the other hand, single crystals are crucial for studying the intrinsic dielectric, elastic, and piezoelectric properties of ferroelectrics, which increases the fundamental physical understanding and provides important input for simulations.
Since the discovery of the two main perovskite ferroelectric systems, BaTiO3 (BT) and Pb(Zr,Ti)O3 (PZT), in the middle of the last century, the field of piezoelectrics has grown significantly. While incongruent melting and refractory nature of zirconate inhibits the growth of large and high-quality PZT single crystals, other lead-based systems have been found and extensively studied over the past 20 years [Reference Zhang and Li4, Reference Zhang, Li, Yu, Jiang, Lee, Luo and Shrout5]. Among the milestones were the high properties reported in (1−x)Pb(Zn1/3Nb2/3)O3–xPbTiO3 (PZN-PT) crystals by Kuwata et al. in 1982 [Reference Kuwata, Uchino and Nomura6] and in (1−x)Pb(Mg1/3Nb2/3)O3–xPbTiO3 (PMN-PT) crystals by Park and Shrout in 1997 [Reference Park and Shrout7]. These crystals exhibited giant piezoelectric coefficients of d 33 > 1500 pm/V and high electromechanical coupling factors k 33 > 0.90 and were the basis for several other binary and ternary systems [Reference Zhang and Li4, Reference Zhang, Li, Yu, Jiang, Lee, Luo and Shrout5]. The high piezoelectric properties of the 1st generation of PMN-based crystals were later complemented by increased depolarization temperatures (2nd generation) and higher mechanical quality factors Q m (3rd generation). The most recent breakthrough was achieved in 2019, when Li et al. reported Sm-doped PMN-PT crystals with d 33 values up to 4100 pC/N (k 33 = 0.95, T R–T = 50 °C) [Reference Li, Cabral, Xu, Cheng, Dickey, LeBeau, Wang, Luo, Taylor, Hackenberger, Bellaiche, Xu, Chen, Shrout and Zhang3]. However, despite the exceptionally high electromechanical properties, PMN-based crystals suffer some drawbacks, like the relatively low depolarization temperatures (60–150 °C), compositional variations, and poor long-term stability.
The past two decades were characterized by increased social environmental awareness and the desire for replacing toxic and hazardous elements, which impacted many areas of materials science. In the field of ferroelectrics, this triggered the search for nontoxic replacements for lead in PZT- and PMN-based materials [Reference Shrout and Zhang8, Reference Rödel, Jo, Seifert, Anton, Granzow and Damjanovic9], which was additionally supported by governmental regulations in various countries [Reference Bell and Deubzer10]. Most noticeable one is the EU's Restriction of Hazardous Substances (RoHS), which restricts the content of lead in certain electrical and electronic equipment and is being revised on a regular basis [11]. Although none of the regulations is currently prohibiting the use of lead in piezoelectrics, alternative materials were extensively researched and several potential lead-free piezoelectrics were identified. Most notable ones are based on the following three main systems: (K,Na)NbO3 (KNN) [Reference Shirane, Newnham and Pepinsky12, Reference Saito, Takao, Tani, Nonoyama, Takatori, Homma, Nagaya and Nakamura13, Reference Wu, Xiao and Zhu14], (Na1/2Bi1/2)TiO3 (NBT) [Reference Takenaka, Maruyama and Sakata15, Reference Jo, Dittmer, Acosta, Zang, Groh, Sapper, Wang and Rödel16], and (Ba,Ca)(Zr,Ti)O3 (BCZT) [Reference Liu and Ren17, Reference Acosta, Novak, Rojas, Patel, Vaish, Koruza, Rossetti and Rödel18]. Recently, the high-temperature piezoelectric BiFeO3 [Reference Leontsev and Eitel19, Reference Rojac, Benčan, Malič, Tutuncu, Jones, Daniels and Damjanovic20] was also widely researched. We note that most of these systems were already investigated in the 20th century but were given little attention due to the dominance of lead-based piezoelectrics. Although lead-free piezoceramics are today still inferior to PZT when compared on an overall performance level, several new compositions have reached a certain level of maturity and have started to be implemented in device prototypes and industrial products [Reference Shibata, Wang, Tou and Koruza21, Reference Rödel, Webber, Dittmer, Jo, Kimura and Damjanovic22]. Moreover, their research increased the general understanding of piezoelectrics and the underlying physical phenomena.
The extensive research of new lead-free piezoceramics in the polycrystalline form was accompanied by intensified efforts to prepare the corresponding single crystalline form. This trend is demonstrated in Fig. 1, which shows the number of publications on single crystals from the main lead-free material classes. Although some papers were already published before (first KNN crystals were reported in 1950s [Reference Shirane, Newnham and Pepinsky12, Reference Cross23]), this representation focuses on the period after 2000, where the vast majority of publications appeared. The most important work from earlier years is reported throughout this review. As compared with the number of publications on lead-free polycrystalline ceramics, which started to increase around 2004 (see e.g., Refs. Reference Rödel, Jo, Seifert, Anton, Granzow and Damjanovic9 and Reference Rödel, Webber, Dittmer, Jo, Kimura and Damjanovic22), the increased research of their single-crystalline counterparts was delayed by a few years. This is likely related to the complexity of the growth process and peculiarities of the individual systems, which required research groups to invest more time in mastering the processing.
Number of papers on the three main groups of lead-free piezoelectric single crystals since 2000. The search was carried out using the Web of Science database, Clarivate Analytics.
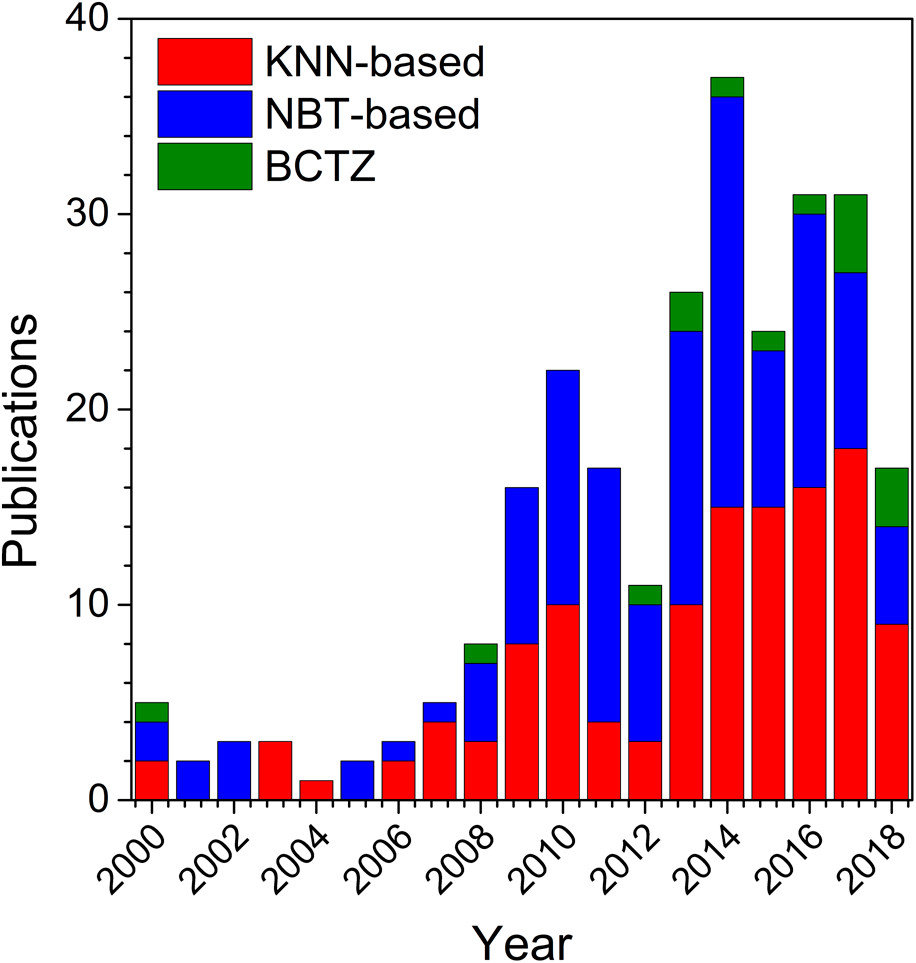
With respect to the material classes, the two dominant groups in the 21st century were clearly KNN and NBT. NBT-based materials belong to the group of relaxor ferroelectrics and exhibit rather moderate piezoelectric coefficients, but large electric–field–induced strains [Reference Jo, Dittmer, Acosta, Zang, Groh, Sapper, Wang and Rödel16]. Their relaxor nature and complex structure have resulted in several controversies in the literature, for example, with respect to the differences between their average and local structure [Reference Paterson, Nagata, Tan, Daniels, Hinterstein, Ranjan, Groszewicz, Jo and Jones24]. It is interesting to see that these issues were also a strong driving force for the growth of single crystals; a considerable number of the papers on NBT-based crystals from Fig. 1, namely, focus on the investigation of the crystallographic and electronic structure and their relaxor behavior. The other dominant group are single crystals based on the ferroelectric KNN system, which are the topic of this review and will be described in detail below. The literature reports on this system are notably more focused on the crystal growth process and functional properties, as the structure is relatively less complex compared with NBT-based materials. At the same time, some of the KNN-based crystals have recently demonstrated very high piezoelectric properties, including d 33 = 1050 pC/N [Reference Jiang, Zhang, Rao, Li, Randall, Li, Peng, Li, Gu, Liu and Huang25] and k 33 = 0.95 [Reference Huo, Zhang, Zheng, Zhang, Wang, Wang, Sang, Yang and Cao26]. Along with their low density, high transition temperatures, and nontoxic composition, these characteristics made KNN-based crystals attractive for applications. The third lead-free group presented in Fig. 1 is BCZT-based crystals. However, the research on these materials is relatively scarce, which is mostly related to the difficulties in growth [Reference Acosta, Novak, Rojas, Patel, Vaish, Koruza, Rossetti and Rödel18, Reference Zeng, Zheng, Tu, Lu and Shi27], e.g., due to the volatility of TiO2 leading to high dielectric losses.
The aim of this paper is to review the extensive research on KNN-based piezoelectric single crystals, with a particular focus on the past 20 years. Besides reporting the main achievements in the field, our intention is also to encourage new researches to enter the field and help to achieve further progress and address the numerous open issues. With this in mind, we have included in the paper examples and practical guidelines for the growth process and recommendations for additional post-processing treatments to reduce the defects and optimize the domain structure. The paper starts by introducing the perovskite KNN in the section “KxNa1−xNbO3 system”. This is followed by describing the various crystal growth techniques and their use for preparing KNN-based single crystals (section “Crystal growth techniques”). In section “Defects and property optimization,” we report typical defects appearing in these materials, discuss their origins, and give recommendations for their reduction/control. The ferroelectric domain structures of KNN-based crystals are described in section “Ferroelectric domains”, while section “Electromechanical properties” gives an extensive summary of the reported piezoelectric properties and highlights the main achievements. Section “Applications” lists examples of applications developed based on KNN single crystals, and, finally, a short outlook on the future is presented.
KxNa1–xNbO3 system
The KxNa1−xNbO3 (KNN) system is a solid solution between the ferroelectric KNbO3 and antiferroelectric NaNbO3 and was first reported in the 1950s [Reference Shirane, Newnham and Pepinsky12]. Piezoelectric properties [Reference Egerton and Dillon28, Reference Dungan and Golding29], processing techniques [Reference Jaeger and Egerton30], and the crystallographic structure [Reference Tennery and Hang31] were addressed in the 1960s. In the era when the toxicity of lead was not a major concern, the inferior electromechanical properties of KNN and sensitive processing [Reference Dungan and Golding29] shifted the focus toward Pb(Zr,Ti)O3 (PZT) [Reference Jaffe, Cook and Jaffe32], which was discovered in 1952 and soon became the most widely used piezoelectric material. It was not until 2004, when Saito et al. reported comparable piezoelectric properties in textured KNN-based solid solution [Reference Saito, Takao, Tani, Nonoyama, Takatori, Homma, Nagaya and Nakamura13] and triggered enthusiastic research into KNN-based piezoelectrics as a potential lead-free alternative [Reference Wu, Xiao and Zhu14, Reference Li, Wang, Zhu, Cheng and Yao33, Reference Malič, Koruza, Hreščak, Bernard, Wang, Fisher and Benčan34].
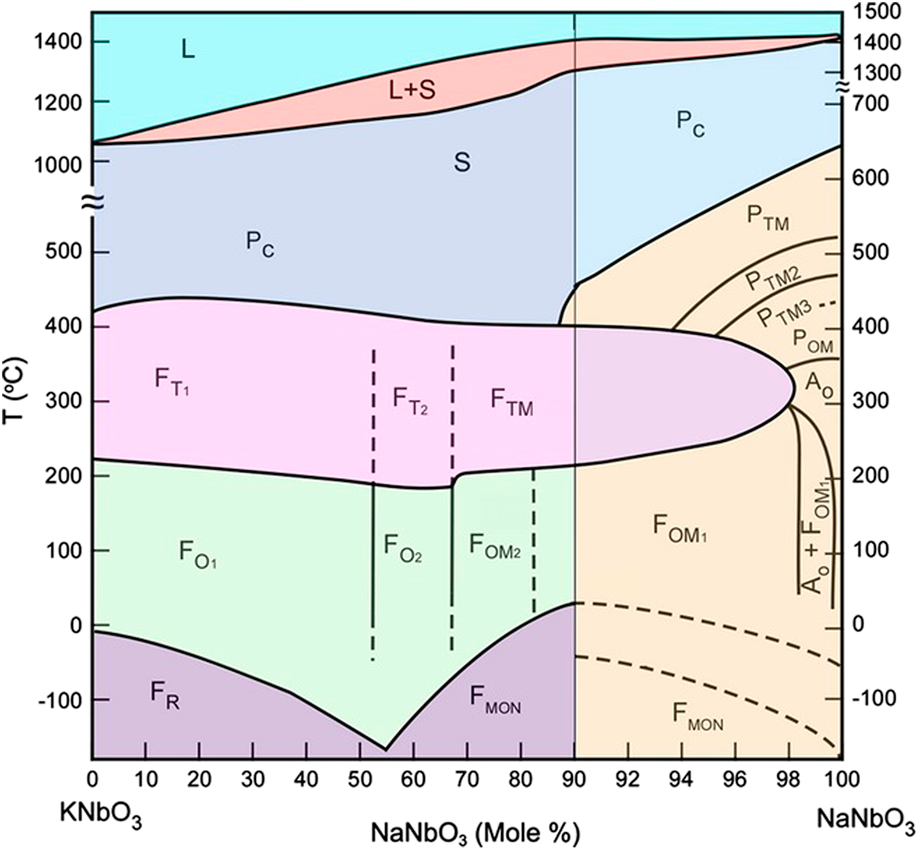
The phase diagram of the KNN system is shown in Fig. 2 [Reference Jaffe, Cook and Jaffe32]. The end members NaNbO3 and KNbO3 form a solid solution across the whole compositional range. Over the major part of the diagram, KNN is isostructural to KNbO3 and on heating undergoes the following phase transition sequence (for K0.5Na0.5NbO3): rhombohedral (R3c) to orthorhombic (Amm2) at T R–O = −160 °C, orthorhombic to tetragonal (P4mm) at T O–T = 200 °C, and tetragonal to cubic  $\left( {Pm\bar 3m} \right)$ at T C = 410 °C. These transitions are of the polymorphic phase boundary type. With further heating, the solidus temperature is reached at 1140 °C and liquidus temperature at 1420 °C. Although the room temperature structure is for convenience typically described as orthorhombic, the perovskite-type primitive cell of KNN is actually monoclinic (Pm) with β ≈ 90.3° [Reference Tennery and Hang31, Reference Tellier, Malič, Dkhil, Jenko, Cilenšek and Kosec35]. The monoclinic cell parameters can be easily transformed into the orthorhombic ones by:
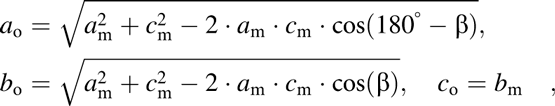 $$a_{\rm{o}} = \sqrt {a_{\rm{m}}^2 + c_{\rm{m}}^2 - 2 \cdot a_{\rm{m}} \cdot c_{\rm{m}} \cdot \cos \left( {180^\circ - \beta } \right)} ,\quad b_{\rm{o}} = \sqrt {a_{\rm{m}}^2 + c_{\rm{m}}^2 - 2 \cdot a_{\rm{m}} \cdot c_{\rm{m}} \cdot \cos \left( \beta \right)} ,\quad c_{\rm{o}} = b_{\rm{m}} \quad ,$$
where the subscripts “o” and “m” mark the orthorhombic and monoclinic parameters, respectively. The orthorhombic structure description will be used throughout this paper. Note that the monoclinic phase in KNN does not have the same role as in PZT, where the bridging monoclinic phase was suggested to be responsible for high piezoelectric properties of compositions in the vicinity of the morphotropic phase boundary (MPB) [Reference Noheda, Cox, Shirane, Guo, Jones and Cross36].
Phase diagram of the KNN system [Reference Jaffe, Cook and Jaffe32, Reference Li, Wang, Zhu, Cheng and Yao33]. Symbols and subscripts: L, liquid; S, solid; P, paraelectric; C, cubic, T, tetragonal; O, orthorhombic; MON, monoclinic; TM, pseudotetragonal; and R, rhombohedral (reprinted with permission from Wiley).
The phase transition temperatures in KNN can be shifted by the substitution of the perovskite A-site and B-site cations, which is desired to engineer the functional properties [Reference Wang, Malič and Wu37]. Widely investigated modifiers in the 2000s were lithium, tantalum, niobium, and the toxic antimony. All these elements decrease the T O–T and were also the constituents of the breakthrough composition from Toyota in 2004 [Reference Saito, Takao, Tani, Nonoyama, Takatori, Homma, Nagaya and Nakamura13]. Lithium is one of the rare elements that additionally increases the T C, which is beneficial for increasing the operational temperature range [Reference Guo, Kakimoto and Ohsato38, Reference Hollenstein, Davis, Damjanovic and Setter39]. While the strategy for improving the functional properties of KNN in the 2000s was mostly to decrease the T O–T to room temperature [Reference Shrout and Zhang8, Reference Rödel, Jo, Seifert, Anton, Granzow and Damjanovic9], in the 2010s the research focused on the T R–T boundary formation [Reference Wang, Wang, Yao, Li, Schader, Webber, Jo and Rödel40, Reference Zhang, Wang, Zhou, Zhou, Chu, Lv, Wu and Li41, Reference Lv, Wu, Xiao, Zhu and Zhang42]. Hereafter, the low-temperature rhombohedral phase is stabilized at room temperature and a temperature-insensitive phase boundary is formed, which is reported to considerably improve the temperature stability of functional properties. For the details on KNN ceramics, the reader is referred to the thorough reviews in Refs. Reference Wu, Xiao and Zhu14, Reference Li, Wang, Zhu, Cheng and Yao33, Reference Malič, Koruza, Hreščak, Bernard, Wang, Fisher and Benčan34, and Reference Wang, Malič and Wu37.
It should be noted that the environmental friendliness of KNN-based polycrystalline ceramics was recently questioned by the results of a detailed life cycle assessment, revealing that the energy consumption for production of KNN ceramics is much higher than that of PZT [Reference Ibn-Mohammed, Koh, Reaney, Acquaye, Wang, Taylor and Genovese43]. About 60% of this energy consumption was assigned to raw materials, almost exclusively (99.53%) to Nb2O5 production. This ratio is very different for the production of single crystalline KNN because crystal growth by itself is a highly energy-consuming process (for any material). The relative energy consumption for the growth process is therefore much higher than that for the raw material production, which makes the cost for the latter almost negligible. This makes the KNN single crystals, along with the other merits (e.g., nontoxicity, high transitions temperatures, and low density), interesting material for future applications.
Crystal growth techniques
The growth of a single crystal can generally be described as the process where a solid nucleus becomes larger as more atoms, molecules, or ions are added on it by epitaxy from gaseous, liquidus, or solid phase. Note that the latter two are, by far, the most common techniques in piezoelectrics. Various different crystal growth methods were developed and the choice depends on the material's melting temperature, type of melting (congruently/incongruently), and thermokinetics (viscosity, surface tension, vapor pressure, thermal conductivity, latent and specific heats) [Reference Elwell and Scheel44]. Congruent melting materials (i.e., materials with coinciding liquidus and solidus surfaces in the phase diagrams) are typically grown directly from the melt, whereby the composition of the as-grown crystal boule is the same as the composition of the melt and relatively high pulling rates (several mm/h) can be achieved. Typical representative is the Czochralski growth method, whereby a rod-mounted seed is dipped into the melt and subsequently slowly pulled up while rotating. This method is successfully used to produce large crystals of Si, Ge, or some simple perovskites. However, it is not suitable for preparing complex compositions of most ferroelectric solid solutions, which typically exhibit incongruent melting, first-order solid–solid phase transitions, and volatile components (if open crucibles are used).
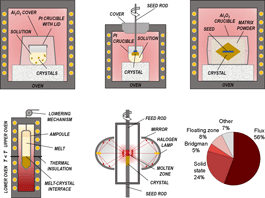
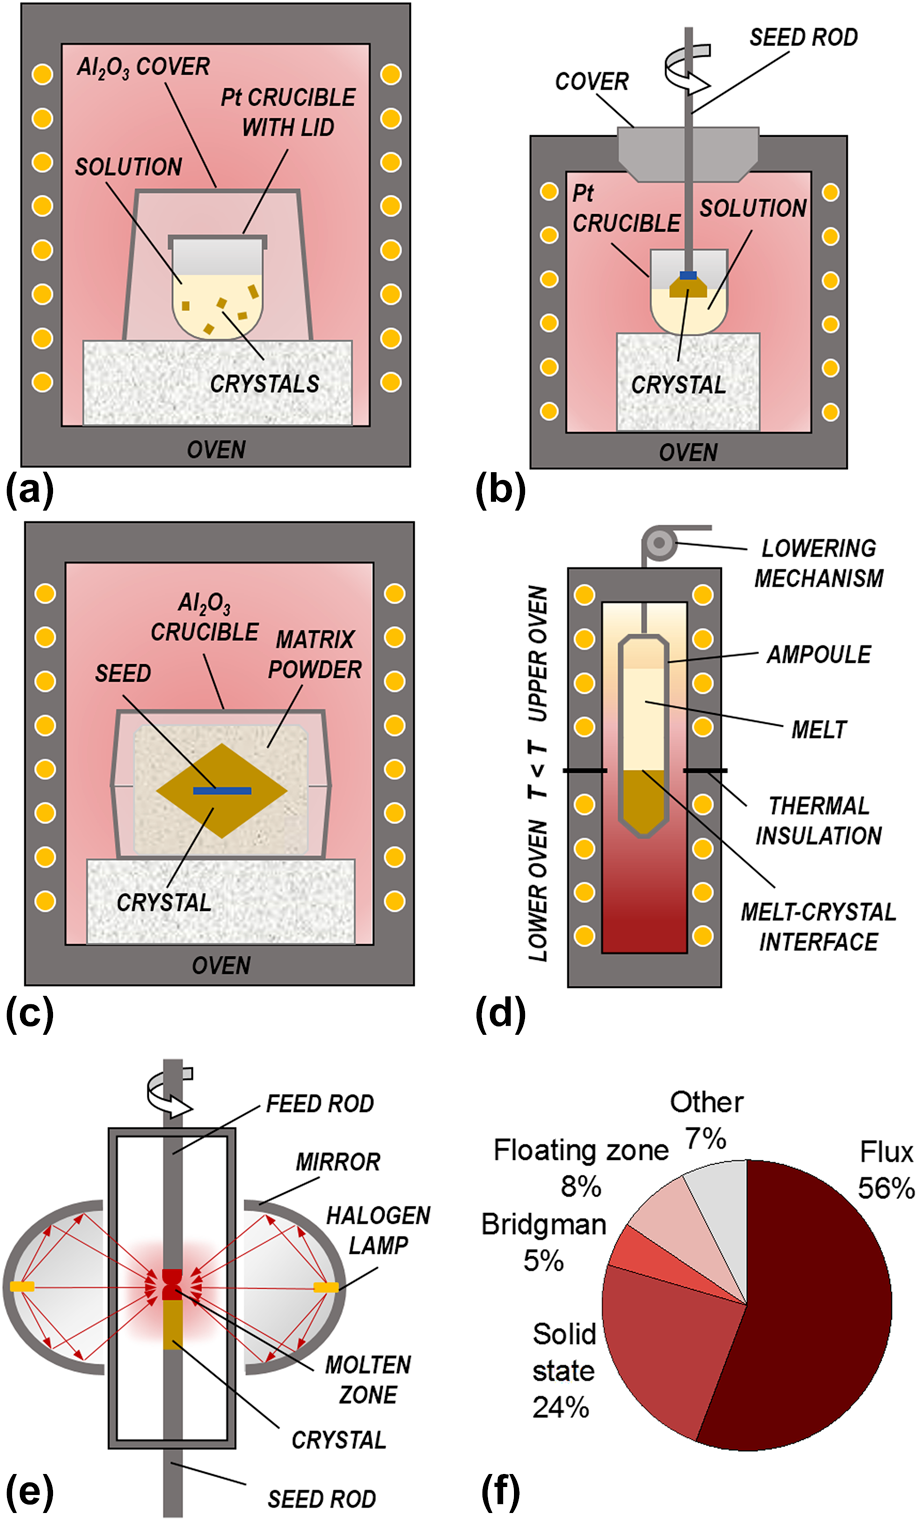
A schematic representation of the different growth methods used for KNN-based crystals is given in Fig. 3, while Fig. 4 shows selected examples of obtained crystals. Many ferroelectric perovskite crystals are grown by flux methods from high-temperature solutions at their saturation temperature just below the liquidus surface [Figs. 3(a) and 3(b)]. These methods were also used in the early days of KNN crystal research [Reference Shirane, Newnham and Pepinsky12, Reference Cross23]. The flux methods enable to lower the temperature of the crystallization process, which occurs in a temperature range where the phase is thermodynamically stable. The drawbacks are the difficulty to grow very large crystals (if no seed is used) and the possible incorporation of flux inclusions into the crystals. Several KNN single crystals were also prepared by the solid-state crystal growth [Fig. 3(c)], which utilizes temperatures below the solidus surface of the phase diagram. On the other hand, the use of other methods, such as the Bridgman–Stockbarger method [Fig. 3(d)] or the floating zone method [Fig. 3(e)], is relatively scarce. The percentages of literature reports for KNN-based crystals grown by each method are presented in Fig. 3(f) (chart was created using the same database as in Fig. 1). Details about the growth methods are described in the following sections, while their main advantages and disadvantages are summarized in Table I.
Schematic representation of growth methods for KNN-based single crystals: (a) seed-less solution (flux) growth, (b) TSSG, (c) SSCG (with seed), (d) Bridgman–Stockbarger method, and (e) floating zone method (with mirror furnace). (f) Percentages of publications on KNN-based crystals for individual growth method.
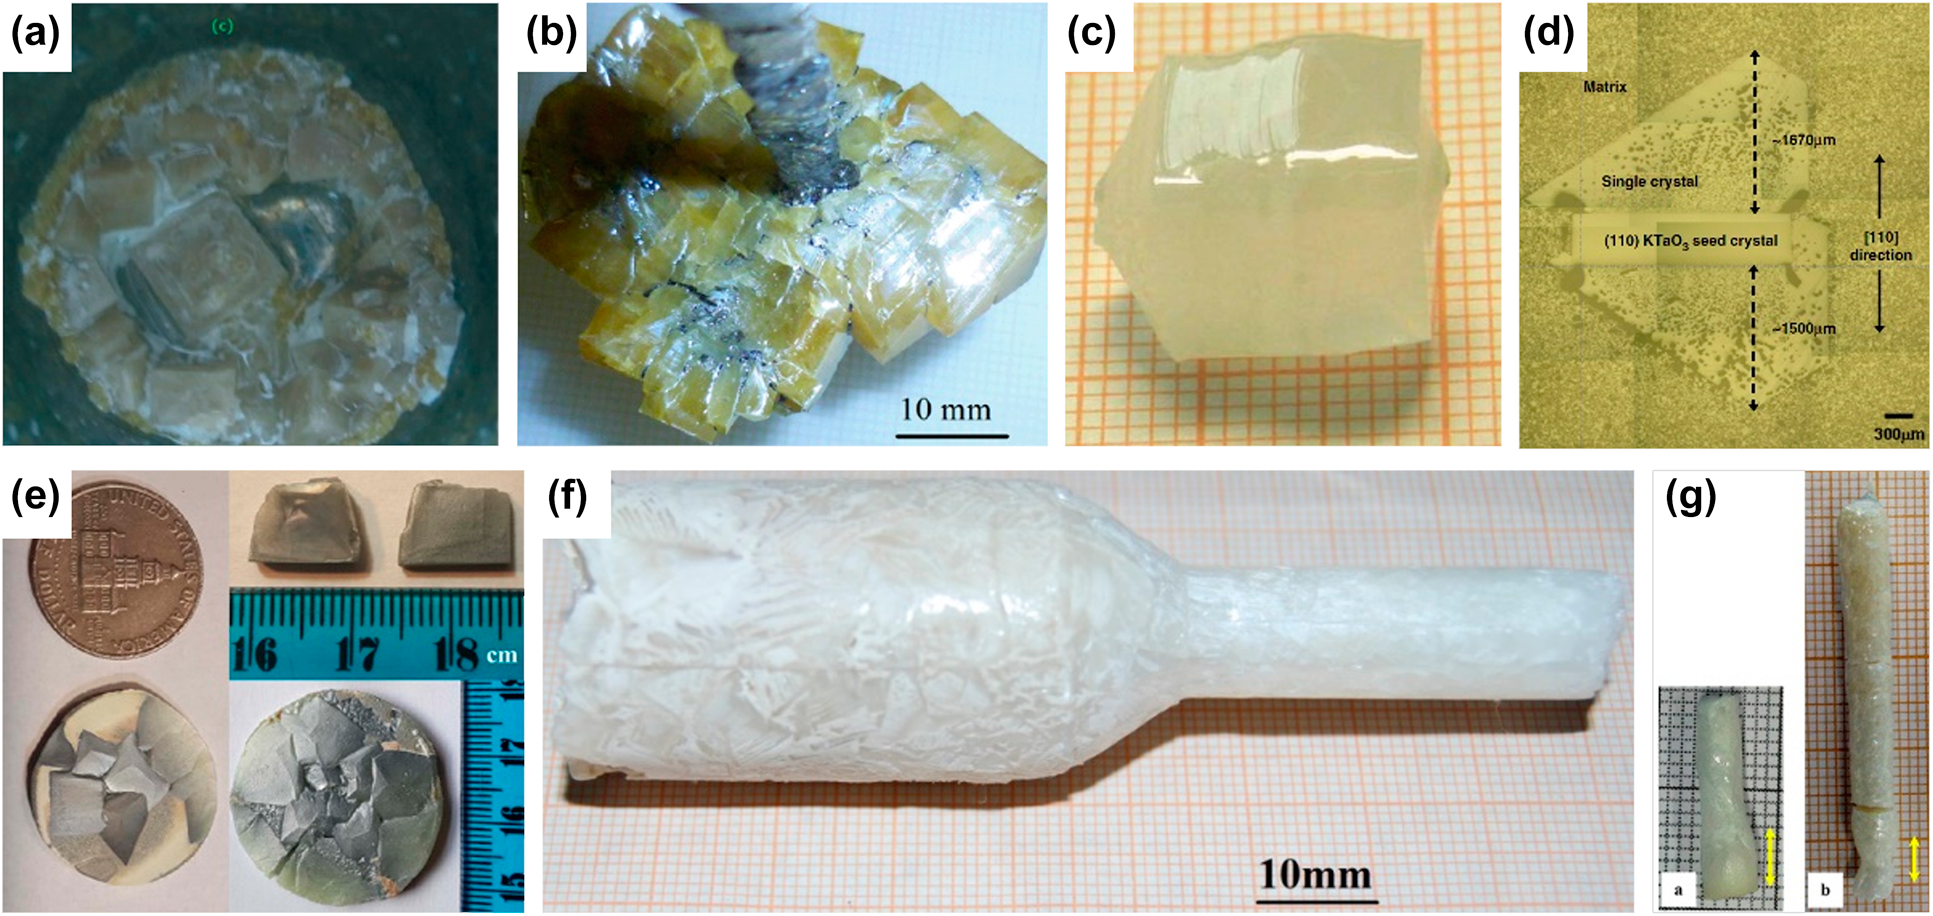
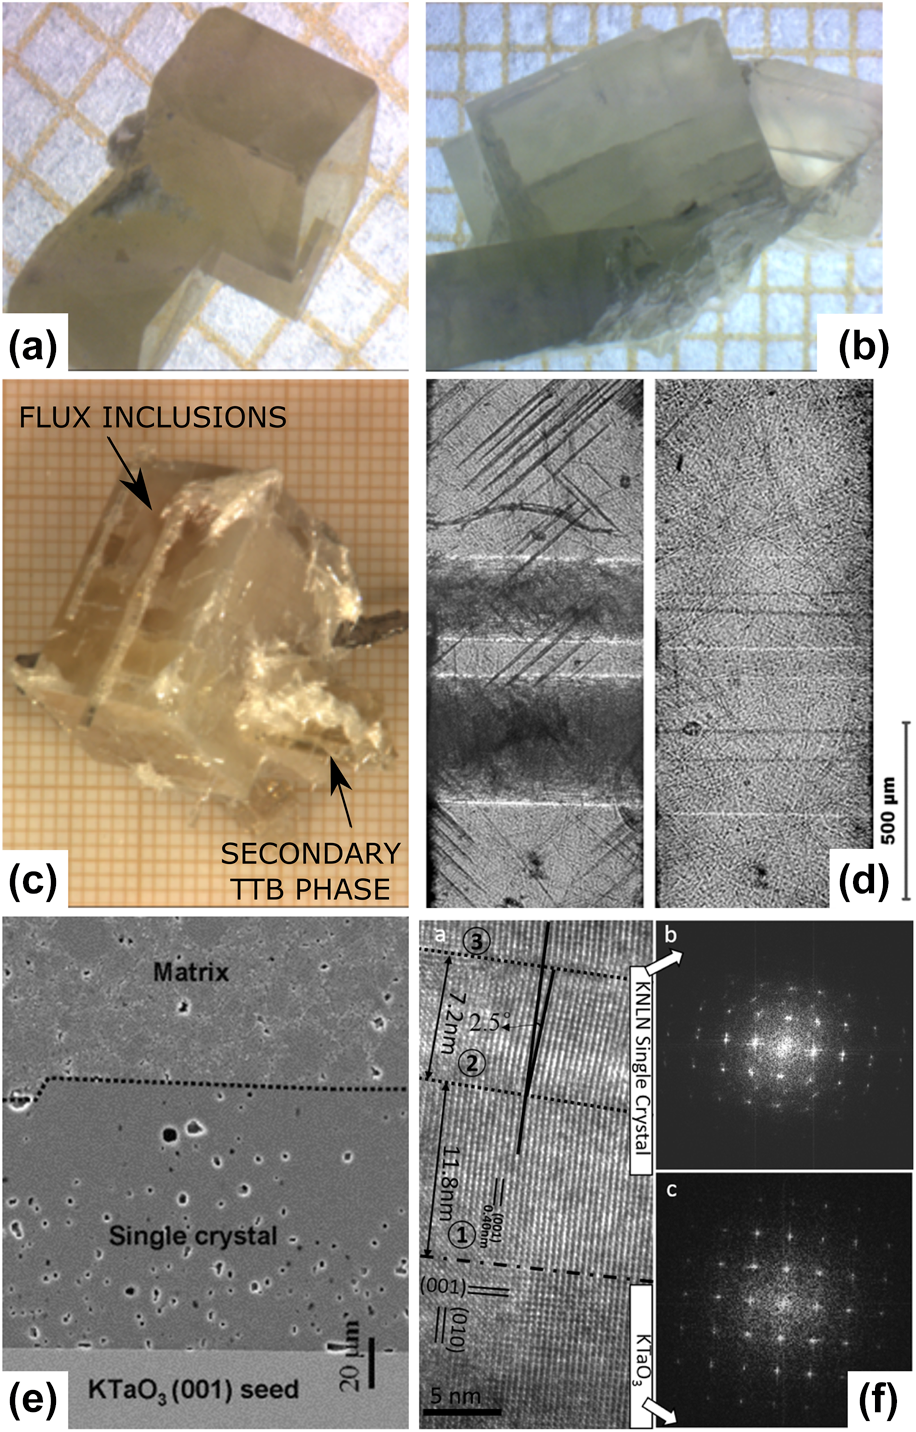
Examples of KNN-based single crystals, grown by different methods: (a) seed-less self-flux method [Reference Ray, Sinha, Bhandari, Singh, Bdikin and Kumar45], (b) self-flux growth using Pt spatula as nucleation site [Reference Liu, Koruza, Veber, Rytz, Maglione and Rödel46], (c) TSSG [Reference Zheng, Huo, Wang, Wang, Jiang and Cao47, Reference Zheng, Wang, Huo, Wang, Sang, Li, Zheng and Cao48], (d) solid-state crystal growth with KTaO3 seed [Reference Fisher, Bencan, Kosec, Vernay and Rytz49], (e) seed-free solid-state crystal growth [Reference Jiang, Randall, Guo, Rao, Tu, Gu, Cheng, Liu, Zhang and Li50], (f) modified Bridgman method [Reference Lin, Li, Li, Cai, Liu and Zhang51], and (g) floating zone method [Reference Bah, Giovannelli, Retoux, Bustillo, Le Clezio and Monot-Laffez52]. Note the different scales on the pictures.
Comparison of the main advantages and disadvantages of the different methods for the growth of KNN-based single crystals.
Flux method
The high-temperature solution growth (flux method) is the most widely used method for growing KNN-based single crystals [Fig. 3(f)]. This method is therefore described in detail in sections “The tricky choice of a suitable flux,” “Elemental segregation,” and “Different solution growth techniques”, while sections “Growth of KNN-based single crystals with heterogeneous flux” and “Growth of KNN-based single crystals with a self-flux” report the use of this method for KNN.
The flux method is a technique of growing crystals from a solution at its saturation temperature [Reference Elwell and Scheel44]. The solution consists of dissolved substances of the desired material in a solvent, also called the flux. The method is particularly suitable for materials with specific thermodynamic properties, such as KNN-based solid solutions, and is thus often used as an alternative to the conventional growth processes from the melt, such as Bridgman–Stockbarger and Czochralski. Main advantage of using a solvent is the reduction of the crystallization temperature of the solute to be grown, which is essential for materials that cannot be grown from the melt without major drawbacks, e.g.:
(i) Materials featuring incongruent melting, i.e., decomposition before their melting point. Here, growth from the liquid phase leads to crystals with a different stoichiometry from initial liquid composition (or other phase), as is usually encountered for KNN-based single crystals.
(ii) Materials that undergo solid–solid phase transitions, generally of the first order. This can lead to crystals with twins or cracks due to excessive deformation during phase transition. Also stabilization of an undesired phase can occur.
(iii) Materials having a very high vapor pressure or containing highly volatile elements, such as Li in KNN-based materials. This leads to nonstoichiometric crystal composition and/or secondary phase formation, such as the tetragonal tungsten bronze (TTB) structured phases in KNN (see section “Growth defects”).
(iv) Highly refractory compounds with very high melting points, such as CaTiO3 or BaZrO3 [Reference Xin, Veber, Guennou, Toulouse, Valle, Hatnean, Balakrishnan, Haumont, Saint Martin, Velazquez, Maillard, Rytz, Josse, Maglione and Kreisel53]. In this case, crystal growth requires complex and expensive techniques that may induce many defects, e.g., oxygen deficiencies or internal strains, and thus, post-growth annealing treatments are often needed.
Another advantage of high-temperature solution growth is that the crystal is not exposed to the temperature gradients and thermal fluctuations present in the furnace. The crystal can grow freely, without mechanical or thermal stresses, which allows the development of natural growth facets. In general, crystals obtained by this technique have an excellent crystalline quality and a low dislocation density, as compared to melt growth techniques. Among the drawbacks are the possibility for the incorporation of solvent ions into the crystal, macroscopic flux inclusions, impurities from the crucible, and composition gradients due to segregation phenomena. In addition, this method has a much slower pulling rate (few tenths of mm/h) than the Bridgman–Stockbarger or Czochralski techniques.
The tricky choice of a suitable flux
The main difficulty of high-temperature solution growth lies in the choice of a suitable solvent, which must satisfy the maximum possible number of the following conditions [Reference Elwell and Scheel44]:
(i) Good solubility of the solute in the solvent
(ii) The phase to be crystallized must be the only stable phase
(iii) Significant change in solubility as a function of temperature
(iv) Low viscosity, in the range between 1 and 10 Pa·s
(v) Low melting point
(vi) Low volatility at the highest temperature of the growth process
(vii) Low reactivity with the crucible
(viii) Absence of foreign elements that could be incorporated into the crystal
(ix) Availability of low-cost raw materials
(x) Density comparable to the solute
(xi) Easy separation of the crystal from the solvent by chemical or physical means
(xii) Low tendency of the solvent to climb out from the crucible by capillary action
(xiii) Low toxicity
Good solubility of the solute in the solvent, which is one of the first criteria, can be achieved by ensuring large similarity between the chemistry and crystallochemistry of the solute and the solvent. However, this also promotes the formation of solid solutions between the solute and the solvent or the incorporation of solvent ions into the crystals. From the experimental point of view, it is thus best to find a solvent that has the same type of chemical bonds as the solute but does not crystallize in the same temperature range with the same crystallographic structure. A rough estimation can be made by comparing the differences in radii of the ions of both phases—if the differences are large enough and not compensated by other ions of the solvent or impurities, a low content of solvent inclusions in the crystallized solute could be expected.
In general, the use of a self-flux, i.e., a solvent for which all the ions are the same as those of the solute to be grown, is preferred. This is widely encountered for KNN-based single crystals grown from high-temperature solution (example of solvent: K2O) [Reference Prakasam, Veber, Viraphong, Etienne, Lahaye, Pechev, Lebraud, Shimamura and Maglione54, Reference Veber, Benabdallah, Liu, Buse, Josse and Maglione55]. On the other hand, heterogeneous flux, i.e., a solvent for which a part of the ions is different from those of the solute to be grown, can also be used. For instance, a suitable heterogeneous solvent for KNN-based solid solutions is NaBO2 [Reference Sadel, Von der Mühll, Ravez, Chaminade and Hagenmuller56, Reference Raevskii, Reznichenko, Ivliev, Smotrakov, Eremkin, Malitskaya, Shilkina, Shevtsova and Borodin57].
Elemental segregation
The difference between the elemental concentration in the initial liquid solution and that in the final crystal is described with the partition coefficient (k) of the elements, also referred to as the segregation coefficient. A partition coefficient k > 1 means that this element is preferentially incorporated into the crystal, while elements with k < 1 are rejected by the crystal. As a general note, high chemical homogeneity can be achieved in compositions with low number of different cations, which display partition coefficients close to 1. Several attempts to grow KNN perovskite–type crystals in quasi-ternary or quasi-quaternary systems have been performed with a self-flux, which enabled the determination of approximate trends for the partition coefficients. The partition coefficients calculated from the phase diagrams reported by Reisman et al. [Reference Reisman, Triebwasser and Holtzberg58, Reference Reisman and Banks59] are shown in Fig. 5. These can be considered as a first approximation for designing the composition of the starting materials. Interestingly, similar B-site partition coefficients as for alkali niobate perovskites were also reported for several niobates with the TTB structure [Reference Chani, Nagata, Kawaguchi, Imaeda and Fukuda60].
Effective partition (segregation) coefficients for selected elements, as a function of their molar contents in the initial liquid solution. The values were calculated using the phase diagrams from Reisman et al. [Reference Reisman, Triebwasser and Holtzberg58, Reference Reisman and Banks59].

In the following, we describe the practical use of Fig. 5 for selecting a starting composition to obtain the desired final composition of the crystal. This is done on the example of potassium, for which the effective partition coefficient is:
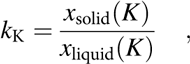 $$k_{\rm{K}} = {{x_{{\rm{solid}}} \left( K \right)} \over {x_{{\rm{liquid}}} \left( K \right)}}\quad ,$$
where x solid(K) and x liquid(K) are the molar fractions of potassium in the solid and liquid phases, respectively. The k K is plotted as a function of the x liquid(K) in the initial liquid solution in Fig. 5, where we read that the calculated k K is about 0.6 for x liquid(K) = 0.8 (80%). The potassium content in the crystal at the early beginning of the growth from this solution will thus be:
 $$x_{{\rm{solid}}} \left( K \right) = x_{{\rm{liquid}}} \left( K \right) \cdot k_K = 0.6 \cdot 0.8 = 0.48\quad ,$$
resulting in a crystal with the composition K0.48Na0.52NbO3. However, please note that a change in the potassium concentration in the solution during the growth will occur, which will modify the k K and thus also the crystal composition throughout its entire volume. The above example is in good agreement with the report by Zheng et al. [Reference Zheng, Wang, Liu, Yang, Lu, Li, Huo, Lu, Yang and Cao61], who started with a potassium concentration of x liquid(K) = 0.8 and grew a final crystal with the composition K0.45Na0.55NbO3 (x solid(K) = 0.45), resulting in a partition coefficient of k K = 0.56.
Partition coefficients of a specific element can substantially vary between different growth scenarios, depending on the number of ion species on A or B crystallographic sites in ABO3 perovskite and depending on whether a self-flux is used or not [Reference Prakasam, Veber, Viraphong, Etienne, Lahaye, Pechev, Lebraud, Shimamura and Maglione54]. Especially sensitive is the segregation of Li; therefore, reliable partition coefficients for this element are difficult to obtain. Values reported for Li concentrations <10% are typically between 0.1 and 0.4 [Reference Hofmeister, Yariv and Agranat62, Reference Liu, Veber, Koruza, Rytz, Josse, Rödel and Maglione63]. Moreover, the segregation of Li strongly depends on the temperature and time of growth and therefore on the rate of volatilization of the solution, which makes crystal stoichiometry difficult to control [Reference Prakasam, Veber, Viraphong, Etienne, Lahaye, Pechev, Lebraud, Shimamura and Maglione54, Reference Veber, Benabdallah, Liu, Buse, Josse and Maglione55]. This was discussed in more detail by Sadel et al., who reported substantial Li volatilization above 1197 °C when growing Li0.02Na0.98NbO3 [Reference Sadel, Von der Mühll, Ravez, Chaminade and Hagenmuller56]. Note that this is the typical temperature range for the growth of KNN-based crystals. The Li volatilization loss in (K,Na,Li)(Nb,Ta)O3 was recently reported [Reference Liu, Veber, Koruza, Rytz, Josse, Rödel and Maglione63]. The molar amount of Li incorporated into the KNN perovskite matrix is substantially lower than what is thermodynamically expected. The calculated partition coefficient of Li is 0.25, whereas the real effective partition coefficient of Li has been estimated to be between 0.11 and 0.18. This difference was related to strong volatilization. The choice of the excess of initial oxides (or carbonates) constituting the solution and the self-flux for KNN-based crystal growth will thus depend on both the segregation and the experimental estimation of the volatilization during the growth.
Finally, it is noted that elemental segregation has to be considered in three dimensions. To obtain as homogeneous samples as possible, the as-grown boule should be cut along the steadiest chemical directions to achieve the lowest elemental variation in the longest lengths of the samples.
Different solution growth techniques
The thermal configurations of the flux technique are equivalent to those of the Czochralski technique, but the thermal gradients are usually lower than 1 °C/cm. There are several types of flux growth. The basic “seed-less” growth does not require preferential external nucleation sites [Fig. 3(a)]. By slowly decreasing the temperature below the saturation temperature, the growth of multiple single crystals occurs by spontaneous nucleation and growth throughout the solution [Fig. 4(a)], in particular at the crucible wall where heterogeneous nucleation is promoted.
Another type is the submerged seed solution growth (SSSG), which consists of immersing a single crystal seed or another nucleation site in the solution held at the saturation temperature. The seed is rotated and the temperature is slowly and continuously lowered, promoting epitaxial growth of the solute on the seed. This technique requires a very accurate temperature control and good knowledge of the solution's saturation temperature to avoid the growth of parasitic crystals or the dissolution of the seed.
The top-seeded solution growth (TSSG) has many similarities with the SSSG and the Czochralski method. In this method, the oriented single crystal seed is brought into contact with the surface of the liquid solution [Fig. 3(b)]. The pulling of the seed from the solution is carried out with a slowly decreasing thermal ramp to grow the crystal along a desired crystallographic direction.
Growth of KNN-based single crystals with heterogeneous flux
Attempts to grow KNN crystals using heterogeneous fluxes often resulted in crystals with varying colors, small sizes, and low quality, which was detrimental for further applications in piezoelectric devices. Note that in the early days, many of them were grown for structural investigations. The heterogeneous fluxes were Na-based and contained foreign species (F−, BO2−). We note that low-melting K salts (KF or KCl) could also have been used as a flux, as it was performed with the Remeika method for BaTiO3, NaNbO3, and KNbO3 growth [Reference Matthias and Remeika64]. This was later demonstrated by Liu et al. using KCl–K2CO3 flux with eutectic composition to grow a Li-modified KNN crystal [Reference Liu, Xu, Liu, Yang and Chen65] and by Inagaki et al. using NaF–KF flux at eutectic composition for growing KNN and Mn-doped KNN crystals [Reference Inagaki, Kakimoto and Ohsato66]. However, when standard open crucibles are used, the high volatilization rate of the solvent makes such growth thermally unstable and potentially hazardous and may induce a dark blue color in the as-grown crystals, presumably due to niobium reduction or oxygen vacancies (see the “Point defects” section).
Shirane et al. grew first KNN single crystals from solution containing 30 wt.% NaF flux and a mixture of equal parts of NaNbO3 and KNbO3 [Reference Shirane, Newnham and Pepinsky12]. Solution was heated to 1500 °C and cooled down to 900 °C in 7 h. Well-shaped yellow or brown millimeter-sized plates were obtained with approximately 90 mol.% Na, since additional Na was introduced by the flux. Ahtee and Glazer grew KNN crystals with varying Na/K ratio using NaF as a flux at 1300 °C for 3 h, followed by slowly cooling to room temperature over a period of 24 h [Reference Ahtee and Glazer67]. The crystals were untwinned with batch composition variations of several tens of mol.% (e.g., Na from 95 mol.% to 75 mol.%). Badurski and Stróż grew KNN from NaF flux with Nb2O5/NaF molar ratio ranging between 0.1 and 0.4 [Reference Badurski and Stróż68]. The temperature range was varied from 1250 °C to 1000 °C, with cooling rate from 1.4 to 4.2 °C/h. Various crystals were obtained with Na molar content ranging between 0.972 mol.% and 0.825 mol.%. With increasing K content, crystals' color changed from transparent yellow-brown to less transparent greyish green. Raevskii et al. grew crystals containing up to 40 mol.% KNbO3 using a NaBO2 flux and a cooling rate of 6–7 °C/h from 1060 °C to 870 °C [Reference Raevskii, Reznichenko, Ivliev, Smotrakov, Eremkin, Malitskaya, Shilkina, Shevtsova and Borodin57]. Unlike crystals obtained from NaF flux, the as-grown crystals were colorless transparent plates of about 50–200 µm in thickness and several mm2 in area. Note that NaBO2 flux was also successfully used for the growth of (Li,Na)NbO3 crystals [Reference Sadel, Von der Mühll, Ravez, Chaminade and Hagenmuller56]. While the heterogeneous flux method was often applied during the early research of KNN crystals, the number of publications on this method seems to decline over the past 10 years. This is presumably related to the success of the self-flux methods, which are easier to design and produce larger crystals.
Growth of KNN-based single crystals with a self-flux
First research into the growth of KNN crystals by self-flux started in the 1950s by Cross [Reference Cross23]. Besides, growths of other alkali niobates, e.g., KNbxTa1–xO3 (KNT) as storage medium for holographic memories [Reference Wilcox and Fullmer69], were performed in the late 1950s and 1960s. This growth research considerably improved the knowledge of the alkali niobate high-temperature phase diagrams, so that, since the 2000s, when the research on lead-free piezoelectrics regained interest, intensive self-flux growth has been performed by SSSG and TSSG methods (see references in Table II).
Summary of the main functional properties of the reported KNN-based piezoelectric crystals, along with their composition, growth method, and crystal size. Note that the crystals are ordered based on their chemical composition from pure KNN to more complex systems with several modifiers and/or dopants.
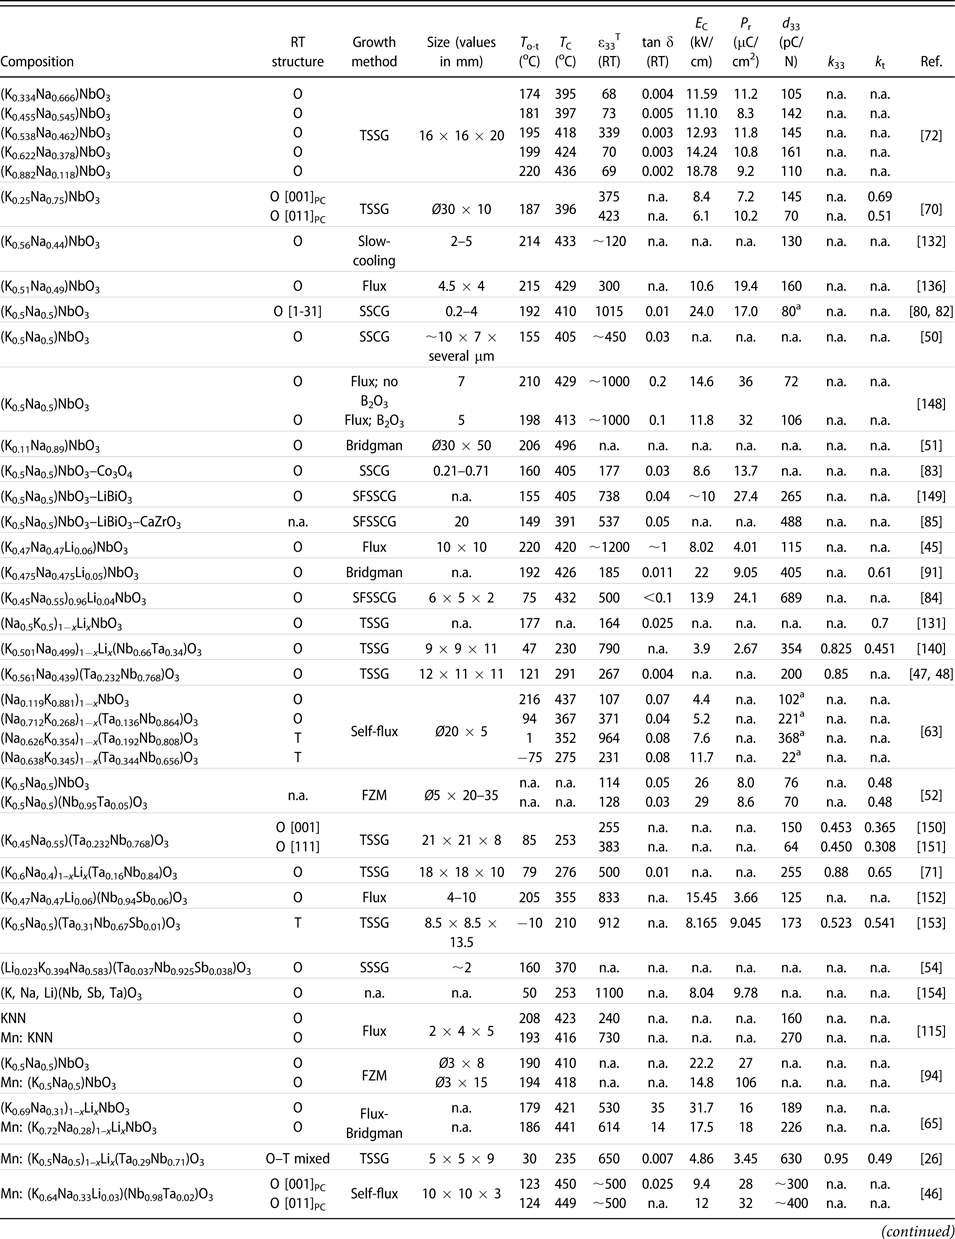
a Unit of this d 33 value is pm/V; n.a.: information not reported.
Growth with a self-flux can be performed by spontaneous nucleation either on platinum (crucible, spatula) or on an oriented single crystal seed with a composition similar to the solute to be grown. The seed should exhibit a melting or decomposition temperature above the saturation temperature of the KNN-based solution. A very suitable seed material is KTaO3, since it exhibits the cubic perovskite structure with lattice parameters close to those of KNN, enabling an efficient epitaxy. Moreover, it has a high decomposition temperature, no phase transition from 0 K until its decomposition point, and features the same ions as those of the solute to be grown. Owing to the partition coefficients lower than 1 for Li, K, and Nb in KNN-based solid solutions, the self-flux is chosen with an excess of Li2O (or Li2CO3), K2O (or K2CO3), and Nb2O5 [Reference Liu, Koruza, Veber, Rytz, Maglione and Rödel46, Reference Prakasam, Veber, Viraphong, Etienne, Lahaye, Pechev, Lebraud, Shimamura and Maglione54, Reference Veber, Benabdallah, Liu, Buse, Josse and Maglione55, Reference Hofmeister, Yariv and Agranat62, Reference Liu, Veber, Koruza, Rytz, Josse, Rödel and Maglione63]. Example of a Mn-doped (K,Na,Li)(Nb,Ta)O3 crystal grown using self-flux and a Pt spatula as the nucleation center is shown in Fig. 4(b). In some cases, Na2O with K2O is also reported to be used as self-flux [Reference Deng, Zhao, Zhang, Chen, Li, Lin, Ren, Jiao and Luo70], although the Na partition coefficient is higher than 1 in KNN crystals.
The largest reported KNN-based crystals grown by self-flux are few centimeter-wide [Reference Huo, Zheng, Zhang, Zhang, Liu, Wang, Yang, Cao and Shrout71, Reference Tian, Hu, Meng, Tan, Zhou, Li and Yang72] and exhibit brownish to white colors [Reference Prakasam, Veber, Viraphong, Etienne, Lahaye, Pechev, Lebraud, Shimamura and Maglione54], with clear and cloudy regions induced by the presence of numerous thin domains [Reference Deng, Zhang, Zhao, Chen, Wang, Li, Lin, Ren, Jiao and Luo73, Reference Liu, Veber, Zintler, Molina-Luna, Rytz, Maglione and Koruza74]. Crystals grown by SSSG exhibit natural growth faces predominantly along (001)PC and (110)PC orientations, whereas TSSG-grown crystals feature cylindrical shape with typical four symmetrical growth ridges at the top [Fig. 4(c)]. Saturation temperatures lie usually in the range of 1000–1200 °C, decreasing thermal ramps in the range of 0.1–0.5 °C/h, and pulling rates in the range of 0.1–0.5 mm/h with rotation speeds about 10–20 rpm. Since KNN-based materials are solid solutions, crystals exhibit chemical composition variations due to the segregation of elements.
For achieving the highest possible chemical homogeneity, a compromise has to be found for the setting of the highest growth rate, which allows a minimum defects concentration and is not detrimental to the crystal's performance. On the other hand, increasing the growth speed shortens the growth time and thus reduces the amount of the volatilized alkalis. Volatilization of alkalis was also demonstrated to be reduced by using oxygen atmosphere [Reference Popovič, Bencze, Koruza, Malič and Kosec75], which additionally lowers the oxygen vacancy concentration. Another approach to improve the homogeneity could be to control the growth of certain crystal faces and corners with particular crystallographic directions using engineering of the isotherms in the solution. This was reported for lead-based systems with 〈111〉 corners [Reference Lim and Rajan76]. Similarly in KNN-based crystals the natural 〈001〉 and 〈110〉 faces could be regarded.
Solid-state crystal growth
The solid-state crystal growth (SSCG) is a controlled case of exaggerated grain growth, whereby a single crystalline seed is growing into a polycrystalline powder matrix below the material's melting point [Fig. 3(c)]. Since this approach does not require melting of the whole sample, it is particularly suitable for incongruently melting materials with volatile species. Other benefits are low processing temperatures, use of conventional furnaces, and no need for temperature gradients. The main challenge is the growth of large single crystals due to the porosity and appearance of exaggerated grain growth in the matrix. The method was first applied to ferroelectric compositions by DeVries growing BaTiO3 in 1964 [Reference DeVries77] and was later adopted to other systems. For more details on the SSCG method, please see Refs. Reference Benčan, Tchernychova, Uršič, Kosec, Fisher and Lallart78 and Reference Kang, Park, Ko and Lee79.
KNN-based crystals were first grown by the SSCG method in 2007 by Fisher et al. [Reference Fisher, Bencan, Holc, Kosec, Vernay and Rytz80, Reference Fisher, Bencan, Bernard, Holc, Kosec, Vernay and Rytz81]. The 〈001〉-oriented KTaO3 seed was embedded into calcined KNN powder with the addition of the K4CuNb8O23 liquid phase, compacted, packed in a closed crucible, and heated at 1100 °C for 10 h. The grown single-crystalline layer was up to 0.16 mm thick and exhibited high homogeneity. To reduce the porosity, hot pressing was applied either before or during the growth process. The largest reported size of pure KNN crystal was 4 mm, obtained after 100 h at 1100 °C with 50 MPa [Fig. 4(d)] [Reference Fisher, Bencan, Kosec, Vernay and Rytz49]. The reported dielectric and piezoelectric properties were comparable to the polycrystalline counterparts with the same composition [Reference Ursic, Bencan, Skarabot, Godec and Kosec82]. Recently, a faster crystal growth rate was reported for the 〈110〉 seed orientation [Reference Fujii, Ueno and Wada83].
In 2015, Jiang et al. reported a modification of the above method using the LiBiO3 sintering aid and no seed [Reference Jiang, Randall, Guo, Rao, Tu, Gu, Cheng, Liu, Zhang and Li50]. This “Seed-Free” SSCG method (SFSSCG) resulted in 11 × 9 × 3 mm3 large crystals with low room-temperature dielectric losses (0.03) and a piezoelectric coefficient of about 205 pm/V [Fig. 4(e)]. Following this work, Yang et al. prepared (K0.45Na0.55)0.96Li0.04NbO3 crystals using Li2CO3 and Bi2O3 as sintering aids [Reference Yang, Zhang, Yang, Liu, Li, Liu and Zhang84]. The powders were compacted into 25 mm diameter discs, isostatically pressed, and sintered at 1080 °C for 10 h. The method resulted in crystals up to 6 ×5 × 2 mm3 in size with excellent piezoelectric properties, d 33 = 689 pC/N and d 33* = 967 pm/V. High piezoelectric properties (d 33 = 488 pC/N) and relatively large crystal sizes were also reported for CaZrO3-modified KNN [Reference Song, Hao, Yan, Zhang, Li and Jiang85]. Recently, Jiang et al. used SFSSCG to grow KNN crystals co-doped with Mn, Li, and Bi [Reference Jiang, Zhang, Rao, Li, Randall, Li, Peng, Li, Gu, Liu and Huang25]. The crystals were grown at 1090 °C for 21 h to a final thickness of 0.6–0.8 mm. The small- and large-signal piezoelectric coefficients reached very high values of 1050 pC/N and 2290 pm/V, respectively, while the transition temperatures were T O–T = 153 °C and T C = 403 °C.
Bridgman–Stockbarger method
The Bridgman–Stockbarger technique involves translating the solid–liquid interface of a molten compound via the translation of a growth container (open crucible or sealed ampoule) within a fixed thermal gradient in a multi-zone furnace [Fig. 3(d)] [Reference Monberg and Hurle86]. The crystal growth is driven by supercooling and freezing the melt when passing through the temperature gradient zone. While the original technique of Bridgman used a roughly controlled thermal gradient located at the furnace exit [Reference Bridgman87], the Stockbarger's modification used a thermal diaphragm separating two coupled furnaces with temperatures above and below the melting point for a better control of the gradient at the solid–liquid crystallization interface [Reference Stockbarger88]. This method is typically applied for congruent-melting materials and allows the growth of relatively large crystals, but compositional inhomogeneities are often reported due to extensive segregation [Reference Benayad, Sebald, Lebrun, Guiffard, Pruvost, Guyomar and Beylat89]. The Bridgman–Stockbarger method is commonly used to produce lead-based single crystals [Reference Sun and Cao90].
First attempt to grow KNN-based single crystals by this method was reported by Chen et al. in 2007 [Reference Chen, Xu, Yang, Wang and Li91]. The calcined 0.95(K0.5Na0.5)NbO3–0.05LiNbO3 powder was pressed and sealed into a Pt crucible. After melting at 1330 °C for 10 h, the crucible was pulled down with a rate of 0.4–0.6 mm/h, while the temperature gradient near the liquid–solid interface was 30–50 °C/cm. Several plate-like samples with sizes 4 × 6 × 0.5 mm3 and orthorhombic structure could be obtained from the boule. The small-signal piezoelectric properties (d 33 = 405 pC/N, k t = 0.6) were comparable to ceramics with the same composition; however, the dielectric losses and leakage current were relatively high, which was related to a high concentration of oxygen vacancies. The same method was also used to prepare a Na-rich KNN composition, which also exhibited high losses [Fig. 4(f)] [Reference Lin, Li, Li, Cai, Liu and Zhang51]. In 2014, Liu et al. reported a growth of Li-modified KNN crystals with addition of MnO2 using the Bridgman method and a KCl–K2CO3 flux [Reference Liu, Xu, Liu, Yang and Chen65]. The flux efficiently decreased the melting temperature down to 1200 °C, while the addition of Mn reduced the dielectric losses. The piezoelectric coefficient of 226 pC/N was lower than previous reports, but the crystals exhibited characteristic ferroelectric loops.
Reports for improving the chemical homogeneity of KNN-crystals are relatively scarce; however, Luo et al. have recently demonstrated that improved homogeneity can be achieved in PMN-PT crystals by the use of a modified Bridgman method and a careful optimization of growth parameters [Reference Luo, Xu, Xu, Wang and Yin92].
Floating zone method
The floating zone method (FZM), also referred to as zone leveling method, is generally used for the purification of materials and their crystal growth. The principle consists of locally melting the material, creating two liquid–solid interfaces, and subsequently moving the molten zone, so that the whole material undergoes a fusion/solidification transition [Fig. 3(e)]. The growth can be done horizontally or vertically and is generally initialized using an oriented seed. The melting can be achieved by high frequency induction, concentration of light radiation (image furnace, laser zone fusion), or resistive Joule heating effect. This crucible-free technique can feature high pulling speed and high temperature, which allows the growth of various materials without impurity contamination from the crucible.
To the best of our knowledge, only a few KNN-based crystals have been grown by the floating zone technique with a mirror furnace [Fig. 4(g)] [Reference Bah, Giovannelli, Retoux, Bustillo, Le Clezio and Monot-Laffez52, Reference Inagaki, Kakimoto and Kagomiya93, Reference Inagaki, Kakimoto and Kagomiya94, Reference Kimura, Tanahashi, Zhao, Maiwa, Cheng and Wang95]. Pure KNN and Mn-doped KNN crystal growth, performed by Inagaki et al. at 3 mm/h and 25 rpm, was difficult due the poor viscosity of the liquid and the molten zone instability. The centimeter-long and few millimeter-wide crystalline rods usually exhibit several grains at the beginning and millimeter-sized grains at the end of the growth. The maximum lengths of KNN and Mn-doped KNN crystals were 9.3 mm and 12.5 mm, respectively. However, when substituted by 5 mol.% Ta and 5 mol.% Mn, centimeter-sized crystals were obtained with 3 mm/h pulling speed and rotation of 20 rpm. In this case, k t = 0.48 and d 33 = 65–70 pC/N were measured for both KNN and Ta-doped crystals.
Defects and property optimization
Defects are present in all natural and artificial single crystals. Growth defects are typically larger flaws in the crystal boule that form during the processing stage and mostly cannot be removed afterward. On the other hand, point defects are 0D defects in the crystal lattice, which can be to some extent modified by post-growth processing or by doping the starting composition. The latter two approaches are also often used to tune the functional properties. The prevention/reduction of the defect formation during the growth process is very challenging, and it is likely that high defect concentrations were responsible for the poor dielectric and piezoelectric properties of the KNN-based crystals reported in the early times. Besides preventing the growth of crystals with large sizes, defects are also responsible for increased conductivity of the samples and can interact with the ferroelectric domain configurations, e.g., by influencing domain formation or preventing their movement and thus reducing the overall electromechanical response. However, it should be noted that a controlled introduction of certain defects can also considerably enhance the electric field–induced strain, for example, by promoting reversible domain switching through well-aged point defects in BaTiO3 crystals [Reference Ren96]. The understanding and control of the defects is thus of outmost importance for improving the functional response of KNN single crystals.
Growth defects
The complexity of the crystal growth process makes ideal control of all parameters virtually impossible, which inevitably results in the formation of growth defects in the crystals. The final habit of the crystal will be determined by the planes with the lowest growth velocities, the external thermal conditions, and the related growth rate. For KNN-based materials, as well as for several other perovskites, the lowest surface energy was reported for the {100}C faces [Reference Fisher, Bencan, Holc, Kosec, Vernay and Rytz80]. The type of growth defects is related to the selected growth method. Some typical examples include growth twins (two intergrown crystals sharing a lattice plane), hoppers (terraced structures indicating 2D nucleation layer growth), striations (growth layers that appear due to the local fluctuations of the growth velocity related to the temperature fluctuations and convection of the solution), and stress cracks (due to the volume change at phase transitions or too rapid cooling) [Reference Luo, Li, Xia and Li97].
Unfortunately, detailed studies of the growth defects in KNN-based crystals are relatively scarce. Typical examples of defects during flux growth are growth twins [Fig. 6(a)]. They can be formed in the early growth stages by ions occupying geometrically imperfect positions or due to dislocations on the growth interfaces and due to rapid growth. Twinning due to strain relaxation in connection with structural phase transitions is also common in perovskites. Experimental approaches to prevent twin growth include reduction of thermal fluctuations in the vicinity of the growth interface, and the achievement of a low supersaturation of the solution via suitable slow growth rate (decreasing thermal ramp) with respect to the adequate pulling velocity.
A selection of typically growth defects observed in KNN crystals: (a) growth twins, (b) cracks, (c) flux inclusions and surface secondary phases (TTB), (d) growth line defects inducing regions with different domain structures (left: room temperature, right: 470 °C, i.e., above T C) [Reference Liu, Veber, Zintler, Molina-Luna, Rytz, Maglione and Koruza74], (e) pores in SSCG-grown crystal (reprinted from Ref. Reference Fisher, Bencan, Bernard, Holc, Kosec, Vernay and Rytz81 with permission from Elsevier), and (f) periodic small-angle δ-boundaries in SSCG-grown KNN crystal (reprinted from Ref. Reference Fu, Yang, Yu, Wang, Lu, Yang, Xu and Li101 with permission from Elsevier).
As discussed in section “Elemental segregation,” the segregation phenomena during flux growth are very pronounced. This is particularly problematic for Li-modified KNN crystals. The very low partition coefficient of Li indicates the rejection of these ions by the growing crystal and thus an increase in Li concentration in the liquid solution during the growth process [Reference Hofmeister, Yariv and Agranat62, Reference Liu, Veber, Koruza, Rytz, Josse, Rödel and Maglione63]. A straightforward solution for this issue would be to increase the Li concentration in the starting liquid solution; however, unfortunately, this approach turned out to be detrimental as high Li concentration induces the formation of a TTB structured phase [Reference Scott, Giess, Olson, Burns, Smith and Okane98], for example, with the composition (K,Na)3Li2Nb5O15. The TTB structure can be avoided by keeping the K/Li ratio in the initial liquid above 5–6. The critical Li concentration in the liquid solution is also often achieved toward the end of the growth process and results in the formation of TTB crystals on the crucible walls or on surfaces of the perovskite KNN crystals [Fig. 6(c)]. Note that TTB structure formation was also reported in KNN-based polycrystalline ceramics with high Li concentrations, which was ascribed to the limited solubility of Li in the KNN lattice [Reference Guo, Kakimoto and Ohsato38].
Liu et al. investigated the influence of growth defects on the domain structure of KNN-based crystals grown by the SSSG method [Fig. 6(d)] [Reference Liu, Veber, Zintler, Molina-Luna, Rytz, Maglione and Koruza74]. The exact type of the observed line defects was not determined, but they are likely related to twin boundaries, growth twins, or transformation twins. Note that these line defects remained unchanged when the sample was heated above T C. It was shown that they resulted in the formation of regions with different domain densities/sizes, which changed the optical properties of the crystal (appearance of transparent and cloudy regions). Interestingly, in the orthorhombic room temperature phase, the domain walls of the transparent regions were found along {110}PC planes, while those of the cloudy regions were along {001}PC planes. Such defects are also likely to be detrimental for electromechanical properties, as they may pin the ferroelectric domains walls and thus reduce the response.
The main growth defects during SSCG are pores entrapped inside the crystal [Fig. 6(e)]. These result in a nontransparent crystal appearance and can reduce the electromechanical properties by pinning the ferroelectric domain walls. Entrapped porosity is formed during the growth process due to the high mobility of the single crystal–matrix interface. This phenomenon is well-known from ceramic sintering and typically limits the densification process [Reference Brook99, Reference Koruza, Malič and Kosec100]. The entrapped pores are difficult to be removed due to the long diffusion distances and the high activation energy of lattice diffusion. Porosity can be reduced by reducing the porosity of the polycrystalline matrix or by applying external pressure during the growth process, which increases the driving force for pore shrinkage [Reference Benčan, Tchernychova, Uršič, Kosec, Fisher and Lallart78]. Another feature observed in some SSCG crystals are small-angle δ-boundaries [Fig. 6(f)], which were related to the stress relaxation and were demonstrated to pin the ferroelectric domain walls [Reference Fu, Yang, Yu, Wang, Lu, Yang, Xu and Li101].
Point defects
Point defects are inevitable constituents of all perovskite (and other) materials and strongly influence dielectric and ferroelectric properties [Reference Raymond and Smyth102]. This predominantly occurs by increasing the conductivity and interacting with the ferroelectric/ferroelastic domain walls. Moreover, the rearrangement of charged defects often results in aging of ferroelectric/piezoelectric properties. Point defects are introduced during the high-temperature growth process, by impurities from raw materials or crucibles, and, in some cases, by intentional chemical doping [Reference Maglione, Philippot, Levasseur, Payan, Aymonier and Elissalde103]. Especially in case of oxides, there is a high sensitivity toward changes in the oxygen partial pressure during growth. The introduced defects are usually described by the Kröger–Vink notation, whereby the symbol denotes the defect type; the subscript, the lattice site occupied by this defect; and the superscript, the charge of the defect site [Reference Kröger and Vink104]. Typical examples are negatively charged cation vacancies (predominantly on the perovskite A-site, e.g.,  $V_{{\rm{Na}}}^\prime$), positively charged oxygen vacancies $\left( {V_{\rm{O}}^{{\rm{ \bullet \bullet }}} } \right)$, substitutional ions $\left( {{\rm{Sb}}_{{\rm{Nb}}}^{\prime \prime } } \right)$, free electrons (e′), and free holes (h•). It should be noted that certain defects are also prone to combine into charged defect complexes, which are particularly important for the pinning of ferroelectric domains walls [Reference Carl and Härdtl105]. Typical example is the defect complex between acceptor ion and oxygen vacancy, e.g., $\left( {{\rm{Cu}}_{{\rm{Nb}}}^{\prime \prime \prime } - V_{\rm{O}}^{{\rm{ \bullet \bullet }}} } \right)^\prime$.
The defect chemistry of KNN-based single crystals is rather complex, and many experimental observations remain without proper explanation. The following origins of point defects have been discussed so far. The volatility of alkalis at high temperatures results in the formation of A-site vacancies [Reference Kizaki, Noguchi and Miyayama106, Reference Popovič, Bencze, Koruza and Malič107]. These generate acceptor states in the band gap, and thus, undoped KNN is predicted to exhibit p-type conductivity (conduction due to holes, h•). For the case of the more volatile K [Reference Popovič, Bencze, Koruza and Malič107], the defect formation process can be written as follows:
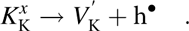 $$K_{\rm{K}}^x \to V_{\rm{K}}^\prime + {\rm{h}}^ \bullet \quad .$$
Note that A-site vacancies can also form as charge-compensating defects on donor doping. Another common species in perovskite ferroelectrics are oxygen vacancies. These can form due to oxygen loss during high temperature processing [intrinsic mechanism, Eq. (5)] or to compensate the charge of the formed A-site vacancies or the acceptor dopants/impurities (extrinsic mechanism) [Reference Chan, Sharma and Smyth108, Reference Nowotny and Rekas109].
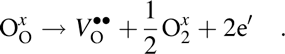 $${\rm{O}}_{\rm{O}}^x \to V_{\rm{O}}^{ \bullet \bullet } + {1 \over 2}{\rm{O}}_2^x + 2{\rm{e'}}\quad {\rm{.}}$$
Compositions containing elements with multi-oxidation states (e.g., manganese, antimony, niobium, iron) can additionally form substitutional defect centers. This is accompanied by the formation of charge-compensating holes and additionally contributes to the increase of oxygen vacancy concentration. Example of such process is the reduction of Nb5+ to Nb4+:
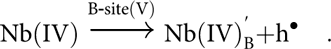 $${\rm{Nb}}\left( {{\rm{IV}}} \right)\buildrel {{\rm{B ‐ site}}\left( {\rm{V}} \right)} \over \scale 177%\longrightarrow {\rm{Nb}}\left( {{\rm{IV}}} \right)_{\rm{B}}^\prime + {\rm{h}}^ \bullet \quad .$$
It should be noted that experimental determination of the point defects is difficult and requires a combination of several complementary techniques, for example, impedance spectroscopy, electron paramagnetic resonance, positron annihilation spectroscopy, Mössbauer spectroscopy, and X-ray photoelectron spectroscopy. Moreover, the exact charge-compensating mechanisms will strongly depend on the processing atmosphere, temperature, and chemical composition. While the doping and defect chemistry of KNN-based materials have been discussed in several previous publications [Reference Wu, Xiao and Zhu14, Reference Li, Wang, Zhu, Cheng and Yao33, Reference Malič, Koruza, Hreščak, Bernard, Wang, Fisher and Benčan34, Reference Rafiq, Tkach, Costa and Vilarinho110], the goal of the following section is to highlight some examples of single crystals.
Among the parameters that most decisively influence the defect state is the atmosphere. The as-grown KNN crystals are often reported to have a blue/dark color, which was related to the presence of Nb4+ states [Reference Matthias and Remeika64, Reference Kizaki, Noguchi and Miyayama106]. Note that some later reports suggested that the color originates from the higher concentration of oxygen vacancies [Reference Gupta and Priya111]. Similar phenomena are also observed in other materials, e.g., reduced LiNbO3, where both mechanisms are being discussed as the origin [Reference Ketchum, Sweeney, Halliburton and Armington112]. Annealing of such KNN crystals in air at 1100 °C resulted in the oxidation of Nb4+ to Nb5+ and a white crystal color. This induced a large decrease in the leakage current and considerably improved ferroelectric properties [Reference Kizaki, Noguchi and Miyayama106].
Similarly, oxygen annealing was demonstrated to be beneficial to improve the properties of more complex compositions, such as (K,Na,Li)(Nb,Ta,Sb)O3 [Reference Liu, Veber, Rödel, Rytz, Fabritchnyi, Afanasov, Patterson, Frömling, Maglione and Koruza113]. Annealing of the crystals in oxygen for one week at 900 °C dramatically improved the ferroelectric behavior and increased the room temperature piezoelectric coefficient from 381 pC/N to 732 pC/N [Fig. 7(a)]. This was related to a decreased oxygen vacancy concentration and partial oxidation of Sb3+ to Sb5+, as evidenced by impedance spectroscopy and Mössbauer spectroscopy, respectively. It should be noted that the annealing time in this study was chosen arbitrarily and the exact equilibrium conditions were not determined. More recently, Xue et al. reported that oxygen annealing of Er-doped KNN crystals at 800 °C for 10 h could enhance the upconversion photoluminescence intensity by 20 times, which was also ascribed to the Nb valence change and the reduced concentration of oxygen vacancies [Reference Xue, Deng, Xie, Hu, Yan, Zhao, Wang, Zhang, Luo, Deng, He, Lin, Li, Wang and Luo114].
(a) Increase in the piezoelectric coefficient in (K,Na,Li)(Nb,Ta,Sb)O3 crystals after oxygen annealing (reprinted from Ref. Reference Liu, Veber, Rödel, Rytz, Fabritchnyi, Afanasov, Patterson, Frömling, Maglione and Koruza113 with permission from Elsevier). (b) Dependence of the leakage current on the oxidation states in KNN and Mn-doped KNN single crystals (reprinted from Ref. Reference Kizaki, Noguchi and Miyayama106 with permission from AIP Publishing). (c) Influence of Mn doping and subsequent oxygen annealing at 900 °C on the ferroelectric hysteresis loop (1 Hz) and unipolar strain (2 Hz) of (K,Na,Li)(Nb,Ta)O3 single crystals.
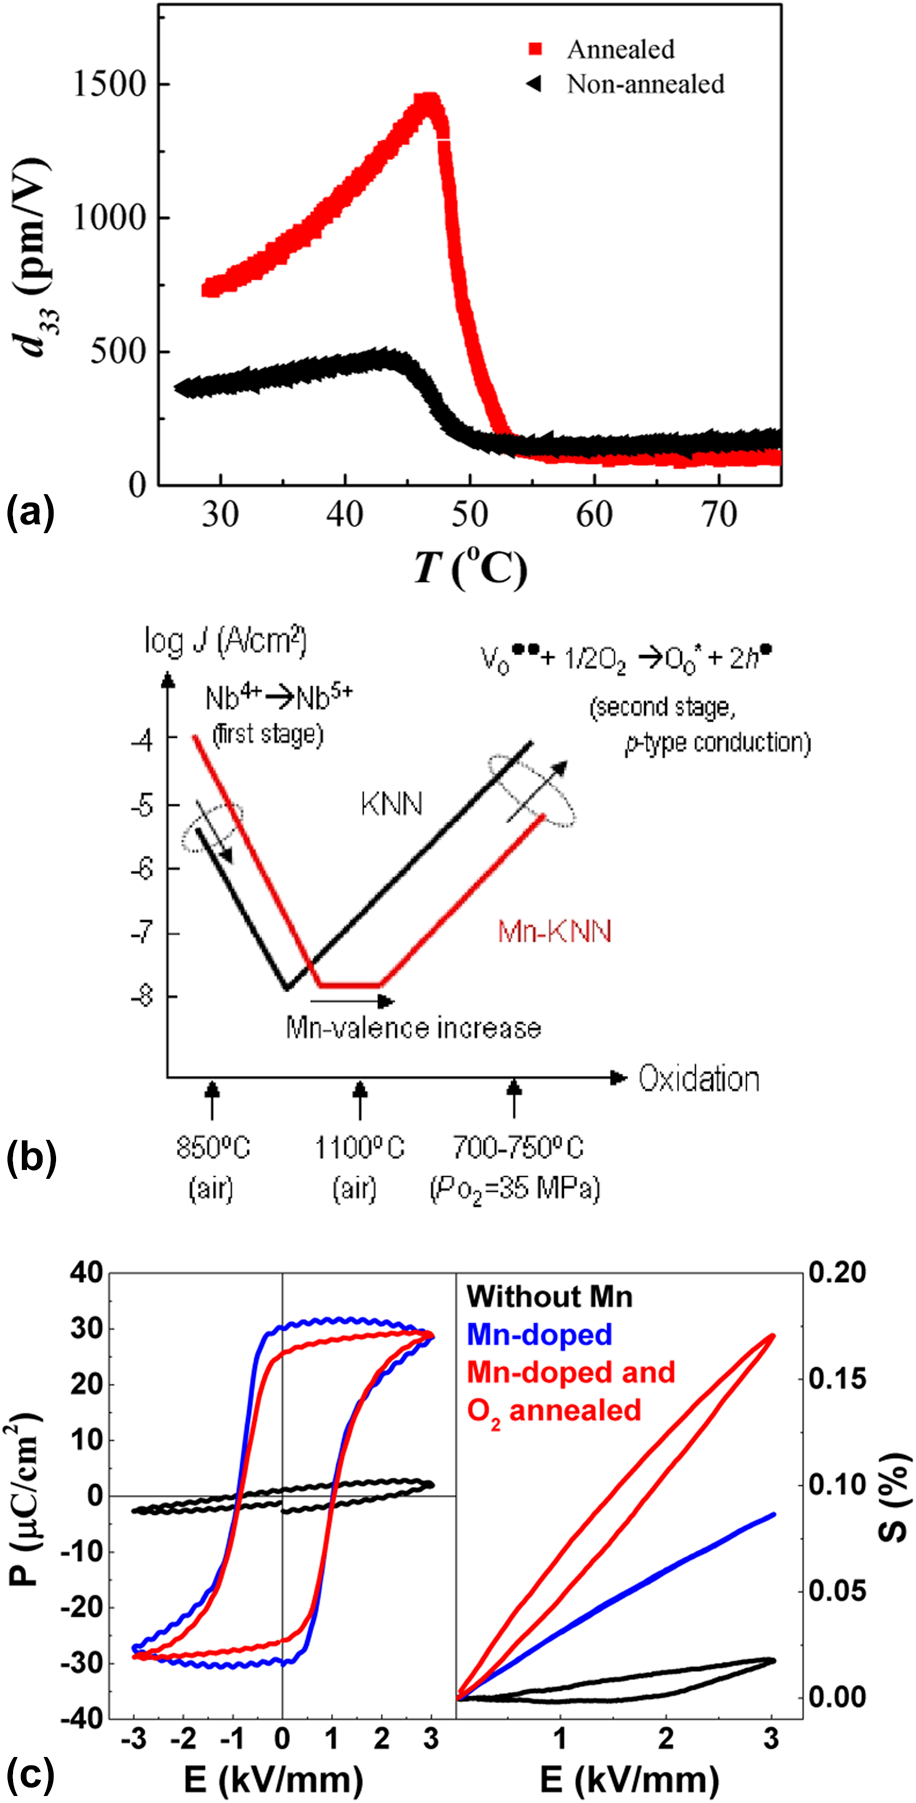
Kizaki et al. were among the first to propose reducing the leakage current of KNN crystals by Mn doping [Reference Kizaki, Noguchi and Miyayama106]. Note that this approach was previously used in other perovskite ferroelectrics, e.g., BaTiO3. The samples were grown by the self-flux method and had a final size of 2 × 2 × 2 mm3. The as-grown KNN crystals showed a high leakage current, related to electrical conduction through 4d electrons of Nb4+ [Fig. 7(b)]. On the other hand, Mn-doped crystals annealed in air had a lower leakage current due to the oxidation of Nb4+ to Nb5+. This was also accompanied by a color change. Further oxidation resulted in the formation of h•, which would increase the leakage current in pure KNN crystals; however, the present Mn2+ absorbed the generated h• by valence increase and thus preserved a low leakage current over a broad oxidation range. Due to the observed lattice expansion and the electron paramagnetic resonance (EPR) results, the authors concluded that Mn is incorporated into the Nb site [Reference Kizaki, Noguchi and Miyayama106, Reference Lin, Li, Zhang, Xu and Yao115]. It should be noted that some other authors reported that Mn predominantly occupies the A-site [Reference Yao, Zhang, Wang, Zhou, Chen, Xu, Li, Shen, Zhang, Gu, Zhang and Li116]. The occupancy is presumably strongly dependent on the atmosphere, concentration of Mn, and chemical composition of the material. Nevertheless, Mn doping was subsequently extensively used in KNN-based single crystals to reduce the losses, improve poling behavior, and strongly enhance the electromechanical properties [Reference Huo, Zhang, Zheng, Zhang, Wang, Wang, Sang, Yang and Cao26, Reference Liu, Koruza, Veber, Rytz, Maglione and Rödel46, Reference Liu, Xu, Liu, Yang and Chen65, Reference Lin, Li, Zhang, Xu and Yao115].
The influence of Mn doping and oxygen annealing on the ferroelectric properties of (K,Na,Li)(Nb,Ta)O3 crystals is exemplified in Fig. 7(c). The domains in the undoped crystal are strongly clamped and polarization switching is absent (also dielectric losses are high). Mn-doped sample exhibits a characteristic polarization hysteresis loop with a minor contribution from the leakage current. While the unipolar strain increases, the absence of hysteresis in the unipolar strain loop indicates a low contribution from domain walls. Upon oxygen annealing at 900 °C, the resistivity of the Mn-doped sample further increases. The unipolar strain and the strain hysteresis increase, which indicates increased mobility of the domain walls, as compared with the non-annealed sample.
Ferroelectric domains
Domains and domain configurations
Physical properties of ferroelectrics largely depend on their domain structure [Reference Tagantsev, Cross and Fousek117, Reference Damjanovic118]. Cooling a perovskite ferroelectric below the Curie point results in the displacement of the B-site cations along one of the polar directions and a consequent formation of spontaneous polarization and strain. This process induces large depolarizing electric fields and mechanical stresses, which get compensated by the formation of ferroelectric domains, i.e., coherent regions with uniform polarization orientations. The resulting domain walls can be separated into ferroelectric 180° domain walls, minimizing the electrostatic energy, and ferroelectric/ferroelastic non-180° domain walls, additionally minimizing the mechanical energy. The final domain configuration will be strongly dependent on the local electrical and mechanical boundary conditions. It should be noted that some ferroelectric domain walls can also be charged, which was recently observed in KNN materials as well [Reference Esin, Alikin, Turygin, Abramov, Hreščak, Walker, Rojac, Benčan, Malič, Kholkin and Shur119, Reference Rubio-Marcos, Del Campo, Rojas-Hernandez, Ramirez, Parra, Ichikawa, Ramajo, Bausa and Fernandez120].
The domain configuration will be determined by the structure and phase transitions of KNN, which are described in section “KxNa1–xNbO3 system”. The cubic–tetragonal phase transition (T C) results in the formation of 90° and 180° domain walls. Due to 6 possible 〈100〉PC spontaneous polarization directions of the tetragonal structure [Fig. 8(a)], 90° domain walls are formed by twinning the {110}PC planes, while 180° walls appear in 〈100〉PC directions. It should be noted that the actual angles of non-180° domain walls slightly deviate from the values used for their notation. For example, the angle α at the 90° domain wall can be calculated from the cell parameters a and c by:
 $$\alpha = 2 \cdot \tan ^{ - 1} \left( {{a \mathord{\left/ {\vphantom {a c}} \right. \kern-\nulldelimiterspace} c}} \right)\quad .$$
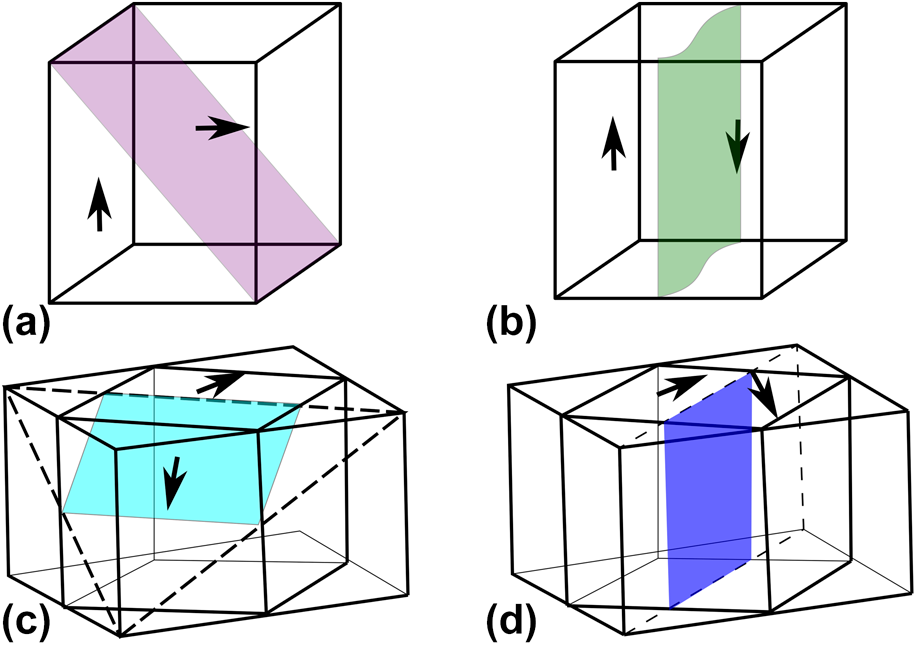
Domain configurations of tetragonal and orthorhombic phases under various conditions: (a, e) initial state and E-field applied along (b, f) [001]PC, (c, g) [011]PC, and (d, h) [111]PC direction.
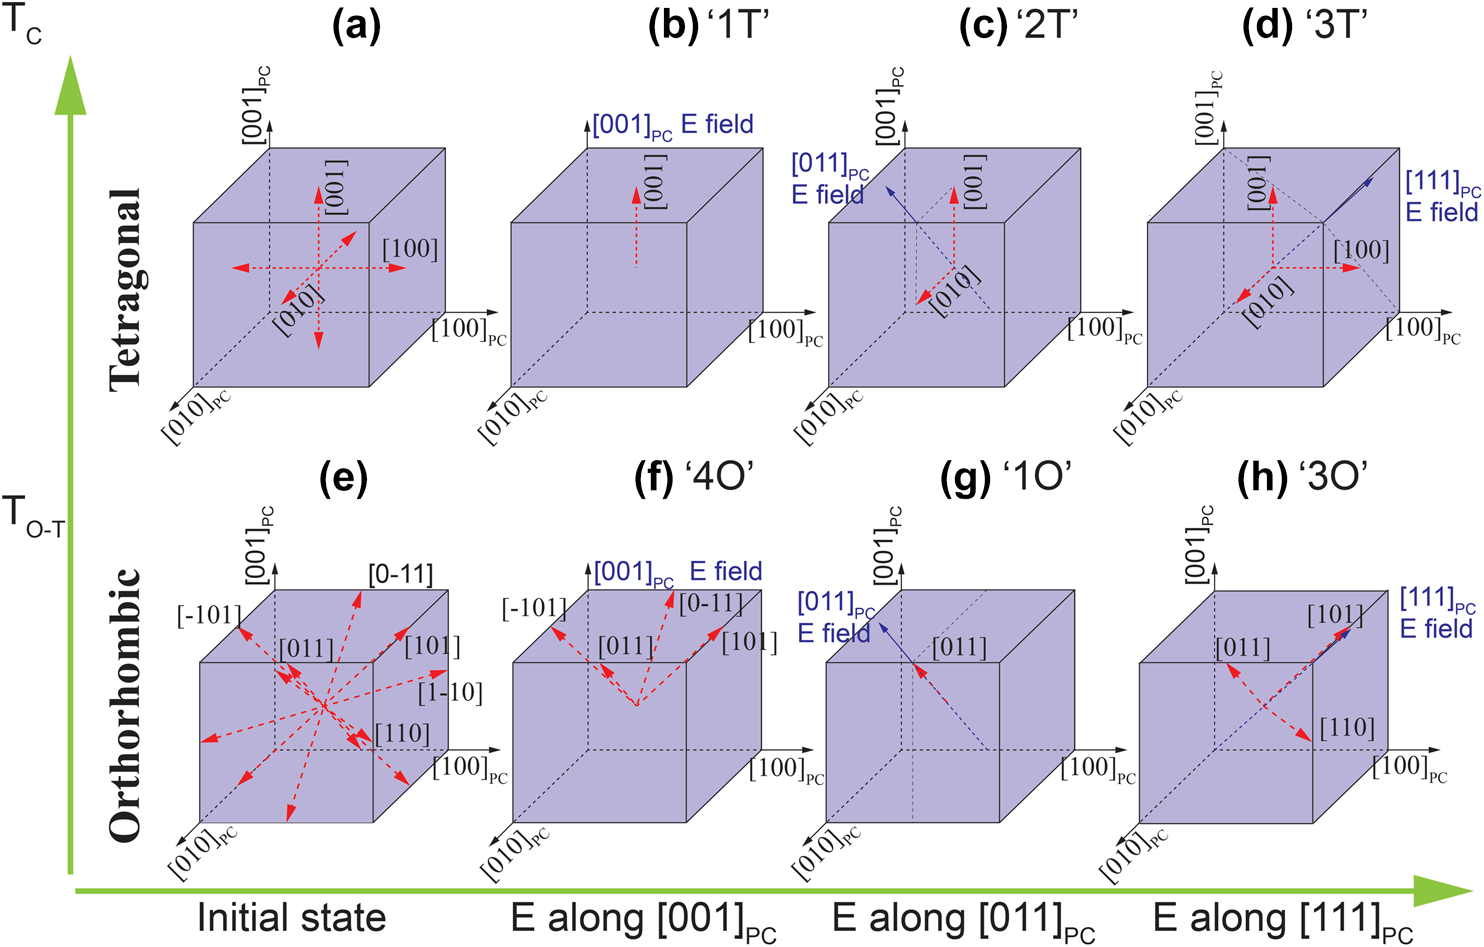
Four different domain angles can be formed in the orthorhombic phase, namely, 60°, 90°, 120°, and 180° [Reference Wiesendanger121]. The orientation depends on the 12 possible spontaneous polarization directions of the orthorhombic phase [〈110〉; Fig. 8(e)] and on the mechanical compatibility based on the spontaneous strain tensor [Reference Fousek and Janovec122]. 90° domain walls lie on {001}PC pseudocubic or {110}O orthorhombic planes [Reference Deshmukh and Ingle123]. 180° domain walls can appear at the same planes as 90° walls, but because antiparallel domains have identical strain tensors, they are mechanically not limited to certain planes [Reference Wiesendanger121]. 60° and 120° domain walls lie on the pseudocubic {110}PC or orthorhombic {111}O planes [Reference Deshmukh and Ingle123]. For the differentiation between 60° and 120° walls, the spontaneous polarization configuration (head-to-head, head-to-tail, etc.), the charges, and the permissible domain wall criteria have to be considered carefully [Reference Wiesendanger121]. Examples of 90° and 60° domain walls for the orthorhombic system and 90° and 180° for the tetragonal system are shown in Fig. 9.
Schematics for exemplary domain walls appearing in perovskite ferroelectrics with tetragonal structure: (a) 90° domain wall on (101) plane, (b) 180° domain wall and orthorhombic structure (c) 60° domain wall on (111)O plane, and (d) 90° domain wall on (110)O plane. Redrawn from Refs. Reference Wiesendanger121 and Reference Deshmukh and Ingle123.
Domain engineering
The functional properties of the as-grown piezoelectric crystals are enhanced by adjusting their domain structures. This process is denoted as domain engineering [Reference Zhang and Li4, Reference Park and Shrout7, Reference Bell124, Reference Davis, Damjanovic, Hayem and Setter125]. While this term is today often used to describe any kind of changes in the crystals' domain structure, it was originally defined as the process of poling along one of the crystal's poling axis that is different from the zero-field polar axis, creating a set of domains in which polarization vectors have a minimized angle to the poling direction [Reference Bell124]. Figure 8 shows domain configurations of a crystal with electric field aligned along [001]PC, [011]PC, and [111]PC directions for both the orthorhombic and tetragonal phases. The orthorhombic configurations are labeled as “4O,” “1O,” and “3O” and the tetragonal ones as “1T,” “2T,” and “3T”. “1O” and “1T” domain configurations are single domain states, while others are polydomain.
Which of the above configurations will result in enhancement of the electromechanical response depends on material's intrinsic anisotropy and the vicinity of phase transitions [Reference Budimir, Damjanovic and Setter126, Reference Davis, Budimir, Damjanovic and Setter127]. Strictly speaking, the domain walls in domain-engineered materials are not expected to move when electric fields are applied along the poling direction, thus the electromechanical response is expected to be predominantly intrinsic in nature (for detailed description of intrinsic and extrinsic contributions, see “Electromechanical properties” section). The anisotropy can be estimated by comparing the longitudinal (d 33), transverse (d 31), and shear (d 15) piezoelectric coefficients. Materials with large anisotropy [e.g., where (d 15 + d 31)/d 33 > 1] exhibit the largest longitudinal piezoelectric response along nonpolar directions, which is related to facilitated polarization rotation. On the other hand, in materials with (d 15 + d 31)/d 33 below a critical value the highest response is obtained along the polar direction (polarization extension mechanism). The piezoelectric coefficients are directly related to the dielectric anisotropy; therefore, the above relations can also be described by the ratio of the transverse and the longitudinal dielectric susceptibilities (χ11/χ33). Note that the dielectric anisotropy is often very large in the vicinity of phase transitions [Reference Budimir, Damjanovic and Setter126, Reference Liang, Li, Hu, Chen and Lu128], which can strongly increase the piezoelectric response. Interestingly, while orthorhombic KNbO3 shows a dielectric anisotropy of χ11/χ33 = 3.5, higher values were reported for some of the KNN-based crystals [Reference Hu, Tian, Meng, Shi, Cao and Zhou129].
Domain engineering of orthorhombic [001]C-oriented KNbO3 crystals was studied in detail by Wada et al. [Reference Wada, Muraoka, Kakemoto, Tsurumi and Kumagai130]. Calculated and measured piezoelectric properties for single-domain crystals were compared and different engineered polydomain configurations were prepared. The latter had a much higher response as compared with the single-domain state and the properties increased with decreasing the domain size. The individual contributions of the different domain variants to the longitudinal and transverse piezoelectric coefficients were later calculated by Davis et al. [Reference Davis, Damjanovic, Hayem and Setter125], while their temperature dependence and the influence of phase transitions were reported by Liang et al. [Reference Liang, Li, Hu, Chen and Lu128]. Highest electromechanical properties were demonstrated for [001]C-oriented KNbO3 crystals rotated by 45° away from the polar axis [Reference Davis, Klein, Damjanovic, Setter, Gross, Wesemann, Vernay and Rytz131]. Reports of domain-engineered KNN-based single crystals are relatively rare; some examples will be presented in the following section.
Modifications of the domain structures in KNN crystals
The ferroelectric domain structures in KNN-based single crystals were investigated by several authors using polarized light microscopy (PLM) [Reference Zheng, Wang, Huo, Wang, Sang, Li, Zheng and Cao48, Reference Lin, Li, Li, Cai, Liu and Zhang51, Reference Deng, Zhang, Zhao, Chen, Wang, Li, Lin, Ren, Jiao and Luo73, Reference Lin, Li, Xu and Yao132, Reference Inagaki, Kakimoto and Kagomiya133, Reference Lin, Zhang, Cai and Liu134, Reference Wang, Zheng, Lu, Yang, Yang, Zhang, Lv and Cao135], transmission electron microscopy (TEM) [Reference Jiang, Randall, Guo, Rao, Tu, Gu, Cheng, Liu, Zhang and Li50, Reference Liu, Veber, Zintler, Molina-Luna, Rytz, Maglione and Koruza74], and piezoresponse force microscopy (PFM) [Reference Fu, Yang, Yu, Wang, Lu, Yang, Xu and Li101, Reference Rafiq, Costa and Vilarinho136, Reference Bah, Alyabyeva, Retoux, Giovannelli, Zaghrioui, Ruyter, Delorme and Monot-Laffez137, Reference Cui, Jiang, Zhang, Xu, Xu, Chen, Hu and Chu138]. Unlike the complicated zigzag or herringbone-like structures reported for KNN polycrystalline ceramics [Reference Qin, Zhang, Yao, Wang and Zhang139], the domains in single crystals arrange into less-complex configurations and are generally larger in size. This is related to the different local boundary conditions, e.g., reduced internal stresses due to the absence of a microstructure with randomly oriented grains. Below, we list a series of reported approaches for adjusting the domain structure of KNN single crystals.
A well-known method for modifying the domain structure is chemical doping. For example, Lin et al. demonstrated a reduction in the domain size by about 50% after Mn doping [Fig. 10(A)] [Reference Lin, Li, Zhang, Xu and Yao115]. The doped crystal exhibited a 69% and 200% increase in the piezoelectric coefficient and dielectric permittivity, respectively. Note that Mn doping resulted in a minor decrease in the T O–T by 15 °C. Interestingly, Huo et al. reported that Mn doping of (K,Na,Li)(Nb,Ta)O3 crystals resulted in reduced extrinsic contributions [Reference Huo, Zhang, Zheng, Zhang, Wang, Wang, Sang, Yang and Cao26, Reference Huo, Zheng, Zhang, Wang, Wang, Sang, Wang, Yang and Cao140]. The observed increase in the piezoelectric coefficient from 420 pC/N in undoped to 630 pC/N in Mn-doped crystals was thus related to enhanced intrinsic contribution by Mn doping.
Examples of different domain configurations reported in KNN-based single crystals. (A) Reduction of domain size by Mn doping (reprinted from Ref. Reference Lin, Li, Zhang, Xu and Yao115 with permission from Wiley). (B) Reduction of domain size by changing the high-temperature poling conditions: (a) 9 µm after 120 °C, 20 kV/cm, (b) 6.5 µm after 205 °C, 6 kV/mm, (c) 2.5 µm after 205 °C, 12 kV/cm, and (d) 2 µm after 205 °C, 18 kV/cm (reprinted from Ref. Reference Lin, Zhang, Cai and Liu134 with permission from AIP Publishing). Note the change in domain pattern from (a, b) laminar to (c, d) twinned. (C) Temperature-dependent domain evolution in [001]PC-oriented KNLTN single crystal: (a) 25 °C, (b) 100 °C, (c) 250 °C, and (d) 450 °C [Reference Liu, Veber, Zintler, Molina-Luna, Rytz, Maglione and Koruza74]. Pictures in (A) and (B) were obtained by PLM, while (C) with TEM.
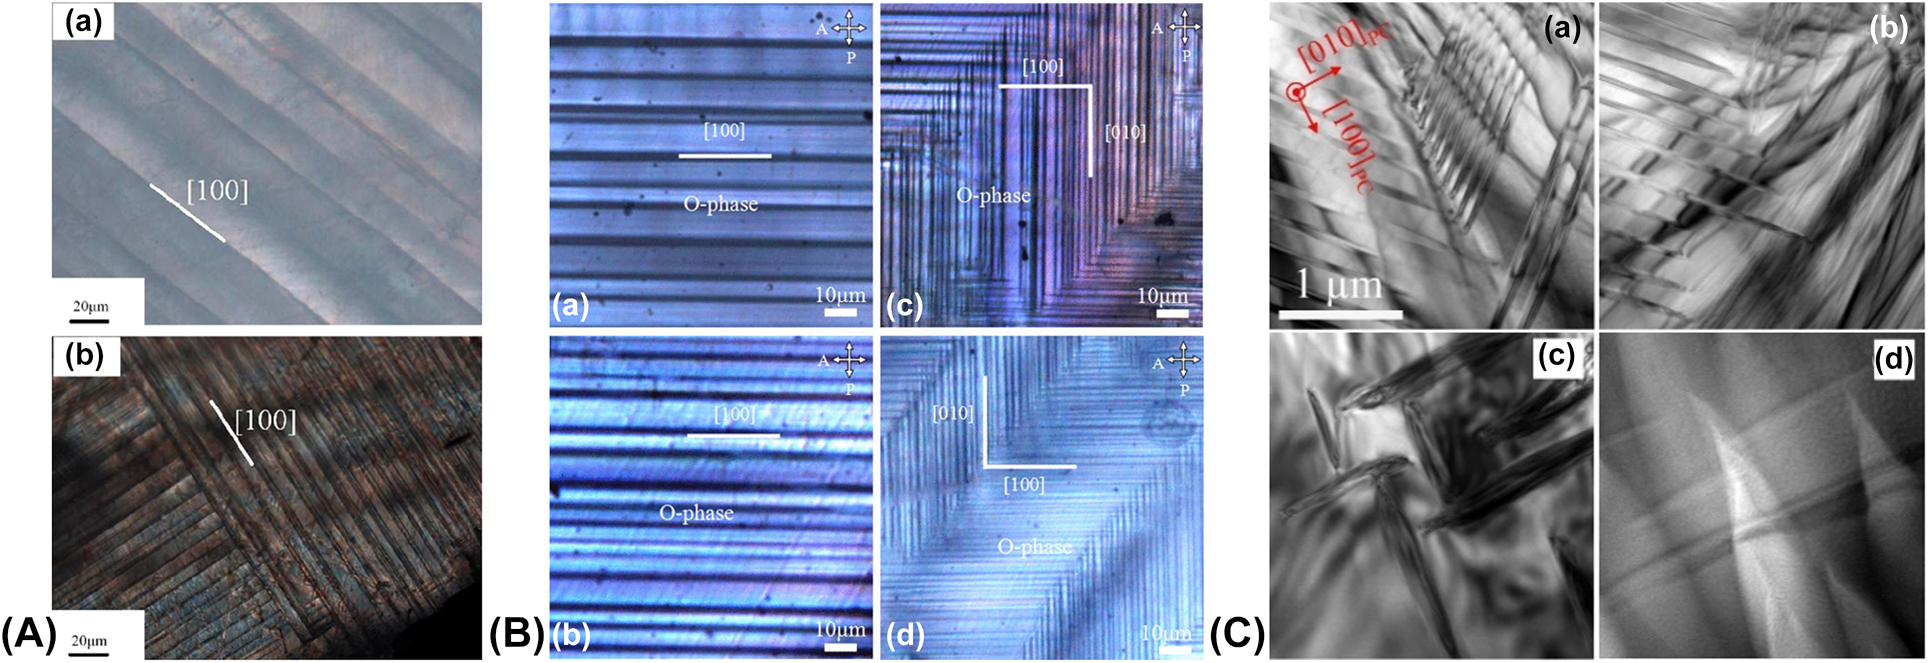
Inagaki et al. investigated the dependence of domain patterns in [001]PC-oriented Mn-doped KNN crystal on the cooling rate of the flux growth method [Reference Inagaki, Kakimoto and Kagomiya133]. Upon rapid cooling into the orthorhombic phase at 1.25 °C/min, only 90° domain walls were detected. On the other hand, both 90° and 60° domain walls were observed if the cooling rate was reduced to 0.25 °C/min, which resulted in crystals with higher polarization, higher piezoelectric response, and a lower leakage current density. However, it should be noted that the chemical composition of the crystals was not investigated and may have been altered by the different segregation due to the varying cooling rates.
Early attempts to domain engineer the Li-modified KNN crystals were reported by Davis et al., who demonstrated large and temperature-stable thickness coupling coefficients on a [001]C-poled crystal [Reference Davis, Klein, Damjanovic, Setter, Gross, Wesemann, Vernay and Rytz131]. The influence of the poling electric field and temperature on the domain structure of [001]PC-oriented 0.5%MnO2-doped (K0.5Na0.5)NbO3 was systematically studied by Lin et al. [Reference Lin, Zhang, Cai and Liu134]. Increasing the poling conditions from 120 °C and 20 kV/cm to 205 °C and 18 kV/cm resulted in a domain size decrease from 9 µm to 2 µm [Fig. 10(B)] and a change in the domain pattern form laminar to twinned. This was accompanied by an increase of the piezoelectric coefficient from 270 pC/N to 350 pC/N and relative permittivity from 730 to 850. Influence of poling on the [011]C-oriented tetragonal (K,Na,Li)(Nb,Sb,Ta)O3 crystal was studied by Wang et al. [Reference Wang, Zheng, Lu, Yang, Yang, Zhang, Lv and Cao135]. Applying 4–5 kV/cm along the [011]C direction switched the polarization vectors into the nearby 〈100〉C directions and the “2T” engineered domain structure [Fig. 8(c)] was formed. Highest properties were obtained after poling with 6 kV/mm, while higher fields resulted in overpoling. The same group has previously also attempted to obtain monodomain state in [001]C-oriented tetragonal (K,Na,Li)(Nb,Sb,Ta)O3 crystals [Reference Wang, Zheng, Yang, Luo, Lu, Liu, Zhang, Lv and Cao141], i.e., the “1T” configuration shown in Fig. 8(b). However, this was prevented by the large shear elastic stiffness constant c44, which was reported to be more than 5 times larger for KNN crystals (7.8 × 10¹⁰ N/m2) than for typical lead-based crystals (1.28 × 10⁻¹⁰ N/m2).
Another important factor is the thermal stability of the domain structure, which is directly reflected in the temperature stability of the functional properties. This includes the changes in the domain structure between two phase transitions, as well as the transformation between different domain configurations at phase transition (e.g., from orthorhombic to tetragonal). Temperature-dependent domain evolution in KNN-based crystals was investigated by Liu et al. using TEM [Fig. 10(C)] [Reference Liu, Veber, Zintler, Molina-Luna, Rytz, Maglione and Koruza74], Zheng et al. using PLM [Reference Zheng, Wang, Huo, Wang, Sang, Li, Zheng and Cao48], and Cui et al. using PFM and Raman spectroscopy [Reference Cui, Jiang, Zhang, Xu, Xu, Chen, Hu and Chu138]. Increasing the temperature in the orthorhombic phase resulted in a slight decrease in the 60° domain wall density, which was ascribed to the higher elastic energy of 60° domain walls as compared with 90° domain walls. The domain transition in the vicinity of the orthorhombic–tetragonal phase boundary was initiated at locations where stresses are easily released and was accompanied by depolarization of the orthorhombic phase and the formation of the tetragonal phase [Reference Zheng, Wang, Huo, Wang, Sang, Li, Zheng and Cao48]. However, contradictive results were reported for the domain sizes; while Zheng et al. observed smaller domains in the tetragonal phase, Liu et al. reported smaller domains in the orthorhombic phase compared with the tetragonal one. Cui et al. tested the stability of the domain structure by thermal cycling and reported increase in the amount of 60° domain wall and decrease in 90° domain wall after continuous cycles, which was explained by the higher internal stress and bounding strength induced by thermal fields.
Electromechanical properties
Functional properties of ferroelectrics are influenced by a number of parameters, including the crystal structure, vicinity of phase transitions, domain structure, domain mobility, and defects. The macroscopic dielectric and electromechanical responses are governed by microscopic mechanisms, which can be grouped into intrinsic and extrinsic contributions [Reference Damjanovic142]. Intrinsic mechanisms are related to the lattice deformation and include the piezoelectric effect and electrostriction, which are defined by spontaneous polarization, electronic structure, and dielectric and elastic constants. On the other hand, extrinsic mechanisms predominantly consist of domain wall motion (reversible or irreversible) and are defined by the domain configuration (section “Ferroelectric domains”) and the various defects influencing domain wall mobility (section “Defects and property optimization”). In many polycrystalline perovskite ferroelectrics, the extrinsic contributions were observed to be larger than the intrinsic ones; however, they are also nonlinear and hysteretic, which increases the losses [Reference Liu, Zhang, Jiang and Cao143].
The extrinsic contributions to the macroscopic response in KNN-based polycrystalline ceramics were reported to be about 70% [Reference Qin, Zhang, Yao, Wang and Zhang139] and were higher in the orthorhombic phase [Reference Huan, Wang, Li and Koruza144], which was related to the smaller lattice distortion and thus less constrained domain wall motion. Unfortunately, reports on the extrinsic contributions in KNN-based crystals are relatively scarce. While no reports could be found for the orthorhombic phase, the extrinsic contributions to piezoelectric and dielectric response of tetragonal (K,Na,Li)(Nb,Ta)O3 crystals were reported to be 16–24% [Reference Zheng, Wang, Liu, Yang, Lu, Li, Huo, Lu, Yang and Cao61], when poled along the [011]C direction. This low value could be related to the poled and partially domain-engineered state of this crystal. On the other hand, several papers show that the large signal piezoelectric coefficient d 33* (measured at large electric field, i.e., ratio between maximal strain and applied field, also referred to as “normalized strain”) is much larger than the small signal piezoelectric coefficient d 33 [Reference Huo, Zhang, Zheng, Zhang, Wang, Wang, Sang, Yang and Cao26, Reference Yang, Zhang, Yang, Liu, Li, Liu and Zhang84, Reference Huo, Zheng, Zhang, Wang, Wang, Sang, Wang, Yang and Cao140], which indicates increased extrinsic contribution when larger electric fields are applied. The temperature-dependent large signal properties of different crystal orientations were reported by Liu et al. [Reference Liu, Koruza, Veber, Rytz, Maglione and Rödel46], who observed a very large d 33* coefficient of 1391 pm/V when applying 3 kV/mm to a [001]PC-oriented (K,Na,Li)(Nb,Ta)O3 crystals at the T O–T = 100 °C [Fig. 7(a)].
A summary of the reported dielectric, ferroelectric, and piezoelectric properties of KNN-based single crystals is presented in Table II, along with their transition temperatures. The reports are ordered by the increasing complexity of the chemical composition, following the sequence: pure KNN → modified KNN → Mn-doped KNN → post-growth treated KNN. It should be noted that some authors have not reported a detailed analysis of the chemical composition of the final crystals; therefore, the listed chemical formulas should be considered with care. Pure KNN crystals are orthorhombic at room temperature and exhibit the highest piezoelectric coefficients of about 150–160 pC/N for compositions with 50–60 mol.% K. Interestingly, these coefficients are similar to the values reported for high-density polycrystalline ceramics, e.g., such obtained by pressure-assisted or spark plasma sintering [Reference Wu, Xiao and Zhu14, Reference Li, Wang, Zhu, Cheng and Yao33, Reference Malič, Koruza, Hreščak, Bernard, Wang, Fisher and Benčan34, Reference Wang, Malič and Wu37]. Electromechanical properties can be improved by addition of Li (2–6 mol.%), Ta (4–30 mol.%), and Sb (4–6 mol.%). This effect can be predominantly related to the reduced T O–T and is thus accompanied by decreased temperature stability of the properties. Modified KNN crystals with T O–T between 30 °C and 80 °C can reach piezoelectric coefficients of 600–1000 pC/N and coupling coefficients of 0.8–0.95. Note that these values are higher than those of commercial polycrystalline soft PZT ceramics, which on the other hand exhibits higher depolarization temperatures [Reference Heywang, Lubitz and Wersing1]. Considering the fact that domain engineering is not widely exploited in KNN crystals, their values are expected to be further increased and the temperature range extended in the future. Moreover, the approach for improving the response and temperature stability of KNN by T R–T boundary formation, recently reported in polycrystalline ceramics [Reference Wang, Wang, Yao, Li, Schader, Webber, Jo and Rödel40, Reference Zhang, Wang, Zhou, Zhou, Chu, Lv, Wu and Li41, Reference Lv, Wu, Xiao, Zhu and Zhang42], has to the best of our knowledge not been implemented in the single crystals so far.
Table II shows that the highest piezoelectric coefficient is obtained in the crystal growth by the seed-free SSCG method, which should be due to the easy control of composition by this method. On the other hand, large crystal sizes and good piezoelectric coefficients can also be obtained by the TSSG method, especially if post-growth treatment is applied.
It should be noted that enhanced electromechanical properties of polycrystalline ferroelectrics can also be obtained by preferential orientation of grains in a crystallographic orientation with higher properties [Reference Messing, Poterala, Chang, Frueh, Kupp, Watson, Walton, Brova, Hofer, Bermejo and Meyer145]. These textured ceramics are often considered a cost-effective alternative to single crystals, although the presence of the grain boundaries still has a large influence on the functional properties. The large potential of texturing for KNN was already demonstrated in the seminal work by Saito et al. [Reference Saito, Takao, Tani, Nonoyama, Takatori, Homma, Nagaya and Nakamura13]. Recently, Zhang et al. reported largely improved temperature stability of the strain response in textured KNN-based ceramics up to 175 °C [Reference Zhang, Zhu, Fan, Marwat, Ma, Liu, Liu, Xie, Wang and Koruza146], while Li et al. demonstrated exceptionally high electromechanical parameters (d 33 ≈ 700 pC/N, d 33* ≈ 980 pm/V, k p = 0.76) [Reference Li, Zhai, Shen, Zhang, Li, Zhu and Zhang147]. Note that in these two examples, the KNN was additionally modified with Zr and Hf, respectively. Interestingly, while the reported piezoelectric coefficients of textured ceramics are close to the ones of the single crystals (see Table II), their electromechanical coupling coefficients are relatively lower.
The small size of the obtained crystals often allowed the determination of only selected properties, as evident from Table II. However, full matrices of dielectric, elastic, and piezoelectric coefficients are highly desired from scientific and application points of view. These, namely, enable the analysis of the intrinsic material's anisotropy and are a starting point for domain engineering. On the other hand, this information is required by device designers to perform simulations of materials under real application conditions, for example, by finite element modeling. The determination of full matrices of properties is nontrivial and requires a large number of samples with different geometries (see, e.g., Refs. Reference Zhang and Li4 and Reference Cao and Ye155), which are to be characterized by the resonance method. The number of samples can be reduced by using a combination of the resonance and ultrasonic pulse-echo methods. It should be noted that when determining the intrinsic material properties, these measurements should be performed on monodomain single crystals, otherwise extrinsic domain contributions cannot be excluded and the obtained parameter sets may not be consistent. A list of literature reports of full matrices of dielectric, elastic, and piezoelectric of KNN-based crystals is given in Table III.
List of literature reports of KNN-based crystals with determined full tensor dielectric, elastic, and piezoelectric properties. All crystals were grown by the TSSG method, while the chemical composition was determined using energy dispersive X-ray spectroscopy (unless stated otherwise).
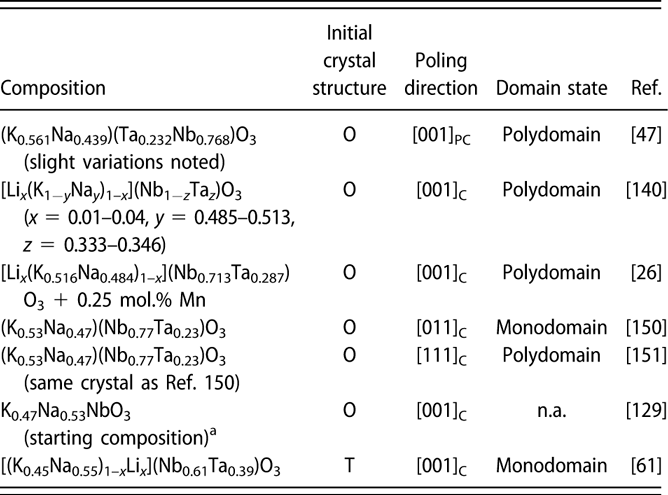
a Crystal composition not determined.
Finally, we note that accurate measurements of intrinsic properties of high-quality monodomain KNN single crystals are also desired for the determination of the thermodynamic potential. Pohlmann et al. have recently reported a set of Landau potential coefficients for KNN using experimental data from various sources [Reference Pohlmann, Wang, Wang and Chen156]; however, conducting such a study using the data obtained from the same crystal would be preferred.
Applications
Improved quality of KNN-based single crystals, ability to grow larger samples, higher electromechanical properties, and a better understanding of the anisotropy have motivated the construction of a series of prototype devices and demonstrators. As shown in section “Electromechanical properties”, the main merit of KNN-based crystals are high coupling coefficients, in particular in thickness mode, and a relatively wide temperature stability range, limited by the first phase transition appearing above room temperature. In addition, the density of KNN, 4.51 g/cm3, is much lower than that of other perovskite ferroelectrics (e.g., ∼6 g/cm3 for BaTiO3 or 8 g/cm3 for PZT), which means that piezoelectric resonance will be shifted to higher frequencies. All these properties make KNN-based crystals ideal materials for ultrasonic transducers, in particular in the high frequency range (>20 MHz) used for certain ultrasonic medical imaging. In this range, lead-based piezoelectrics are often limited in resolution, whereas the low density of KNN enables to achieve higher frequencies (at same thicknesses) and thus improved imaging resolution.
This concept was first demonstrated by Bantignies et al. using KNbO3 single crystals [Reference Bantignies, Filoux, Mauchamp, Dufait, Thi, Rouffaud, Gregoire and Levassort157]. The [001]C-oriented crystals were cut at 45° and assembled into a 1–3 piezocomposite array with 128 elements and a thickness of 69 µm to minimize the lateral vibration modes [Fig. 11(a)]. The center frequency was 30 MHz and the relative bandwidth about 50%. Note that a broad bandwidth is important to achieve short pulse lengths and thus a better axial resolution. The transducer was used for in vivo imaging of human skin, whereby a higher spatial resolution was achieved as with a comparable PZT probe, mostly due to higher frequency. The ability to achieve higher frequencies was related to the lower density and higher Young's modulus of KNbO3, as compared with lead-based materials.
Examples of transducers and corresponding images: (a) 30 MHz KNbO3-based transducer used to perform in vivo imaging of human forearm skin (© 2019 IEEE. Reprinted, with permission, from Ref. Reference Bantignies, Filoux, Mauchamp, Dufait, Thi, Rouffaud, Gregoire and Levassort157.), (b) the photoacoustic probe for intravascular imaging using KNN single crystals and a reconstructed image of a calcified atherosclerotic human artery (scale bar is 1 mm) (reprinted from Ref. Reference Zhu, Zhu, Yang, Ou-Yang, Yang, Li and Wei158).
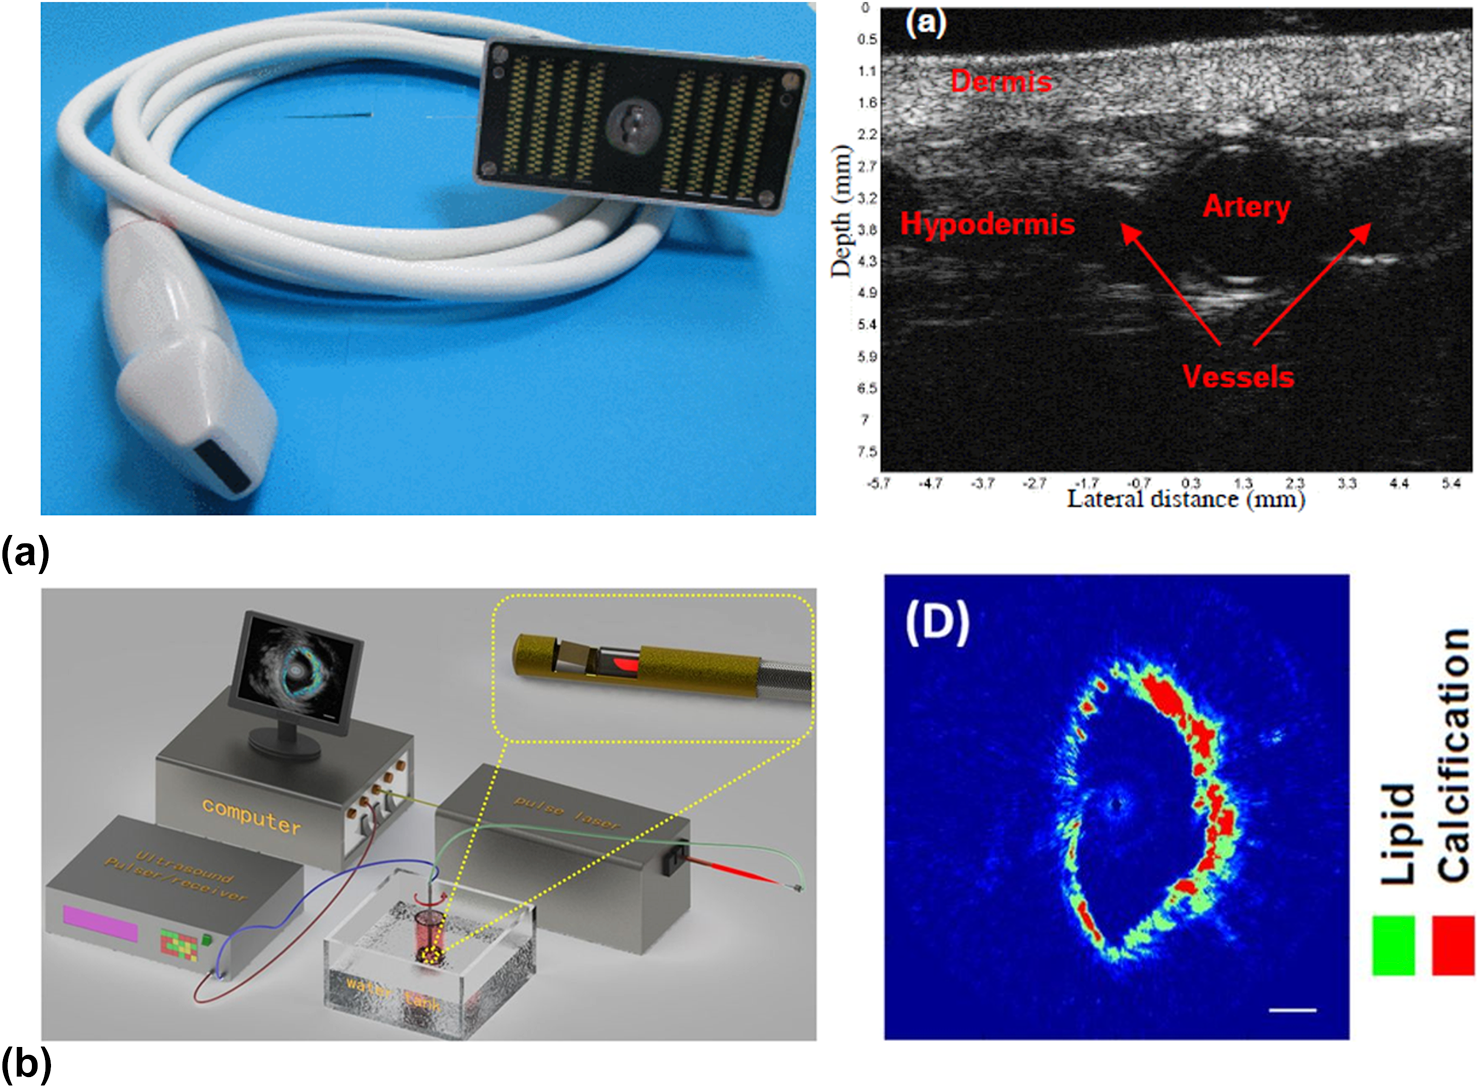
Recently, several authors have demonstrated the large potential of the KNN-based single crystals for miniaturization of high-frequency ultrasonic transducers. This could be beneficial for intravascular imaging applied in the detection of atherosclerosis, which is one of the leading causes of cardiovascular diseases. Zhu et al. have grown orthorhombic (K0.45Na0.55)0.96Li0.04NbO3 crystals by the SFSSCG method (see Ref. Reference Yang, Zhang, Yang, Liu, Li, Liu and Zhang84) and lapped/polished them to the size of 0.4 × 0.4 × 0.06 mm3 [Reference Zhu, Zhu, Yang, Ou-Yang, Yang, Li and Wei158]. The crystal had a d 33 = 674 pC/N, k t = 0.55, and T O–T = 82 °C, and was used to construct an intravascular photoacoustic probe (hybrid imaging using ultrasound transducer and laser fiber) with an outside diameter of 1 mm [Fig. 11(b)]. The transducer had a central frequency of 35.5 MHz and a bandwidth of 82% at −6 dB. The axial and lateral resolutions were 60 µm and 220 µm, respectively, which were sufficient to identify the calcified regions inside a human artery. The same authors have later also reported an 80 MHz transducer using a 28 µm thin wafer of the same crystal [Reference Zhang, Ou-Yang, Yang, Wei and Zhu159].
Ma et al. have grown a Mn-doped (K0.44Na0.56)NbO3 crystal by TSSG with k t = 0.64 and d 33 = 300 pC/N. The crystal was cut into a 1.5 × 1.5 × 0.05 mm3 wafer and assembled into a single-element transducer with a −6 dB bandwidth of 70.2% and a center frequency of 51.8 MHz, which was successfully applied in a vessel imaging test [Reference Ma, Xue, Zhao, Wang, Tang, Duan, Wang, Shi, Yue, Zhou, Luo and Fang160]. KNN-based crystal grown by the TSSG method was also used by Chen et al. [Reference Chen, Zheng, Cao, Chen, Chen, Li, Shung and Zhou161]. The Ta-modified KNN sample (reported previously in Ref. Reference Zheng, Huo, Wang, Wang, Jiang and Cao47) with d 33 = 195 pC/N, k 33 = 0.827, k t = 0.646, and tanδ = 0.004 was cut into a wafer with a diameter 1.5 mm and a thickness 42 µm. Note that despite the lower d 33 than lead-based crystals, the k t value was actually higher. The produced 45.4 MHz ultrasonic transducer had a bandwidth of 57.6%, axial resolution of 32.3 µm, and lateral resolution of 85 µm. The high resolution was accompanied by a low dielectric permittivity, which was beneficial for better impedance matching to the source. Moreover, the low acoustic impedance of 26.5 MRayl (compared to 37.5 MRayl for PIN-PMN-PT) ensured low acoustic energy loss during ultrasonic wave propagation due to better impedance matching to the soft tissue (1.5 MRayl). The high performance of the transducer was successfully demonstrated by examining the anatomy of an excised porcine eyeball.
The application of KNN-based single crystals beyond ultrasound imaging has not been widely investigated so far. Lead-based piezoelectric crystals of the 3rd generation were designed to have high mechanical quality factors Q m [Reference Zhang and Li4], which are desired for high-power ultrasonic applications, e.g., medical treatment with ultrasound or sonar projectors. This piezoelectric “hardening” is typically obtained by acceptor doping [Reference Heywang, Lubitz and Wersing1]. Interestingly, this concept was already well studied in KNN-based polycrystalline ceramics and strong hardening was reported for Cu-doped compositions, with Q m values exceeding the ones of commercial PZT [Reference Matsubara, Yamaguchi, Kikuta and Hirano162, Reference Han, Koruza, Patterson, Schultheiß, Erdem, Jo, Lee and Rödel163]. This hardening has not been implemented into KNN-based single crystals so far and may be an opportunity for increasing their usability.
The tendency to form cracks on repeated application of large electric fields will probably prevent the use of piezoelectric crystals in off-resonance actuators. However, high piezoelectric charge coefficients and modest permittivities may be beneficial for piezoelectric sensors, where high values of the piezoelectric voltage coefficient  $\left( {g_{33} = {{d_{33} } \mathord{\left/ {\vphantom {{d_{33} } {\left( {\varepsilon _0 \cdot \varepsilon _{33}^{\rm T} } \right)}}} \right. \kern-\nulldelimiterspace} {\left({\varepsilon _0 \cdot \varepsilon _{33}^{\rm T} } \right)}}} \right)$ are required. Examples for such applications could be acoustic emission sensors or hydrophones. The latter require high piezoelectric hydrostatic coefficients (g h) and could additionally benefit from the KNN's low density.
Finally, it should be noted that a successful transfer of KNN-based crystals into applications does not depend solely on high piezoelectric coefficients but also on a set of other requirements that need to be met. These include cost, reproducibility of the process, suitable mechanical and thermal properties, and fatigue resistance (for detailed discussion, see Ref. Reference Koruza, Bell, Frömling, Webber, Wang and Rödel164). These parameters remain to be investigated.
Summary and outlook
Despite their discovery in the 1950s, the main advancement of KNN-based single crystals was achieved after their revival in the beginning of the 21st century. The field benefited from the improved understanding of the crystal growth techniques, most noticeable high temperature solution growth and SSCG. The increased understanding of the defect chemistry of the KNN system enabled to develop doping strategies and post-growth treatments for decreasing the losses and improving their properties. While the overall electromechanical response still lags behind the performance of the lead-based piezoelectric crystals, their main potential lies in the high transition temperatures, low density, and nontoxic compositions. It is expected that their performance can be further improved by domain engineering and formation of new phase boundaries, for example, between rhombohedral and tetragonal phases, as recently reported in polycrystalline ceramics. This also brings along new challenges for crystal growers, which will need to find a way to incorporate small amounts of Zr or Hf into the KNN crystals. Moreover, hardening by acceptor doping could further broaden their application to high-power piezoelectric devices. However, further research in the growth process and defect control is required to provide even larger crystals with homogeneous compositions.
Acknowledgments
J.K. acknowledges the support by the Athene Young Investigator program of the Technische Universität Darmstadt, while H.L. acknowledges the support of the Erasmus Mundus International Doctoral School IDS-FunMat (Project 2013-07) and the partial support by the German–French Doctoral School. All authors would like to express their gratitude to Daniel Rytz, Mario Maglione, Dragan Damjanovic, Jürgen Rödel, and Till Frömling for all the fruitful discussions and support over the past years.


 Open access