


Nutritional deficiencies (ND), defined as inadequate intake or absorption of essential nutrients, are a critical global healthcare challenge with wide-ranging implications for individual growth and development(Reference Ridley and Chapple1,Reference Perez-Cano2) . They are a dynamic phenomenon that varies throughout life, and their negative impacts can have long-lasting or even permanent effects on cognition, motor performance, behaviour and overall health(Reference Grantham-McGregor, Walker and Chang3–Reference Wachs6). ND often play a causative role in the development of various diseases and can contribute to their undesirable progression(Reference Massironi, Rossi and Cavalcoli7–Reference Canamares-Orbis, Garcia-Rayado and Alfaro-Almajano9). It is worth noting that ND can predispose individuals to infectious and oncological complications, such as COVID-19(Reference Abdulah and Hassan10,Reference Schloss11) .
Given the significant occurrence and outcomes associated with ND, various governments and organisations have put forth proposals to address this problem. For instance, the United Nations Decade of Action on Nutrition 2016–2025 and the Sustainable Development Goal aimed at ‘eliminating all forms of malnutrition’ highlight the need for comprehensive efforts to combat ND(Reference Baker, Hawkes and Wingrove12–Reference Gausman, Kim and Li14). However, the world is moving away from the goal of ending hunger. A comprehensive exploration of global epidemiological patterns for ND and their complex disorders may be significant in evaluating the existing nutrition landscape and developing appropriate prevention practices.
In this work, we aimed to identify the global burden (incidence, disability-adjusted life years (DALY), prevalence and mortality) of ND based on The Global Burden of Diseases, Injuries, and Risk Factors Study (GBD) 2019. We also identified the years with the greatest change variability in trends for the noted factors. Finally, the global trends were further categorised with different variables (sex, age, cause and sociodemographic index (SDI)).
Methods
Data collection
The Global Burden of Disease (GBD) 2019 database is a global database with epidemiological data on 369 diseases from 1990 to 2019(15). Given that the data released by the GBD database were publicly available, the present study did not require informed patient consent. Data stratified by age, sex, year and geographic area include the number and rate (per 100 000 population) of diverse factors (new cases, DALY, illnesses and deaths)(16). Data collection was achieved through the Global Health Data Exchange (GHDx) query tool, which utilises multiple data sources such as censuses, disease registers and health service use data. The estimation methods include the Cause of Death Integration Model (CODEm), Spatio-Temporal Gaussian Process Regression (ST-GPR) and DisMod-MR tools(Reference Zhang, Liu and Zhao17). Through the GBD database, researchers have access to up-to-date, detailed global epidemiological data on diseases that can help in disease burden assessment and decision-making. DALY is a measure of the overall health burden caused by a disease or health condition(Reference Gao, Wang and Chen18,Reference Daroudi, Akbari Sari and Nahvijou19) . By combining Years Lived with Disability and Years of Life Lost, we can obtain the total number of DALY due to disease or health conditions for the entire population at a specific period.
Case definitions
Based on the International Classification of Diseases and Injuries, 10th revision (ICD-10), ND were categorised into five types: dietary Fe deficiency (ICD10 codes: D50∼D50·9), iodine deficiency (ICD10 codes: E00∼E02), protein-energy malnutrition (ICD10 codes: E40∼E46·9 and E64·0), vitamin A deficiency (ICD10 codes: E50∼E50·9 and E64·1) and other ND (ICD10 codes: D51∼D53·9, E51∼E61·9, E63∼E64 and E64·2∼E64·9)(Reference Diseases and Injuries20,Reference Han, Ding and Lu21) . This classification system is widely recognised and used in the field of healthcare to classify and code diseases and health conditions. By utilising ICD-10 codes, we aimed to ensure consistency and comparability in our study. The five specific aetiologies (dietary Fe deficiency, iodine deficiency, protein-energy malnutrition, vitamin A deficiency and other ND) were selected based on their prevalence and significance in public health. Exclusion criteria were applied during the study design and data collection phases to ensure the validity and reliability of GBD findings. These criteria were based on the specific research objectives and aimed to minimise confounding factors. Meanwhile, it is important to provide information on the characteristics and health problems of the different age groups. The study population was divided into four age groups: 0–14, 15–49, 50–74 and 75+ years. The 0–14 age group usually covers the child and adolescent population, where there are specific health needs and developmental issues(Reference Tan, Yang and Chen22). The 15–49 age group may be a critical period for fertility and reproductive health, while the 50–74 age group may have a high prevalence of common diseases in middle age and older age(Reference Morentin, Ballesteros and Callado23,Reference Mooy, Grootenhuis and de Vries24) . The 75 and older age group typically includes a higher risk of chronic disease and age-related health problems. Moreover, all countries and territories were divided into five parts, including low, low-middle, middle, high-middle and high SDI, based on a SDI from the Institute for Health Metrics and Evaluation (IHME)(Reference Jewell, Lewnard and Jewell25,Reference Oguoma, Coffee and Alsharrah26) .
Statistical analysis
First, the age-specific rates and their average annual percentage changes (AAPC) were used to explore global trends in ND. AAPC, as a statistical indicator, was used to describe the change rate of a trend within a specific time interval based on the linear regression analysis(Reference Iannuzzi, King and Leong27). By calculating the annual percentage change (APC) in a dataset, these APC are then weighted and averaged to give a single value that represents the average change rate across the time interval. AAPC is commonly applied to understand changes in trends and predict future directions. AAPC can signify the percentage change (increase, decrease or no change) from year to year. AAPC in multiple periods (1990–1999, 2000–2009, 2010–2019 and 1990–2019) were also accessed.
Next, we employed joinpoint regression analysis to identify trends in indicators over time and fitted the simplest model by adding joinpoints(Reference Kim, Fay and Feuer28). By analysing each joinpoint with the Monte Carlo permutation method, a final model was selected that best fit the data to identify the most significant years in the trend of change based on the Weighted Bayesian Information Criterion methods.
Finally, global trends were stratified by age group, sex, and SDI, and regional and national trends were also reported. The same AAPC methodology was used for all statistical analyses, and multiple software tools (R version 4.2.3 and Joinpoint Regression Program version 4.9.1.0) were used for data analysis and presentation of results. P < 0·05 (two-sided) were deemed statistically significant(Reference Greenland, Senn and Rothman29).
Results
Global trends
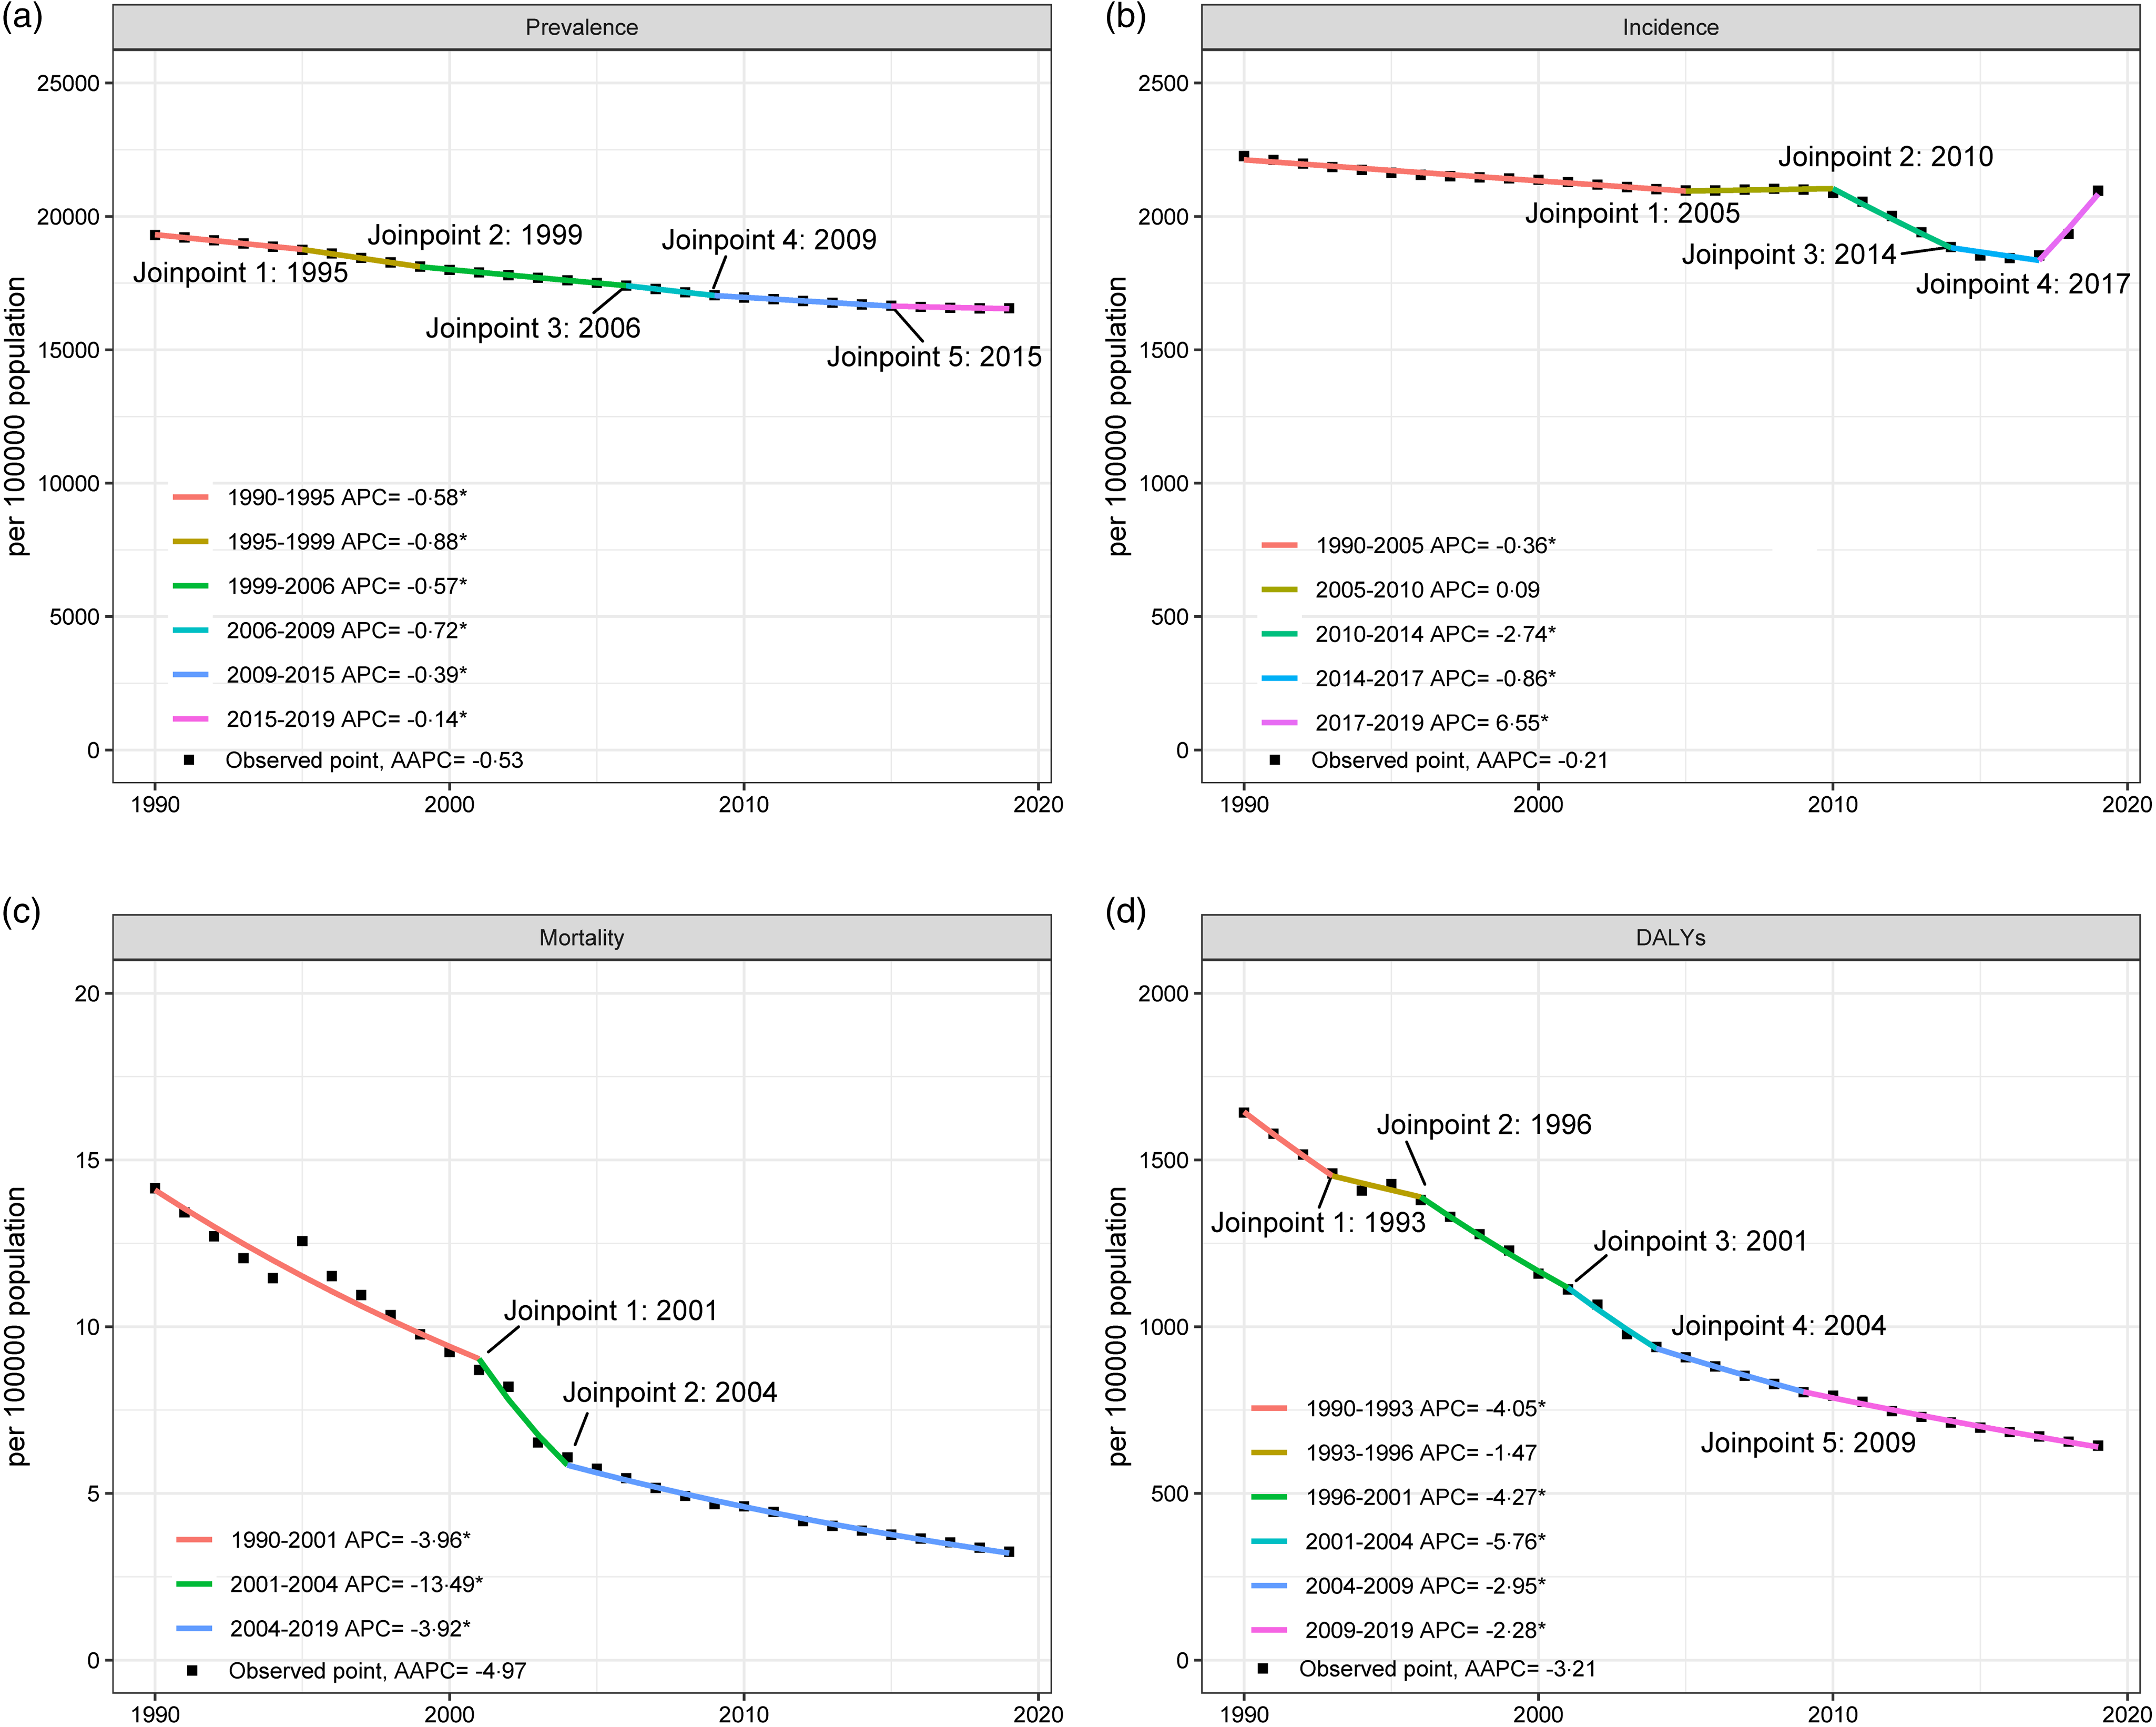
Globally, the ND incidence generally decreased between 1990 and 2019 (AAPC = –0·21 (95 % CI –0·31, –0·11), with the most significant decreasing period occurring between 1990 and 1999 (AAPC = –0·36 (–0·39, –0·33), Table 1). Incidence counts of ND increased between 1990 and 2019; however, the changes in incident rates were positive. Altogether, the incident rate of ND decreased from 2226·2 (1850·4–2689·6) per 100 000 population in 1990 to 2096·3 (1766·1–2472·4) per 100 000 population in 2019, a decrease of 5·8 % (Table 2). The joinpoint regression determined a considerable change in the incidence of ND in 2005, 2010, 2014 and 2017 (Fig. 1). Meanwhile, DALY (AAPC = –3·21 (–3·45, –2·96)), prevalence (AAPC = –0·53 (–0·55, –0·51)) and mortality rate (AAPC = –4·97 (–5·75, –4·19)) of ND have decreased notably. The DALY, prevalence and mortality rate decreased by 60·8 %, 14·2 % and 76·8 % between 1990 and 2019, respectively (Table 2, online Supplementary Table S1).
Global AAPC in prevalence, incidence, mortality and DALY of ND (95 % CI)

AAPC, average annual percentage change; DALY, disability-adjusted life years; ND, nutritional deficiencies.
Incidence and DALY of ND at global and regional levels
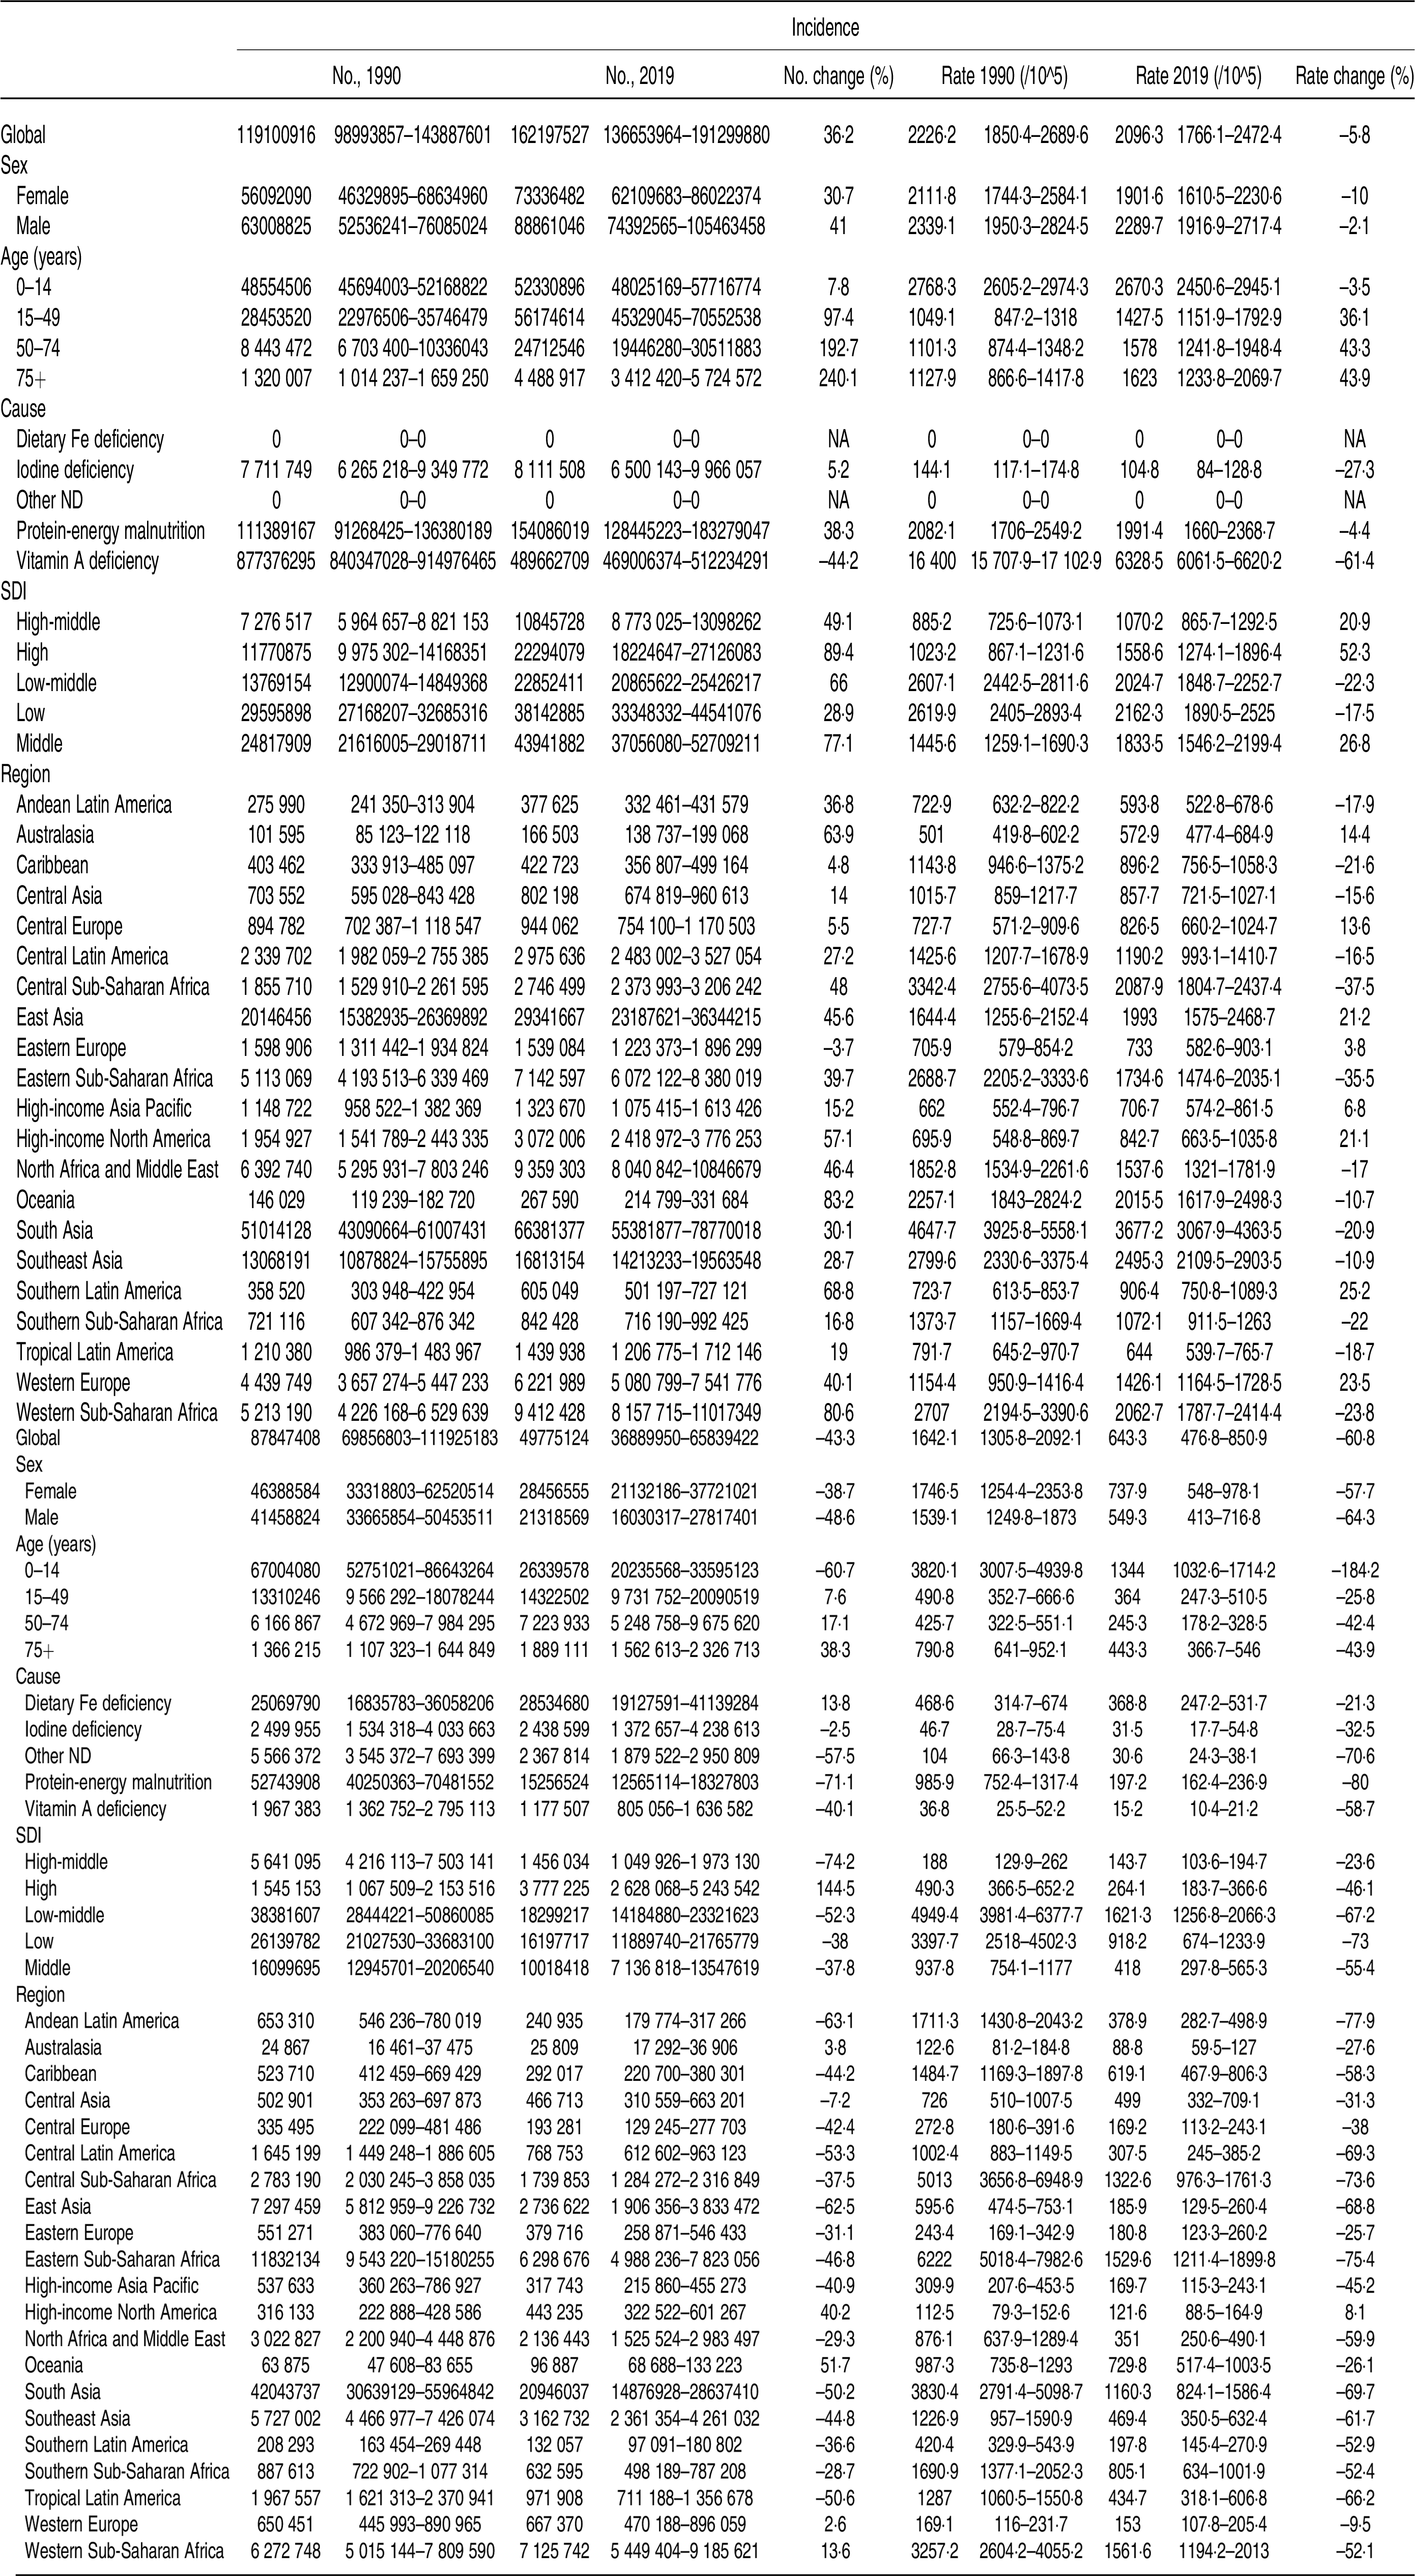
DALY, disability-adjusted life years; ND, nutritional deficiencies; SDI, sociodemographic index.
Joinpoint regression analysis of global trend for ND from 1990 to 2019. (a) Prevalence, (b) incidence, (c) mortality and (d) DALY. ND, nutritional deficiencies; DALY, disability-adjusted life years.
Global trends by sex
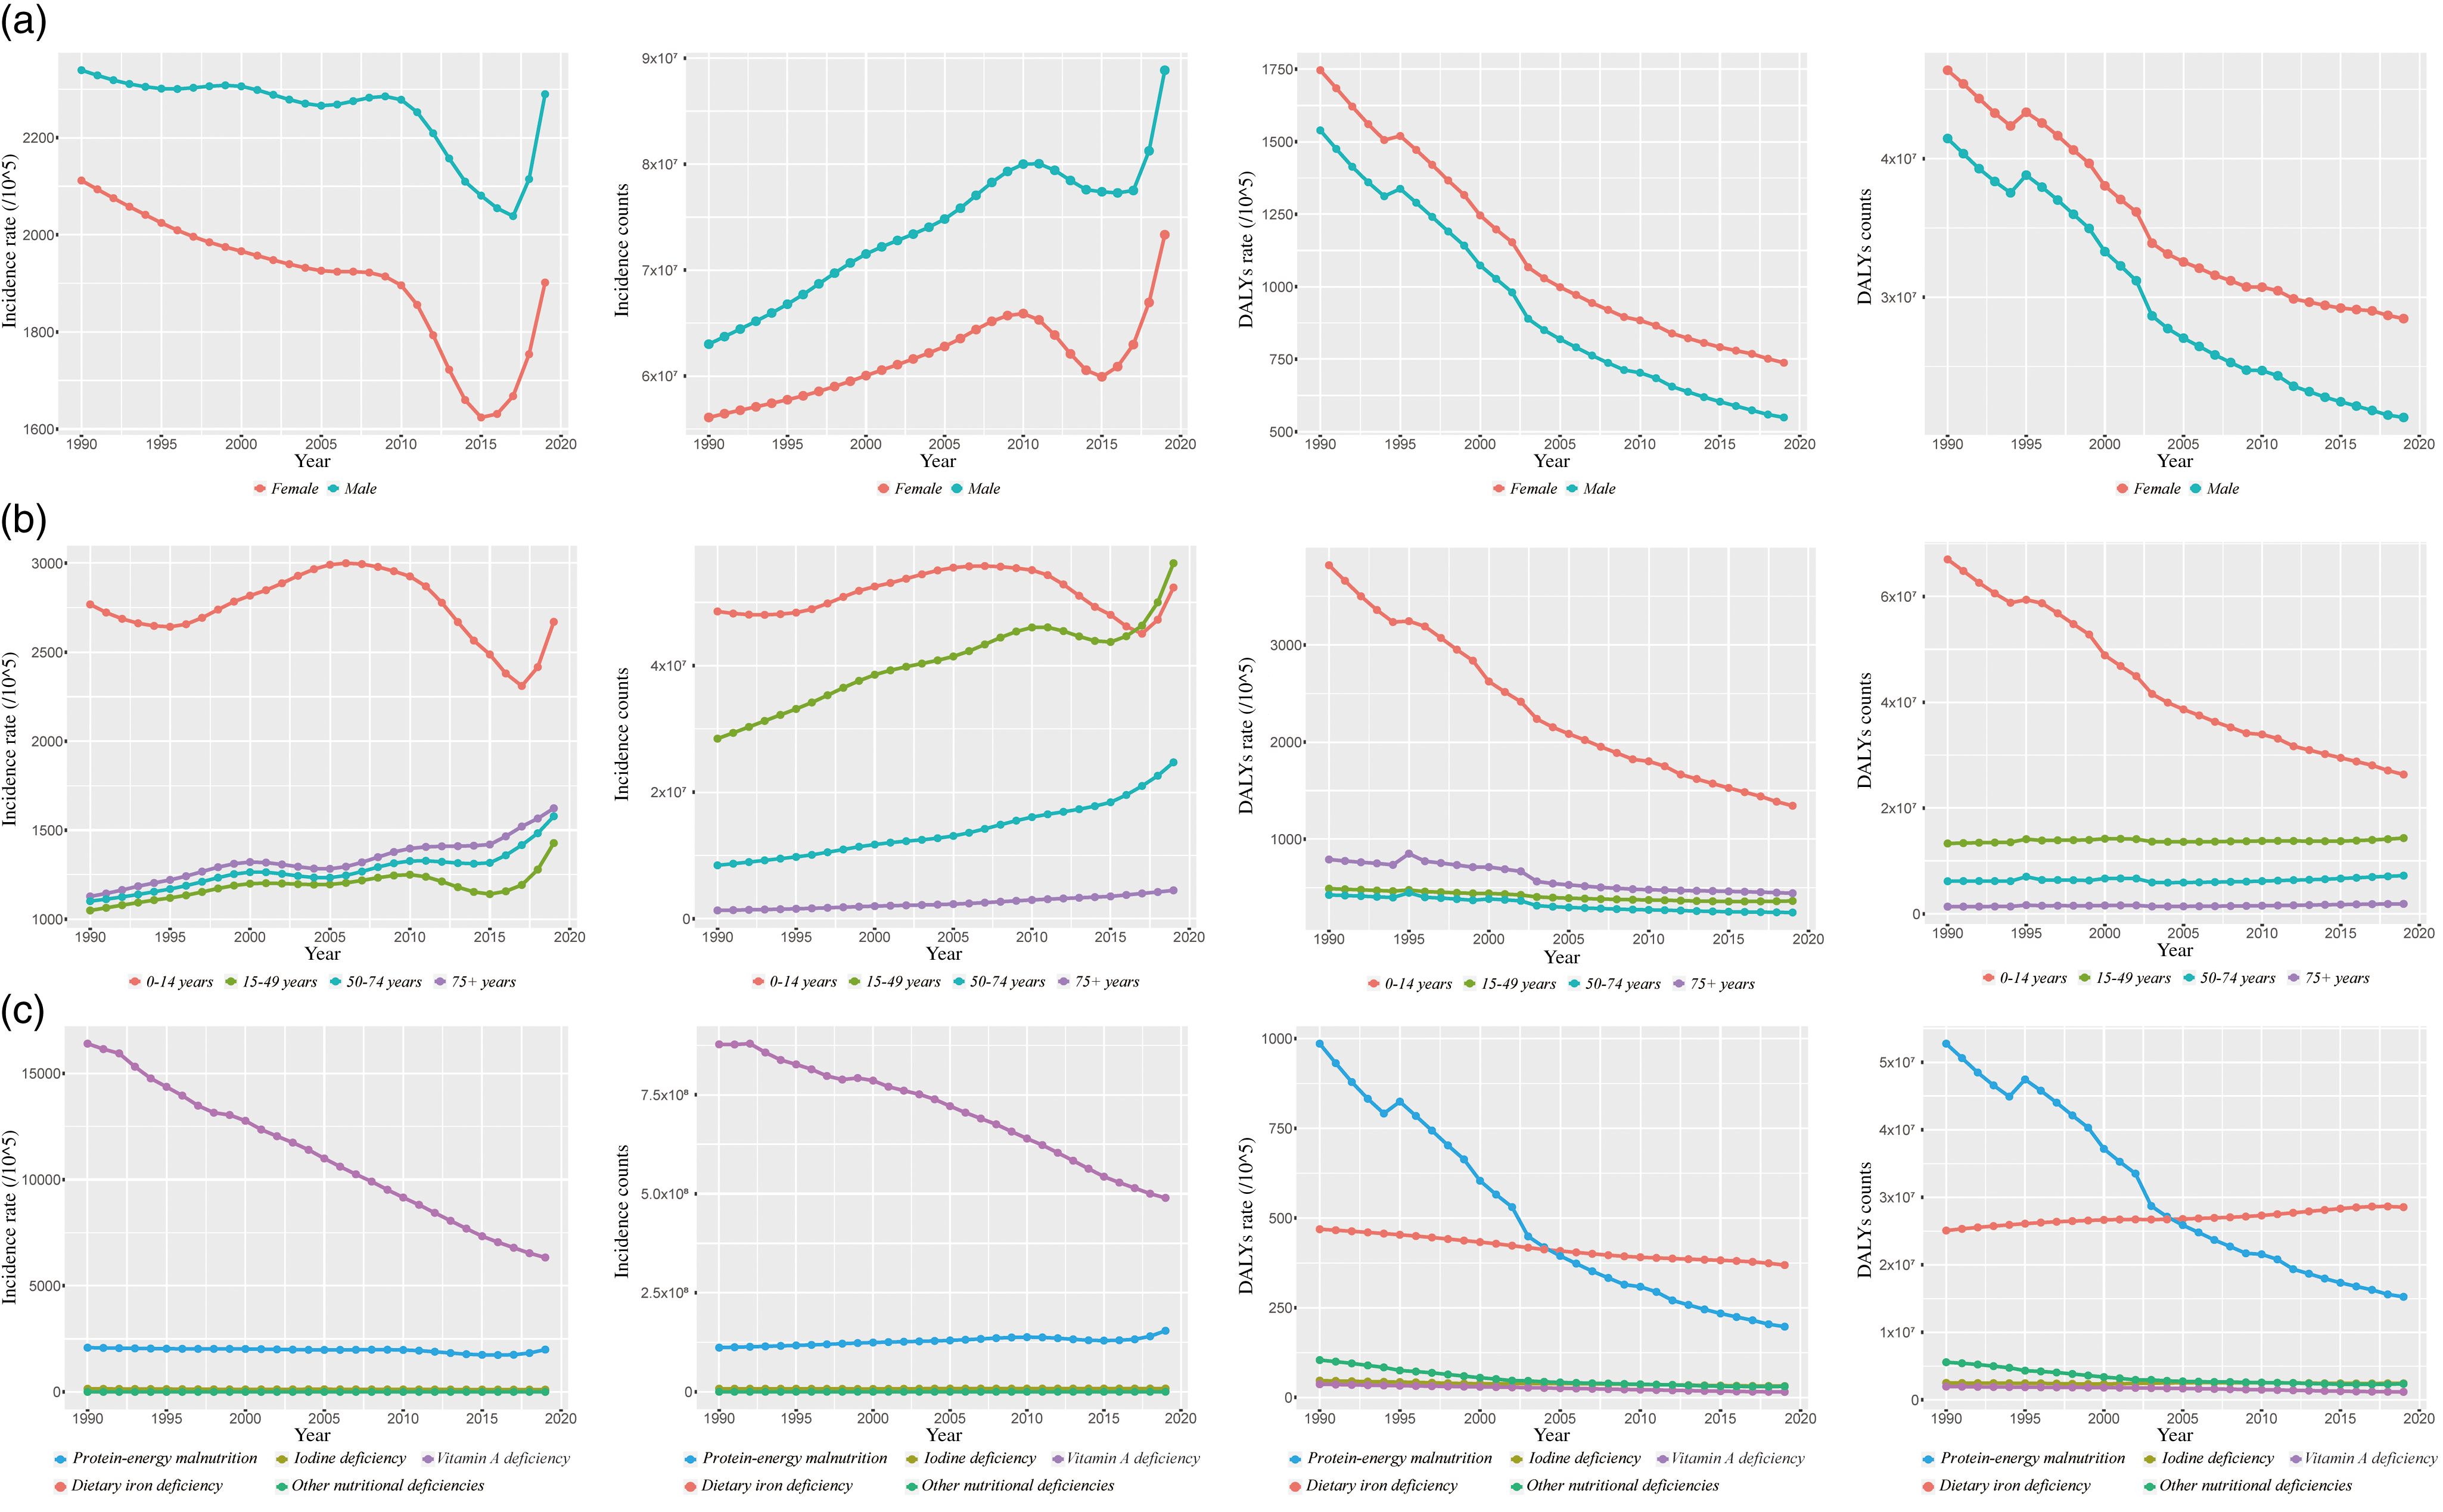
Although female (AAPC = −0·36, P < 0·001) incidence rates decreased between 1990 and 2019, a similar pattern has not been observed in male (AAPC = −0·07, P = 0·137; Table 3). From 1990 to 2019, the incident cases among males and females increased by 41 % and 30·7 %, respectively, with an overarching trend of rising, falling and rising again (Table 2, Fig. 2). Meanwhile, the incident rates present a decreasing and then increasing trend for both sexes, with the trough located in 2015. Notably, the increasing trend in ND among males and females has become more pronounced since 2015 (Fig. 2).
Subgroups AAPC in incidence and DALY of ND (95 % CI)
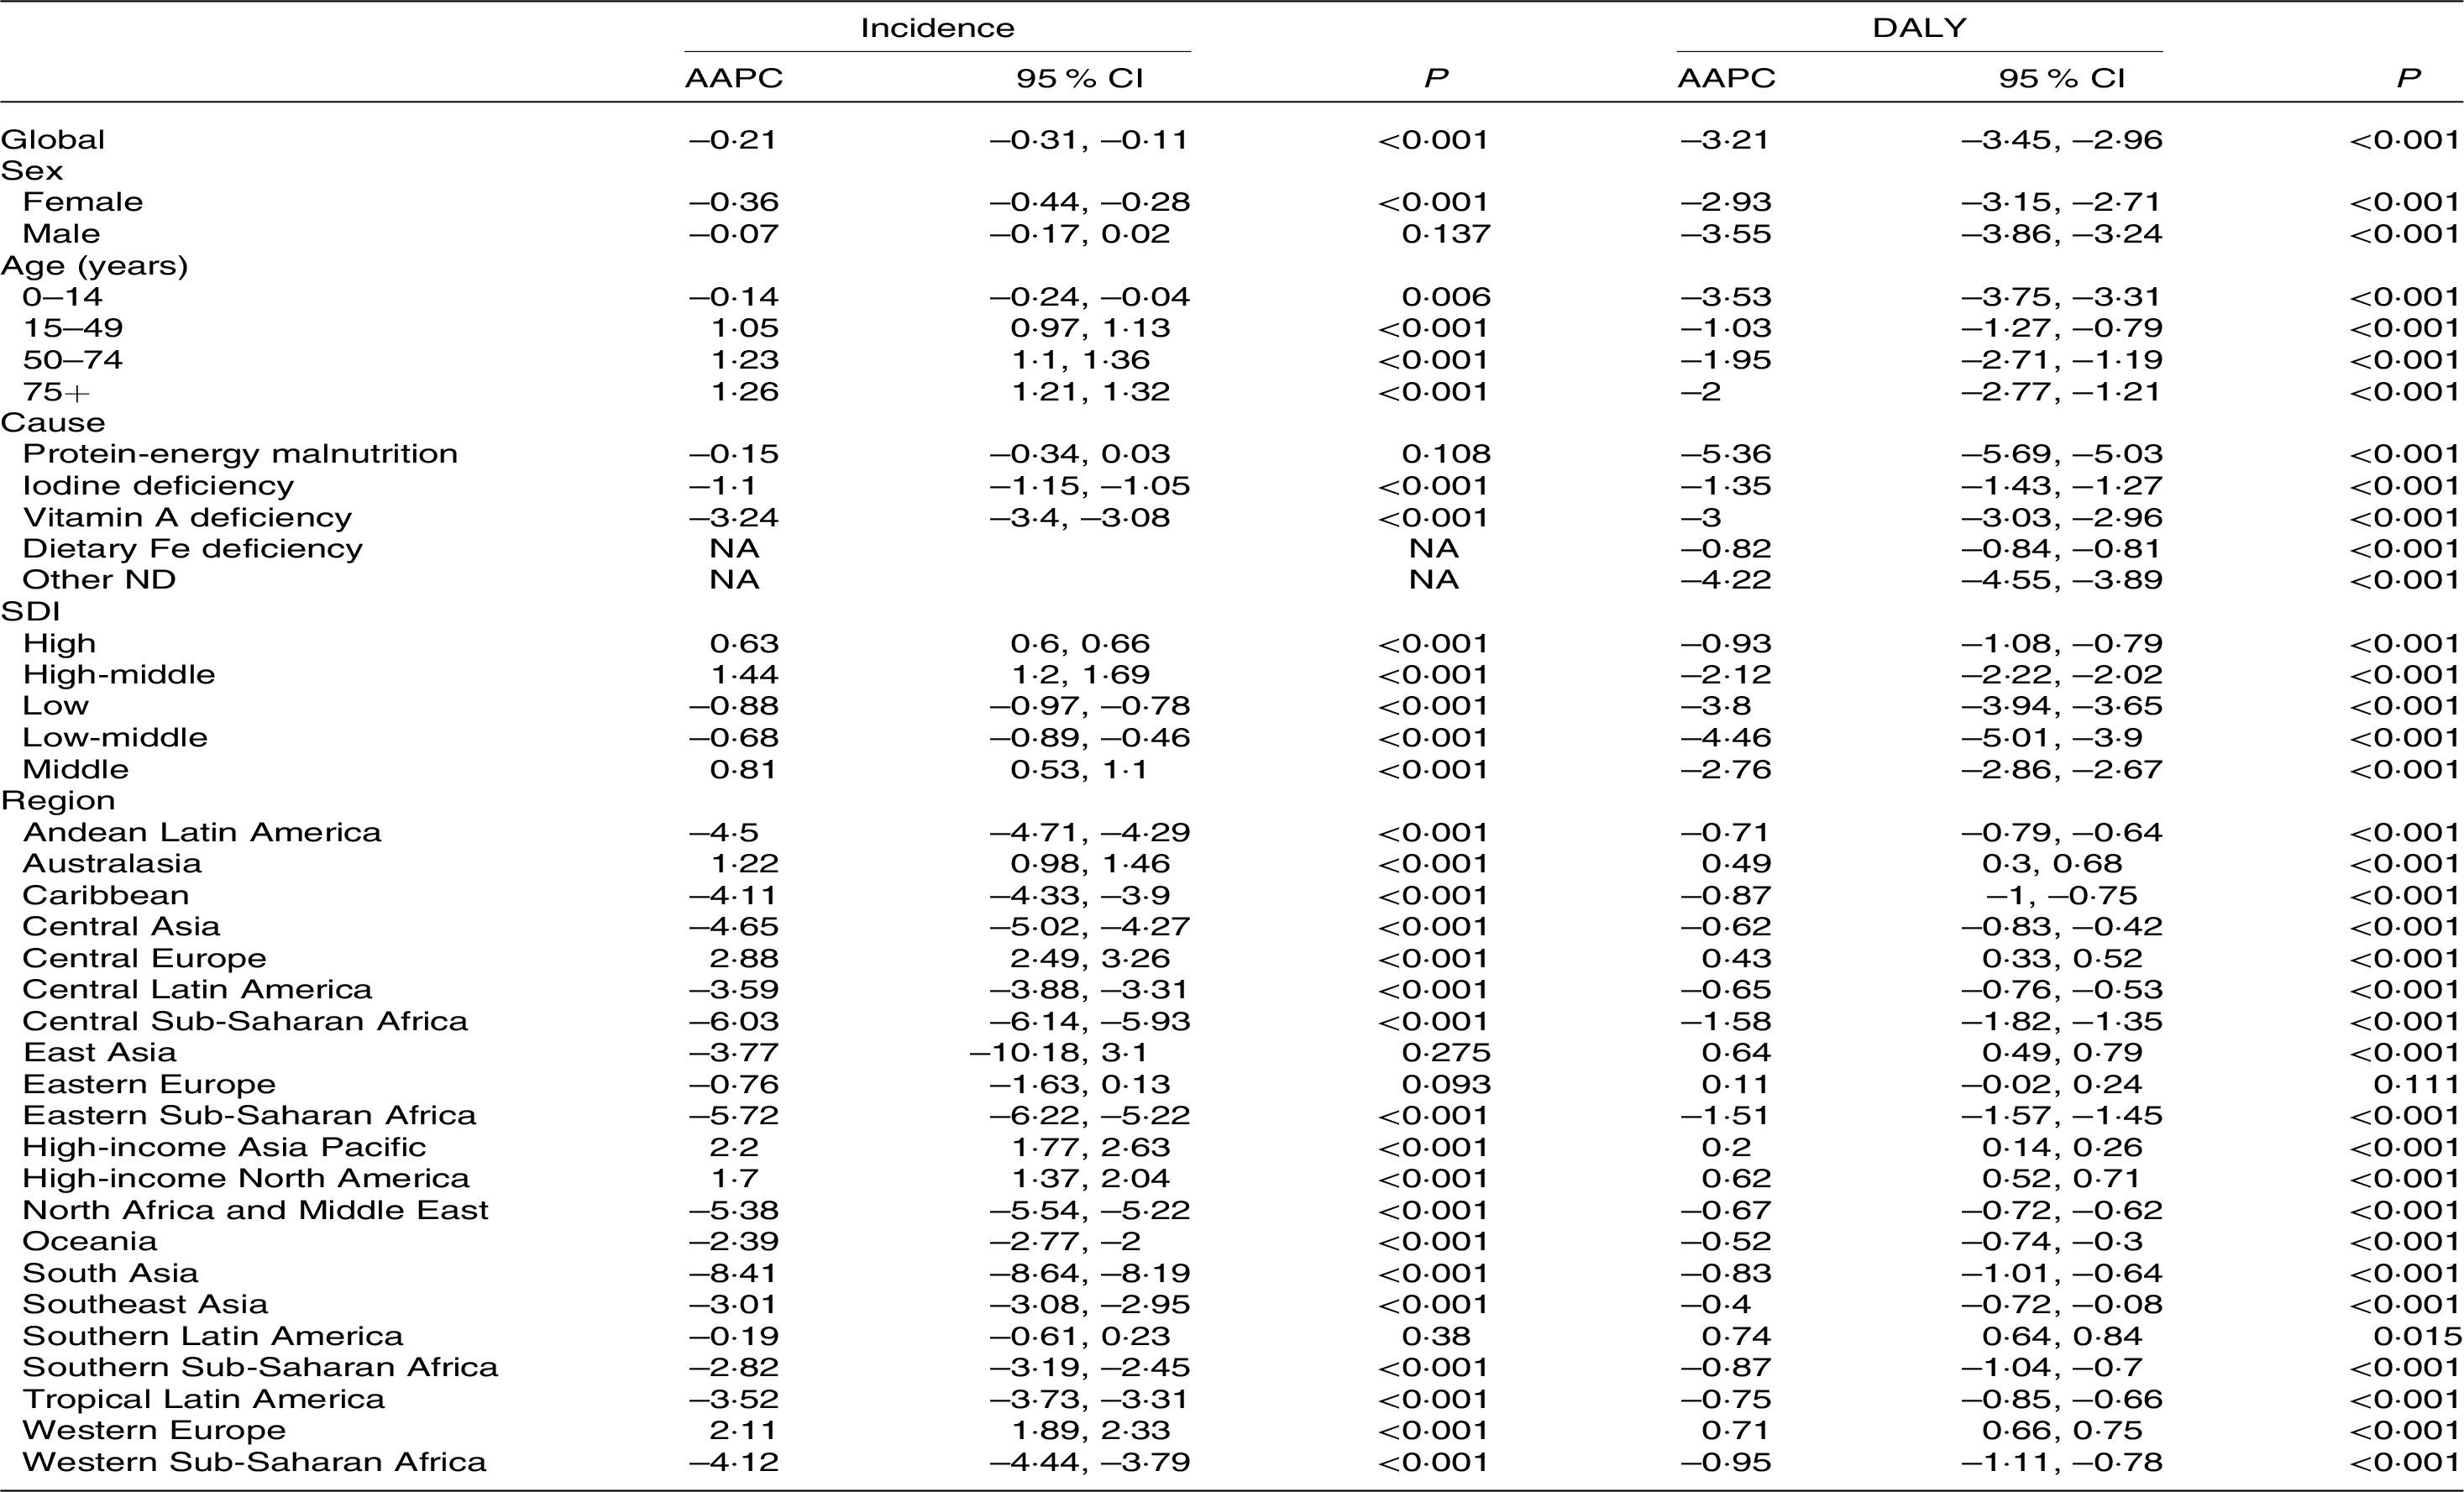
AAPC, average annual percentage change; DALY, disability-adjusted life years; ND, nutritional deficiencies; SDI, sociodemographic index.
Incidence and DALY of ND in subgroups from 1990 to 2019. (a) Sex, (b) age and (c) causes. DALY, disability-adjusted life years; ND, nutritional deficiencies.
Both the number and rate of DALY dropped dramatically, with lower declines for males than for females (AAPC − 3·55 (95 % CI − 3·15, −2·71) v. −2·93 95 % CI (–3·15, −2·71), Table 3). Similarly, the prevalence rate and mortality of ND fell markedly in both sexes, more so for males than for females (online Supplementary Table S3 and Fig. S1).
Global trends by age group
From 1990 to 2019, the incident rate in children and younger adolescents aged 0–14 years was remarkably greater than in other age groups, reaching 2670·3 per 100 000 population in 2019 (Table 2). Meanwhile, there is also a relatively high incident number among children and adolescents (Fig. 2). The incident trend showed a significant increase in all age groups apart from children and adolescents (AAPC = −0·14, P = 0·006; Table 3). The AAPC in the young adults (15–49 years), older adults (50–74 years) and older people (75+ years) groups were 1·05, 1·23 and 1·26, respectively (Table 3). However, the number of ND in children and adolescents (48554506 in 1990 to 52330896 in 2019), young adults (28453520 in 1990 to 56174614 in 2019), older adults (8 443 472 in 1990 to 24712546 in 2019) and older people (1 320 007 in 1990 to 4 488 917 in 2019) increased by 7·8 %, 97·4 %, 192·7 and 240·1, respectively (Table 2, Fig. 2).
The DALY numbers for the children and adolescents group have decreased, while the other groups have increased. The opposite trend was observed in the DALY rate (Table 2). Notably, the AAPC of DALY, prevalence and mortality in all age groups significantly dropped (Table 3, online Supplementary Table S2 and Fig. S1).
Global trends by causes
As presented in Table 2 and Fig. 2, vitamin A deficiency is the most predominant subtype of ND, with a decreasing trend in its incident number and incident rate from 1990 and 2019. Protein-energy malnutrition was another undesirable type of ND, with a serious global burden for DALY (Table 2, Fig. 2). The DALY rates decreased in all-cause subtypes, among which protein-energy malnutrition (985·9 in 1990 to 197·2 in 2019) declined most significantly by 80 % (Table 2). Additionally, the prevalence and deaths of different cause subtypes were presented in online Supplementary Table S1 and S2.
Global trends by sociodemographic index
The incidence rates of ND decreased in low (17·5 %) and low-middle SDI (22·3 %) areas while increasing in middle and above SDI areas (Table 2). Meanwhile, the AAPC for ND in middle, middle-high and high SDI areas was 0·81, 1·44 and 0·63 respectively, while the AAPC for ND in low and low-middle SDI areas was −0·88 and −0·68 (Table 3). Nevertheless, in 2019, the incident rate of ND per 100 000 population remains lower in middle and above SDI areas than in low or low-middle SDI areas. Moreover, the incident number of ND in 2019 has increased in all SDI regions compared with 1990 (Table 2).
DALY rates showed a decreasing direction in all SDI areas (Table 2), and the AAPC of incidence rate in all SDI areas were also decreasing (all AAPC < 0, all P < 0·001, Table 3). Notably, the high SDI area was the only area where the incident number of ND increased (144·5 %, Table 2). Similarly, prevalence rates indicated a decreasing direction in all SDI areas; the middle-high SDI area is the only area with increased mortality (online Supplementary Table S1).
Regional trends
The incident number of ND is increasing in all regions except Eastern Europe from 1990 to 2019 (Table 2). And South Asia demonstrated the greatest incident number (66381377 (95 % CI 55381877, 78770018)) and incident rate (3677·2 (95 % CI 3067·9, 4363·5) per 100 000 population) of ND in 2019. However, ND have increased the most in Oceania (83·2 %), from 146 029 in 1990 to 267 590 in 2019 (Table 2). And an increase in incident rates was observed primarily in Southern Latin America (25·2 %). The joinpoint regression analysis demonstrated that only five of all regions presented a clear rise in incident rate, namely Australasia (AAPC = 1·22), Central Europe (AAPC = 2·88), High-income Asia Pacific (AAPC = 2·2), High-income North America (AAPC = 1·7) and Western Europe (AAPC = 2·11, Table 3).
Five regions (Australasia, High-income North America, Oceania, Western Europe and Western Sub-Saharan Africa) have experienced an increase in the DALY number in the past 30 years, and the only region where the DALY rate has increased is High-income North America (8·1 %, Table 2). Moreover, the DALY rate declined in the majority of these regions from 1990 to 2019 (AAPC < 0, P < 0·001, Table 3), most notably in Central Sub-Saharan Africa (AAPC = –1·58) and Eastern Sub-Saharan Africa (AAPC = –1·51). The regional prevalence and mortality were demonstrated in online Supplementary Table S1 and Table S2.
National trends
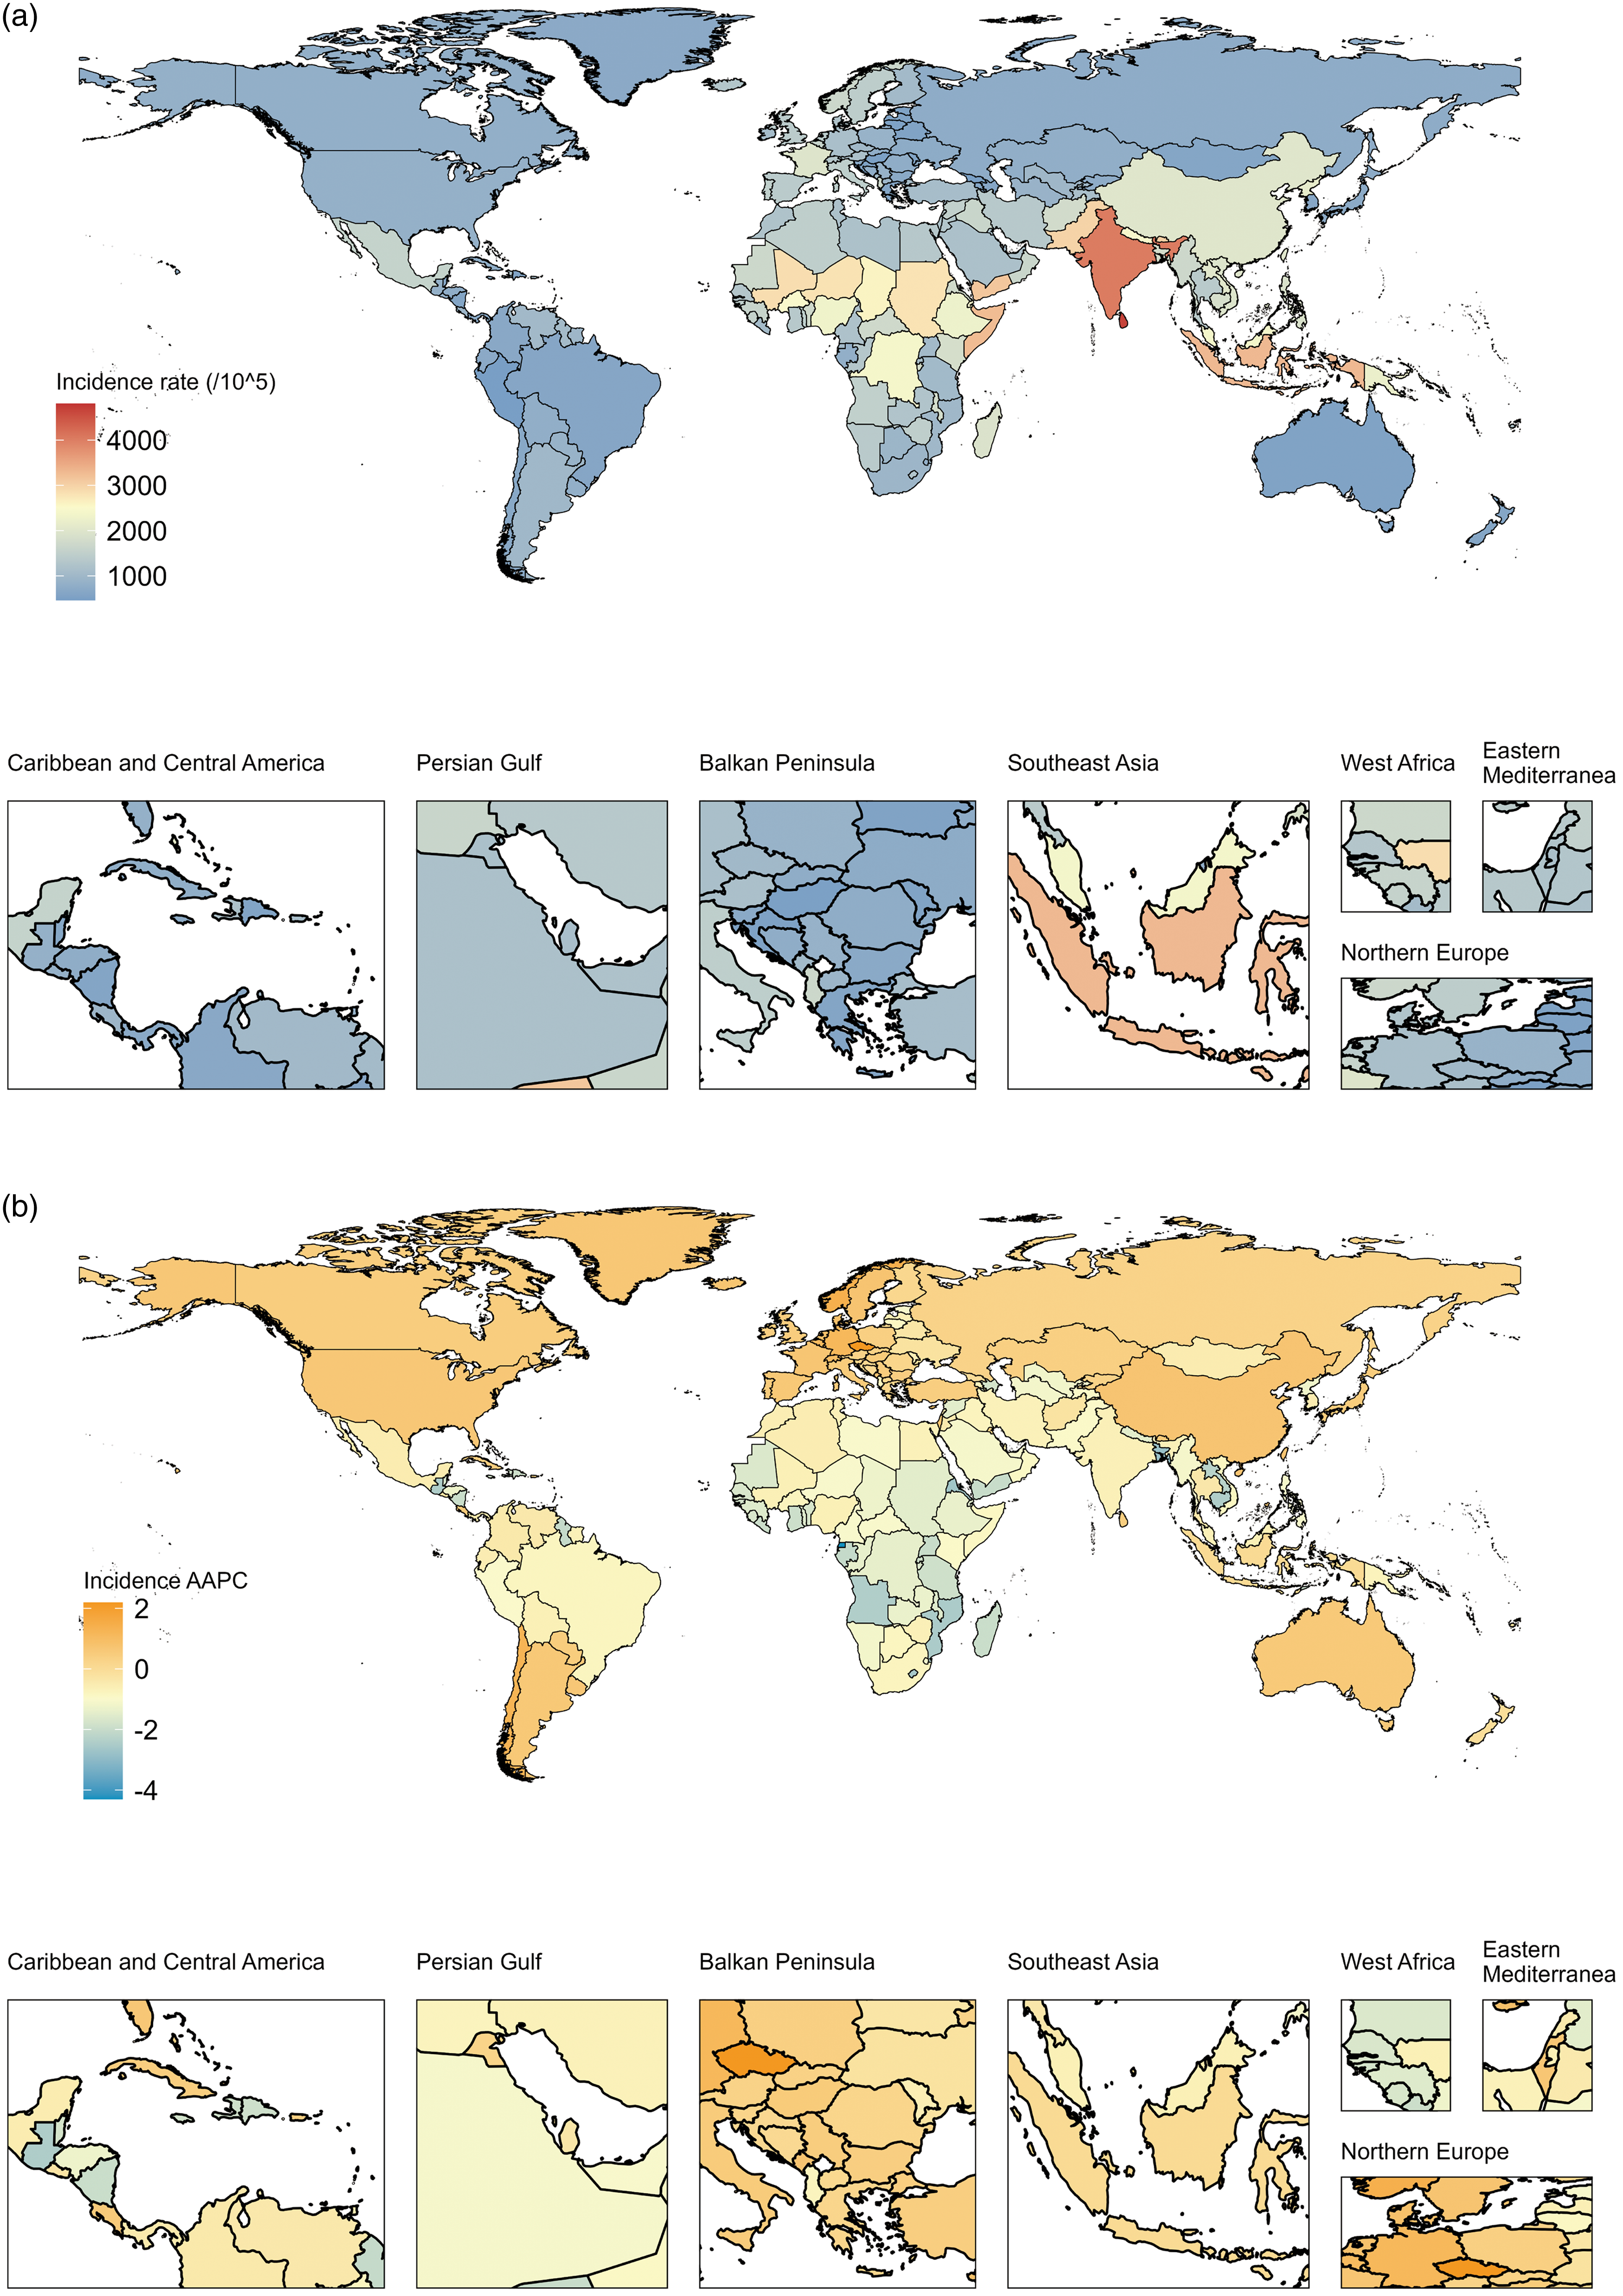
As shown in Fig. 3, the highest incident rates of ND in 2019 were in Maldives (4802·7 (95 % CI 3936·3, 5785·3) per 100 000 population), Sri Lanka (4679·5 (95 % CI 3851·1, 5635·8) per 100 000 population) and India (4030·4 (95 % CI 3323·1, 4817) per 100 000 population). Meanwhile, the most predominant increase in ND’s incident rate from 1990 to 2019 was observed in Czechia (AAPC = 2·2, P < 0·001). There has been an over 200 % rise in the incident number in three countries – Qatar (482 %), the United Arab Emirates (266·1 %) and Afghanistan (215·2 %) nearly 30 years (online Supplementary Fig. S2).
Geographical distribution of ND incidence in 204 countries and territories. (a) Incidence rate of ND in 2019, (b) AAPC in incidence rate of ND between 1990 and 2019. AAPC, average annual percentage change; ND, nutritional deficiencies.
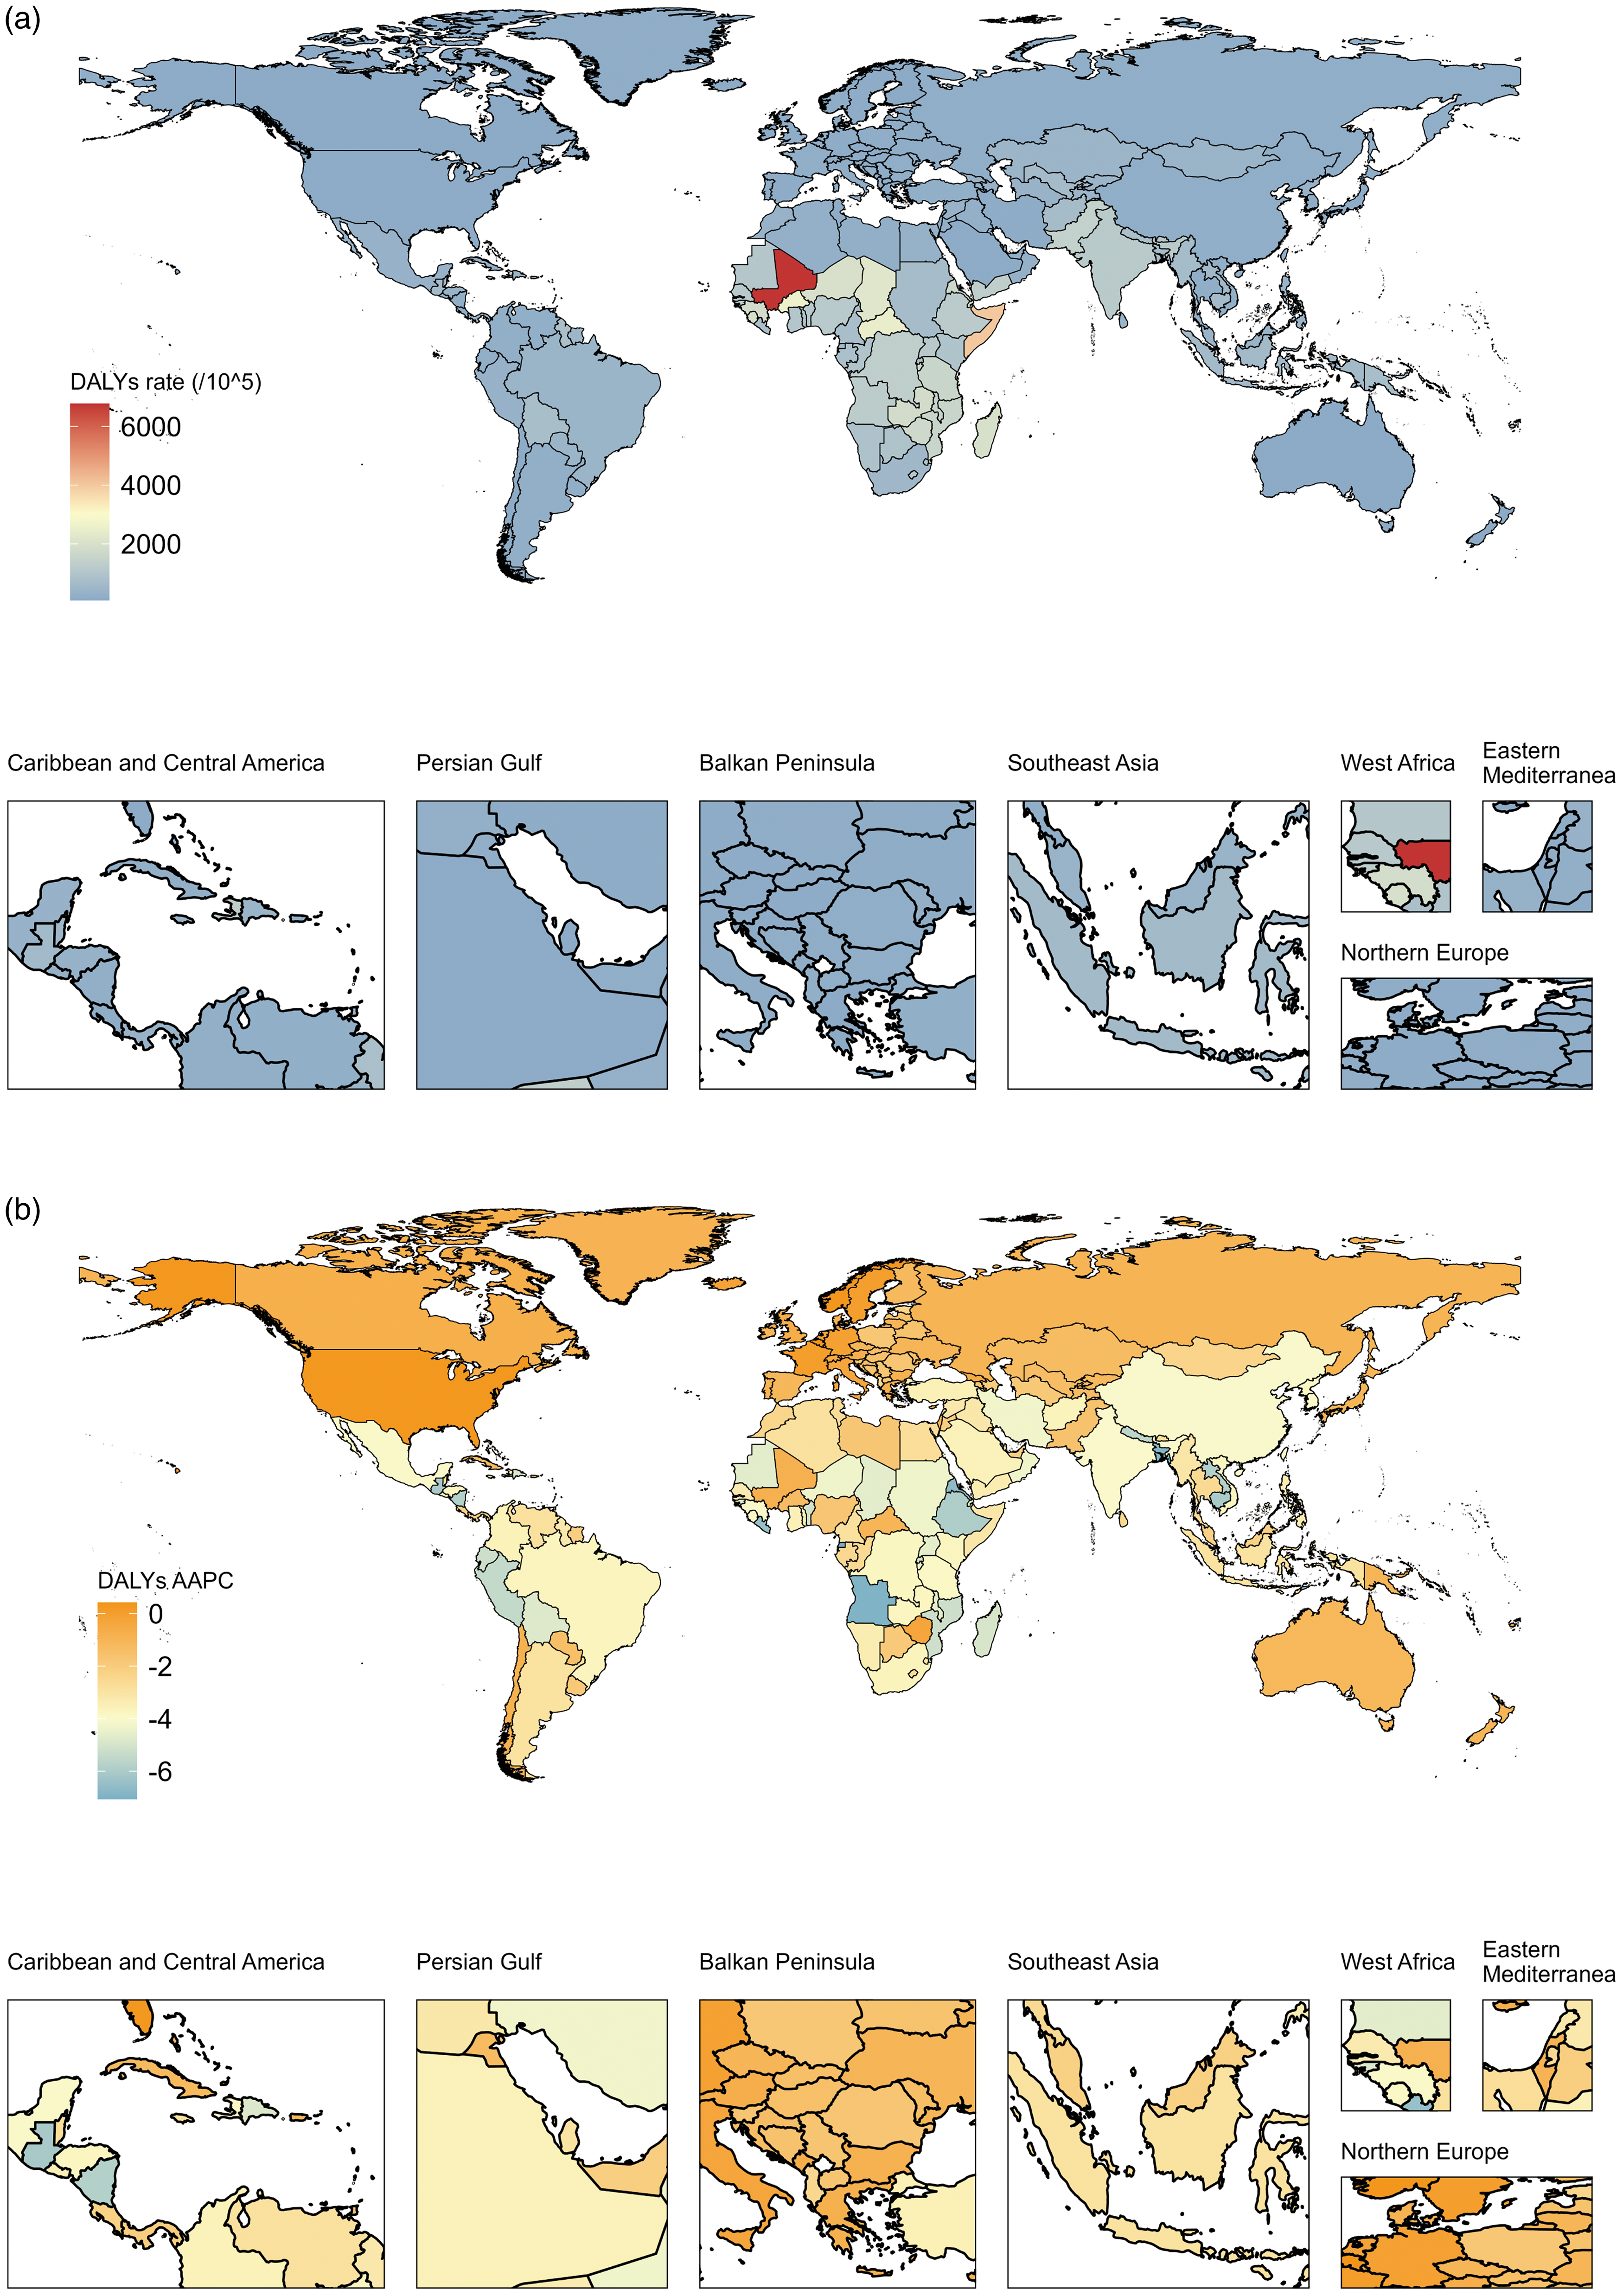
Evidently, the country with the greatest DALY rate for ND in 2019 was Mali (6770·1 (95 % CI 4916, 9285) per 100 000 population; Fig. 4). Of the 204 countries and territories, only a few have recorded an increase in DALY rates from 1990 to 2019, while others have recorded a decrease or no significant change. These countries with increased DALY rates were Belgium (AAPC = 0·42, P < 0·001), Norway (AAPC = 0·36, P < 0·001), the USA (AAPC = 0·29, P < 0·001) and France (AAPC = 0·02, P < 0·001), respectively. And Qatar presented the largest increase in the DALY rate (170·6 %) between 1990 and 2019 (online Supplementary Fig. S2). Furthermore, the additional information for the prevalence and mortality of ND between 1990 and 2019 was presented in online Supplementary Fig. S3–S5.
Geographical distribution of ND DALY in 204 countries and territories. (a) DALY rate of ND in 2019, (b) AAPC in DALY rate of ND between 1990 and 2019. ND, nutritional deficiencies; DALY, disability-adjusted life years; AAPC, average annual percentage change.
Trends between ND and SDI
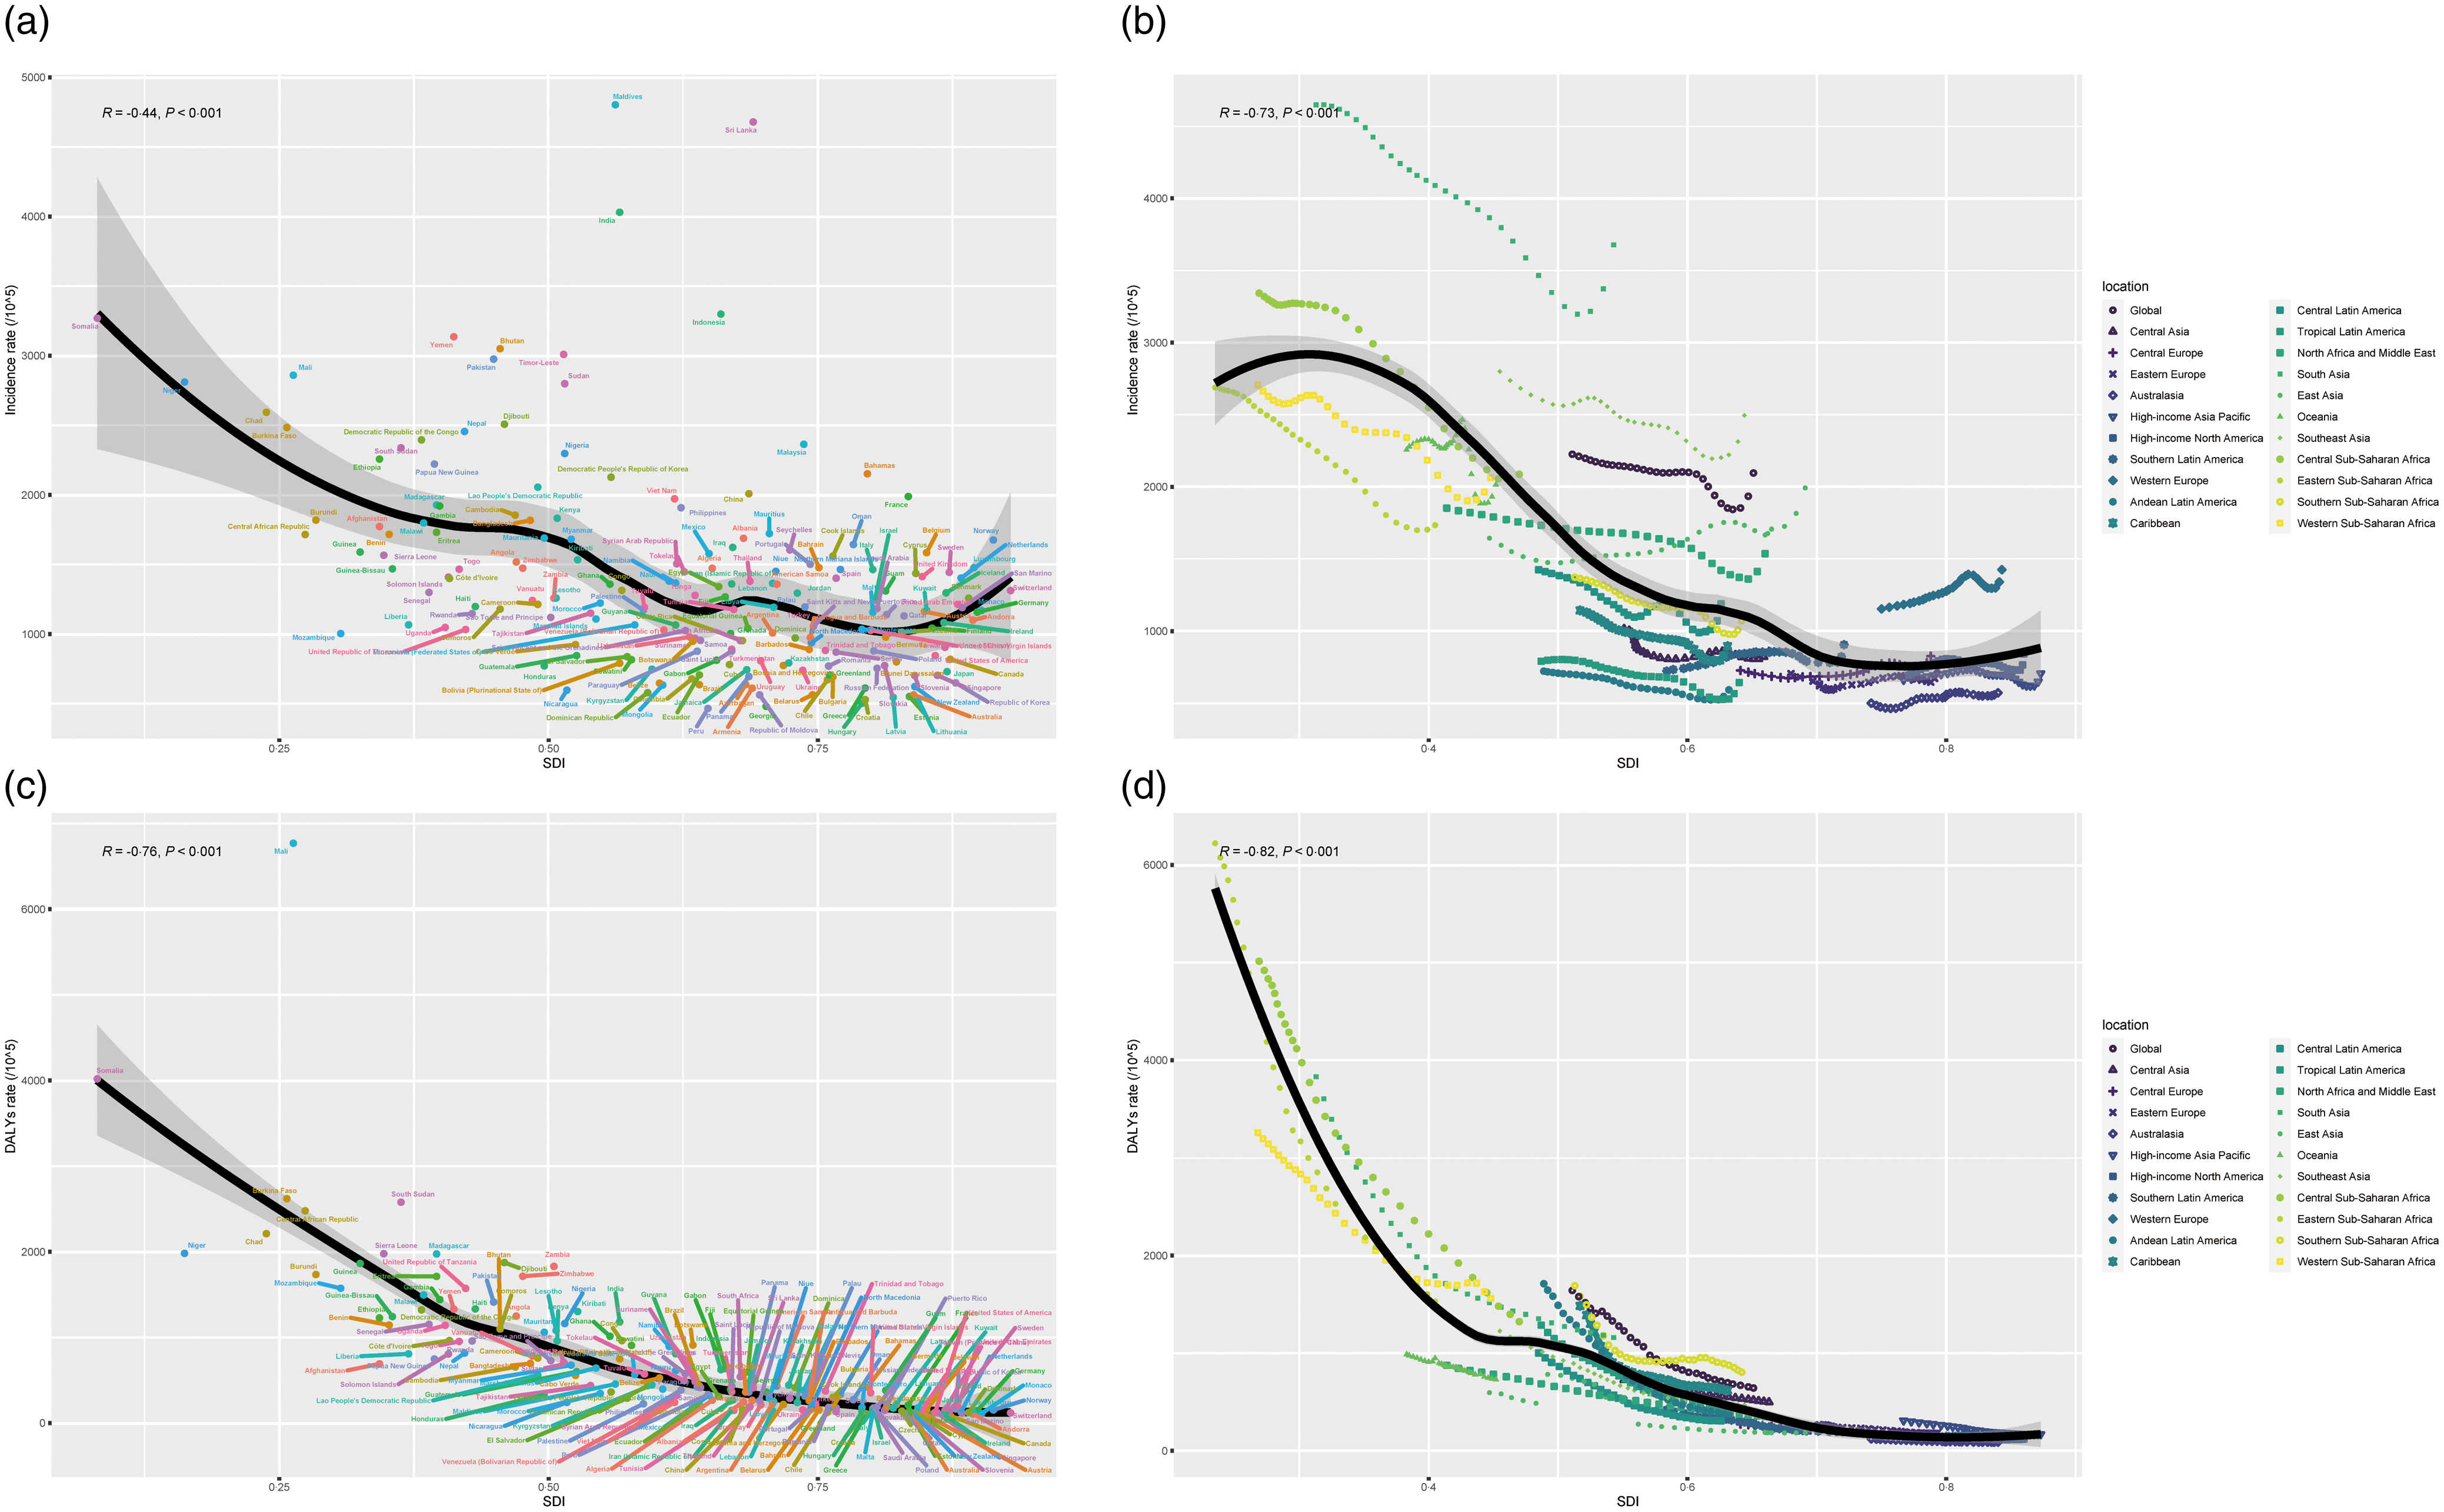
Globally, incidence, DALY, prevalence and mortality presented a striking negative association with SDI (R < 0, P < 0·001; Fig. 5, online Supplementary Fig. S6). The incidence of ND was clearly superior in lower SDI areas, particularly in sub-Saharan Africa (Fig. 5). And the greatest incident rate was observed in South Asia; correspondingly, Maldives, Sri Lanka and India were also observed to have the highest incidence of ND (Fig. 5). The DALY rate has been declining across all regions annually, with lower SDI regions declining more rapidly, and the similar landscape was observed in the relationship between prevalence rate and SDI. Furthermore, as the low SDI regions, sub-Saharan Africa and South Asia presented the highest mortality rates for ND (online Supplementary Fig. S6).
Global, twenty-one regions, and 204 countries and territories burden of ND by SDI, from 1990 to 2019. (a) Incidence per 100 000 population in global and 204 countries and territories, (b) incidence per 100 000 population in global and twenty-one regions, (c) DALY per 100 000 population in global and 204 countries and territories and (d) DALY per 100 000 population in global and twenty-one regions. For each region, points from left to right depict estimates from each year from 1990 to 2019. ND, nutritional deficiencies; SDI, sociodemographic index; DALY, disability-adjusted life years.
Discussion
To date, this is the first research to discuss changes in the incidence, DALY, prevalence and mortality of ND from 1990 to 2019 at global, regional and national levels. The incident rates of ND showed a falling–rising trend, while the DALY rates have declined in the past 30 years. And the enormous incidence number of ND shows that it remains an inescapable global threat. Meanwhile, the incident rates of ND for males are significantly greater than for females, and there is a significant increase in incidence in all age groups (AAPC > 0) except for children and younger adolescents aged 0–14 years. For available aetiology, the incident rate has decreased since 1990. We also observed a negative association between SDI and incident rates. Interestingly, except for low and low-middle SDI areas, the incident rate has increased in other areas. Reassuringly, DALY, prevalence and mortality rates are largely dropping for all sexes, ages, causes and regions (AAPC < 0), albeit to varying degrees.
The number of people suffering from ND is growing in parallel with the global population, and all countries and territories continue to struggle with any form of ND(Reference Tyczewska, Twardowski and Wozniak-Gientka30). Incident numbers of ND increased from 119100916 in 1990 to 162197527 in 2019, an increase of 36·2 %. The risk of ND is greatest in males, infants, children and adolescents. The majority of child deaths are directly or indirectly attributable to ND worldwide(Reference Bhutta, Berkley and Bandsma31). For children and younger adolescents aged 0–14 years, the incidence, DALY, prevalence and mortality rates of ND in 2019 were all decreasing compared with 1990, and this finding was closely aligned with persistent investment in this cohort worldwide. Encouragingly, there is a downward trend in mortality for all age subgroups, and a similar trend was observed in both sexes. Not only is it perfectly feasible to improve nutrition, but it is also sustainable and cost-effective. However, the emergence of diverse crises, including wars, epidemics and droughts, is creating the conditions for a significant increase in severe global ND(Reference Correia, Tappenden and Malone32).
Also, national and regional differences were observed in the popularisation of ND. Nationally, developing countries are the areas most affected by ND, and the morbidity of ND in India was markedly higher than in other countries. Severe ND lead to a weakened immune function(Reference Collins and Belkaid33,Reference Wensveen, Valentic and Sestan34) , and this phenomenon may be responsible for the prevalence of infectious diseases in India. We found that DALY and deaths associated with ND are particularly common in Mali. At the national level, nutrition interventions are one of the optimal development investments every country can make. However, this initiative is constrained by various factors, such as economic status, political stability or climate change(Reference Taylor, Perez-Ferrer and Griffiths35–Reference Menber, Gashaw and Belachew37). Regionally, we observed that the incidence of ND is highest in Asia, but fastest growing in Africa. South Asia remains the ‘hardest hit’ by ND, with about 3677 per 100 000 population, almost three times as many as in sub-Saharan Africa. Meanwhile, it is notable that ND in Asia and Africa indicate a significant year-on-year decrease. Poverty exacerbates the development of ND, and people living in poverty (low or low-middle SDI areas) are more likely to be affected by ND. Additionally, ND increase healthcare costs, reduce productivity and slow economic growth, which can create a vicious cycle between poverty and poor health status(Reference Christian and Smith38,Reference Wells, Sawaya and Wibaek39) . This dilemma is likely to become even more serious with the popularisation of COVID-19 in 2019.
This study provides some insights for future exploration. The ‘Zero Hunger’ goal involves not only ensuring that people have adequate energy intake but also that their diets meet nutritional requirements and avoid malnutrition. Prior reports have demonstrated that with the persistence of ND, this goal by 2030 will be difficult to achieve(Reference Popkin, Corvalan and Grummer-Strawn40,Reference Jiang, Liu and Qi41) . It is essential to discover temporal trends in the global burden of ND, thus indicating the effectiveness of existing nutrition promotion strategies and strengthening guidance to global organisations to control ND. There is evidence that no single natural food can satisfy all the energy and nutrient needs of the body, making the timely use of nutritional supplements valuable(Reference Finley, Finley and Ellwood42,Reference Cerino, Buonerba and Cannazza43) . It is necessary to conduct a scientific review of the application of nutrient supplements in different cohorts to reveal the optimal schemes. For further work, a global shift towards a healthy diet, based on the principle of sustainable development, will help to prevent the spread of ND and bring about significant savings.
In response to the burden of ND, various policies and actions have been implemented in the area of nutritional healthcare. These efforts aim to improve the availability, accessibility and affordability of nutritious food and to strengthen nutrition education and counselling. Interventions such as fortification of staple foods, promotion of breast-feeding and implementation of school feeding programmes have also been initiated to address specific ND(Reference Seron-Arbeloa, Labarta-Monzon and Puzo-Foncillas44). It is also recognised that the use of dietary supplements can be valuable in meeting the energy and nutrient needs of individuals, especially when natural food sources are inadequate(Reference The45). However, it is important to conduct a scientific review of the use of dietary supplements in different populations to determine the best options. This requires an assessment of the efficacy, safety and cost-effectiveness of different supplementation strategies, taking into account factors such as age, sex and specific ND.
Inevitably, there are some limitations to our study. First, this study is restricted by collected variables and missing data in GBD, particularly the aetiological category. Data on poorer areas may be underestimated due to the lack of efficient statistical instruments. Second, additional factors may influence the development of ND, such as educational resources, climate change and national security, which were not included in this study. Finally, the results of this study have not been validated by external comparative studies. To address the limitations mentioned, future research should focus on improving GBD data quality by addressing regional discrepancies and implementing standardised data collection protocols and training programmes. Additionally, research should explore emerging trends in ND aetiology and management, including the impact of climate change on food availability and nutritional value, as well as the effects of educational resources and national security on ND prevalence and management.
Conclusions
Overall, the global incidence rate of ND presents a decreasing and then increasing trend, while DALY, prevalence and mortality present a significant decreasing trend. Meanwhile, specific populations, such as males, adolescents aged 0–14 years, or populations in low SDI areas, should be given priority attention to control this adverse event. Adequate will and funding are urgently necessary to ensure the best investment in health and development for the population with ND.
Acknowledgements
The authors thank Xiao Ming (xiaoming_room@hotmail.com) for his work in the GBD database. His excellent sharing of GBD database analysis procedure and other public database makes it easier for us to explore the GBD database.
This study was supported by Social Public Welfare Science and Technology Research Funding of Zhongshan City (2022B1083 and 2022B1109).
All authors contributed to the study’s conception and design. X. Q. performed data collection and analysis. X. Q. and Y. J. wrote the manuscript. K. W., K. X. and C. Y. polished and revised the manuscript. All authors commented on previous versions of the manuscript and read and approved the final manuscript.
The authors declare that they have no competing interests.
Supplementary material
For supplementary material/s referred to in this article, please visit https://doi.org/10.1017/S0007114524001272


