


1. Introduction
The transport of scalars such as temperature (heat), contaminants and CO $_2$ are a key feature of many engineering and natural flows (Kays & Crawford Reference Kays and Crawford1993; Wyngaard Reference Wyngaard2010). It is often the case that these flows are both turbulent and involve a surface roughness (Chung et al. Reference Chung, Hutchins, Schultz and Flack2021), which further complicates the prediction of these flows. Here, we consider the advection of passive scalars (forced convection) for incompressible flows, defined by their relatively low concentrations with negligible buoyancy effects (Warhaft Reference Warhaft2000). Forced convection regimes are representative of many industrial flows where energy is supplied to the system predominantly through shear such as pumps (Kays & Crawford Reference Kays and Crawford1993), and is also applicable to flow in the atmospheric surface layer, typically $O(100)$ m from the Earth's surface under near-neutral conditions (Wyngaard Reference Wyngaard2010). The assumptions of incompressible forced convection are violated typically in strongly heated flows where significant density variations can cause buoyancy forces to become active (Warhaft Reference Warhaft2000) and in atmospheric flows at heights approaching the Obhukov height, $L_O$, such that $|z/L_O| \gtrsim 0.01$ (Wyngaard Reference Wyngaard2010). Such flows and those involving compressibility (high Mach number) lie beyond the scope of the present work. In a forced convection regime, the physical law governing the transport of mass and heat are identical, only differing by the value of the Prandtl number (or Schmidt number, Sc, for mass transfer), ${Pr} \equiv \nu /\alpha$, where $\nu$ is the kinematic viscosity and $\alpha$ its thermal (or mass) diffusivity. This equivalence permits us to refer to both heat and mass transfer at the same time and we will refer to only the former henceforth.
The presence of roughness elements will give rise to a drag penalty,  $\Delta U^+(k^+)$, which manifests as a downward shift in the logarithmic smooth-wall mean velocity profile (Clauser Reference Clauser1954; Hama Reference Hama1954):
 \begin{align} U^+\equiv \frac{U}{U_{\tau}} &= \frac{1}{\kappa}\log[(z-d)^+] + A - \Delta U^+(k^+), \end{align}
 \begin{align} &= \frac{1}{\kappa}\log[(z-d)/z_0] , \end{align}
 \begin{align} &= \frac{1}{\kappa}\log[(z-d)/k_s] + A_{FR}, \end{align}
where the mean streamwise velocity,  $U$, is normalised by the friction velocity, $U_{\tau } \equiv \sqrt {\langle \tau _w \rangle / \rho }$, associated with the integrated wall shear stress per unit plan area, $\langle \tau _w \rangle$, and fluid density, $\rho$, with the von Kármán constant, $\kappa \approx 0.4$, and the smooth-wall log intercept, $A \approx 5.0$. The wall shear stress is defined to include contributions from both pressure drag, $\tau _p$, and viscous drag, $\tau _\nu$, such that $\langle \tau _w \rangle \equiv \langle \tau _p\rangle + \langle \tau _\nu \rangle$. We use $+$ superscripts to denote quantities normalised by $U_{\tau }$ and $\nu$. The wall-normal distance ( $z$-direction) is measured from the roughness virtual origin, $z-d$, where $d$ represents a wall-normal shift relative to a reference $z$-location (Perry & Joubert Reference Perry and Joubert1963; Raupach, Antonia & Rajagopalan Reference Raupach, Antonia and Rajagopalan1991; Luchini Reference Luchini1996; Nikora et al. Reference Nikora, Koll, McLean, Ditrich and Aberle2002) to be defined more formally in § 3.2. The quantity $\Delta U^+$ is commonly referred to as the roughness function (Clauser Reference Clauser1954; Hama Reference Hama1954) and depends on the roughness Reynolds number, $k^+ \equiv kU_{\tau }/\nu$, where $k$ is a representative size for the rough surface, e.g. the peak-to-trough roughness height. The alternative formulations provided in (1.1b) and (1.1c) use the roughness length for momentum, $z_0$, and equivalent sand-grain roughness, $k_s$, with intercept, $A_{FR} \approx 8.5$ (Nikuradse Reference Nikuradse1933; Schlichting Reference Schlichting1936). The former is commonly used in meteorology (Raupach et al. Reference Raupach, Antonia and Rajagopalan1991; Brutsaert Reference Brutsaert1982; Wyngaard Reference Wyngaard2010), whereas the latter is typical for engineering applications and is exclusive to the fully rough regime (Jiménez Reference Jiménez2004; Chung et al. Reference Chung, Hutchins, Schultz and Flack2021). By combining (1.1a)–(1.1c), we can relate $\Delta U^+$, $k^+_s$ and $z^+_0$. Namely, $k^+_s = \exp [\kappa (\Delta U^+ - A + A_{FR})]$, $k^+_s/z^+_0 = \exp (\kappa A_{FR}) \approx 30$, such that knowledge of either $z^+_0$ or $k^+_s$ for a flow is equivalent to knowing $\Delta U^+$. Generally, $\Delta U^+$ will depend on as many length scales that are required to fully describe the rough surface in question (Raupach et al. Reference Raupach, Antonia and Rajagopalan1991; Jiménez Reference Jiménez2004; Flack & Schultz Reference Flack and Schultz2010; Chung et al. Reference Chung, Hutchins, Schultz and Flack2021), but for geometrically similar rough surfaces, as is the case in the present work, this dependency is reduced to a single length scale, $k$.
$k$.
In addition to altering momentum transfer, rough surfaces also augment heat transfer at solid interfaces (Bons et al. Reference Bons, Taylor, Mcclain and Rivir2001). By analogy to the momentum transfer problem, this can be represented as an offset relative to a logarithmic smooth-wall temperature profile (Dipprey & Sabersky Reference Dipprey and Sabersky1963; Yaglom & Kader Reference Yaglom and Kader1974; Yaglom Reference Yaglom1979; Kader Reference Kader1981; Brutsaert Reference Brutsaert1982; Kays & Crawford Reference Kays and Crawford1993):
 \begin{align} \varTheta^+\equiv \frac{\varTheta}{\varTheta_{\tau}} &= \frac{1}{\kappa_\theta}\log[(z-d)^+] + A_\theta({Pr}) - \Delta \varTheta^+(k^+,{Pr}), \end{align}
 \begin{align} &= \frac{1}{\kappa_\theta}\log[(z-d)/z_0] + {St}_k^{{-}1}(k^+,{Pr}), \end{align}
 \begin{align} &= \frac{1}{\kappa_\theta}\log[(z-d)/k_s] + g(k^+,{Pr}), \end{align}
 \begin{align} &= \frac{1}{\kappa_\theta}\log[(z-d)/z_i] + \varTheta_i^+(k^+,{Pr}), \end{align}
with  $\kappa _\theta \approx 0.46$ (Pirozzoli, Bernardini & Orlandi Reference Pirozzoli, Bernardini and Orlandi2016) and $\varTheta$ representing the mean temperature relative to the wall temperature. The smooth-wall log intercept, $A_\theta ({Pr})$, depends on the Prandtl number, ${Pr}$, and roughness introduces a heat-transfer augmentation, $\Delta \varTheta ^+(k^+,{Pr})$, relative to this intercept. The quantity $\varTheta _{\tau } \equiv \langle q_w\rangle /(\rho c_p U_{\tau })$ is the friction temperature, with $\langle q_w\rangle$ representing the wall heat flux (defined in (2.2a)) and $c_p$ the specific heat at constant pressure. Here, we measure from the same virtual origin location, $z-d$, as that of the velocity in (1.1), assuming the virtual-origin shift, $d$, to be identical for both velocity and temperature. In (1.2b)–(1.2d), we provide alternative formulations that appear in the literature: formulations for the inverse roughness Stanton number, ${St}_k^{-1}$ (also written as $B^{-1}$ in the atmospheric sciences), using $z_0$ coordinates (Jayatilleke Reference Jayatilleke1966; Garratt & Hicks Reference Garratt and Hicks1973; Kays & Crawford Reference Kays and Crawford1993; Kanda et al. Reference Kanda, Kanega, Kawai, Moriwaki and Sugawara2007; Anderson Reference Anderson2013), the $g$-function (Dipprey & Sabersky Reference Dipprey and Sabersky1963; Owen & Thomson Reference Owen and Thomson1963; Webb, Eckert & Goldstein Reference Webb, Eckert and Goldstein1971; Yaglom & Kader Reference Yaglom and Kader1974) using $k_s$ and the formulation based on an interfacial height, $z_i$, defined as the height above which the temperature profile is logarithmic with its accompanying interfacial temperature at this height, $\varTheta _i$ (elaborated further in § 2) (Owen & Thomson Reference Owen and Thomson1963; Yaglom & Kader Reference Yaglom and Kader1974; Brutsaert Reference Brutsaert1975a,Reference Brutsaertb). The various log-intercepts are related by combining (1.2b)–(1.2d), e.g. ${St}_k^{-1} = (1/\kappa _\theta )\log (z_0/k_s) + g \approx g - 7.4$, ${St}_k^{-1} = (1/\kappa _\theta )\log (z_0/z_i) + \varTheta ^+_i$. Unlike with $z_0$ and $k_s$, which can be linked through $k_s/z_0 \approx 30$, $z_i$ does not have any fixed relation to $z_0$ or $k_s$ (Brutsaert Reference Brutsaert1975b, Reference Brutsaert1982). Some authors in their theories however, (e.g. Owen & Thomson Reference Owen and Thomson1963; Yaglom & Kader Reference Yaglom and Kader1974) adopted (1.2d) as a starting point, and then set $z_i = k_s$ so $\varTheta _i^+ = g$.
Progress in our understanding of momentum transfer (drag) and heat transfer has been largely disparate. The behaviour of  $\Delta U^+$ is well documented in the literature and has been extensively reviewed (e.g. Raupach et al. Reference Raupach, Antonia and Rajagopalan1991; Jiménez Reference Jiménez2004; Flack & Schultz Reference Flack and Schultz2010; Chung et al. Reference Chung, Hutchins, Schultz and Flack2021). Since the seminal works of Nikuradse (Reference Nikuradse1933); Schlichting (Reference Schlichting1936), it is established that for rough surfaces in the fully rough regime, pressure drag acts as the dominant contribution to skin friction and their mean-flow behaviour follows a log-linear relation, $U^+ = (1/\kappa )\log [(z-d)/k] + C$, where $C$ is a constant that depends on the roughness geometry independent of viscous effects (Jiménez Reference Jiménez2004). The universality of this behaviour is exploited by passing from $k$ to $k_s$ via $C \equiv (1/\kappa )\log (k/k_s) + A_{FR}$, which allows for $\Delta U^+$ measurements of roughness from different types to collapse onto a single, universal asymptote using $k_s$ as the reference scale (figure 1a).
(a) Typical behaviour of  $\Delta U^+$ in the fully rough regime showing direct numerical simulation (DNS) data for a sinusoidal surface (black circles) (MacDonald, Hutchins & Chung Reference MacDonald, Hutchins and Chung2019) and irregular roughness (blue circles) (Peeters & Sandham Reference Peeters and Sandham2019). The $k^+_s \leq 70$ range is demarcated with the grey box and corresponds to the conventional threshold below the fully rough regime (Flack & Schultz Reference Flack and Schultz2010). (b) Disparate predictions of fully rough $\Delta \varTheta ^+$ models. The model constants are fitted to the DNS data for ${Pr} = 0.7$ (black) from MacDonald et al. (Reference MacDonald, Hutchins and Chung2019) and ${Pr} = 1.0$ (blue) from Peeters & Sandham (Reference Peeters and Sandham2019). For ${Pr} = \{0.7,1.0\}$, the model constants are $C^\prime _R = \{0.3,0.3\}$, $D^\prime _R = \{7.2,8.4\}$ for $g = C^\prime _R(k^+_s)^{1/2}{Pr}^{2/3}+D^\prime _R$ in Owen & Thomson (Reference Owen and Thomson1963), $C_R = \{2.5,2.4\}$, $D_R = \{2.7,3.7\}$ for $\varTheta ^+_i = C_R(k^+_s)^{1/4}{Pr}^{1/2} + D_R$ in Brutsaert (Reference Brutsaert1975b) assuming $z_i = k_s$, and $b_1^\prime = \{ 0.6, 0.5\}$, $b_2^\prime = \{0.4,0.3\}$, $b_3^\prime = \{7.1,7.8\}$ for $g = b^\prime _1(k^+_s)^{1/2}({Pr}^{2/3} - b^\prime _2) + b^\prime _3$ in Yaglom & Kader (Reference Yaglom and Kader1974), and $\Delta \varTheta ^+ = \{4.4,4.8\}$ in MacDonald et al. (Reference MacDonald, Hutchins and Chung2019).

Our understanding of  $\Delta \varTheta ^+$, by contrast, has not seen the same degree of progress. Whereas pressure drag makes the dominant contribution to drag in the fully rough regime (Jiménez Reference Jiménez2004; Flack & Schultz Reference Flack and Schultz2010), an analogue for pressure drag does not exist in heat transfer (Dipprey & Sabersky Reference Dipprey and Sabersky1963; Owen & Thomson Reference Owen and Thomson1963). Heat transfer at the solid surface occurs solely through molecular conduction and this is reflected in not only the dependence on $k^+$ but also the dependence on ${Pr}$, which includes the thermal diffusivity, $\alpha$. The underlying asymptotic form of $\Delta \varTheta ^+$ in the fully rough regime remains ambiguous with disagreement amongst current models (figure 1b). Empirical models for rough-wall heat transfer have typically been restricted to fit data of single roughness types and their universality cannot be guaranteed (e.g. Dipprey & Sabersky Reference Dipprey and Sabersky1963; Jayatilleke Reference Jayatilleke1966; Webb et al. Reference Webb, Eckert and Goldstein1971; Dawson & Trass Reference Dawson and Trass1972; Garratt & Hicks Reference Garratt and Hicks1973; Kays & Crawford Reference Kays and Crawford1993). Phenomenological models, some of which are shown in figure 1(b), have also emerged. Unlike the empirical formulations, the physical assumptions leading to these model predictions provide a basis for scrutiny and will be the focus of this paper.
The phenomenological model of Yaglom & Kader (Reference Yaglom and Kader1974) takes the form  $g = b^\prime _1(k^+_s)^{1/2}({Pr}^{2/3} - b_2^\prime ) + b_3^\prime$ in (1.2c) and is obtained through scaling arguments, where $b_1^\prime$, $b_2^\prime$ and $b_3^\prime$ are fitting constants. Later, the same authors amend this expression by introducing a fitting parameter, $\gamma$, to replace the original $1/2$ exponent, giving $g = b_1^\prime (k^+_s)^{\gamma }({Pr}^{2/3} - b_2^\prime ) + b_3^\prime$ (Kader & Yaglom Reference Kader and Yaglom1977). They allowed $\gamma = 1/4$ for better agreement with two-dimensional (2-D)-roughness, arguing that $\gamma$ could take the value of either $1/2$ or $1/4$ depending on whether three-dimensional (3-D)- or 2-D-roughness is being considered, but later, Yaglom (Reference Yaglom1979) concedes the crude nature of categorising all roughness types into these two subsets, noting that the universality of these expressions is suspect. Recently, the direct numerical simulation (DNS) study of MacDonald et al. (Reference MacDonald, Hutchins and Chung2019) observed a thin conductive sublayer that conforms to the roughness topography in the fully rough regime. This led them to postulate that the temperature field behaves as though the rough wall is effectively smooth on the increased surface area so that $\Delta \varTheta ^+$ attains a constant value. This was one of the hypotheses proposed by Sverdrup (Reference Sverdrup1951), but limited data availability prevented concrete conclusions on the certainty of this form. Interfacial temperature formulations (1.2d), discussed in § 2, take the form $\varTheta ^+_i = C_R(k^+)^{p}{Pr}^{m} + D_R$, where $C_R$ and $D_R$ are constants dependent on roughness geometry, and $p$ and $m$ are exponents determined by phenomenological arguments (Owen & Thomson Reference Owen and Thomson1963; Brutsaert Reference Brutsaert1975b). The appropriate values to take for $p$ and $m$ is an ongoing topic of debate (Li et al. Reference Li, Rigden, Salvucci and Liu2017, Reference Li, Bou-Zeid, Grimmond, Zilitinkevich and Katul2020) and we will dedicate § 2 towards elaborating on the diverse perspectives. To demonstrate this, we show in figure 1(b) the ${Pr} = O(1)$ formulation of Owen & Thomson (Reference Owen and Thomson1963) who propose $p=1/2$, $m=2/3$ and of Brutsaert (Reference Brutsaert1975b) who proposes $p=1/4$, $m=1/2$. Empirical expressions that have taken $\varTheta ^+_i = g$ have also seen diverse values proposed for the exponents, with $p = 0.2$– $0.5$, $m = 0.44$– $0.8$ (Dipprey & Sabersky Reference Dipprey and Sabersky1963; Sheriff & Gumley Reference Sheriff and Gumley1966; Webb et al. Reference Webb, Eckert and Goldstein1971; Dawson & Trass Reference Dawson and Trass1972). Inspection of $\Delta \varTheta ^+$ trends in figure 1(b) with respect to model predictions alone is not sufficient in telling us what the appropriate scaling exponents should be, as the model constants can be tuned to fit a particular dataset.
Rather than merely compare model predictions, a more robust approach is to test the underlying physical assumptions which underpin these models. However, the hypothesised mechanisms involved have remained difficult to interrogate due to a lack of high-fidelity data in the fully rough regime, alongside insufficient Prandtl number variations. Although recent DNS studies (e.g. Leonardi et al. Reference Leonardi, Orlandi, Djenidi and Antonia2015; Orlandi, Sassun & Leonardi Reference Orlandi, Sassun and Leonardi2016; Forooghi, Stripf & Frohnapfel Reference Forooghi, Stripf and Frohnapfel2018a; Forooghi et al. Reference Forooghi, Weidenlener, Magagnato, Böhm, Kubach, Koch and Frohnapfel2018b; MacDonald et al. Reference MacDonald, Hutchins and Chung2019; Peeters & Sandham Reference Peeters and Sandham2019; Hantsis & Piomelli Reference Hantsis and Piomelli2020) have helped to further advance our understanding of rough-wall heat transfer, a systematic sweep of the  $(k^+,{Pr})$ parameter space that is necessary to scrutinise these hypothesised mechanisms has yet to emerge. Not only is the 2-D ( $k^+,{Pr}$) parameter space expensive to sample, the unfavourable $O({Re}_{\tau }^{9/4})$ computational cost of resolving the momentum field in a smooth-wall DNS flow (Pope Reference Pope2000, § 9.1.2) is further increased to $O({Re}_{\tau }^{9/4}{Pr}^{3/2})$ for ${Pr} \gtrsim 1$ simulations (Yano & Kasagi Reference Yano and Kasagi1999), where ${Re}_{\tau }$ is the friction Reynolds number.
Our present work will circumvent these stringent computational costs by employing minimal channel simulations, which only capture the near-wall flow by constraining the channel domain size (Chung et al. Reference Chung, Chan, MacDonald, Hutchins and Ooi2015; MacDonald et al. Reference MacDonald, Chung, Hutchins, Chan, Ooi and García-Mayoral2017, Reference MacDonald, Hutchins and Chung2019). The assumption which underpins this approach lies in Townsend's outer-layer similarity hypothesis (Townsend Reference Townsend1976), which states that roughness serves to predominantly alter only the flow confined to the near-wall region. The outer layer remains insensitive to roughness except for how it sets the friction velocity  $U_{\tau }$, and outer-layer details are unimportant in studying the effects of roughness. More recently, DNS studies have emerged which corroborate that outer-layer similarity can be generalised to heat transfer (Doosttalab et al. Reference Doosttalab, Araya, Newman, Adrian, Jansen and Castillo2016; MacDonald et al. Reference MacDonald, Hutchins and Chung2019; Hantsis & Piomelli Reference Hantsis and Piomelli2020), so that the minimal channel approach can provide an efficient method to sweep the $(k^+,{Pr})$ parameter space. With a comprehensive DNS dataset to work with, we will scrutinise the proposed phenomenologies that describe rough-wall heat transfer, so that the underlying mechanisms can be resolved.
The paper is organised as follows. We summarise the key competing phenomenologies in § 2. Our DNS data are detailed in § 3, with § 4 dedicated to addressing our primary research questions concerning the phenomenology of heat transfer. As we shall see, although the phenomenological model of Brutsaert (Reference Brutsaert1975b) will be favoured when we consider measures of the total heat transfer, certain phenomenological ideas in the contrary theories of Owen & Thomson (Reference Owen and Thomson1963) and Yaglom & Kader (Reference Yaglom and Kader1974) can remain robust when examining the flow locally. We investigate the implications this has on full-scale heat transfer prediction in § 5, through bulk measures of the Nusselt and Stanton numbers. We provide conclusions in § 6.
2. Fully rough models for rough-wall heat-transfer
2.1. Mean scaling laws in terms of local quantities
The influence of rough walls on heat transfer is encapsulated in any of the logarithmic intercepts in (1.2a)–(1.2d). We will focus on the (1.2d) formulation, which makes use of the interfacial height,  $z_i$, defined to be the height above which the temperature profile is logarithmic and homogeneous (Brutsaert Reference Brutsaert1975b). The interfacial temperature at this height is described through a power law formulation $\varTheta ^+(z-d=z_i) \equiv \varTheta ^+_i \sim (k^+)^p {Pr}^m$. The correct values to take for $p$ and $m$ have been a topic of contention (Li et al. Reference Li, Rigden, Salvucci and Liu2017, Reference Li, Bou-Zeid, Grimmond, Zilitinkevich and Katul2020) and one of our main contributions in the present work will be to provide evidence towards resolution. A sketch of the physical picture using this $(z_i, \varTheta _i)$ framework is provided in figure 2(a). Provided $\varTheta ^+_i$ and $z^+_i$ are known as a function of $k^+$ and ${Pr}$, the procedure thereafter falls to matching at $z_i^+$ with the logarithmic profile using the value $\varTheta ^+_i$, which is equivalent to prescribing the logarithmic intercept. The region below $z_i$ is assumed to be well mixed, having uniform temperature $\varTheta _i$, but closer to the wall, there will exist the conductive sublayer of thickness $\delta _\theta$ submerged below $z_i$. In the case of ${Pr} \ll 1$ such as for liquid metals, the effects of molecular conduction may extend beyond the expected extent of the logarithmic temperature profile, invalidating the concept of $z_i$ (Alcántara-Ávila, Hoyas & Pérez-Quiles Reference Alcántara-Ávila, Hoyas and Pérez-Quiles2018; Abe & Antonia Reference Abe and Antonia2019). In such instances, the framework in figure 2(a) will no longer hold so the case of ${Pr} \ll 1$ will not be treated.
(a) Sketch of the problem set-up used in fully rough phenomenologies. The flow is partitioned into two regions by the height  $z_i$, above which the temperature profile is logarithmic. The task falls to prescribing a phenomenology which describes the well-mixed region $z-d \leq z_i$ (light grey) to obtain the temperature $\varTheta _i$, given the roughness size $k$ and wall heat-flux $\langle q_w\rangle$. The sketch presents a configuration where ${Pr} > 1$, such that the conductive sublayer (red) is below $z_i$. (b) An example profile for the local wall-normal temperature profile, $\theta (n)$, showing how this problem can be reinterpreted in terms of the conductive sublayer thickness (2.1). A well-mixed roughness sublayer implies the temperature at the edge of the conductive sublayer, $\theta _{\delta _\theta }$, is taken to be $\varTheta _i$. (c) A prototypical sketch of the mean temperature, $\varTheta$, measured from the virtual origin plane (dashed line) $z-d$. The origin coincides with the wall-origin perceived by the turbulent eddies in the logarithmic region (Nikora et al. Reference Nikora, Koll, McLean, Ditrich and Aberle2002; Chung et al. Reference Chung, Hutchins, Schultz and Flack2021), which is assumed to be identical for both mean velocity and temperature (i.e. $d_\theta = d$).

To probe local mechanisms pertinent to the phenomenologies, it is useful to adopt a local conductive sublayer thickness,  $\delta _\theta$:
 \begin{equation} \delta_\theta(x,y) = \frac{\theta_{\delta_\theta}(x,y)}{\partial \theta / \partial n|_w} \approx \frac{\varTheta_i}{\partial \theta / \partial n |_w}, \end{equation}
where  $\partial \theta / \partial n |_w$ is the local wall-normal temperature gradient at the rough wall, $\theta _{\delta _\theta }$ is the local temperature at the edge of the conductive sublayer and $x$–
$x$– $y$ are streamwise-spanwise coordinates. Equation (2.1) takes $\delta _\theta$ to be the intersection point between the tangent of the local temperature profile with $\theta _{\delta _\theta }$. By consequence of assuming a well-mixed roughness sublayer, this temperature is then taken to be $\theta _{\delta _\theta } \approx \varTheta _i$ (figure 2b). This $\delta _\theta$ definition corresponds to the so-called tangent method common in the Rayleigh–Bénard literature, where $\varTheta _i$ coincides with the temperature in the bulk region (Zhou et al. Reference Zhou, Stevens, Sugiyama, Grossmann, Lohse and Xia2010; Scheel & Schumacher Reference Scheel and Schumacher2014). The viscous sublayer thickness $\delta _\nu$ is the linear region dominated by viscous diffusion and in separated regions, is somewhat ill-defined. The viscous sublayer is meaningful primarily in attached regions, which tend to form only in the exposed, windward regions experiencing favourable pressure gradients, as envisioned in figure 2(a).
Assuming the region below  $z_i$ to be well mixed except through the conductive sublayer, $\delta _\theta$, in which the temperature varies linearly, the local heat transfer can be inferred through Fourier's conduction law: $q_w / (\rho c_p) = \alpha \varTheta _i / \delta _\theta$ (Owen & Thomson Reference Owen and Thomson1963; Yaglom & Kader Reference Yaglom and Kader1974; Brutsaert Reference Brutsaert1975b), the global effect of which can be obtained via integration as follows. By changing from the spatially homogeneous $\varTheta _i$ to $\delta _\theta$, local variations arising due to roughness inhomogeneities can be examined:
 \begin{align} \frac{\langle q_w \rangle}{\rho c_p}&\equiv \frac{A_w}{A_t}\frac{1}{A_w} \int_{A_w}\alpha \left.\frac{\partial \theta}{\partial n} \right|_w \mathrm{d}A_w \end{align}
 \begin{align} &= \frac{A_w}{A_t}\alpha \varTheta_i \frac{1}{A_w} \int_{A_w} \frac{1}{\delta_\theta}\mathrm{d}A_w \end{align}
 \begin{align} &\equiv \frac{A_w}{A_t}\alpha \varTheta_i \left\langle \frac{1}{\delta_\theta} \right\rangle_w. \end{align}
Here,  $A_w$ is the wetted area, defined as the total rough-wall surface area in contact with the working fluid and $A_t$ is the plan (or projected) area, with the ratio $A_w/A_t$ staying a fixed constant for a given roughness geometry. The expression (2.2a) is the physical definition of the heat flux, whilst to obtain (2.2b), we have substituted (2.1) into (2.2a). We use $\langle {\cdot } \rangle _w \equiv (1/A_w)\int _{A_w}({\cdot })\, \mathrm {d}A_w$ to denote the average over the wetted area, as in (2.2c), and $\langle {\cdot } \rangle \equiv (1/A_t)\int _{A_w}({\cdot })\, \mathrm {d}A_w$ for the wetted area integral normalised on the plan area. In non-dimensional units, (2.2c) reads:
 \begin{equation} \varTheta^+_i = {Pr} (A_t/A_w) \langle 1/\delta_\theta^+ \rangle_w^{{-}1}. \end{equation}
We see from (2.3) that knowledge of the scaling  $\langle 1/\delta _\theta ^+ \rangle _w \sim (k^+)^{-p}{Pr}^{1-m}$ would be equivalent to knowledge of the scaling $\varTheta ^+_i \sim (k^+)^p{Pr}^m$. In general, $\langle \delta _\theta ^+\rangle _w \neq \langle 1/\delta _\theta ^+ \rangle _w^{-1}$, but many authors have neglected this distinction (Owen & Thomson Reference Owen and Thomson1963; Yaglom & Kader Reference Yaglom and Kader1974). The approximation $\langle \delta _\theta \rangle _w \approx \langle 1/\delta _\theta \rangle _w^{-1}$ can be formally deduced by writing $\delta _\theta$ in terms of a mean and fluctuation: $\delta _\theta \equiv \langle \delta _\theta \rangle _w + \delta _\theta ^{\prime \prime }$ and letting $\epsilon \equiv \delta _\theta ^{\prime \prime } / \langle \delta _\theta \rangle _w$, we perform a Taylor series expansion at $\epsilon = 0$ to obtain $\langle 1/\delta _\theta \rangle _w^{-1} = \langle \langle \delta _\theta \rangle _w^{-1}(1 + \epsilon )^{-1}\rangle ^{-1}_w = \langle \delta _\theta \rangle _w\langle 1 - \epsilon + \epsilon ^2 + \dots \rangle _w^{-1} \approx \langle \delta _\theta \rangle _w(1-\langle \epsilon ^2\rangle _w) \approx \langle \delta _\theta \rangle _w$ for $\langle \epsilon ^2\rangle _w \ll 1$. Thus, provided $\delta _\theta$ does not deviate significantly from $\langle \delta _\theta \rangle _w$, one may expect the $\langle \delta _\theta ^+ \rangle _w = \langle 1/\delta _\theta ^+\rangle _w^{-1}$ approximation to hold. Although we have presented a framework adopting $(z^+_i,\varTheta ^+_i)$, the $\varTheta ^+_i \sim (k^+)^p{Pr}^{m}$ scaling law may be recast using any of the reference heights and logarithmic intercepts in (1.2b) and (1.2c). Recasting to the inverse roughness Stanton number and roughness length $(z^+_0,{St}_k^{-1})$, for instance, is done by combining (1.2b) and (1.2d) to obtain ${St}_k^{-1}= (1/\kappa _\theta )\log (z_0/z_i)+ \varTheta _i^+$. Provided $z_0/z_i$ attains a constant value in the fully rough regime, this will result in ${St}_k^{-1} \sim \varTheta _i^+\sim (k^+)^p{Pr}^m$.
2.2. The  $1/4$ Kolmogorov–Brutsaert scaling

The  $1/4$ power law scaling picture, sometimes known as surface renewal theory (e.g. Brutsaert Reference Brutsaert1982; Katul & Liu Reference Katul and Liu2017; Li et al. Reference Li, Rigden, Salvucci and Liu2017, Reference Li, Bou-Zeid, Grimmond, Zilitinkevich and Katul2020) related to penetration theory (Danckwerts Reference Danckwerts1951; Bird, Stewart & Lightfoot Reference Bird, Stewart and Lightfoot2007), was proposed for rough walls by Brutsaert (Reference Brutsaert1975b). For this model, Brutsaert prescribes the energy cascade phenomenology of Kolmogorov (Reference Kolmogorov1941) to describe the well-mixed region, $z-d \leq z_i$. In the fully rough regime, a $k \gg \nu /U_{\tau }$ scale separation will develop and, as illustrated in figure 3(a), Brutsaert proposes that this roughness cascade starts at the beginning of the logarithmic region, $z_i$, which is assumed to be proportional to $k$,
$k$,  $z_i \propto k$. The cascade is characterised by a constant rate of energy transfer given by the turbulent dissipation rate $\varepsilon \approx U_{\tau }^3/(\kappa z_i) \propto U_{\tau }^3/(\kappa k)$ down to an ensemble of the smallest Kolmogorov eddies, having size $\eta _K \equiv (\nu ^3/\varepsilon )^{1/4}$. The roughness elements provide a windless, stagnant shelter for these Kolmogorov eddies, which initially carry temperature $\varTheta _i$ from the well-mixed region (grey region in figure 3a) and straddle the conductive sublayer. During the contact time, $t$, the Kolmogorov eddies give rise to a surface renewal process, depositing their temperature onto the rough surface in this windless environment that is everywhere without any viscous sublayer (compare figure 2a and figure 3a). Thus, in the absence of advection, the temperature they carry, $\theta$, is modelled through an unsteady diffusion problem in the local wall-normal direction $n$:
$n$:  $\partial \theta / \partial t = \alpha (\partial ^2 \theta / \partial n^2)$ with boundary conditions $\theta (n=0,t) = 0, \theta (n>0,t=0) = \varTheta _i, \theta (n \to \infty,t) = \varTheta _i$. The latter two conditions reflect the notion that the Kolmogorov eddies exist in a well-mixed region and with the asymptotically large scale separation in the fully rough regime $z_i \gg \eta _K$, $z_i$ can be interchanged with the far-field condition at $n \to \infty$ as both are large relative to the Kolmogorov eddy size. This is Stokes’ first problem which has the solution $\theta (n,t) = \varTheta _i \text {erf}[ n/(4\alpha t)^{1/2}]$ (figure 3b). Recall that $t$ here is not understood as time elapsed, but rather the individual contact times of these Kolmogorov eddies. As seen in figure 3(b), fresh eddies from the well-mixed region initially carry a uniform temperature of $\varTheta _i$, which is gradually deposited over the duration of the contact period of the surface. The conductive sublayer thickness using this model is given by $\delta _\theta = ({\rm \pi} \alpha t)^{1/2}$, obtained by combining (2.1) and $\partial \theta / \partial n|_w = \varTheta _i/({\rm \pi} \alpha t)^{1/2}$ from the error function solution. The ensemble of these eddies and their respective contact times is represented by prescribing a probability density function, $\text {p.d.f.}(t)$, or $\text {p.d.f.}(\delta _\theta )$ equivalently. Here, Brutsaert (Reference Brutsaert1975b) follows the same prescription originally proposed by Danckwerts (Reference Danckwerts1951), whereby the stochastic nature of these eddy-renewal times follows an exponential probability distribution, with a mean contact time commensurate to the Kolmogorov time scale $t_\eta \equiv (\nu /\varepsilon )^{1/2}$. The mean heat flux is then obtained by Brutsaert (Reference Brutsaert1975b) through an integration over the ensemble of contact times as prescribed by the exponential p.d.f. along with the solution $\partial \theta / \partial n|_w = \varTheta _i / ({\rm \pi} \alpha t)^{1/2}$, or alternatively, recast here also in terms of $\delta _\theta = ({\rm \pi} \alpha t)^{1/2}$ and its p.d.f.:
 $$\begin{align}
\frac{\langle q_w \rangle}{\rho c_p} &= \frac{A_w}{A_t}\int^{\infty}_0 \alpha
\left.\frac{\partial \theta}{\partial n} \right|_w\underbrace{\frac{1}{t_\eta}\exp\left({-\frac{t}{t_\eta}}\right)}_{\text{p.d.f.}(t)}\mathrm{d}t\\
&= \frac{A_w}{A_t}\int^{\infty}_0 \frac{\alpha\varTheta_i}{\delta_\theta}\underbrace{\left[\frac{2}{\rm \pi}\frac{\delta_\theta}{\eta^2_B}\exp\left({-\frac{\delta_\theta^2}{{\rm \pi}
\eta_B^2}}\right)\right]}_{\text{p.d.f.}(\delta_\theta)}\mathrm{d}\delta_\theta\\
&= \frac{A_w}{A_t}\alpha \varTheta_i\frac{1}{\eta_B},
\end{align}$$
$$\begin{align}
\frac{\langle q_w \rangle}{\rho c_p} &= \frac{A_w}{A_t}\int^{\infty}_0 \alpha
\left.\frac{\partial \theta}{\partial n} \right|_w\underbrace{\frac{1}{t_\eta}\exp\left({-\frac{t}{t_\eta}}\right)}_{\text{p.d.f.}(t)}\mathrm{d}t\\
&= \frac{A_w}{A_t}\int^{\infty}_0 \frac{\alpha\varTheta_i}{\delta_\theta}\underbrace{\left[\frac{2}{\rm \pi}\frac{\delta_\theta}{\eta^2_B}\exp\left({-\frac{\delta_\theta^2}{{\rm \pi}
\eta_B^2}}\right)\right]}_{\text{p.d.f.}(\delta_\theta)}\mathrm{d}\delta_\theta\\
&= \frac{A_w}{A_t}\alpha \varTheta_i\frac{1}{\eta_B},
\end{align}$$
where  $\eta _B \equiv (\alpha t_\eta )^{1/2}$ is the Batchelor scale. Comparing (2.4c) with (2.2c), we identify $\langle 1/\delta _\theta \rangle _w = 1/\eta _B$. Finally, to obtain $\eta _B$, we insert $\varepsilon \sim U_{\tau }^3/(\kappa k)$ (figure 3a) into $t_\eta \equiv (\nu /\varepsilon )^{1/2}$ and $\eta _B \equiv (\alpha t_\eta )^{1/2}$. Letting $\langle 1/\delta _\theta \rangle _w = 1/\eta _B$, we obtain the scaling law for the inverse of the conductive sublayer thickness:
 \begin{align}
\langle 1/\delta_\theta \rangle_w &=
\alpha^{{-}1/2}\nu^{{-}1/4}\varepsilon^{1/4}
\sim\alpha^{{-}1/2} \nu^{{-}1/4} U_{\tau}^{3/4} k^{{-}1/4}\\
&\implies \langle 1 / \delta_\theta^+ \rangle_w \sim (k^+)^{{-}1/4}{Pr}^{1/2}.
\end{align}
\begin{align}
\langle 1/\delta_\theta \rangle_w &=
\alpha^{{-}1/2}\nu^{{-}1/4}\varepsilon^{1/4}
\sim\alpha^{{-}1/2} \nu^{{-}1/4} U_{\tau}^{3/4} k^{{-}1/4}\\
&\implies \langle 1 / \delta_\theta^+ \rangle_w \sim (k^+)^{{-}1/4}{Pr}^{1/2}.
\end{align}
Adopting (2.3), this resulting scaling predicts
 \begin{equation} \varTheta^+_i \sim {St}_k^{{-}1}\sim (k^+)^{1/4}{Pr}^{1/2}. \end{equation}
A limitation of this surface renewal model is that it does not distinguish between particular roughness locations and the potential for different renewal dynamics at these locations. The subtleties of these considerations, however, are hidden in the context of the final scaling law obtained in (2.5b) as noted by Katul & Liu (Reference Katul and Liu2017), as it is ultimately the mean value of  $1/\delta _\theta$ that will yield the final scaling law.
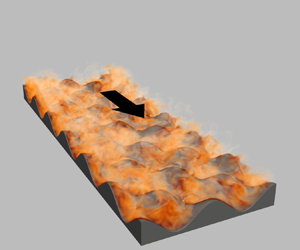
(a) Fully rough model of Brutsaert (Reference Brutsaert1975b) which uses the Kolmogorov energy-cascade phenomenology. A scale separation forms between the roughness size  $k$ and the Kolmogorov-eddies which scour the surface area and have size $\eta _K$. The cascade is characterised by the rate of energy transfer $\varepsilon$. There exists an ensemble of these Kolmogorov eddies, each with their own contact time with the surface, $t$, and all of which initially carry temperature $\varTheta _i$ from the well-mixed region, which we illustrate in (b). (c) Ensemble of Kolmogorov eddies represented by a probability density function (p.d.f.).

2.3. The $1/2$ Owen–Thomson scaling

The  $1/2$ power law scaling for the fully rough regime draws on elements reminiscent of the Prandtl–Blasius laminar boundary layer theory (Schlichting & Gersten Reference Schlichting and Gersten2017) and is closely associated with the Reynolds–Chilton–Colburn analogy between heat or mass transfer and skin friction. The approach of authors proposing this method (e.g. Owen & Thomson Reference Owen and Thomson1963; Yaglom & Kader Reference Yaglom and Kader1974) has been to generalise the scaling arguments of the Prandtl–Blasius solution to describe the local viscous sublayer, now assumed to cover the entirety of the rough surface (figure 4a,b) in contrast to surface renewal (figure 3a). In Prandtl–Blasius theory, the viscous sublayer thickness, $\delta _\nu$ is (e.g. Landau & Lifshitz Reference Landau and Lifshitz1987):
 \begin{equation} \delta_\nu \sim x{Re}_x^{{-}1/2}, \quad {Re}_x \equiv xU_\infty/\nu, \end{equation}
where  $x$ is the streamwise fetch, $U_\infty$ is the free stream velocity and ${Re}_x$ is the Reynolds number defined on these quantities. The result arises from laminar flow where streamwise advection balances wall-normal diffusion: $U(\partial U / \partial x) = \nu (\partial ^2 U / \partial z^2)$, which implies $U_\infty ^2/x \sim \nu U_\infty /\delta _\nu ^2$ or (2.7a,b) equivalently after rearrangement. Here, a choice is made to link the viscous sublayer, $\delta _\nu$, and the usual laminar boundary-layer thickness, $\delta = x{Re}_{x}^{-1/2}$, in Prandtl–Blasius theory (Landau & Lifshitz Reference Landau and Lifshitz1987; Schlichting & Gersten Reference Schlichting and Gersten2017). The viscous sublayer, $\delta _\nu$, encapsulates the extent of the linear region where viscous stresses are most active and, as illustrated in figure 4(c), can be situated as the local minima of the second velocity derivative, $\mathrm {d}^2u/\mathrm {d}z^2$. For Prandtl–Blasius boundary-layers, one may adopt $\delta _\nu$ and the velocity at this location, $u_{\delta _\nu }$, in replacement for the usual $\delta$ and $U_\infty$ without loss of generality for scaling relations, as these quantities are related by a proportionality constant, $\delta _\nu /\delta \approx 2.9$, $u_{\delta _\nu }/U_\infty \approx 0.8$. Similar definitions for the conductive sublayer thickness, $\delta _\theta$, and its temperature, $\theta _{\delta _\theta }$, may also be inferred from the second derivative minima (figure 4c, red). The advantage in adopting these viscous–conductive quantities as opposed to the free stream velocity $U_\infty$ or boundary-layer thickness $\delta$ will be that these viscous–conductive quantities can be computed unambiguously in both a rough-wall flow and smooth-wall turbulent flow, providing a direct avenue to test the assumptions of a local Prandtl–Blasius or smooth-wall-like behaviour.
(a) A fully rough model sketch whereby Prandtl–Blasius-type laminar boundary layers, illustrated in (b), cover the entirety of the rough surface. The case is sketched for  ${Pr} \gtrsim 1$ such that $\delta _\theta \propto \delta _\nu {Pr}^{m-1}=\delta _\nu {Pr}^{-1/3}$. (c) Example solutions from Prandtl–Blasius theory for velocity (black) and temperature (red) ( ${Pr} = 5.0)$. The linear viscous and conductive sublayer regions, $\delta _\nu$, $\delta _\theta$, respectively, are situated by the minima of second derivatives (square markers).

In the theories of Owen & Thomson (Reference Owen and Thomson1963) and Yaglom & Kader (Reference Yaglom and Kader1974), it is proposed that the streamwise fetch  $x$ may be replaced by an arbitrary, but geometrical roughness length scale: $x \propto k$, which physically implies that laminar boundary-layers will develop locally over distances proportional to $k$. This generalises the Prandtl–Blasius scaling of $\delta _\nu \sim x {Re}_x^{-1/2}$ to $\delta _\nu \sim k{Re}_k^{-1/2}$, where ${Re}_k \equiv k u_{\delta _\nu }/\nu$, a scaling which we may test explicitly in a rough-wall flow. The velocity scale $u_{\delta _\nu } \propto U_{\tau }$ is proposed, and reflects an intuition whereby $U_{\tau }$ represents the velocity scale directly above the viscous sublayer. Making these substitutions into (2.7a,b) enables a scaling with respect to $k^+$ to be obtained:
 \begin{equation} \delta_\nu \sim (\nu k / U_{\tau})^{1/2}, \quad \delta_\nu^+{\sim} (k^+)^{1/2} \end{equation}
which was the result of Owen & Thomson (Reference Owen and Thomson1963) and Yaglom & Kader (Reference Yaglom and Kader1974). However, the authors did not begin their arguments starting from the Prandtl–Blasius scaling of (2.7a,b) at the time, but rather by presuming that the flow within the viscous sublayer is characterised by  $\mathrm {d}U/\mathrm {d}z \sim U_{\tau }/k$. As demonstrated by Yaglom & Kader (Reference Yaglom and Kader1974), this can be integrated to obtain $U \sim U_{\tau } z/k$. This velocity evaluated at $\delta _\nu$, $u_{\delta _\nu } = U_{\tau }\delta _\nu /k$, is used to define a Reynolds number scaled on the viscous sublayer quantities and is enforced to be of order unity: ${Re}_{\delta _\nu } \equiv u_{\delta _\nu }\delta _\nu /\nu = O(1)$, which implies $\delta _\nu \sim \nu /u_{\delta _\nu } = \nu k /(U_{\tau } \delta _\nu )$, an equivalent result to (2.8a,b). Recent studies concerning this scaling law (e.g. Li et al. Reference Li, Rigden, Salvucci and Liu2017, Reference Li, Bou-Zeid, Grimmond, Zilitinkevich and Katul2020) interpret this as a case where the dynamics near the rough wall are driven primarily through the mean inverse time scale $\mathrm {d}U/\mathrm {d}z \sim U_{\tau } / k$, a so-called macro-eddy model. For laminar boundary-layers in general, $\delta _\theta \propto \delta _\nu {Pr}^{m-1}$, yielding the scaling for the conductive sublayer thickness $\delta _\theta ^+ \sim (k^+)^{1/2}{Pr}^{m-1}$, as required in (2.3), to obtain for the heat transfer
 \begin{equation} \varTheta^+_i \sim {St}_k^{{-}1} \sim (k^+)^{1/2}{Pr}^{m}. \end{equation}
 For the Prandtl number exponent  $m$, Owen & Thomson (Reference Owen and Thomson1963) proposed $m = 2/3$ for ${Pr} \gtrsim 1$ and $m = 3/4$ for ${Pr} \gg 1$, while Yaglom & Kader (Reference Yaglom and Kader1974) adopts a fixed $m = 2/3$ for ${Pr} \gtrsim 1$. In smooth-wall flows, the exponents $m=1/2$ for ${Pr} \ll 1$ and $m=2/3$ for ${Pr} \gg 1$ have been corroborated extensively by adopting Prandtl–Blasius-type arguments for laminar boundary-layers (Landau & Lifshitz Reference Landau and Lifshitz1987; Kays & Crawford Reference Kays and Crawford1993; Schlichting & Gersten Reference Schlichting and Gersten2017) and classical natural convection (Grossmann & Lohse Reference Grossmann and Lohse2000; Shishkina, Horn & Wagner Reference Shishkina, Horn and Wagner2013; Shishkina, Grossmann & Lohse Reference Shishkina, Grossmann and Lohse2016), and by assuming cubically increasing eddy diffusivities for the viscous–conductive sublayer region of turbulent flows (Kader Reference Kader1981; Durbin & Pettersson-Reif Reference Durbin and Pettersson-Reif2011). The so-called Chilton–Colburn analogy for predicting heat transfer coincides with the case $m=2/3$ (Kays & Crawford Reference Kays and Crawford1993; Bird et al. Reference Bird, Stewart and Lightfoot2007). Some authors have also argued the case $m = 3/4$ for very large ${Pr}$ (Lin Reference Lin1959; Townsend Reference Townsend1976; Shaw & Hanratty Reference Shaw and Hanratty1977). MacDonald et al. (Reference MacDonald, Hutchins and Chung2019) observed a close analogy between local viscous and conductive fluxes, alongside an apparent saturation of the rough-wall heat transfer augmentation $\Delta \varTheta ^+$ to a constant value, which led the authors to postulate a local smooth-wall-like behaviour across the surface wetted area, implying that the same $\delta _\theta \propto \delta _\nu {Pr}^{m-1}$ relation for smooth walls may be found locally.
3. DNS dataset
3.1. Simulation set-up
We consider a channel flow with identical roughness topography at both top and bottom walls through a reflection at the channel centre-plane (figure 5a). The  $(x,y,z)$ directions are the streamwise, spanwise and wall-normal directions, respectively, with corresponding velocity components $\boldsymbol {u} = (u,v,w)$. The temperature, $T$, is considered a passive scalar and is decomposed as $T = \theta _w + \theta$, where $\theta _w$ is the wall temperature. We solve the governing equations:
 \begin{gather} \boldsymbol{\nabla} \boldsymbol{\cdot} \boldsymbol{u} = 0, \end{gather}
 \begin{gather}\frac{\partial \boldsymbol{u}}{\partial t} + \boldsymbol{\nabla}\boldsymbol{\cdot}(\boldsymbol{u u}) ={-}\boldsymbol{\nabla} p + \nu \nabla^2 \boldsymbol{u} - \hat{\boldsymbol{e}}_x\varPi(t), \end{gather}
 \begin{gather}\frac{\partial \theta}{\partial t} + \boldsymbol{\nabla} \boldsymbol{\cdot}(\boldsymbol{u}\theta) = \alpha \nabla^2 \theta - u\frac{\mathrm{d}\theta_w}{\mathrm{d} x}, \end{gather}
where the (kinematic) pressure gradient is decomposed into a periodic fluctuating component,  $\boldsymbol {\nabla } p$, and a spatially uniform streamwise component, $\hat {\boldsymbol {e}}_x\varPi (t)$, with ${\varPi < 0}$ driving the flow at a constant mass flux. For temperature, we solve for the fluid temperature relative to the wall $\theta$ and drive heat transfer through a constant, prescribed wall-temperature gradient $\mathrm {d}\theta _w/\mathrm {d} x$. This forcing is equivalent to having a statistically uniform wall heat-flux (Kays & Crawford Reference Kays and Crawford1993) and is a common forcing strategy in channel-flow DNS of passive scalars (e.g. Kasagi, Tomita & Kuroda Reference Kasagi, Tomita and Kuroda1992; Kawamura et al. Reference Kawamura, Ohsaka, Abe and Yamamoto1998; Alcántara-Ávila, Hoyas & Pérez-Quiles Reference Alcántara-Ávila, Hoyas and Pérez-Quiles2021).
(a) Schematic of the computational domain. The channel half-height,  $h$, is measured from the sinusoidal mid-plane to the channel centreline. (b) The present sinusoidal roughness, with amplitude, $k$, and wavelength, $\lambda$, as defined by (3.4). The wall-normal origin for $z$ is taken to be the sinusoidal mid-plane as shown.

The roughness considered is a 3-D sinusoidal roughness, given by
 \begin{equation} z_w(x,y) = k\cos(2{\rm \pi} x/\lambda)\cos(2{\rm \pi} y/\lambda), \end{equation}
where  $k$ is the sinusoidal semi-amplitude and the wavelength is fixed as $\lambda = 7.1k$ as in figure 5(b) for all the present cases, so that the roughness is geometrically similar. The surface has maxima and minima points at $z_w = \pm k$, which we presently refer to as roughness crests and troughs, respectively. This roughness has been investigated previously for both channels (Chung et al. Reference Chung, Chan, MacDonald, Hutchins and Ooi2015; MacDonald et al. Reference MacDonald, Chan, Chung, Hutchins and Ooi2016, Reference MacDonald, Hutchins and Chung2019) and pipe flows (Chan et al. Reference Chan, MacDonald, Chung, Hutchins and Ooi2015, Reference Chan, MacDonald, Chung, Hutchins and Ooi2018). The computational domain has a channel half-height $h$, defined as the distance between the sinusoidal mid-plane and channel centreline, and the friction Reynolds number is defined on this height, ${Re}_{\tau } \equiv h U_{\tau }/\nu$. We measure the wall-normal direction $z$ from the sinusoid midplane, although we will account for the virtual origin later in § 3.2. The domain is periodic in the streamwise and spanwise directions. No-slip impermeable ( $\boldsymbol {u} = \boldsymbol {0}$) wall conditions and a zero fluid–wall temperature contrast ( $\theta = 0$) are enforced using an immersed-boundary method (IBM). This code has been validated for momentum (Rouhi, Chung & Hutchins Reference Rouhi, Chung and Hutchins2019) and has presently been extended to solve for rough-wall heat transfer. The IBM uses a direct-forcing approach (Fadlun et al. Reference Fadlun, Verzicco, Orlandi and Mohd-Yusof2000) with a volume-of-fluid interpolation. For spatial discretisation, the code employs the fully conservative fourth-order finite-difference scheme of Verstappen & Veldman (Reference Verstappen and Veldman2003) for a staggered grid, while for time-stepping, we use the three-step Runge–Kutta method of Spalart, Moser & Rogers (Reference Spalart, Moser and Rogers1991). At each substep, the velocity field is projected onto a divergence-free space using the fractional-step algorithm (Perot Reference Perot1993).
Mean quantities such as  $U(z)$ for streamwise velocity or $\varTheta (z)$ for temperature are defined to be the $xyt$-averages of their respective fields and for regions below the roughness, we take this average to be the intrinsic average. That is, the average that is representative of the volume occupied by the fluid domain (Nikora et al. Reference Nikora, McEwan, McLean, Coleman, Pokrajac and Walters2007). Overbars (e.g. $\bar {u}$) will be used to denote time averages, while time-fluctuating fields will be denoted by a prime superscript: $u^\prime (x,y,z,t) \equiv u(x,y,z,t) -\bar {u}(x,y,z)$.
Although we will focus our discussions primarily on the fully rough regime, our parameter space spans lower-transitional cases at  $k^+ \approx 5.5$ towards the fully rough regime at $k^+ \approx 111$ for ${Pr} = 0.5$, 1.0 and 2.0, all detailed in table 1. Owing to our presently fixed $\lambda /k = 7.1$, the increasing $k^+$ will correspond to an increasing wall-unit-scaled roughness wavelength $\lambda ^+$. These simulations employ minimal channels, whereby domain sizes $L_x \times L_y$ are truncated whilst still resolving the roughness sublayer (Chung et al. Reference Chung, Chan, MacDonald, Hutchins and Ooi2015; MacDonald et al. Reference MacDonald, Chung, Hutchins, Chan, Ooi and García-Mayoral2017), allowing for a parametric sweep at affordable cost. For each rough wall simulation, a smooth-wall simulation at matched ${Re}_{\tau }$ and domain size has also been conducted for a domain-size-independent measure of $\Delta U^+$ and $\Delta \varTheta ^+$. Prescriptions for $L_x$ and $L_y$ follow from the recommendations of MacDonald et al. (Reference MacDonald, Chung, Hutchins, Chan, Ooi and García-Mayoral2017). For minimal channels, the flow is explicitly captured in a region of ‘healthy’ turbulence up to a critical height $z_c \approx 0.4L_y$. We require that this healthy turbulence threshold resides above the roughness sublayer, above which the time-averaged flow is spatially homogeneous. For the same 3-D sinusoidal roughness in pipe flow, Chan et al. (Reference Chan, MacDonald, Chung, Hutchins and Ooi2018) suggested that the roughness sublayer height could be estimated as $z_r \approx \lambda /2$ measured from the virtual origin. This estimate was based on an observation of the roughness-induced, dispersive motions becoming negligible at $z_r \approx \lambda /2$ universally for varying $k^+$ and $\lambda /k$ (see Chan et al. Reference Chan, MacDonald, Chung, Hutchins and Ooi2018, figures 7d and 8d). The importance of in-plane roughness lengths in scaling $z_r$ has been highlighted in the past, particularly for surfaces with strong in-plane heterogeneity (e.g. Raupach et al. Reference Raupach, Antonia and Rajagopalan1991; Chung et al. Reference Chung, Hutchins, Schultz and Flack2021). Our present $\lambda /k = 7.1$ gives $z_r \approx \lambda /2 = 3.55k$, which is consistent with the common $z_r \approx 2k$– $5k$ estimate for rough-wall flows (e.g. Raupach et al. Reference Raupach, Antonia and Rajagopalan1991; Jiménez Reference Jiménez2004; Hong, Katz & Schultz Reference Hong, Katz and Schultz2011; Rouzes et al. Reference Rouzes, Moulin, Florens and Eiff2019; Chung et al. Reference Chung, Hutchins, Schultz and Flack2021). To resolve the roughness sublayer flow with minimal channels, we then require $z_c = 0.4L_y > z_r \approx \lambda /2$ which can be satisfied with the spanwise domain length prescription $L_y \geq \max (100\nu /U_{\tau }, k/0.4, 2\lambda )$. The streamwise length prescription is $L_x \geq \max (3L_y, 1000\nu /U_{\tau },\lambda )$ (MacDonald et al. Reference MacDonald, Chung, Hutchins, Chan, Ooi and García-Mayoral2017). In our present study, these constraints produce $L_x = 6\lambda$– $28\lambda \approx 2.4h$– $2.8h$, $L_y = 2\lambda$– $4\lambda \approx 0.39h$– $0.79h$ depending on the $k^+$ and $h/k$ considered. This minimal channel approach was previously demonstrated by MacDonald et al. (Reference MacDonald, Hutchins and Chung2019) to adequately resolve the near-wall flow for temperature for a fixed ${Pr} = 0.7$ and employed even more restrictive computational domain sizes than our present study. For completeness, we have dedicated Appendix A towards further validating the minimal channel approach by comparing against full-span channel results for our varying ${Pr} = 0.5$, 1.0, 2.0, selecting $k^+ \approx 22$ as the candidate case. Our validation showed negligible differences between full-span and minimal channel results in the logarithmic flow region, consistent with other rough-wall minimal channel studies (e.g. MacDonald et al. Reference MacDonald, Chung, Hutchins, Chan, Ooi and García-Mayoral2017, Reference MacDonald, Hutchins and Chung2019; Endrikat et al. Reference Endrikat, Modesti, García-Mayoral, Hutchins and Chung2021). We have selected ${Re}_{\tau } \approx 395$ as the lowest Reynolds number for our study, as this has been seen to be sufficient for avoiding low- ${Re}_{\tau }$ influences from altering the logarithmic region (Chan et al. Reference Chan, MacDonald, Chung, Hutchins and Ooi2015; Thakkar, Busse & Sandham Reference Thakkar, Busse and Sandham2018). For a fixed $k^+$, these ${Re}_{\tau }$ influences may also be interpreted as the effect of the blockage ratio $h/k$ on the logarithmic region since ${Re}_{\tau } = (h/k)k^+$. MacDonald et al. (Reference MacDonald, Hutchins and Chung2019) found that ${Re}_{\tau } \approx 395$ as their lowest Reynolds number did not alter near-wall heat transfer significantly for ${Pr} = 0.7$, concluding ${Re}_{\tau } \approx 395$ to be an adequate lower-bound. This same validation has been repeated in Appendix B for ${Pr} = 0.5$, 1.0, 2.0, where we similarly conclude the lower bounds ${Re}_{\tau } \gtrsim 395$, $h/k \gtrsim 18$ are adequate.
Table of runs for the  $(k^+,{Pr})$ parameter sweep. The $N_x$, $N_y$ and $N_z$ are the number of grid points in the streamwise, spanwise and wall-normal directions, with uniform grid spacings $\Delta x^+$ and $\Delta y^+$, while the wall-normal grid spacing is given by the (constant) grid spacing below the roughness crests $\Delta z^+_b$ and the spacing at the channel centreline $\Delta z^+_t$. The average time step is given by $\Delta t^+ \equiv \Delta t U_{\tau }^2/\nu$ and $T_s \equiv T U_{\tau }/z_c$ is the total simulation time used for ensemble averaging based on $z_c$-sized eddy turnovers.

Uniform grid-spacing is employed in the streamwise and spanwise directions, while a hyperbolic grid stretching is used in the wall-normal direction above the roughness crests. Below this height, the grid spacing  $\Delta z_b$ in the wall-normal direction is uniform. Previous studies on the sinusoidal roughness we consider have determined that 24–48 cells per wavelength is adequate in resolving the roughness lateral scales (Chan et al. Reference Chan, MacDonald, Chung, Hutchins and Ooi2015, Reference Chan, MacDonald, Chung, Hutchins and Ooi2018; MacDonald et al. Reference MacDonald, Hutchins and Chung2019; Rouhi et al. Reference Rouhi, Chung and Hutchins2019). For higher- $k^+$ simulations, the limiting requirement on grid resolution shifts from resolving the roughness elements to resolving the smallest turbulence scales. We have kept the streamwise and spanwise grid spacings, $\Delta x^+ \lesssim 6$, $\Delta y^+ \lesssim 5$ for our ${Pr} = 0.5$ and ${Pr} = 1.0$ cases. For ${Pr} = 2.0$, the smaller scales in the temperature field will need to be captured by a finer resolution so the grid has been refined in these cases. We have conducted simulations at a constant Courant–Friedrichs–Lewy (CFL) number between $0.5$ and 1, where the CFL number is defined presently by $\text {CFL} \equiv \max _i (|u_i|\Delta t / \Delta x_i)$. Here, $|u_i|$ is the magnitude of the $i$th velocity component, $\Delta x_i$ the grid spacing in the $i$th direction which determines the computational step size $\Delta t$. Time steps for the cases considered were typically limited by flow regions close to the wall for the wall-normal direction ( $i=3$), owing to the high computational grid density in this region, as well as observed increases in wall-normal velocities occurring close to the wall. The average time-step size, $\Delta t^+ \equiv \Delta tU_{\tau }^2/\nu$ is provided in table 1. Time-averaging windows are chosen based on sampling enough $z_c$-sized eddies in the log layer. These $z_c$-sized eddies have a characteristic time scale $z_c/U_{\tau }$ and the number of $z_c/U_{\tau }$ flow-through times is given by the simulation time $T_s \equiv TU_{\tau }/z_c$ in table 1. For the largest simulations at $k^+ \approx 111$, runtimes are limited to $T_s \approx 10$. Despite the limited sampling windows, the near-wall roughness sublayer flow and log-intercept measurements do not significantly vary, which is the focus of the present work. Details on statistical variations for our $k^+ \approx 111$ cases are reported in Appendix C.
3.2. Virtual-origin effects
To obtain robust measures of the logarithmic intercepts in (1.2a)–(1.2d), we need to measure from the virtual origin, by accounting for a shift,  $d$ (Raupach et al. Reference Raupach, Antonia and Rajagopalan1991; Nikora et al. Reference Nikora, Koll, McLean, Ditrich and Aberle2002; García-Mayoral, de Segura & Fairhall Reference García-Mayoral, de Segura and Fairhall2019). For low $k^+$, $d$ represents a displacement of smooth-wall turbulence and can be obtained by shifting the Reynolds shear stress profiles to collapse with a smooth wall. We have adopted this approach to obtain $d$ for our $k^+ = [5.5,11,22]$ cases and refer the reader to Endrikat et al. (Reference Endrikat, Modesti, García-Mayoral, Hutchins and Chung2021, § 2.3) for details on the methodology.
At higher  $k^+$, this framework may no longer hold, as the near-wall turbulent structures in the conventional, smooth-wall sense may no longer exist (Nikora et al. Reference Nikora, Koll, McLean, Ditrich and Aberle2002; Jiménez Reference Jiménez2004). Jackson (Reference Jackson1981) proposed that $d$ can be evaluated as the displacement which situates the centre of drag acting on the rough surface, although this definition may not always be appropriate (Cheng & Castro Reference Cheng and Castro2002; Coceal et al. Reference Coceal, Dobre, Thomas and Belcher2007; Chung et al. Reference Chung, Hutchins, Schultz and Flack2021). The heat transfer analogue to Jackson's drag-centroid $d$, say, $d_\theta$, would correspond to locating the centroid for the distribution of heat sources from the roughness elements (Brutsaert Reference Brutsaert1982). Presently, we neglect this distinction, taking $d=d_\theta$, and instead elect to evaluate $d$ for our $k^+ = [33,40,56,111]$ cases through an ad hoc tuning to yield a close fit to $\kappa \approx 0.4$ and $\kappa _\theta \approx 0.46$ slopes in the logarithmic regions. Despite the ad hoc nature, we will show that the influence of the uncertainty in $d$ is largely inconsequential when measuring the logarithmic intercepts. Figure 6(a) shows the $d/k$ obtained from our ad hoc tuning approach. Alongside this, we have selected fixed prescriptions of $d/k = [0,1]$ to assess the uncertainty this propagates into measurements of the logarithmic intercepts. The choices $d/k=0$, $1$ coincide with the extreme cases where the virtual origin is situated at the roughness mean and crest height, respectively, and are intended to be worst-case-scenario error measures for the uncertainty caused by $d$. As shown in the velocity and temperature difference profiles (figure 6c–f), variation in $d/k$ produces slight changes in the difference profiles, but the profiles roughly collapse towards the same value as the unphysical region of minimal channels, $z_c$, is approached. In figure 7, we demonstrate that this $d/k$ uncertainty does not significantly alter values for the logarithmic intercepts by presenting measurements of $\Delta U^+$ and $\Delta \varTheta ^+$, obtained by evaluating the difference profiles (figure 6c–f) at the minimal channel critical height $z_c$, i.e. $\Delta U^+ = U^+_s(z^+_c) - U^+_r(z^+_c)$, $\Delta \varTheta ^+ = \varTheta ^+_s(z^+_c) - \varTheta ^+_r(z^+_c)$. We also examined the influence of measuring the roughness functions at different heights above the roughness sublayer, $z_r \approx \lambda /2$, and below $z_c$. This produced negligible variations in $\Delta U^+$, $\Delta \varTheta ^+$ that were no greater than $0.3$ (not shown). Figure 7(a) plots $\Delta U^+$ at a fixed $d/k=0$ and when fitted to the equivalent sand-grain roughness asymptote $\Delta U^+ = (1/0.4)\log (k^+_s)-3.5$ yields $k_s/k \approx 3.3$. Prior studies on our present roughness in pipe flows have found $k_s/k \approx 4.1$ (Chan et al. Reference Chan, MacDonald, Chung, Hutchins and Ooi2015), which is also shown in figure 7(a) for reference. MacDonald et al. (Reference MacDonald, Hutchins and Chung2019) ascribed this $k_s/k$ mismatch as being due to differences in blockage ratios ( $h/k = 6.75$ as opposed to our present $h/k = 18$) and fundamental differences between pipes and channels. In figure 7(c,d), we propagate our $d/k$ uncertainties into the error bars for $\Delta U^+$, $\Delta \varTheta ^+$ when $d/k$ is fixed as $0$ and 1. The data of MacDonald et al. (Reference MacDonald, Hutchins and Chung2019) are included, taking into account virtual-origin effects using our fit in figure 6(a). Their data tend to produce smaller error bars, which is due to a different prescription for $z^+_c$ where the roughness functions are measured. The $d/k$ uncertainty results in $k_s/k \approx 2.4$– $3.3$, with $k_s/k \approx 2.7$ as the result from our $d/k$ fit (figure 6a). The consequent uncertainties in $\Delta U^+$ caused by $d/k$ variations result in relative errors no greater than $7.5\,\%$, which are not too significant bearing in mind this considers the worst-case-scenario limits of $d/k=0$ and $1$. Later in § 4.2 when we present mean profiles, we will provide further evidence demonstrating the insensitivity of the high- $k^+$ data with respect to choices in $d$.
$d$.
(a) Variation of  $d/k$ with respect to $k^+$. The circle markers designate the low- $k^+$ cases where $d$ is evaluated as per Endrikat et al. (Reference Endrikat, Modesti, García-Mayoral, Hutchins and Chung2021). Values for $d/k$ (coloured markers) are obtained through an ad hoc fit for our higher- $k^+$ data: $d/k = -(k^+/365)^{2} + (k^+/213) + 0.27$, which gives $d/k = \{ 0.42,0.45,0.50,0.70\}$ for $k^+ = \{33,40,56,111\}$. We select $d/k = [0,1.0]$ (error bars) as bounds to assess the errors propagated by the uncertainty in $d$. (b) Schematic illustration of $d$ and its relation to the roughness mean height and size $k$. (c) Velocity and (d–f) temperature difference profiles between smooth and rough walls from the roughness crests to the unphysical region $z_c$, the $d/k$ fit in (a) and $d/k=0,1$. The profiles roughly collapse once $z_c$ is approached and are staggered by $+3$ at each $k^+$ for clarity.

(a)  $\Delta U^+$ and (b) $\Delta \varTheta ^+$ measured with the mean roughness height ( $d/k=0$) as the origin. The ${Pr} = 0.7$ data are retrieved from MacDonald et al. (Reference MacDonald, Hutchins and Chung2019). (c,d) Roughness functions corrected for the virtual origin using the $d/k$ fit in figure 6(a). The $k^+_s = 2.7k^+$ prefactor for $k^+$ is obtained by collapsing the fully rough asymptote (dashed black line) of Nikuradse (Reference Nikuradse1933). The error bars for high- $k^+$ data are evaluations for $d/k = 0,1$ resulting in $k_s/k \approx 3.3$, $2.4$, respectively.

The  $\Delta \varTheta ^+$ trends suggested by figure 7(b,d) are that heat transfer augmentation through roughness is most significant for higher- ${Pr}$ fluids. Across all ${Pr}$, $\Delta \varTheta ^+$ appears to plateau in the vicinity of $k^+ \approx 40$, before beginning a gradual decrease, with signs that this peak occurs at lower $k^+$ for higher ${Pr}$. It is unclear whether this decrease should continue or if there exists another asymptotic scaling for $\Delta \varTheta ^+$. A continual decrease in $\Delta \varTheta ^+$ for increasing $k^+$ would imply that $\Delta \varTheta ^+$ would eventually attain a negative value. That is, a reduction in heat transfer relative to a smooth wall which seems unintuitive. Ultimately however, higher- $k^+$ data are needed to affirm the asymptotic state of $\Delta \varTheta ^+$ for $k^+ \to \infty$.
4. Fully rough phenomenology
4.1. Flow visualisations
In figure 8, we provide instantaneous views of the flow fields close to the wall at our two highest  $k^+ = 56$, $111$, visualising the streamwise velocity $u^+$ as well as spatial variations of the conductive sublayer, $\delta _\theta ^+$ in the temperature fields. Recall that $\delta _\theta ^+$ represents the extent of the local region in which the temperature varies linearly. To obtain rough estimates of $\delta _\theta ^+$ in figure 8, we have first selected a temperature threshold value, $\theta ^+ = 2{Pr}$ that was found to lie within the linear conductive regions at a wide range of spatial locations for all the cases shown in figure 8. A local tangent was then fitted to the wall-normal temperature profile at each wall location which passed through the location of this threshold coordinate. We then take $\delta _\theta ^+$ to be the point at which the wall-normal temperature departs from this tangent by a 10 % relative error, such that it roughly encapsulates the extent of the linear region. At both $k^+ = 56$, $111$, we can make three distinct observations concerning the spatial variations of $\delta _\theta ^+$ in the temperature fields (figure 8d–f,j–l). First, the thicker conductive sublayers observed at lower- ${Pr}$ is reflective of the tendency for conduction to occur over greater distances in lower- ${Pr}$ fluids (Kays & Crawford Reference Kays and Crawford1993; Dimotakis Reference Dimotakis2005). Second, the thinnest regions of $\delta _\theta ^+$ are typically seen in exposed, windward locations – a phenomena which relates to the higher heat transfer that is typically observed due to impingement of windward faces (Peeters & Sandham Reference Peeters and Sandham2019), as a higher heat transfer corresponds to a thinner observed conductive sublayer. Third, the observation of detaching plumes, corresponding to relatively thick regions of $\delta _\theta ^+$ tend to emerge in sheltered, leeward regions. The formation of these plumes roughly correlate to regions of turbulent reversed flow, $u^+ < 0$, as seen in the velocity fields (figure 8a–c,g–i). The primary difference in the $k^+ = 111$ fields from $k^+ = 56$ appears to be that the detaching plumes diminish in size relative to the roughness size $k$. The visualisations show that the reversed-flow regions cover the majority of the surface wetted area and thereby is the primary flow acting to mix temperature locally. This prominence of reversed-flow however, does not preclude the existence of other mechanisms which may drive heat transfer locally. Highlighted by the velocity contour lines $u^+ = 4$ in figure 8, regions such as crests are exposed to faster flow producing higher shear, which may suggest a Reynolds-analogy-type shear-driven heat transfer mechanism not unlike a smooth-wall boundary layer that is postulated in the phenomenology of § 2.3. A similar smooth-wall analogy at exposed regions was discussed by Chan-Braun, García-Villalba & Uhlmann (Reference Chan-Braun, García-Villalba and Uhlmann2011) for transitionally rough flow over packed spheres which motivated them to adopt a smooth-wall analogy model for predicting the hydrodynamic drag. When considering these packed spheres in the fully rough regime however, Mazzuoli & Uhlmann (Reference Mazzuoli and Uhlmann2017) found that the success of the smooth-wall analogy model diminishes, which they attributed to the absence of any smooth-wall-type flow structure near the wall. We will dedicate § 4.3 to scrutinising the validity of a local smooth-wall, Reynolds-analogy-type behaviour in the fully rough regime.
(a–c) Instantaneous streamwise velocity fields at  $k^+ = 56$ with contour lines at $u^+ = 0$, $4$ (white, black) to highlight stagnant fluid regions and the slip velocity across the roughness crests, respectively. The corresponding temperature fields are shown in (d–f) for ${Pr} = 0.5$– $2.0$ where the black contour lines show coordinate traces of $\delta _\theta ^+$, obtained by projecting the distance $\delta _\theta ^+$ in the local wall-normal direction (illustrated in d). The local $\delta _\theta ^+$ is estimated as the departure from a locally fitted linear tangent by a threshold of 10 % relative error. Refer to the body text for more details. (g–l) Same as (a–f) for $k^+ = 111$.

4.2. Mean quantities and scaling laws
Before examining hypothesised local phenomena associated with fully rough heat transfer, we will look at features of the mean flow that are pertinent to the phenomenologies outlined in § 2. One such feature is the notion of the temperature being well mixed below  $z_i$ by the scale-separated turbulent eddies, with significant variations only occurring in the conductive sublayer very close to the surface. We first test this assumption in figure 9(a–d) against the mean profiles. The near-wall distributions of $\varTheta ^+$ at higher- $k^+$ tend to support this hypothesis, as $\varTheta ^+$ is held approximately uniform below the logarithmic region (the lower limit of the logarithmic region, $z_i$, is marked with the open symbols). The velocity profiles (figure 9a), however, do not seem to exhibit this same degree of well mixing. Note that the profiles in figure 9(a–d) only show data up to the minimal channel unphysical region, $(z-d)^+ = z_c^+ = 0.4L_y^+$. For our $k^+ \geq 22$ cases, this is fixed at $z_c/h \approx 0.32$, which lies above the conventionally quoted extent of the logarithmic region, $z/h \approx 0.15$ (e.g. Pope Reference Pope2000; Marusic & Monty Reference Marusic and Monty2019). Given that our present work is not concerned with the outer-scale flow dynamics and that the wake region beyond $z_c$ is inherently unphysical in minimal channels, the data beyond $z_c$ are not of importance here. Figure 9(e–l) examines further evidence by highlighting the mean profile distributions within the roughness canopies against logarithmic and linear $z/k$ axes. For increasing $k^+$, we observe the gradual emergence of a steeper temperature gradient beginning at the roughness troughs, $z/k = -1$, best seen on the linear $z/k$ axes (figure 9j–l). At our highest $k^+ = 111$, this sharp increase accounts for nearly 50 % of the total temperature variation in the channel, lending credence to the assumption of well-mixing. For the velocity in figure 9(e), we highlight the fully rough behaviour, $U^+ = (1/\kappa )\log [(z-d)/k]+C$, where $C \approx 6.0$ corresponds to our choice of $d/k$ in figure 9(a) consistent with $k_s/k \approx 2.7$. The bounds for $d/k = [0,1]$ (dashed red lines) show that despite being representative of extreme cases for the uncertainty in $d$, this amounts to an inconsequential uncertainty in the logarithmic intercept as the lines eventually collapse above $z/k\approx 3$. The mean temperature profiles against $\log (z/k)$ meanwhile (figure 9f–h), do not show a single fully rough asymptote like the velocity, instead showing a persistent dependence on $k^+$.
(a–d) Intrinsically averaged velocity and temperature profiles for  $k^+ \approx 5.5$– $111$, where darker lines correspond to increasing $k^+$. The circle markers locate estimates for the beginning of the logarithmic region, $z^+_i = \max (30,z^+_r)$, where $z^+_r \approx \lambda ^+/2 = 3.55k^+$ is the roughness sublayer height (Chan et al. Reference Chan, MacDonald, Chung, Hutchins and Ooi2018) and the vertical lines mark the roughness crests, $z/k = 1$. The dashed lines show the smooth wall profile at ${Re}_{\tau } \approx 2000$. Only data below $(z-d)^+ = z_c^+$ are shown. (e–h) Intrinsically averaged profiles versus $z/k$ log-axes and (i–l) linear-axes highlighting the distributions within the roughness canopies ( $z/k \leq 1$). The dashed red lines in (e) demonstrate the insensitivity of high- $k^+$ trends with respect to the choice in $d/k$ by plotting $U^+ = (1/\kappa )\log [(z-d)/k] + C$, for $d/k=[0,1]$, where $C \approx 6.0$ is obtained from our $k_s/k = 2.7$ result (figure 7c).

Recall from § 2, the fully rough phenomenologies are distilled into a scaling law for the temperature at the beginning of the logarithmic region  $\varTheta ^+(z-d=z_i)\equiv \varTheta ^+_i \sim (k^+)^p{Pr}^{m}$. The exponents $p$ and $m$ will now be investigated. To obtain self-consistent measures of the various logarithmic intercepts in (1.1) and (1.2), we have performed regression fits to the logarithmic mean profiles in figure 9(a–d). For evaluation of $\varTheta _i^+$, we have adopted the prescription $z^+_i = \max (30,z^+_r)$, where $z^+_r \approx \lambda ^+/2 = 3.55k^+$ is the roughness sublayer thickness (Chan et al. Reference Chan, MacDonald, Chung, Hutchins and Ooi2018). The condition $z^+_i = z^+_r$ sets the beginning of the log layer to coincide with the end of the roughness sublayer and, as seen in figure 9(a–d), provides a reasonable estimate at higher $k^+$. For lower $k^+$, the flow retains a form similar to that of a smooth wall, with the roughness sublayer lying below the logarithmic region (Luchini Reference Luchini1996). For these instances, we set $z^+_i = 30$, which coincides with the typical interfacial height expected from a smooth-wall flow (Brutsaert Reference Brutsaert1982).
The  $\varTheta ^+_i \sim (k^+)^p$ scaling is assessed directly in figure 10(a). As the fully rough regime is approached, our present data support the $\varTheta ^+_i \sim (k^+)^{1/4}$ scaling of Brutsaert (Reference Brutsaert1975b), while the $\varTheta ^+_i \sim (k^+)^{1/2}$ scaling does not appear to be followed along any $k^+$ range. The failure of this scaling despite its contemporary support (Li et al. Reference Li, Rigden, Salvucci and Liu2017, Reference Li, Bou-Zeid, Grimmond, Zilitinkevich and Katul2020) will be treated specifically in §4.3. This continual increase in $\varTheta ^+_i$ with $k^+$ stands in contrast with what is understood in the interfacial velocity, $U^+_i \equiv U^+(z-d=z_i)$. As seen in figure 10(a), unlike with $\varTheta ^+_i$, a constant value $U^+_i \approx 9.0$ is attained. In figure 10(b), the $\varTheta ^+_i \sim {Pr}^{m}$ scaling is assessed. With increasing $k^+$, our data appear to be in reasonable agreement with the $m = 1/2$ scaling of Brutsaert (Reference Brutsaert1975b). In addition, the $\varTheta ^+_i \sim {Pr}^{2/3}$ smooth-wall scaling (Kader Reference Kader1981; Brutsaert Reference Brutsaert1982; Durbin & Pettersson-Reif Reference Durbin and Pettersson-Reif2011) is included, which is approached for small $k^+$. Owing to the success of both the $p = 1/4$ and $m=1/2$ scalings, we see that plotting the $\varTheta ^+_i \sim (k^+)^{1/4}{Pr}^{1/2}$ relation in figure 11(a) is able to collapse our $k^+ > 22$ data across all Prandtl numbers onto a single curve, $\varTheta ^+_i = 3.7(k^+)^{1/4}{Pr}^{1/2} + 2.6$, where the constants depend only on roughness geometry. This suggests that one needs to only find the constants for a single working fluid, i.e. a single ${Pr}$, and that the prediction may be generalised to arbitrary ${Pr} > 1$.
(a) Scaling of the interfacial temperature  $\varTheta ^+_i \equiv \varTheta ^+(z-d = z_i)$, where $z^+_i = \max (30,\lambda ^+/2)$, which shows an approach to $\varTheta ^+_i \sim (k^+)^{1/4}$ rather than $\varTheta ^+_i \sim (k^+)^{1/2}$ in the fully rough regime. The interfacial velocity, $U^+_i \equiv U^+(z-d=z_i)$ (black squares), by contrast, shows an approach to a constant $U^+_i \approx 9.0$. (b) The scaling of $\varTheta ^+_i$ with respect to ${Pr}$, where solid lines join data at matched $k^+$ which increase in darkness with $k^+$. This shows that high- $k^+$ tend to follow a $\varTheta ^+_i \sim {Pr}^{1/2}$ scaling, whilst at lower $k^+$, the smooth-wall $\varTheta ^+_i \sim {Pr}^{2/3}$ scaling is more closely followed. For the trends to be discernible, data for $k^+ < 33$ have been staggered down a decade, $0.1\varTheta ^+_i$, while the smooth wall data (square markers; blue line) show $0.15\varTheta ^+_i$.

(a) Interfacial temperature with respect to the  $p=1/4$, $m=1/2$ power-law scaling of Brutsaert (Reference Brutsaert1975b) which predicts the high- $k^+$ DNS data. (b) The same information in (a) reformulated using $z_0^+$ and the roughness Stanton number, ${St}_k$. For smooth walls, ${St}_k^{-1} = c_\theta {Pr}^{2/3} + (1/\kappa _\theta )\log [0.135/(c_\theta {Pr}^{-1/3})]$, deduced from the intersection of the conductive and logarithmic regions, where $c_\theta \approx 11.7$ presently. For fully rough, ${St}_{k}^{-1}=6.5(z^+_0)^{1/4}{Pr}^{1/2} - 4.6$ (see (4.1a)). The ${Pr} = 0.7$ data are processed from MacDonald et al. (Reference MacDonald, Hutchins and Chung2019). (c,d) Log-intercept $g(k_s^+,{Pr})$ comparing the present ${Pr} = 0.5$– $2.0$ sinusoidal roughness and the ${Pr} = 1.2$– $5.9$ close-packed granular type roughness of Dipprey & Sabersky (Reference Dipprey and Sabersky1963), with empirical fits given in (d).

Although the data of figure 11(a) are presented in terms of  $\varTheta ^+_i$ and $k^+$, the data can also be expressed using the roughness length $z_0$ or equivalent sand-grain roughness $k_s$. For example, we can obtain the inverse roughness Stanton number ${St}_k^{-1} \equiv \varTheta ^+(z^+_0) = (1/\kappa _\theta )\log (z_0/z_i) + \varTheta ^+_i$ by combining (1.2b) with (1.2d). Since $z_0 \propto z_i\propto k$ in the fully rough regime (Brutsaert Reference Brutsaert1982), this amounts to ${St}_k^{-1}\sim \varTheta ^+_i \sim (k^+)^{1/4}{Pr}^{1/2} \sim (z^+_0)^{1/4}{Pr}^{1/2}$, as is corroborated in figure 11(b). For completeness, the set of expressions equivalent to the $\varTheta ^+_i = 3.7(k^+)^{1/4}{Pr}^{1/2}+2.6$ result we find in figure 11(a) are
 \begin{gather} {St}_k^{{-}1}(z^+_0,{Pr}) = (1/\kappa_\theta) \log(z_0/z_i) + 3.7(k/z_0)^{1/4}(z^+_0)^{1/4}{Pr}^{1/2} + 2.6, \end{gather}
 \begin{gather}g(k^+_s,{Pr}) = (1/\kappa_\theta)\log(k_s/z_i) + 3.7(k/k_s)^{1/4}(k^+_s)^{1/4}{Pr}^{1/2} + 2.6, \end{gather}
 \begin{gather}\Delta \varTheta^+(k^+,{Pr}) = (1/\kappa_\theta)\log[(z_i/k)k^+] + A_\theta - 3.7(k^+)^{1/4}{Pr}^{1/2} - 2.6, \end{gather}
where  $z_0/z_i\approx 0.03$, $k/z_0 \approx 11$, $k/z_i = 1/3.55 = 0.28$ and $k_s/z_i \approx 0.76$ are self-consistent constants in the fully rough regime for our present roughness. In figure 11(b), we also include the smooth-wall asymptote, $\varTheta ^+(z^+_0) = (1/\kappa _\theta )\log (z^+_0) + A_\theta$, where $z^+_0 = \exp (\kappa A) \approx 0.135$ from combining (1.1a) and (1.1b), and $A_\theta = c_\theta {Pr}^{2/3} - (1/\kappa _\theta )\log (c_\theta {Pr}^{-1/3})$, where $c_\theta \approx 11.7$ presently. This $A_\theta$ form is deduced from the intersection of the conductive and logarithmic regions (e.g. Kader Reference Kader1981; Kays & Crawford Reference Kays and Crawford1993; Durbin & Pettersson-Reif Reference Durbin and Pettersson-Reif2011) and is commonly approximated by $A_\theta = a{Pr}^{2/3} - b$, where $a$ and $b$ are constants (cf. Brutsaert Reference Brutsaert1982, table 4.1). Figure 11(b) then provides an overall view for rough-wall heat transfer, from smooth to fully rough under a variety of working fluids.
In figure 11(c,d), we show comparisons of our present sinusoidal surface with experimental data on close-packed granular type roughness from Dipprey & Sabersky (Reference Dipprey and Sabersky1963) spanning  ${Pr} = 1.2$– $5.9$ adopting the $g$-function formulation (1.2c). We remark how their data tend to exhibit similar qualitative behaviour to our present sinusoidal surface: a minimum at $k^+_s \approx 70$, followed by the power-law dependence $g \sim (k^+_s)^p {Pr}^{m}$ in the fully rough regime. Their empirically fitted exponents, $p=0.20$, $m=0.44$ are similar to the proposals $p=1/4$, $m=1/2$ of Brutsaert (Reference Brutsaert1975b). Fixing $p = 0.20$, as done by Dipprey & Sabersky (Reference Dipprey and Sabersky1963), we find a similar value of $m=0.40$ that collapses our present data well (figure 11d).
A key ingredient to the Kolmogorov–Brutsaert phenomenology concerns the energy cascade from scales  $z_i \propto k$ to the Kolmogorov scale $\eta _K$, characterised by its constant turbulent dissipation rate $\varepsilon \sim U_{\tau }^3 / (\kappa k)$ in the well-mixed region (cf. figure 3a), which in dimensionless form is $\varepsilon ^+ \sim (\kappa k^+)^{-1}$. In figure 12(a), we compare this scaling against measurements of $\varepsilon$ approximately 0.3 $\nu /U_{\tau }$ above the roughness crests, which we presently compute as $\varepsilon \equiv 2\nu \overline {s^\prime _{ij} s^\prime _{ij}}$, where $s^\prime _{ij} \equiv (1/2)(\partial u^\prime _i / \partial x_j + \partial u^\prime _j / \partial x_i)$ is the fluctuating rate-of-strain tensor (Pope Reference Pope2000). The scaling is in good agreement with our present data, even appearing to hold at intermediate values of $k^+$ in the transitional regime, $k^+ \approx 22$. This could explain the success of Brutsaert's scaling in figure 11(a) at intermediate values of $k^+$.
(a) Turbulent dissipation rate  $\varepsilon \equiv 2\nu \overline {s^\prime _{ij} s^\prime _{ij}}$ computed approximately 0.3 $\nu /U_{\tau }$ above the roughness crests, compared against $\varepsilon ^+ \sim (k^+)^{-1}$ (dashed line) which in dimensional form is the $\varepsilon \sim U_{\tau }^3 / k$ approximation. (b) Streamwise energy spectra at the same $z$-location, normalised on Kolmogorov units. The vertical lines mark the roughness size $k$ and the black line adopts the model spectrum of Pope (Reference Pope2000) for the dissipation range, $\varPhi (K) = C_k\varepsilon ^{2/3}K^{-5/3}\exp \{ -\beta \{ [(K\eta _K)^4 + c_\eta ^4]^{1/4} - c_\eta \}\}$, $\varPhi _{u^\prime u^\prime }(k_x) = \int ^{\infty }_{k_x}K^{-1}\varPhi (K)(1- k_x^2/K^2)\, \mathrm {d}K$ with $C_k \approx 1.5$, $\beta \approx 5.2$ and $c_\eta \approx 0.4$. The range of Taylor Reynolds numbers, ${Re}_\lambda$ computed above the roughness crests is also provided.

Another view of this cascade is provided by figure 12(b) in streamwise energy spectra with respect to the streamwise wavenumber,  $\varPhi _{u^\prime u^\prime }(k_x)$, computed at the same $z$-location in figure 12(a), serving to illustrate the energy distribution across spatial scales and is related to the Reynolds stress as $\overline {u^\prime u^\prime }\equiv \int _0^{\infty } \varPhi _{u^\prime u^\prime }\,\mathrm {d}k_x$. Note that $k_x$ here is the streamwise wavenumber, not to be confused with the roughness length scale, and that $u^\prime$ is defined as the deviation from the time-average mean: $u^\prime (x,y,z,t) \equiv u(x,y,z,t) - \bar {u}(x,y,z)$. The $\varPhi _{u^\prime u^\prime }$ spectra show oscillatory peaks corresponding to harmonics of the roughness wavelength $\lambda /n$ for some integer $n$, and are more pronounced for low- $k^+$. Physically, these oscillations can be interpreted as the roughness topography creating motions near the wall with characteristic length scales $O(\lambda )$. Wall-parallel visualisations of velocity fluctuations at matched $z$-locations to the $\varPhi _{u^\prime u^\prime }$ spectra in figure 12(b) (not shown) were found to be consistent with this intuition, with imprints of the roughness topography visible in the form of small wakes coincident with roughness crests. These were most pronounced for low- $k^+$, much like the peaks of $\varPhi _{u^\prime u^\prime }$ appearing strongest for low- $k^+$. Likewise, results of surface features being visible in the turbulent fluctuations have been observed previously (e.g. Abderrahaman-Elena, Fairhall & García-Mayoral Reference Abderrahaman-Elena, Fairhall and García-Mayoral2019; Fairhall, Abderrahaman-Elena & García-Mayoral Reference Fairhall, Abderrahaman-Elena and García-Mayoral2019). It appears that the $k^+ \geqslant 22$ cases, where $\varepsilon ^+ \sim (k^+)^{-1}$ holds (figure 12a), display spectra which exhibit roughly universal behaviour at wavenumbers $k_x \eta _K > 10^{-2}$. Conventional understanding of turbulence argues that the inertial subrange down to the dissipation range becomes a universal function of $k_x\eta _K$ once an energy-cascade has developed through sufficient scale separation (Tennekes & Lumley Reference Tennekes and Lumley1972; Pope Reference Pope2000). The model spectrum (figure 12b, black line) of Pope (Reference Pope2000), which relies on this intuition, is closely followed by our $k^+ \geq 22$ spectra, supporting the view of Brutsaert (Reference Brutsaert1975b) in an energy-cascade having developed in the vicinity of the roughness elements. For reference, we also compute the Taylor Reynolds number above the roughness crests, ${Re}_\lambda \equiv u_{rms} \lambda _T/\nu$, where $\lambda _T \equiv u_{rms} (15\nu /\varepsilon )^{1/2}$ is the Taylor microscale and $u_{rms}$ is the root mean square streamwise velocity (Pope Reference Pope2000). Our present data cover a range ${Re}_\lambda \approx 13$– $87$ for $k^+ \approx 5.5$–111, and, for the $k^+ \geqslant 22$ cases which collapse in figure 12(b), cover ${Re}_\lambda \approx 44$–87. These magnitudes are similar to published data where a $k_x^{-5/3}$ scaling in the inertial subrange is weakly present (e.g. Saddoughi & Veeravalli Reference Saddoughi and Veeravalli1994; Dimotakis Reference Dimotakis2000; Donzis & Sreenivasan Reference Donzis and Sreenivasan2010), which appears consistent with our data.
4.3. Local roughness crest scaling
As was seen in figure 10(a), from a spatially averaged view, the  $p = 1/2$ exponent from the Prandtl–Blasius phenomenology is seen to fail in favour to the Kolmogorov–Brutsaert $p=1/4$ exponent for $\varTheta ^+_i \sim St_k^{-1}\sim (k^+)^p$. Whilst the failure of the $p=1/2$ in § 2.3 scaling may imply that the laminar boundary-layer phenomenology of Prandtl–Blasius is inappropriate for rough walls, we will demonstrate that such a phenomenology can be apt when we examine the flow locally at roughness crests. Here, the intuition which motivates this insight comes from the observation that roughness crests, being regions where the flow remains attached and is exposed to higher shear (cf. velocity in figure 8) are regions where we may expect the flow to be most analogous to a shear-driven, Prandtl–Blasius-type boundary layer.
In figure 13(a,b), we show time-averaged wall-normal velocity and temperature ( ${Pr} = 1.0$) profiles taken at roughness crests. The axes are scaled on the locally measured viscous friction velocity at the crest, $u_* \equiv \sqrt {|\tau _\nu |/\rho }$, where $\tau _\nu / \rho \equiv \partial u / \partial n|_w$ and local friction temperature $\theta _* \equiv q_w/(\rho c_p u_*)$. Here, we observe clear linear viscous–conductive regions, $u^*_{\mathrm {crest}} = z^*_{\mathrm {crest}}$ and $\theta ^*_{\mathrm {crest}} = {Pr} z^*_{\mathrm {crest}}$, with the extent of these regions corresponding to the local viscous and conductive sublayer thicknesses, $\delta _\nu$ and $\delta _\theta$, respectively. These thicknesses are located through the minima of second derivatives: $\mathrm {d}^2u_{\mathrm {crest}}/\mathrm {d}z^2$ and $\mathrm {d}^2\theta _{\mathrm {crest}}/\mathrm {d}z^2$ (figure 13a,b, markers). The insets of figure 13(a,b) show that these measures of $\delta _\nu$ and $\delta _\theta$ are indeed appropriate to scale $u_{\mathrm {crest}}$ and $\theta _{\mathrm {crest}}$ in the linear viscous–conductive regions for $k^+ \gtrsim 22$.
(a) Time- and phase-averaged velocity profiles at crest locations scaled by the local viscous friction velocity  $u_* \equiv \sqrt {|\tau _\nu |/\rho }$ with increasing line darkness with $k^+$. Here, $z_{\mathrm {crest}}$ measures the wall-normal distance taking roughness crests (cf. figure 6b) as the origin. The markers locate the local viscous sublayer thickness, $\delta _\nu$, situated by the local minima of $\mathrm {d}^2u_{\mathrm {crest}}/\mathrm {d}z^2$, and velocity at this location $u_{\delta _\nu }$ for each $k^+$ (the marker fill colours match the mean profile colours). A turbulent smooth-wall profile ( ${Re}_{\tau } \approx 2000$, red line) is included to illustrate the gradual approach to local smooth-wall conditions with increasing $k^+$. (b) Same as (a) but for temperature at ${Pr} = 1.0$, scaled on the local friction temperature $\theta _* \equiv q_w/(\rho c_p u_*)$. The markers locate the local conductive sublayer, $\delta _\theta$ (corresponding to $\mathrm {d}^2\theta _{\mathrm {crest}}/\mathrm {d}z^2$ minima locations) and the temperature at these locations, $\theta _{\delta _\theta }$. The insets of ( $a$,
$a$, $b$) demonstrate that re-scaling the profiles on viscous–conductive quantities, $(\delta _\nu,u_{\delta _\nu })$, $(\delta _\theta,\theta _{\delta _\theta })$, collapses the profiles and agree near the wall with the Prandtl–Blasius (PB) profiles.

The advantage in introducing these viscous–conductive quantities defined by the second derivative minima is that they can be computed unambiguously in smooth-wall DNS and are defined for Prandtl–Blasius boundary layers (cf. figure 4c), enabling direct comparison. Specifically, we may define a primitively scaled skin-friction coefficient,  $\widehat {C_f}$, Stanton number, $\widehat {St}$, as well as a viscous Reynolds number, ${Re}_{\delta _\nu }$:
 \begin{equation} \dfrac{\widehat{C_f}}{2} \equiv \dfrac{\tau_\nu}{\rho u_{\delta_\nu}^2}, \quad \widehat{St} \equiv \dfrac{q_w}{\rho c_p u_{\delta_\nu} \theta_{\delta_\theta}}, \quad {Re}_{\delta_\nu} \equiv \dfrac{u_{\delta_\nu}\delta_\nu}{\nu}. \end{equation}
Here, we use primitive scaling to refer to normalisations on the basic viscous–conductive quantities of the flow, such that one can define and compare the quantities in (4.2) between the different flow configurations (e.g. smooth wall versus roughness crest). In the case of Prandtl–Blasius boundary layers, one has that  $\widehat {{St}}{Pr}^{2/3} \propto \widehat {C_f} \sim {Re}_{\delta _\nu }^{-1}$ (Schlichting & Gersten Reference Schlichting and Gersten2017), coinciding with the Reynolds analogy (Bird et al. Reference Bird, Stewart and Lightfoot2007). In figure 14( $a$,
$a$, $b$), we test these scalings directly, while also comparing with the values obtained from a smooth-wall DNS ( ${{Re}_{\tau } \approx 2000}$) to illustrate the approach to smooth-wall-like conditions locally. The primitively scaled quantities for smooth walls did not change with ${Re}_{\tau }$, so we have elected to only show smooth-wall data for a single ${Re}_{\tau }$ in figure 14 for clarity. Our empirical fits, $\widehat {C_f}/2 = 1.9{Re}_{\delta _\nu }^{-1.17}$, $\widehat {St}{Pr}^{0.75} = 0.72{Re}^{-0.82}_{\delta _\nu }$ are similar to the theoretical ${Re}_{\delta _\nu }^{-1}$, ${Pr}^{2/3}$ exponents, providing supporting evidence for a Prandtl–Blasius-like behaviour at crests. The mismatch in the Reynolds number exponent between skin-friction and heat transfer $\widehat {C_f} \sim {Re}_{\delta _\nu }^{-1.17}$, $\widehat {St} \sim {Re}_{\delta _\nu }^{-0.82}$ is perhaps indicative of crest regions not being driven purely by a Reynolds-analogy-type mechanism. The compensated viscous-to-conductive sublayer ratio $(\delta _\theta /\delta _\nu ){Pr}^{1-2/3}$ (figure 14c), too, shows a mild departure from the Reynolds analogy limit of $(\delta _\theta /\delta _\nu ) {{Pr}^{1-2/3}} = \mathrm {constant}$, with instead a weak dependence on ${Re}_{\delta _\nu }$. Further assumptions in the rough-wall Prandtl–Blasius theory are tested in figure 14(d), where we examine the generalisation of the roughness length scale as an effective streamwise fetch for the local flow: $x \propto k$. Following our discussion surrounding (2.7a,b), this assumption led to the canonical $\delta _\nu / x \sim {Re}_{x}^{-1/2}$ of Prandtl–Blasius theory being modified to $\delta _\nu / k \sim {Re}_{k}^{-1/2}$, where ${Re}_k \equiv u_{\delta _\nu }k/\nu$. As seen in figure 14(d), measurements at the crests agree well with this prediction: $\delta _\nu /k = 1.38{Re}_k^{-0.50}$ for $k^+ \gtrsim 33$, thus supporting the local Prandtl–Blasius boundary-layer arguments put forward by Owen & Thomson (Reference Owen and Thomson1963) and Yaglom & Kader (Reference Yaglom and Kader1974) in § 2.3.
Empirical scalings measured at roughness crests for  $k^+ > 11$ showing (a) the viscous skin-friction coefficient normalised on primitive, viscous quantities, $\widehat {C_f}/2 \equiv \tau _\nu /(\rho u_{\delta _\nu }^2)$. The value computed from a smooth wall DNS ( ${Re}_{\tau } \approx 2000$) is also included. (b) Same as (a) for a Stanton number normalised on viscous–conductive quantities: $\widehat {{St}} \equiv q_w / (\rho c_p u_{\delta _\nu \theta _{\delta _\theta }})$. (c) Compensated ratio between local conductive and viscous sublayer thicknesses $(\delta _\theta /\delta _\nu ){Pr}^{1-2/3}$, which show a mild dependence on ${Re}_{\delta _\nu }$. (d) Scaling of $\delta _\nu /k \equiv {Re}_{\delta _\nu }/{Re}_k$ with respect to ${Re}_k$, which agrees with the theoretical ${Re}_k^{-1/2}$ prediction. The inset presents the empirical scaling of ${Re}_{\delta _\nu }$ with respect to $k^+$ to demonstrate the gradual approach to smooth-wall conditions ( ${Re}_{\delta _\nu }\approx 50$).

Next, we discuss the approach to smooth-wall-like behaviour at crests in the context of the smooth-wall DNS datapoints shown in figure 14( $a$–
$a$– $c$). Here, the smooth wall value ${Re}_{\delta _\nu }\approx 50$ has not yet been reached for our present $k^+$ range. As seen in the inset of figure 14(d) however, the ${Re}_{\delta _\nu } \approx 50$ limit at crests may eventually be attained owing to the continual growth with $k^+$: ${Re}_{\delta _\nu } = 3.1(k^+)^{0.46}$. This predicts the smooth-wall limit, ${Re}_{\delta _\nu } \approx 50$, to be reached once $k^+ \approx 420$ or $k^+_s = (k_s/k)k^+ \approx (2.7)(420) \approx 1140$. The approach to local smooth-wall conditions at crests may tie to a regime transition at even-higher $k^+$ beyond the fully rough regime, where the local boundary layers can become turbulent (Kraichnan Reference Kraichnan1962; Grossmann & Lohse Reference Grossmann and Lohse2011). The behaviour of such a regime, if it exists, would likely have implications in atmospheric flows for instance, where $k^+_s$ can approach $O(10^5)$ (Kanda et al. Reference Kanda, Kanega, Kawai, Moriwaki and Sugawara2007). Moreover, the existence of this regime will be contingent on extended attached-flow regions existing locally, such that the local boundary layer may develop. These conditions may depend on the strength of the local shear which will generally grow with $k^+$ and will change depending on the rough surface considered. Consequently, our $k^+ \approx 420$ extrapolation is specific to our present surface and is likely to change when considering alternative surfaces.
An alternative view of the approach towards local smooth-wall conditions at crests can be quantified by measuring the relative difference between the viscous sublayer thickness  $\delta _{\nu,{r}}^*$ and conductive sublayer thickness $\delta ^*_{\theta,{r}}$ at crests compared to smooth walls, $\delta _{\nu,{s}}^*$, $\delta ^*_{\theta,{s}}$ (the $r$ and $s$ subscripts denote rough- and smooth-wall values, respectively). These values are reported in figure 15. Here, the data show a tendency towards local smooth-wall conditions with increasing $k^+$, with our highest $k^+ \approx 111$ attaining approximately $80\,\%$ of the smooth-wall value. Our extrapolation from the inset of figure 14(d), which predicted the local smooth-wall transition at $k^+ \approx 420$, is also included in figure 15 (red squares). The figure 15 data appear to show a gradual slow-down of the approach to local smooth-wall conditions with increasing $k^+$. Though our $k^+ \approx 420$ extrapolation for local smooth-wall conditions may perhaps be plausible based on the trends on $\delta _{\nu,{r}}^*$ (i.e. the momentum field), this extrapolation is almost certainly not valid for $\delta _{\theta,{r}}^*$ (i.e. the thermal field), where the slow-down of growth with $k^+$ is more drastic.
(a) Relative difference of the local viscous sublayer thickness measured at the crests,  $\delta _{\nu,{r}}^* \equiv \delta _{\nu,{r}} u_*/\nu$ (the $r$ subscript denotes the value for the rough wall), for $k^+ \geq 11$, compared to the smooth-wall value $\delta _{\nu,{s}}^* \approx 7.3$ (the subscript $s$ denotes the smooth-wall value). The extrapolation to $k^+ \approx 420$, where smooth-wall conditions (figure 14d, inset) may be expected, is shown as a red square marker. (b) Same as (a) but for the conductive sublayer thickness, $\delta _\theta ^*$, at varying ${Pr}$. For ${Pr} = \{0.5,1.0,2.0\}$, $\delta _{\theta,{s}}^* \approx \{ 9.2,7.3,5.8\}$.

Having provided evidence in the time-averaged flow that heat transfer may be driven locally through a Reynolds-analogy-type behaviour, we now provide an instantaneous view to this behaviour in figure 16, showing joint-p.d.f.s (j.p.d.f.s) between the primitively scaled viscous skin-friction and local heat transfer,  $\widehat {C_f}$ and $\widehat {St}$, respectively. We include j.p.d.f.s computed from a smooth-wall DNS (coloured contours), and ‘crestward’ locations, which sample regions local to the roughness crests, $0.95k \leq z_w \leq k$. Emerging for both transitional $k^+ \approx 33$ (figure 16a–c) and fully rough $k^+ \approx 111$ (figure 16d–f) is a smooth-wall-like correlation between the local skin-friction and heat transfer at crestward locations running closely parallel to the Reynolds-analogy line $\widehat {C_f}/2 = \widehat {{St}}{Pr}^{2/3}$. The crestward j.p.d.f.s for both $k^+ \approx 33$ and $k^+ \approx 111$ tend to show greater standard deviations (width of the j.p.d.f.s) compared to the smooth wall which can be interpreted as a ${Re}_{\delta _\nu }$ effect. With increasing $k^+$ (and thereby ${Re}_{\delta _\nu }$), the crestward p.d.f.s shrink closer towards the smooth-wall p.d.f. The approach towards the smooth-wall mean values of $\widehat {C_f}$, $\widehat {{St}}$, square markers shown in figure 14(a,b), are also included in figure 16.
(Black) Conditional joint-p.d.f.s between the local viscous skin-friction coefficient  $\widehat {C_f}/2 \equiv \tau _\nu / (\rho u_{\delta _\nu }^2)$ and local Stanton number $\widehat {St} \equiv q_w / (\rho c_p u_{\delta _\nu }\theta _{\delta _\theta })$ for ${Pr} = 0.5$– $2.0$ at (a–c) $k^+ \approx 33$ and (d–f) $k^+ \approx 111$. The rough-wall data are conditionally sampled at regions local to crests: $0.95k \leq z_w \leq k$ and the normalisation choice enables direct comparison to smooth-wall DNS (coloured contours). Each contour level encloses 20–80 % of the total probability in increments of 20 %. The Reynolds-analogy line, $\widehat {C_f}/2 = \widehat {St}{Pr}^{2/3}$ (dashed red line), forms the principal axes for the smooth walls and appears approximately parallel in crestward regions. The mean values measured at crests (cf. figure 14a,b) are marked by the black squares and the mean values for the smooth wall DNS are marked by red squares.

A useful implication of these local smooth-wall scaling results at the crests is that they enable one to predict the crest skin-friction and heat transfer, relative to, say, the global friction and heat transfer in the form of the globally averaged crest velocity and temperature  $U_k \equiv U(z=k)$, $\varTheta _k \equiv \varTheta (z=k)$. Here, we make use of the scalings we report in figure 17, where the relation to the primitive viscous–conductive quantities, ( $\delta _\nu$, $u_{\delta _\nu }$), ( $\delta _\theta$, $\theta _{\delta _\theta }$), are linked to the globally averaged crest values $U_k$, $\varTheta _k$ and $k^+$. Specifically, figure 17 reformulates the original primitive scaling results presented in figure 14 to now adopt normalisations on the global friction velocity $U_{\tau }$ and globally averaged crest values $U_k$, $\varTheta _k$ for use in prediction. Notably in figure 17(b), we observe the velocity outside the viscous sublayer follows $u_{\delta _\nu }\approx 0.75 U_k \approx (0.75)(4.7) U_{\tau }$, i.e. $u_{\delta _\nu } \propto U_{\tau }$, as was proposed by Owen & Thomson (Reference Owen and Thomson1963) and Yaglom & Kader (Reference Yaglom and Kader1974), leading to the eventual $\delta _\nu ^+ \sim (k^+)^{1/2}$ prediction in (2.8a,b), a scaling that is affirmed by our data in figure 17(a) for $k^+ \gtrsim 33$. A likewise proportionality is observed at the conductive sublayer for heat transfer: $\theta _{\delta _\theta }\approx 0.75 \varTheta _k$. We now demonstrate how these results can be used for a local skin-friction and heat transfer prediction. Recognising that in the linear viscous–conductive regions, the velocity and temperature gradients are constant up to $\delta _\nu$ and $\delta _\theta$, respectively (cf. figure 13a,b), we set $\tau _{\nu }/ \rho = \nu u_{\delta _\nu }/\delta _\nu$ and $q_{w}/(\rho c_p) = \alpha \theta _{\delta _\theta }/\delta _\theta$. These relations may then be inserted into a local skin-friction coefficient for crests, $C_{f, \mathrm{crest}}$, and for a Stanton number, $St_{\mathrm {crest}}$:
 \begin{align}
{\frac{C_{f,\mathrm{crest}}}{2}} &\equiv
\dfrac{\tau_{\nu}}{\rho U_k^2} = \frac{ \nu
u_{\delta_\nu}/\delta_\nu}{U_k^2} = \left(
\frac{u_{\delta_\nu}}{U_k}\right) \left(
\frac{1}{U^+_k}\right)\left( \frac{1}{\delta_\nu^+}\right) \nonumber\\
&\approx \left( 0.75 \right) \left(
\frac{1}{4.7}\right) \left(\frac{1}{0.7} \right)
(k^+)^{{-}0.50} \approx 0.23(k^+)^{{-}0.50},
\end{align}
\begin{align}
{\frac{C_{f,\mathrm{crest}}}{2}} &\equiv
\dfrac{\tau_{\nu}}{\rho U_k^2} = \frac{ \nu
u_{\delta_\nu}/\delta_\nu}{U_k^2} = \left(
\frac{u_{\delta_\nu}}{U_k}\right) \left(
\frac{1}{U^+_k}\right)\left( \frac{1}{\delta_\nu^+}\right) \nonumber\\
&\approx \left( 0.75 \right) \left(
\frac{1}{4.7}\right) \left(\frac{1}{0.7} \right)
(k^+)^{{-}0.50} \approx 0.23(k^+)^{{-}0.50},
\end{align} \begin{align}{St}_{\mathrm{crest}}
&\equiv \frac{q_{w}/(\rho c_p)}{U_k \varTheta_k} =
\frac{\alpha \theta_{\delta_\theta}/\delta_\theta}{U_k
\varTheta_k} = {Pr}^{{-}1}\left(
\frac{\theta_{\delta_\theta}}{\varTheta_k}\right) \left(
\frac{1}{U^+_k}\right)
\left(\frac{1}{\delta_\theta^+}\right) \nonumber\\
&\approx \left( 0.75\right) \left( \frac{1}{4.7} \right)
\left(\frac{1}{0.97} \right)
(k^+)^{{-}0.42}{Pr}^{{-}0.72} \approx 0.16
(k^+)^{{-}0.42}{Pr}^{{-}0.72},
\end{align}
\begin{align}{St}_{\mathrm{crest}}
&\equiv \frac{q_{w}/(\rho c_p)}{U_k \varTheta_k} =
\frac{\alpha \theta_{\delta_\theta}/\delta_\theta}{U_k
\varTheta_k} = {Pr}^{{-}1}\left(
\frac{\theta_{\delta_\theta}}{\varTheta_k}\right) \left(
\frac{1}{U^+_k}\right)
\left(\frac{1}{\delta_\theta^+}\right) \nonumber\\
&\approx \left( 0.75\right) \left( \frac{1}{4.7} \right)
\left(\frac{1}{0.97} \right)
(k^+)^{{-}0.42}{Pr}^{{-}0.72} \approx 0.16
(k^+)^{{-}0.42}{Pr}^{{-}0.72},
\end{align}
where we have made use of the various results of figure 17 for the numerical prefactors. The relations (4.3)–(4.4) thus allow one to determine the viscous–conductive fluxes at the crests provided only  $k^+$ and ${Pr}$ within a constant of proportionality. These results then demonstrate how a $p=1/2$ type scaling in heat transfer, $St_{\mathrm {crest}} \sim (k^+)^{-p}$ as originally put forward in the Prandtl–Blasius ideas of Owen & Thomson (Reference Owen and Thomson1963) and Yaglom & Kader (Reference Yaglom and Kader1974) can be favoured for prediction. The key distinction here being to consider the heat transfer only in regions where the flow is attached and exposed to high-shear, where presently, we have demonstrated this case for roughness crests. Much like the original $p=1/2$ theories, these predictions are to be restricted to the high- $k^+$ or fully rough regime, $k^+ \gtrsim 33$, where the various scalings in (4.3)–(4.4) remain valid. Finally, it is worth mentioning that one may expect the validity of this local Prandtl–Blasius scaling to be restricted to regions of mild curvature, such that the local flow remains attached. For our present 3-D sinusoids, this curvature is characterised by the wavelength-to-height ratio $\lambda /k =7.1$. Overall, this paper suggests that the ratio of attached to separated flow regions is key to modelling the effect of roughness topography on heat-transfer (and drag) behaviour.
(a) Scaling behaviours of  $\delta _\theta ^+$ and $\delta _\nu ^+$ at the crests, with empirical fits provided. For clarity, $\delta _\nu ^+$ has been staggered down by a decade. (b) Various scaling behaviours of local viscous–conductive quantities at the crest linked to the globally averaged crest velocity and temperature, $U_k$, $\varTheta _k$.

4.4. Local roughness trough behaviour
Having seen at roughness crests that we may observe a Reynolds-analogy-like behaviour, we now provide an opposite view to this at roughness trough regions. Unlike crests, the flow in the vicinity of troughs is predominantly driven by a low-shear, reversed flow (cf. figure 8), such that we may expect vastly different behaviours to those we observed in § 4.3 at crests. Figure 18(a,b) demonstrates this with time-averaged velocity and temperature profiles ( ${Pr} = 1.0$) at trough regions. Here, the profiles are scaled on the crest values, $U_k$, $\varTheta _k$ and roughness height $k$, as opposed to the local friction velocity $u_*$ as with figure 13, since troughs are low-shear regions with $u_* \to 0$. The disparate behaviour between velocity and temperature is apparent: the near-wall flow is reversed ( $u_{\mathrm {trough}}<0$) with distinct minima in the velocity emerging, a feature entirely absent in the temperature profiles. The reversed flow is predominantly confined to $z_{\textrm{trough}}/k \lesssim 1$, and may perhaps serve as the primary flow which drives heat transfer locally. The insets of figure 18(a,b) show the profiles rescaled by viscous–conductive quantities situated through the local second derivative extrema, identical to the method adopted for crests in figure 13(a,b). Although these normalisations appear adequate for collapsing the temperature profiles, this is not the case for the streamwise velocity, perhaps indicating the existence of some other velocity and length scale as being appropriate. The absence of any Reynolds-analogy-type scaling at troughs may be further illustrated by the results of figure 18(c,d), where we show the locally measured skin-friction coefficient, $C_{f,{\mathrm {trough}}}/2 \equiv \tau _\nu /(\rho U_k^2)$, and Stanton number, ${St}_{\mathrm {trough}} \equiv q_w / (\rho c_p U_k \varTheta _k)$. These normalisation choices are identical to those chosen in (4.3)–(4.4) for crests to contrast with the Reynolds-analogy-like scaling behaviour that was seen at crests, $C_{f,\mathrm {crest}} \sim (k^+)^{-0.50}$, ${St}_{\mathrm {crest}}{Pr}^{0.72}\sim (k^+)^{-0.42}$. At trough regions, we instead find $|C_{f,\mathrm {trough}}| \sim (k^+)^{-0.20}$, ${St}_{\mathrm {trough}}{Pr}^{0.38} \sim (k^+)^{0.19}$, following neither the $St_{\mathrm {trough}}{Pr}^{1/2} \sim (k^+)^{-1/4}$ to be expected from surface renewal or the ${St_{\mathrm {trough}}{Pr}^{2/3} \sim (k^+)^{-1/2}}$ of Prandtl–Blasius. A contrast in behaviour between crests and troughs may be further visualised by the conditional j.p.d.f.s in figure 19 between the primitively scaled skin-friction coefficient and Stanton number, $\widehat {C_f}$, $\widehat {{St}}$, respectively. Here, ‘troughward’ regions, which sample regions local to troughs ( $-k \leq z_w \leq -0.95k$) show a vastly different behaviour to the Reynolds-analogy-like behaviour we had proposed for crestward regions originally in figure 16. Notably, the troughward j.p.d.f.s tend to be much wider than the crestward counterparts, indicating a greater prominence of skin-friction and heat-transfer fluctuations in the vicinity of troughs. The formation of a principal axes between $\widehat {C_f}$ and $\widehat {St}$ is perhaps weakly present in the troughward j.p.d.f.s. Moreover, these principal axes do not appear to strongly follow a reversed-flow Reynolds-analogy correlation $-\widehat {C_f}/2 = \widehat {St}{Pr}^{2/3}$ (dashed red line). Our intention in showcasing these contrasting results at troughs is to highlight the potential for multiple mechanisms to be at play in driving heat transfer locally. Much like at roughness crests where our analysis showed that a pure Reynolds-analogy-driven heat transfer did not quite emerge, it is possible that roughness troughs may experience the same crossover among multiple mechanisms. Unravelling the heat transfer mechanisms which underpin these flow-separated trough regions will require a deeper investigation, but is outside the scope of our present work.
(a) Time- and phase-averaged profiles at roughness troughs. Here,  $z_{\mathrm {trough}}$ measures the wall-normal distance taking roughness troughs (cf. figure 6b) as the origin. The local viscous sublayer and the velocity at this location, $\delta _\nu$, $u_{\delta _\nu }$ (square markers), is situated by maxima of the second derivative $\mathrm {d}^2u_{\mathrm {trough}}/\mathrm {d}z^2$. The inset rescales the profiles on $\delta _\nu$, $u_{\delta _\nu }$. (b) Same as (a) but for temperature at ${Pr} = 1.0$. (c,d) Local skin-friction coefficient and Stanton number at the troughs, normalised on the global crest velocity and temperature, $|C_{f,\mathrm {trough}}|/2 \equiv | \tau _\nu | /(\rho U_k^2)$, ${St}_{\mathrm {trough}}\equiv q_w/(\rho c_p U_k \varTheta _k)$, with empirical fits provided. The absolute value of skin-friction is taken to enable plotting on log-axes.

Conditional j.p.d.f.s between the primitive local skin-friction coefficient  $\widehat {C_f}/2 \equiv \tau _\nu /(\rho u^2_{\delta _\nu })$ and local Stanton number $\widehat {St} \equiv q_w/(\rho c_p |u_{\delta _\nu }| \theta _{\delta _\theta })$ (the absolute value of $u_{\delta _\nu }$ is taken to circumvent negative values for ${St}$) at varying ${Pr}$ and for (a–c) $k^+ \approx 33$; (d–f) $k^+ \approx 111$. The blue lines sample regions local to roughness troughs: $-k \leq z_w \leq -0.95k$ and is contrasted with the crestward j.p.d.f.s originally shown in figure 16 (black lines). A reversed-flow Reynolds-analogy line, $-\widehat {C_f}/2 = \widehat {St}{Pr}^{2/3}$ is given by the dashed red line.

5. Full-scale heat transfer predictions
Having seen the success of the Kolmogorov–Brutsaert fully rough model for the mean heat transfer (§ 4.2), we will examine here the implications this has on full-scale heat transfer predictions. One of the primary quantities of interest in heat transfer prediction is the Nusselt number,  ${Nu} \equiv {Re} {St} {Pr}$ (Kays & Crawford Reference Kays and Crawford1993), defined on an outer-scale Reynolds number, ${Re} \equiv hU_h/\nu$, and an outer-scale Stanton number, ${St} \equiv 1/(U^+_h \varTheta ^+_h) \equiv (C_F/2)^{1/2}/\varTheta ^+_h$, where $C_F \equiv 2/(U^{+2}_h)$ is a global friction coefficient encompassing both pressure and viscous drag. These use the velocity and temperature evaluated at the channel centreline: $U_h \equiv U(z=h)$, $\varTheta _h \equiv \varTheta (z=h)$.
Recall that in minimal channels, the mean profiles above the critical height  $z_c$ is unphysical and will need to be modelled before we evaluate $U_h$ and $\varTheta _h$. Presently, we have computed $U_h$ and $\varTheta _h$ from our DNS cases by extending the logarithmic regions towards the channel centreline, replacing the unphysical data beyond $z_c$. Doing so, we also neglect wake contributions to the mean profile. For additional comparison, we will adopt models which employ the logarithmic profiles (1.1) and (1.2) evaluated at $z=h$, again neglecting wake contributions to obtain $U^+_h$ and $\varTheta ^+_h$, respectively. The results can then be combined to obtain (cf. Kays & Crawford Reference Kays and Crawford1993, (13)–(48))
 \begin{equation} {Nu}{Re}^{{-}1}{Pr}^{{-}1} \equiv {St} = \frac{C_F/2}{(\kappa/\kappa_\theta) + \sqrt{C_F/2}/{St}_k}. \end{equation}
For model parameters, we use  $\kappa \approx 0.4$, $\kappa _\theta \approx 0.46$, that we have used throughout our manuscript. We use the fully rough model $\Delta U^+ = (1/\kappa )\log (2.7k^+) -3.5$ (cf. figure 7c) and the fully rough model of Brutsaert (Reference Brutsaert1975b): ${St}_k^{-1} = 6.5(z^+_0)^{1/4}{Pr}^{1/2}-4.6$ (figure 11b).
Shown in figure 20 are the variations of  ${Nu}$ and ${St}$ for our present study using $k/h = 1/18$. The adopted model (dashed lines) agrees well with our present DNS (markers) and for intermediate ${Re} \approx 10^4$– $10^6$, roughly follow the well-known smooth-wall scaling ${Nu} \sim {Re}^{0.8}$, ${St}\sim {Re}^{-0.2}$ (Kays & Crawford Reference Kays and Crawford1993). The smooth wall curves of figure 20 (solid lines), included for comparison, are obtained by adopting the same equation (5.1) as with the rough walls but with $\Delta U^+ = 0$ and $\Delta \varTheta ^+ = 0$ when obtaining $U^+_h$, $\varTheta ^+_h$ from the log-equations (1.1a) and (1.2a). In the insets of figure 20, we illustrate the paradox introduced in figure 7(b,d) concerning the effects of heat transfer augmentation at high Reynolds number when extrapolating the rough-wall log-intercepts (4.1a)–(4.1c) towards ${Re} \to \infty$, $k^+ \to \infty$. Whilst for intermediate ${Re}$, both ${Nu}$ and ${St}$ are larger for rough walls, indicating a heat transfer augmentation. There is an eventual crossover point with the smooth-wall curves. In the limit of large ${Re}$, we see that the fully rough model no longer predicts augmented heat transfer relative to a smooth wall, standing in contrast to how rough-wall heat transfer is conventionally viewed (Dipprey & Sabersky Reference Dipprey and Sabersky1963; Owen & Thomson Reference Owen and Thomson1963; Bons et al. Reference Bons, Taylor, Mcclain and Rivir2001). Despite the largely successful predictive capabilities of Brutsaert's model having been established for the present $k^+$ range in our study, a more concrete conclusion concerning the true asymptotic form of heat transfer as $k^+ \to \infty$, ${Re} \to \infty$ remains unsettled. It is worth highlighting that the data shown in figure 20 are for a fixed $h/k=18$. In practice, this may not always be the case, such as in river beds with $h/k=O(1)$ (Rouzes et al. Reference Rouzes, Moulin, Florens and Eiff2019). Such flows may have poorly defined logarithmic regions (Jiménez Reference Jiménez2004) which would make our model curves of figure 20 inapplicable. Provided $h/k$ is not too small and ${Re}$ is sufficiently large however, such flows will maintain a better-defined logarithmic region and we would expect the same trends we show in figure 20 to hold. Noteworthy is that several DNS studies (e.g. Chan et al. Reference Chan, MacDonald, Chung, Hutchins and Ooi2015; Thakkar et al. Reference Thakkar, Busse and Sandham2018; Ma et al. Reference Ma, Xu, Sung and Huang2020) have found that despite using $h/k=O(1)$, the log-intercept measurements can still remain robust.
(a) Nusselt number and (b) Stanton number dependence on the Reynolds number. Circle markers are from rough wall DNS at  $k/h = 1/18$. The solid lines are model lines obtained using the smooth-wall log law, whilst the dashed lines are from the fully rough models. The insets highlight the crossover points (crosses) between smooth- and rough-wall curves at high ${Re}$.

6. Conclusion
We have investigated the phenomenology surrounding rough-wall heat transfer by scrutinising a comprehensive DNS dataset, systematically varying both the Prandtl number,  ${Pr}$, and roughness Reynolds number, $k^+$. Our work begins to address the uncertainty that lingers concerning the asymptotic form of heat transfer in the fully rough regime by testing many of the hypothesised phenomenologies proposed to describe this regime (Li et al. Reference Li, Rigden, Salvucci and Liu2017, Reference Li, Bou-Zeid, Grimmond, Zilitinkevich and Katul2020). Although it appears that bulk measures from our data affirm the surface-renewal phenomenology (Brutsaert Reference Brutsaert1975b) consistent with Kays & Crawford (Reference Kays and Crawford1993), which proposes the interfacial temperature scaling $\varTheta ^+_i \sim (k^+)^{p}{Pr}^{m}$ with $p=1/4$, $m=1/2$ in the fully rough regime, the mechanism locally is more complex. Nevertheless, an energy-cascade-type scaling for ensemble-averaged measures of the dissipation, $\varepsilon \sim U_{\tau }^3/k$, a crucial element to the surface renewal theory, is upheld even in the vicinity of the roughness elements. We show that the ideas underpinning the $p=1/2$ Prandtl–Blasius, Reynolds-analogy-type scaling can remain robust in certain regions where the flow remains attached and is exposed to high shear such as roughness crests. This manifests as an empirical local heat transfer scaling, ${St}_{\mathrm {crest}}{Pr}^{0.72}\sim (k^+)^{-0.42}$, lying close to the ${St}_{\mathrm {crest}}{Pr}^{2/3}\sim (k^+)^{-1/2}$ to be expected from Reynolds analogy. However, the Reynolds-analogy scaling is violated in regions locally exposed to reversed flow and weak shear. The mechanisms which drive rough-wall heat transfer then are not captured by any singular mechanism, but likely an ensemble of different behaviours locally.
While the model of Brutsaert (Reference Brutsaert1975b) appears largely successful in predicting the mean heat transfer for the  $k^+$-range considered in our present study, the $\varTheta ^+_i \sim (k^+)^{1/4}$ predicted by this theory implies a continual decrease in $\Delta \varTheta ^+$ with $k^+$, eventually resulting in a negative $\Delta \varTheta ^+$. That is, roughness may cause a reduction in heat transfer relative to a smooth wall, which stands in contrast to how rough-wall heat transfer is conventionally viewed (e.g. Bons et al. Reference Bons, Taylor, Mcclain and Rivir2001) and poses a question concerning the true asymptotic form of rough-wall heat transfer as $k^+ \to \infty$. Examination of the local flow behaviour at crest regions exposed to higher shear shows a continual growth of the local viscous Reynolds number towards the smooth-wall value ${Re}_{\delta _\nu } \approx 50$, which is potentially indicative of a local smooth-wall-like regime transition. Though higher- $k^+_s$ data are ultimately needed to affirm the existence of this regime transition (cf. figure 15), we speculate its onset to occur at $k^+_s\approx 1140$, lying well within the expected range of natural flows (Kanda et al. Reference Kanda, Kanega, Kawai, Moriwaki and Sugawara2007).
Acknowledgements
We are indebted to Professor D. Lohse for having provided helpful feedback in the preparation of this manuscript.
Funding
The authors gratefully acknowledge the support of the Australian Research Council Discovery Project DP200100969. This research was undertaken with the assistance of resources from the National Computational Infrastructure (NCI Australia), an NCRIS enabled capability supported by the Australian Government. The authors also acknowledge the support of additional resources provided by the Pawsey Supercomputing Centre with funding from the Australian Government and the Government of Western Australia. This research was supported by the sustaining and strengthening merit-based access to National Computational Infrastructure (NCI) LIEF Grant (LE190100021) and facilitated by The University of Melbourne.
Declaration of interests
The authors report no conflict of interest.
Appendix A. Minimal channel influences on heat transfer
In this appendix, we present results comparing full-span and minimal channels at  $k^+ \approx 22$, assessing the domain size influences on heat transfer at ${Pr} = 0.5$, 1.0 and 2.0. The simulations are summarised in table 2. Here, $L_x$ and $L_y$ for smooth- and rough-wall simulations are matched exactly so domain size effects will not influence the results in our comparison. We summarise in figure 21 mean profiles and the difference between smooth- and rough-wall profiles from which $\Delta U^+$ and $\Delta \varTheta ^+$ are computed at $z = z_c$. Roughness functions quoted in table 2 are within $\pm 0.2$ for $\Delta U^+$ and $\Delta \varTheta ^+$, which are similar to statistical uncertainties in other minimal channel studies (MacDonald et al. Reference MacDonald, Chung, Hutchins, Chan, Ooi and García-Mayoral2017, Reference MacDonald, Hutchins and Chung2019; Endrikat et al. Reference Endrikat, Modesti, García-Mayoral, Hutchins and Chung2021). Given the good agreement between the full-span and minimal channels across the ${Pr}$ values with which we are concerned, we conclude that the use of minimal channels will be adequate in our study of the near-wall effects of rough-wall heat transfer.
(a–d) Mean velocity and temperature profiles comparing full-span (black) to minimal channels (coloured) at  $k^+ \approx 22$. Dashed lines correspond to smooth walls while solid lines are for rough walls. The dotted lines demarcate the unphysical region, $z > z_c$. The markers in (a) are the data from Moser, Kim & Mansour (Reference Moser, Kim and Mansour1999), while the markers in (c,d) are from Kozuka, Seki & Kawamura (Reference Kozuka, Seki and Kawamura2009). (e–h) Differences of smooth- and rough-wall velocities and temperatures from which $\Delta U^+$, $\Delta \varTheta ^+$ are computed at $z = z_c$.

Simulation parameters for full-span and minimal channel comparisons. Parameter definitions are the same as in table 1. Note that for full-span channels,  $T_s = T U_{\tau }/h$.

Appendix B. Low-Reynolds-number effects on heat transfer
A well-documented result in wall-bounded turbulence is that a low  ${Re}_{\tau }$ can alter the mean momentum and temperature balance of the flow (Wei Reference Wei2018). This can shift the logarithmic region, affecting the measurement of $\Delta U^+$ and $\Delta \varTheta ^+$ (Chan et al. Reference Chan, MacDonald, Chung, Hutchins and Ooi2015; Pirozzoli et al. Reference Pirozzoli, Bernardini and Orlandi2016; Alcántara-Ávila et al. Reference Alcántara-Ávila, Hoyas and Pérez-Quiles2018; Thakkar et al. Reference Thakkar, Busse and Sandham2018; MacDonald et al. Reference MacDonald, Hutchins and Chung2019). This low- ${Re}_{\tau }$ influence on heat transfer was investigated by MacDonald et al. (Reference MacDonald, Hutchins and Chung2019) at ${Pr} = 0.7$, $k^+ \approx 22$ for ${Re}_{\tau } \approx 395$ and 590, who found that the differences were primarily in the outer region of the flow such that ${Re}_{\tau } \approx 395$ would be adequate for studying near-wall effects. The purpose of this appendix will be to affirm this result for ${Pr} = 0.5$, 1.0, 2.0 with the simulations in table 3. The mean velocity and temperature profiles presented in figure 22(a–d) show that ${Re}_{\tau } \approx 395$ is satisfactory for capturing much of the near-wall behaviour across all ${Pr}$. The main discrepancies emerge at the outer-edge of the log layer in the vicinity of $z = z_c$. This is carried forward into the differences of smooth- and rough-wall velocities and temperatures (figure 22e–h), where $\Delta U^+$ and $\Delta \varTheta ^+$ are found to vary by $\pm 0.3$. These variations are similar to the statistical uncertainties we present in our main results of § 3.2. In light of this finding and the fact that the roughness sublayer region $z_r^+ \approx \lambda ^+/2 \approx 80$ (Chan et al. Reference Chan, MacDonald, Chung, Hutchins and Ooi2018) is still adequately captured by ${Re}_{\tau } \approx 395$, we deem ${Re}_{\tau } \approx 395$ as a suitable lower-bound for our parameter space.
(a–d) Mean velocity and temperature profiles at matched  $k^+ \approx 22$ for ${Re}_{\tau } \approx 590$ (black) and ${Re}_{\tau } \approx 395$ (coloured). Dashed lines correspond to smooth walls while solid lines are for rough walls. The dotted lines demarcate the unphysical region, $z > z_c$. (e–h) Differences of smooth- and rough-wall velocities and temperatures from which $\Delta U^+$, $\Delta \varTheta ^+$ are computed at $z=z_c$.

Simulation parameters for studying  ${Re}_{\tau }$ influences at a fixed $k^+ \approx 22$. Refer to table 1 for definitions of table entries.

Appendix C. Statistical sampling uncertainties in $k^+ = 111$ cases

Here, we provide details on the characteristic statistical uncertainties for our  $k^+ \approx 111$ cases in table 1, which have time-averaging periods $TU_{\tau }/z_c \approx 8.8$– $13.6$. Shown in figure 23 are the difference profiles between smooth and rough walls for the mean velocity and temperature, for $k^+ = 111$, ${Pr} = 1.0$ at progressively longer time-averaging periods. The near-wall, roughness sublayer region, $(z-d)^+ < z_r^+$, remains well-captured among all time-averaging periods. The log-intercepts, $\Delta U^+$ and $\Delta \varTheta ^+$, are taken to be the values at the minimal channel critical height $(z-d)^+ = z^+_c$, which show scatters of approximately 0.4 and 0.6 for $\Delta U^+$ and $\Delta \varTheta ^+$, respectively. These scatters are contextualised in figure 24 (a reproduced figure 7c,d of our present work) by overlaying these error bands of $0.6$ and $0.4$ for $\Delta U^+$ and $\Delta \varTheta ^+$, respectively. Here, we observe that these errors are commensurate to the uncertainties caused by the $d/k \in [0,1]$ variations investigated in § 3.2 and likewise, do not significantly alter the trends we observe in the fully rough regime.
The difference profiles between (a) streamwise velocity and (b) temperature for  $k^+ = 111$ and ${Pr} = 1.0$ obtained from progressively longer time-averaging periods $TU_{\tau }/z_c$. The log-intercepts, $\Delta U^+$ and $\Delta \varTheta ^+$, are computed as the difference profiles at the minimal channel critical heights (demarcated by the dotted lines), $z^+_c = 0.4L_y^+$. The roughness sublayer (RSL) height is demarcated by the dashed vertical line, $z_r^+ = \lambda ^+/2$ (Chan et al. Reference Chan, MacDonald, Chung, Hutchins and Ooi2018).


 Open access