







1. Introduction
Surface roughness is ever-present in engineering applications, involving complex fluid–structure interactions. Its implications on the flow and the consequent drag generation have been widely studied in the related literature. From the influence of roughness in pipe flow (Achenbach Reference Achenbach1971), to its effects on the trajectory of a golf ball (Chowdhury et al. Reference Chowdhury, Loganathan, Wang, Mustary and Alam2016), roughness plays a vital role in any application involving fluid–structure interaction considerations. For example, surface roughness can be detrimental to the performance of wind turbines. Sagol, Reggio & Ilinca (Reference Sagol, Reggio and Ilinca2013) found that the accumulation of contamination agents in the blades leads to a reduction in power extraction, whereas Ehrmann et al. (Reference Ehrmann, Wilcox, White and Maniaci2017) reported a performance decrease linked to an increase in roughness density and height. On the other hand, the use of roughness elements can lead to a drag reduction and certain performance gains for unsteady propulsion systems. Previous studies inspired from swimmers and flyers show that, from shark skin or dolphin skin (Dean & Bhushan Reference Dean and Bhushan2010) to feathers on a wing of a gliding bird (Van Bokhorst et al. Reference Van Bokhorst, De Kat, Elsinga and Lentink2015), roughness in varying shapes and texture modifies the fluid flow over propulsor surfaces, leading to a reduction in drag or a decrease in flow separation. In engineering applications, Gad-el Hak & Bushnell (Reference Gad-el Hak and Bushnell1991) analysed the effects of roughness turbulators and found an increase in the ratio between the lift and the drag coefficient when compared with a smooth foil for chord-based Reynolds number lower than  $100\,000$. In addition, the use of surface riblets can lead to a decrease in skin friction when aligned in the flow direction (Bechert et al. Reference Bechert, Bruse, Hage, Van der Hoeven and Hoppe1997), achieving a drag reduction of up to $8\,\%$ (Walsh Reference Walsh1982). An important roughness parameter to consider is the roughness Reynolds number $H^+$, defined as $H^+ = H u_\tau /\nu$ where $H$ is the height of the rough element, $\nu$ is the kinematic viscosity and $u_\tau$ is the friction velocity. For $H^+$ values less than 70, the flow is usually characterised as transitionally rough. When $H^+>70$, the rough elements extend into the logarithmic region, the smooth-wall viscous sublayer is assumed to have been completely destroyed and the surface is considered to be fully rough (Bakken et al. Reference Bakken, Krogstad, Ashrafian and Andersson2005).
Recent studies have analysed the effects of superhydrophobic coating on the surface of pitching foils. Mallah et al. (Reference Mallah, Sooraj, Sharma and Agrawal2021) reported an increase in the lift and thrust production for a pitching foil at low Strouhal values when compared with a smooth foil, which could lead to improved manoeuvrability and propulsive efficiency.
When configured properly, surface roughness can be beneficial. It can reduce drag production and potentially improve the overall performance. Surface roughness can also have detrimental effects. Tailoring the surface roughness to have an improved performance requires a better understanding of the effect of shape, size and area distribution of roughness elements on both the force production and the flow.
The drag-reduction potential of surface roughness on aquatic swimmers have been explored mainly for static surfaces. For example, sharks can reduce their skin friction when their riblets are aligned with the flow (Dean & Bhushan Reference Dean and Bhushan2010). Bixler & Bhushan (Reference Bixler and Bhushan2013) pointed out that the riblets lift and pin the vortices generated in the viscous sublayer, leading to a decrease in drag. Bechert, Bruse & Hage (Reference Bechert, Bruse and Hage2000) observed a drag reduction for interlocking 3D riblets. Afroz et al. (Reference Afroz, Lang, Habegger, Motta and Hueter2016) concluded that ‘shark-like’ textures can act like a passive flow separation control mechanism. Du et al. (Reference Du, Li, Cao, Wan, Xiang, Lv and Duan2022) found smaller separated regions and adverse pressure gradients for the flow over a foil covered with tilted biomimetic shark scales. The effect of the shape and size of the rough elements were analysed by Domel et al. (Reference Domel, Domel, Weaver, Saadat, Bertoldi and Lauder2018a), highlighting the importance of the denticle shape, as they found a drag reduction only for the smaller of the three considered. Although surface roughness has shown promising potential for static bodies, its role in unsteady systems is still not clear. Shark-skin surfaces have been shown to increase the self-propelled swimming speed and reduce the drag of a flapping foil (Oeffner & Lauder Reference Oeffner and Lauder2012; Domel et al. Reference Domel, Domel, Weaver, Saadat, Bertoldi and Lauder2018a), but only when small denticles are used, whereas the larger elements can lead to an increase in drag. Wen, Weaver & Lauder (Reference Wen, Weaver and Lauder2014) reported a reduction in energy consumption due to a formation of stronger leading-edge vortices. Guo et al. (Reference Guo, Zhang, Yasuda, Yang, Galipon and Rival2021) found that, for steady foils, the roughness elements resulted in a considerably thicker boundary layer when compared with the smooth foil, whereas for dynamic foils, the changes due to roughness in the wake characteristics were considerably smaller. Mostly, previous work conclude that shark-inspired surfaces can improve the performance of an unsteady body, but the potential benefit is strongly dependent on the shape and size of shark denticles, which often appear in highly complex geometries. Therefore, it is still to be seen if such performance improvement can be achieved with simple, commercially available roughness elements, located on the surface of an unsteady foil in harmonic motions.
In this study, we analyse experimentally the effects of surface roughness on the propulsive performance of a pitching foil by using simple roughness elements. In § 2, we define the methodology and experimental set-up used to actuate three different foils with varying roughness characteristics. We investigate the effects of chord-based Reynolds number in the range of  $17\,000 \leq Re \leq 33\,000$ and report the propulsive performance of a pitching hydrofoil in terms of thrust production ( $C_X$) and efficiency ( $\eta$). In § 3, we detail the force and flow measurement results obtained for flapping foils, and draw a comparison between dynamic and static foil cases.
2. Experimental set-up and methodology
Force and flow measurements are conducted in a recirculating water flume at the University of Southampton, with a test section of 8.1 m length, 1.2 m width and 0.9 m depth. A surface plate is installed at the foil tip and the foil is placed right above the bottom wall to prevent tip vortex formation and enforce nominally two-dimensional flow over the foil as shown in figure 1(a).
Schematics of the experimental set-up in the water flume (a), the actuation arm (b), foils with three different roughness area coverage ratio (c) and the forces acting on the foil (d).

Three foils with a rectangular planform and a NACA0012 cross-section were 3-D-printed using polylactic acid (PLA) filaments with an infill density of 70 %, a chord-length of  $c = 0.16\,{\rm m}$ and an aspect ratio of $AR=2.5$. Spherical-cap-shaped roughness elements with a width (diameter) of $W = 0.05c$ and height of $H=0.01c$ (Domel et al. Reference Domel, Saadat, Weaver, Haj-Hariri, Bertoldi and Lauder2018b) were placed on pressure and suction sides of the foils. As shown in figure 1(c), in addition to the smooth foil, two different roughness levels are considered by varying the area occupied by the spherical-cap elements to $36\,\%$ and $70\,\%$ of the foil planform area. The rough elements were distributed in uniform streamwise rows on both sides of the foil to ensure symmetry, with the amount of rough elements designed to achieve the coverage areas defined before.
Each foil was actuated with a stepper motor (Applied Motions STM23S) in sinusoidal pitching motions, about a point  $0.08c$ distance from the leading edge. The prescribed motion is defined by $\theta (t)=\theta _0 \sin (2{\rm \pi} f_0 t)$, where $\theta _0$ is the pitching amplitude and $f_0$ is the flapping frequency. The pitching amplitude $\theta _0$, Strouhal number $St=2c\sin (\theta _0)f_0 /U$ and reduced frequency $k=2{\rm \pi} f_0 c/U$ were fixed all throughout the experiments at $\theta _0=7.5^\circ$, $St \approx 0.22$ and $k\approx 5.2$, in line with previous studies (Mackowski & Williamson Reference Mackowski and Williamson2015; Kurt & Moored Reference Kurt and Moored2018; Senturk & Smits Reference Senturk and Smits2019; Fernandez-Feria & Sanmiguel-Rojas Reference Fernandez-Feria and Sanmiguel-Rojas2020). A Reynolds number sweep ( $Re=Uc/\nu$ where $\nu$ is the kinematic viscosity) was conducted within the range of $17\,000 \leq Re \leq 33\,000$ by varying the flow velocity, $U$. It has been reported in previous studies (Senturk & Smits Reference Senturk and Smits2019) that $Re$ can have a major impact on the propulsive performance of a pitching foil, although as $Re$ is increased over $Re=16\,000$ the thrust production appears to reach a constant value. A summary of the parameters used in this study is given in table 1.
Experimental parameters used in the current study.

The forces and moments acting on the foils were measured with a six-axis force sensor (ATI Gamma IP65). The motion was tracked using a rotary, incremental encoder (US Digital E5) attached to the motor shaft (figure 1b). Each trial was conducted for a total of 100 flapping cycles (where  $t/T= 1$ cycle) and repeated five times. The measured forces were filtered using a Butterworth filter with a low-pass frequency of seven times the flapping frequency. The power was calculated as a multiplication of the pitching moment and the angular velocity, which was derived from the measured angular displacement. The instantaneous and time-averaged performance metrics are the average values from 500 flapping cycles, measured over five trials ( $N=5$). The confidence intervals are calculated following a $t$-distribution with 5 samples, as $\bar {x} \pm 4.60\sigma /\sqrt {N}$, where $\bar {x}$ is the sample mean, $\sigma$ is the sample standard deviation and $N$ corresponds to the number of repetitions (five). To distinguish instantaneous forces from time-averaged results, the latter is denoted by $\overline {(.)}$. The reported streamwise force (thrust) ( $C_X$) and power ( $C_P$) coefficients and efficiency ( $\eta$) are defined as
 \begin{equation} C_X = \frac{F_X}{\dfrac{1}{2}\rho U^2 sc}, \quad C_P = \frac{P}{\dfrac{1}{2}\rho U^3 sc}, \quad \eta=\frac{C_X}{C_P}, \end{equation}
where  $\rho$ is the density of water, $s$ is the hydrofoil span and $U$ represents the free-stream flow velocity.
The force measurements were synchronised with planar particle image velocimetry (PIV) measurements (cameras, LaVision MX 4MP; lasers, Litron Nano PIV). The field of view captures the entire foil and up to one chord-length in the foil's wake. The software Davis 10 was used to cross-correlate the acquired particle image pairs (with  $24\times 24$ pixels with 50 % overlap). The flapping cycle was divided into 22 phases and 25 cycles were acquired per phase. The velocity fields corresponding to each phase were then averaged over 25 cycles.
3. Results
3.1. Flow-field and force production analysis of foils with different roughness area coverage ratios
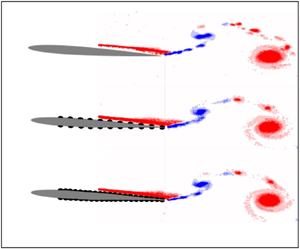
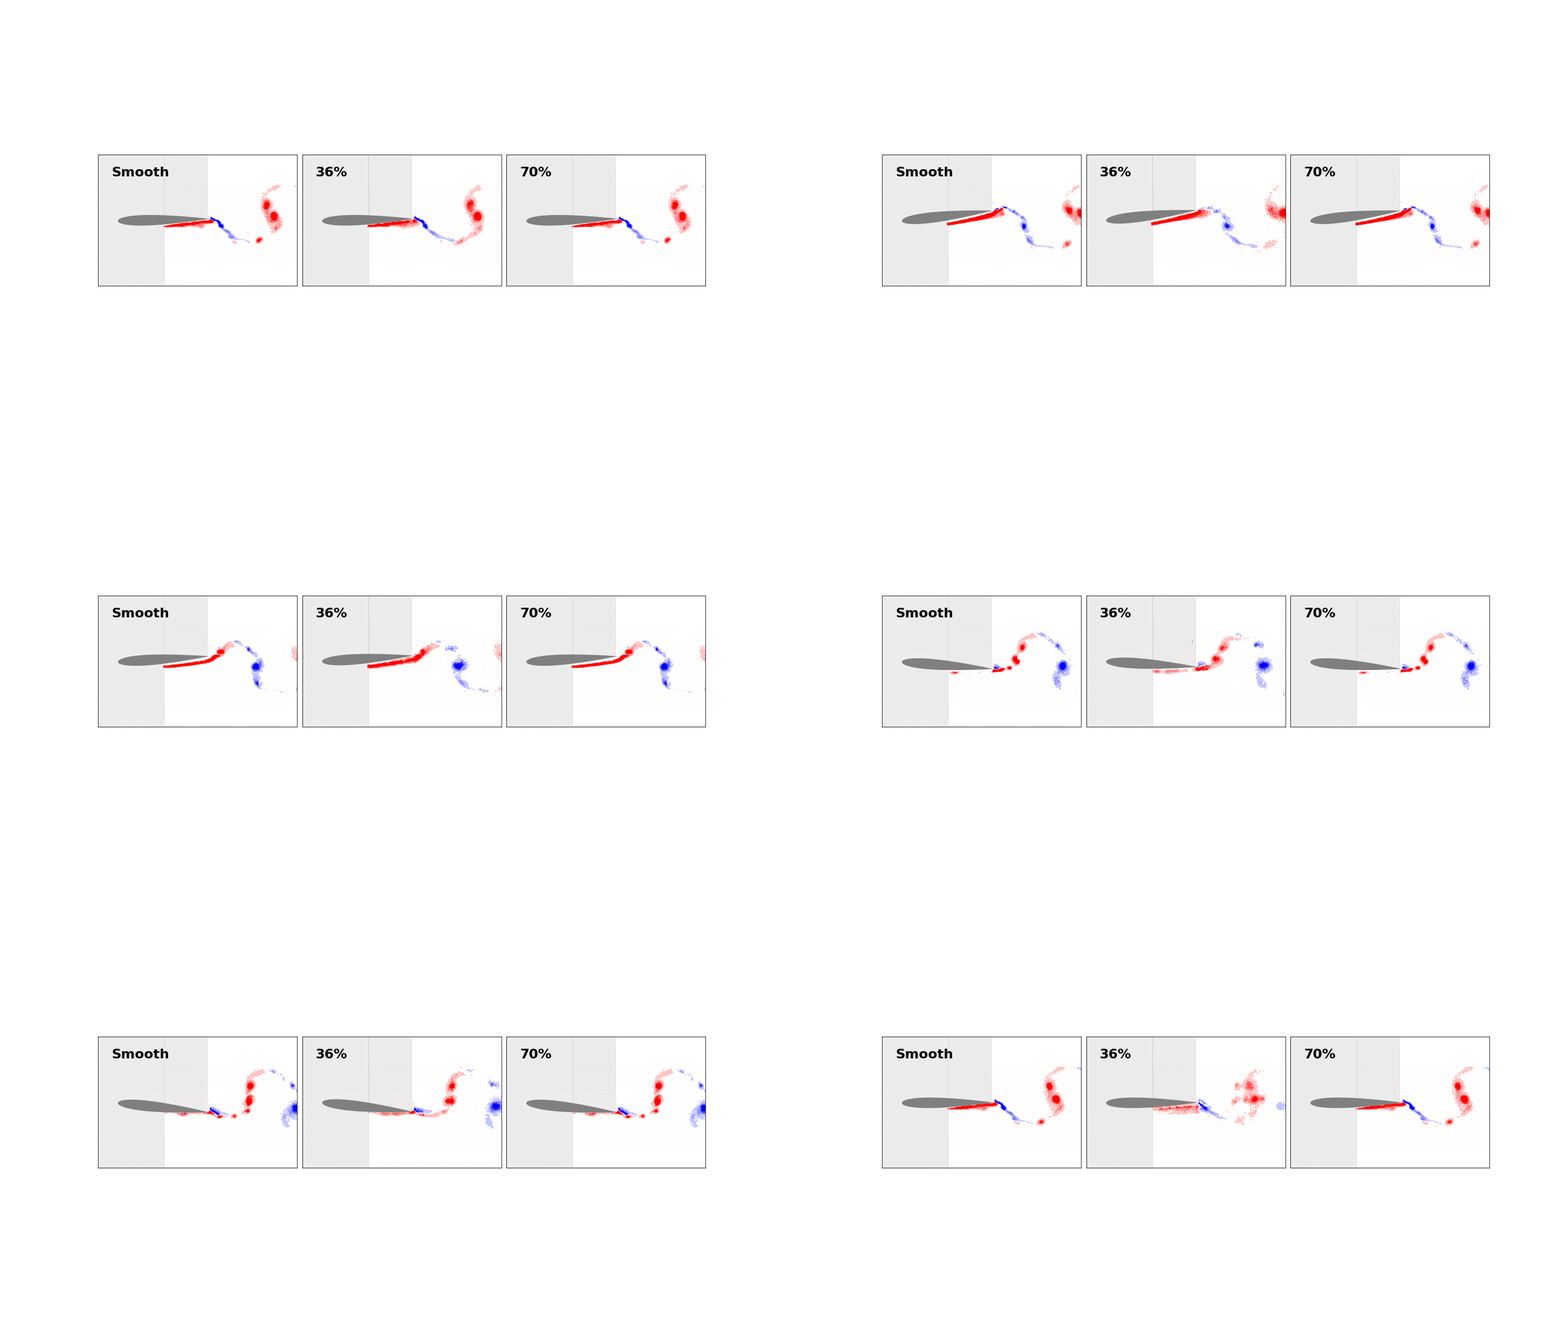
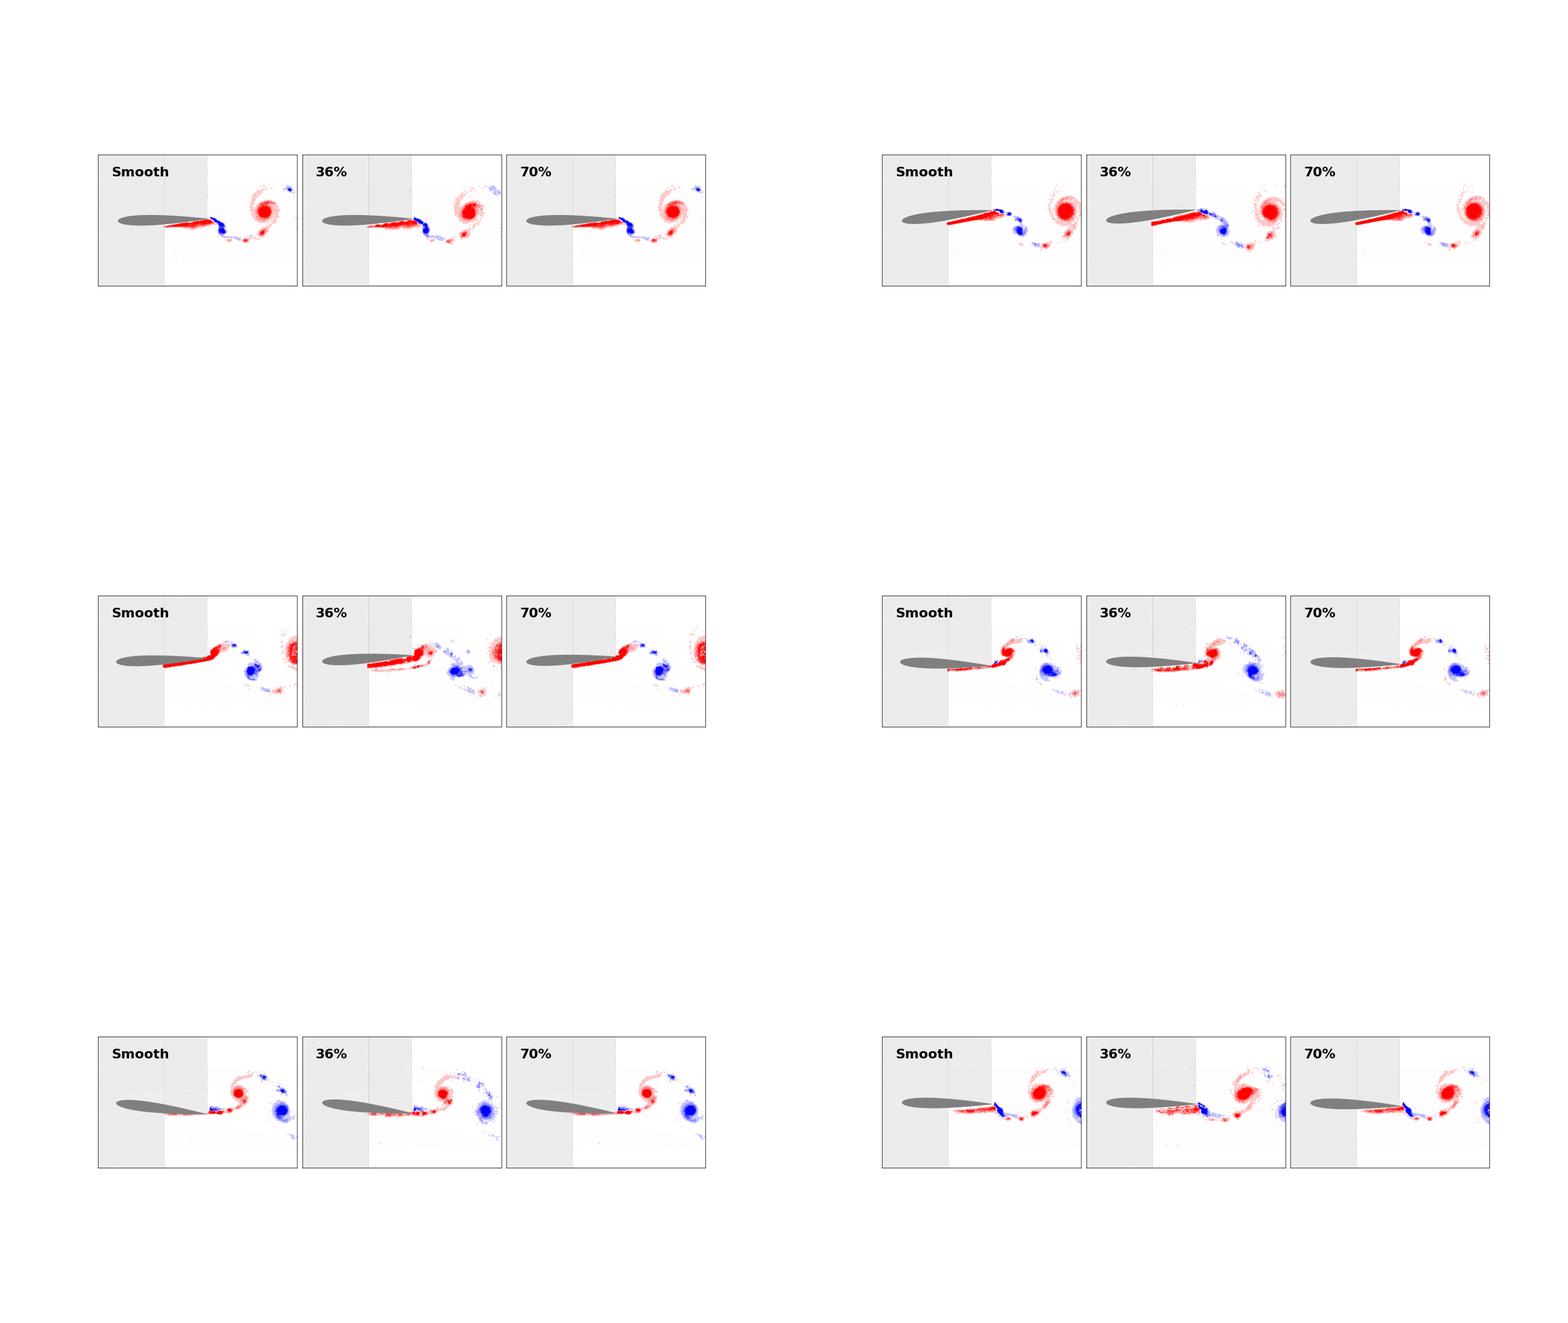
Figure 2 compares the out-of-plane vorticity and the instantaneous performance coefficients,  $C_X$ and $C_P$, for all the roughness cases considered at $Re=28\,000$. The first column (a,d), the second column (b,e) and the third column (c,f) present the evolution of the vorticity field around three pitching foils with $0\,\%$, $36\,\%$ and $70\,\%$ surface roughness at $t/T=0.15$ and $t/T=0.50$, respectively. Surprisingly, change in the roughness does not lead to any significant alteration in the vorticity fields. Regardless of the roughness coverage, all foils produce a reverse von Kármán–Street where two counter-rotating vortices per flapping cycle are shed from the trailing edge into the wake, as widely observed in the related literature for smooth foils (Anderson et al. Reference Anderson, Streitlien, Barrett and Triantafyllou1998; Schnipper, Andersen & Bohr Reference Schnipper, Andersen and Bohr2009; Muscutt, Weymouth & Ganapathisubramani Reference Muscutt, Weymouth and Ganapathisubramani2017; Kurt & Moored Reference Kurt and Moored2018). Figure 2(g,h) presents the evolution of cycle-averaged thrust and power coefficients over one flapping cycle. Similar to the flow fields, the performance coefficients show only minor differences between the smooth foil and the foils with roughness. Although we have only revealed the analysis associated with a single $Re$, these results hold across the $Re$ range considered here. In the supplementary material available at https://doi.org/10.1017/jfm.2023.1009, we present the evolution of the flow field over one flapping cycle at $Re=17\,000$ and $Re=28\,000$ as videos for comparison. Overall, these results from force and flow field measurements show that incorporating surface roughness does not have a strong influence on the development of the wake. Other parameters, such as Strouhal number or kinematics (Schnipper et al. Reference Schnipper, Andersen and Bohr2009), are known to significantly affect the evolution of the vortex structures, which can minimise the adverse effects on performance induced by the roughness elements.
PIV results for  $Re=28\,000$: $t/T=0.15$ (a–c) and $t/T=0.50$ (d–f) for the smooth (a,d), $36\,\%$ (b,e) and $70\,\%$ (c,f). Instantaneous $C_X$ (g) and instantaneous $C_P$ (h). Panels (g,h) contain confidence intervals calculated as $CI=4.6 \sigma / \sqrt {N}$.

Figure 3 introduces the spectral analysis conducted for the raw, pre-filtered  $C_X$ forces. The power spectra of the thrust force at $Re=28\,000$ is shown in (a). The crosses indicate the location of the peak frequency for each foil. In (b), we introduce the dominant frequency ratio in the form of $f/f_0$, where $f_0$ is the prescribed pitching frequency across the $Re$ range considered. This analysis shows that the dominant frequency in thrust production corresponds to twice the pitching frequency $f_0$ for all the $Re$ values and contains similar energy density for all the foils. This result, combined with the similarities observed in both the wake and the instantaneous forces, indicates that the performance of the foils is highly dominated by $f_0$, hence, by the kinematics. The dominant effects of the frequency and the kinematics on the development of the propulsive forces have been seen before. For example, Zurman-Nasution, Ganapathisubramani & Weymouth (Reference Zurman-Nasution, Ganapathisubramani and Weymouth2021) found that, compared with the flapping frequency and kinematics, shape-related parameters such as sweep angle have negligible effects on the propulsive performance. We believe that the influence of the rough elements is small compared with the effects that the kinematics and $St$ have on the $C_X$ and $C_P$ evolutions.
(a) Power spectral density analysis of the instantaneous  $C_X$ at $Re=28\,000$. The cross indicates the location of the peak for each case. (b) Peak frequency across the $Re$ values considered. A value of 2 denotes that the thrust force signal peak $f$ is equal to twice the input pitching frequency $f_0$.

Figure 4 presents the change in cycle-averaged performance coefficients for foils with different roughness coverages against  $Re$. We compare our results with other NACA0012 studies conducted by Mackowski & Williamson (Reference Mackowski and Williamson2017) ( $Re = 16\,600$, $k=4$), Senturk & Smits (Reference Senturk and Smits2019) ( $500 \leq Re \leq 32\,000$, $0.2 \leq St \leq 0.6$) and Fernandez-Feria & Sanmiguel-Rojas (Reference Fernandez-Feria and Sanmiguel-Rojas2020) ( $Re = 16\,000$, $4 \leq k \leq 60$). The thrust, $\overline {C_X}$, obtained for the smooth foil increases in the $17\,000 \leq Re \leq 28\,000$ range, in line with previous studies (Senturk & Smits Reference Senturk and Smits2019). The trend then reverses at $Re = 33\,000$. This change can be explained by looking at the evolution of the averaged-drag $C_D$ calculated for a static foil at $\theta =0$ (figure 5), where we observe a similar behaviour. The increase in the averaged $C_D$ at $Re=33\,000$ explains the decrease in $\overline {C_X}$ reported for the pitching foil at figure 4. Nevertheless, the thrust values obtained in the current study fall within the findings by Senturk & Smits (Reference Senturk and Smits2019) at $St = 0.2$ and $St = 0.4$. The main differences in the overall thrust production, higher in our study, can be associated with the effects of the pivot point location ( $PP = 0.08c$ here and $PP = 0.25c$ in Senturk & Smits Reference Senturk and Smits2019), since as the $PP$ moves towards the leading edge, a higher thrust production is expected (Mackowski & Williamson Reference Mackowski and Williamson2017). Finally, in the inset enclosed by a blue box, it is shown that $\overline {C_X}$ decreases consistently with the addition of surface roughness across the $Re$ range. In figure 4(b) we introduce the averaged power $\overline {C_P}$ and efficiency $\eta$. For each roughness case, $\overline {C_P}$ increases in the $17\,000\leq Re\leq 28\,000$ range. The trend is then reversed, in line with the $\overline {C_X}$ values. Regardless of the $Re$, we observe that an increase in roughness causes a decrease in $\overline {C_P}$. Regarding the efficiency, our results indicate higher $\eta$ values than Mackowski & Williamson (Reference Mackowski and Williamson2017), Fernandez-Feria & Sanmiguel-Rojas (Reference Fernandez-Feria and Sanmiguel-Rojas2020) and Senturk & Smits (Reference Senturk and Smits2019), which could be due to differences in the pivot point location (at $x/c=0.08$ distance from the leading edge in our study and at $x/c=0.25$ distance in Senturk & Smits Reference Senturk and Smits2019), or the reduced frequency $k$ (
$k$ ( $k=5.2$ here and $k=4$ in Mackowski & Williamson Reference Mackowski and Williamson2017; Fernandez-Feria & Sanmiguel-Rojas Reference Fernandez-Feria and Sanmiguel-Rojas2020). We observe that any change in $\eta$ with $Re$ for the smooth case fall within the confidence intervals. Although Senturk & Smits (Reference Senturk and Smits2019) point to an increase in $\eta$ against increasing $Re$ for a smooth pitching foil, other studies have reported a limited impact of $Re$ on the propulsive performance of a pure-pitching foil for $Re\geq 8000$ (Deng et al. Reference Deng, Sun, Teng, Pan and Shao2016). It might very well be a limitation of experimental measurements to delineate the difference in efficiency with increasing Reynolds number since it is a notoriously difficult quantity to measure accurately.
(a) Values of  $\overline {C_X}$ obtained in the current study (blue range) and compared with previous studies against $Re$: Senturk & Smits (Reference Senturk and Smits2019) (grey). The data enclosed by the blue box present an inset of $\overline {C_X}$ data for the $Re$ range of $17\,000\leq Re\leq 33\,000$. (b) Results of $\overline {C_P}$ (hexagon) and $\eta$ (cross) for current and previous studies: Mackowski & Williamson (Reference Mackowski and Williamson2017) (dark grey) for $Re=16\,600$, $k=4$, $PP=0c$ and $\theta _0=8^{\circ }$; Senturk & Smits (Reference Senturk and Smits2019) (grey) for $500 \leq Re \leq 32\,000$, $St=0.2\unicode{x2013}0.4$, $PP=0.25c$ and $\theta _0=8^{\circ }$; Fernandez-Feria & Sanmiguel-Rojas (Reference Fernandez-Feria and Sanmiguel-Rojas2020) for $Re=16\,000$, $k=4$, $PP=0c$ and $\theta _0=8^{\circ }$. The shadow region introduces the confidence intervals calculated as $CI=4.6 \sigma / \sqrt {N}$.

Averaged  $C_D$ values obtained for a static smooth foil at $\theta =0^{\circ }$. The shadow region introduces the confidence intervals calculated as $CI=4.6 \sigma / \sqrt {N}$.

In relation to the rough foils, the efficiency also decreases as the surface roughness increases, similar to thrust and power. Although the flow fields show negligible alterations with the change in roughness, the cycle-averaged forces point to a performance reduction as the roughness increases. The thrust decrease observed for  $36\,\%$ and $70\,\%$ roughness coverages compared with smooth foil can be related to an increase in the profile drag. To further explore this effect, in the next section, we have compared our flapping foil results with static foil measurements carried out using the same foils within the same $Re$ range.
3.2. Comparison between static and flapping regimes
In this section, we introduce the data collected for static foils and compare it with the pitching foil results to further explore why there is a change in thrust production with a change in roughness coverage. The static data were acquired within the same  $Re$ range and roughness coverages as the flapping cases, for an angle of attack ( $\theta$) range of $-4^\circ \leq \theta \leq 20^\circ$. To compare both scenarios, we have selected an angle of attack value equal to the average $\theta$ experienced by the foil during half the pitching cycle (red dashed line in figure 6(a), denoted as $\theta _{s}$). Next, we develop a comparison parameter or penalty that evaluates the change in streamwise force generated by the smooth and rough foils. Given that static state will produce drag (for all three foils) and the unsteady scenario will generate thrust, we present the penalty in its absolute value to help with the comparison. Since we have found surface roughness to be detrimental for $\overline {C_X}$ for all cases considered, a positive penalty value in the static state indicates an increase in drag due to roughness elements, whereas $Penalty>0$ in the flapping regime means a decrease in thrust caused by the roughness elements. Here, $Penalty$ is defined as the relative change in thrust for a rough foil compared with the smooth, $|(C_{X,rough}-C_{X,smooth})|/C_{X,smooth}$.
(a) Static  $C_X$ vs angle of attack $\varTheta$ measured using static foils at $Re=28\,000$. Smooth foil is presented in light blue, $36\,\%$ in medium blue and $70\,\%$ in dark blue. The red dashed line indicates the $\theta$ used to compare with the unsteady regime, defined as $\theta _s = 4.75^\circ$. (b) Thrust and drag penalty due to roughness for both the flapping (triangles) and static results (crosses) for the $36\,\%$ case (medium blue) and the $70\,\%$ case (dark blue). The shadow region introduces the confidence intervals calculated as $CI=4.6 \sigma / \sqrt {N}$.

The penalty parameter is presented in figure 6 for static foil (crosses) and flapping foil measurements (triangles). The addition of surface roughness increases the drag production in the static state across the  $Re$ range considered. At $Re=33\,000$, it reaches a $76\,\%$ drag penalty for the $36\,\%$ roughness and $43\,\%$ penalty for the $70\,\%$ roughness coverage, compared with the smooth foil. The drag performance of the foils at the static regime depends not only on the area covered by bumpers but also on the arrangement of the rough elements. Although the $70\,\%$ presents more coverage than the $36\,\%$, the interactions between the flow and the intermittent distribution of the spanwise rows of rough elements at the $36\,\%$ foil surface are responsible for the higher drag penalty. On the other hand, the flapping foils with roughness generate less thrust across the $Re$ range compared with the smooth foil. At $Re=33\,000$, the thrust decreases by $35\,\%$ and $16\,\%$ for $70\,\%$ and $36\,\%$ roughness coverages, respectively. However, the flapping state appears to be more robust to $Re$ changes. It reduces the penalty observed for static foils, especially for the $36\,\%$ coverage. At $Re = 33\,000$, foils with 36 % coverage experiences a roughness penalty of 76 % in the static state compared with a 16 % penalty in the flapping state. Previous work has shown that parameters such as the kinematics or the Strouhal number have a strong influence on the propulsive performance of an oscillating foil (Zurman-Nasution et al. Reference Zurman-Nasution, Ganapathisubramani and Weymouth2021). In line with this, we believe that the motion characteristics of this study could be minimising the impact of the roughness elements on both the wake development and force production.
To further analyse the data presented in figure 6, we present the out-of-plane vorticity ( $\omega _Z$) in figure 7. The first row consists of the cycle-averaged unsteady pitching $\omega _Z$, and the positive vorticity regions are enclosed with isolines. In second and third rows, we present the flow-field data measured at $\alpha =6^\circ$ for a pitching foil and a static foil, respectively. The first three columns correspond to $0\,\%$ (smooth), $36\,\%$ and $70\,\%$ roughness coverages, respectively. The fourth column introduces a comparison between different roughness cases with overlapped $\omega _Z$ isolines. The comparison of all three flapping cases suggests that the addition of surface roughness does not introduce major changes in shedding shear layers. The mild effects could be explained considering the fact that the foils are operating at Reynolds numbers where the boundary layer is transitional (from laminar to turbulent). Adding roughness essentially induces an early development of a turbulent boundary layer, and it would be transitionally rough (if at all) in all these conditions. Hence, we would expect that increasing the size of the roughness elements could have a major impact on the wake characteristics of the pitching foil. In contrast, in the static state, foils with $36\,\%$ and $70\,\%$ roughness have thicker shear layer in time-average compared with the smooth case, similar to the findings by Guo et al. (Reference Guo, Zhang, Yasuda, Yang, Galipon and Rival2021). The presence of thicker shear layers, which are caused by the additional pressure drag incurred by the roughness elements, can be responsible for the $76\,\%$ drag penalty shown in figure 6.
Pitching cycle-averaged vorticity (a–c), pitching instantaneous vorticity at  $\theta = 6^\circ$ (e–g) and static PIV results at $\theta = 6^\circ$ (i–k). Smooth foil (a,e,i), $36\,\%$ (b,f,j) and $70\,\%$ (c,g,k). The comparison of the wakes generated by the foils at each of the conditions is presented at (d,h,l). All data obtained at $Re= 28\,000$.

4. Conclusions
In this study, we have analysed the influence of surface roughness on the propulsive performance of flapping foils, using force and flow measurements. Three NACA0012 foils with different roughness coverage ratios have been constructed, and tested within the Reynolds number range of  $17\,000\leq Re \leq 33\,000$. We have found that the addition of surface roughness is detrimental to thrust production and efficiency of a pitching foil. The foils with $36\,\%$ and $70\,\%$ roughness produce $16\,\%$ and $35\,\%$ less thrust, respectively, compared with the smooth foil. We have determined that $Re$ does not play an important role in either the thrust or efficiency for the $Re$ range and roughness coverage ratios considered. Although we have seen no significant change in the wake flow, the foils with roughness experience a decrease in thrust and efficiency, which can be explained by an increase in profile drag associated with the roughness elements. We have compared the effects of roughness on static and flapping states, finding that the former is considerably more sensitive to it. The roughness penalty for $36\,\%$ roughness coverage is reduced from $76\,\%$ in the static state to $16\,\%$ for flapping. The strongest decrease occurs at the highest $Re$, highlighting that the effect of roughness on flapping systems is very different than on static systems. This shows that the performance of flapping systems is more robust to the changes in surface roughness.
Supplementary movies
Supplementary movies are available at https://doi.org/10.1017/jfm.2023.1009.
Funding
This research was supported financially by the Office of Naval Research Global Award N62909-18-1-2091, the Engineering and Physical Sciences Research Council (Grant No: EP/R034370/1) and the doctoral training award.
Declaration of interests
The authors report no conflict of interest.
Data availability statement
All data supporting this study are openly available from the University of Southampton repository at https://doi.org/10.5258/SOTON/D2943.



 Open access

