


INTRODUCTION
Agriculture was first introduced to Europe in Greece over 8500 years ago and spread from there to the Balkans and central Europe (Reingruber, Reference Reingruber2018; Betti et al., Reference Betti, Beyer, Jones, Eriksson, Tassi, Siska and Leonardi2020). With the start of the Neolithic, new crops (e.g., wheat, barley, lentil, and flax), domesticated animals (e.g., sheep, goats, and cattle), and novel land use practices were introduced into the region (Zohary et al., Reference Zohary, Hopf and Weiss2012a; Halstead and Isaakidou, Reference Halstead, Isaakidou, Colledge, Conolly, Dobney, Manning and Shennan2013). As a result, people started to permanently alter the landscape around them (Stephens et al., Reference Stephens, Fuller, Boivin, Rick, Gauthier, Kay and Marwick2019). Previous studies suggest that Neolithic farmers had a limited impact on the natural vegetation of Northern Greece, and that significant anthropogenic disturbances can only be observed with the start of the Bronze Age (~5000 cal yr BP), as the natural forests started to change and decline (Willis, Reference Willis1994; Panagiotopoulos et al., Reference Panagiotopoulos, Aufgebauer, Schäbitz and Wagner2013; Masi et al., Reference Masi, Francke, Pepe, Thienemann, Wagner and Sadori2018; Gassner et al., Reference Gassner, Gobet, Schwörer, van Leeuwen, Vogel, Giagkoulis and Makri2020).
Rapid climate change (RCC) events are often proposed as an important environmental factor driving cultural changes and migrations in the eastern Mediterranean (Staubwasser and Weiss, Reference Staubwasser and Weiss2006; Weninger et al., Reference Weninger, Clare, Rohling, Bar-Yosef, Böhner, Budja and Bundschuh2009; Berger et al., Reference Berger, Lespez, Kuzucuoğlu, Glais, Hourani, Barra and Guilaine2016; Rohling et al., Reference Rohling, Marino, Grant, Mayewski and Weninger2019). Some authors consider the pronounced and abrupt climatic “8.2 ka event” to be an important driver for the fast spread of agriculture from Anatolia to Greek Macedonia (Weninger et al., Reference Weninger, Alram-Stern, Bauer, Clare, Danzeglocke, Jöris, Kubatzki, Rollefson, Todorova and van Andel2006). The “8.2 ka event” lasted for about 160 years (8250–8090 cal yr BP; Rasmussen et al., Reference Rasmussen, Bigler, Blockley, Blunier, Buchardt, Clausen and Cvijanovic2014) and was a period characterised by colder conditions throughout the Northern Hemisphere (Alley et al., Reference Alley, Mayewski, Sowers, Stuiver, Taylor and Clark1997; Alley and Ágústsdóttir, Reference Alley and Ágústsdóttir2005). However, recent archaeological finds show that the Neolithic had already started several hundred years earlier around 8600–8500 cal yr BP (e.g., Mavropigi-Filotsairi, Paliambela Kolindros, and Revenia-Korinos; Karamitrou-Mentessidi et al., Reference Karamitrou-Mentessidi, Efstratiou, Kaczanowska and Kozłowski2015; Tsartsidou and Kotsakis, Reference Tsartsidou and Kotsakis2020; Maniatis and Adaktylou, Reference Maniatis and Adaktylou2021) in western Greek Macedonia and even earlier on Crete (Knossos; Douka et al., Reference Douka, Efstratiou, Hald, Henriksen and Karetsou2017). Still, Neolithic farmers would have been reliant on the landscape around them and changes in climate could have altered the natural vegetation and/or influenced crop production (Krauss et al., Reference Krauss, Marinova, Brue and Weninger2018). The domesticated crops developed by the first farmers in the Levant, Anatolia, and Upper Mesopotamia required open vegetation conditions and were adapted to warmer and drier climates than those in Europe (Willcox, Reference Willcox2005). Shifts to warmer and/or drier climatic conditions as well as related forest openings may have advantaged the establishment of farming in Northern Greece. However, once established in Greece, the new crops needed to be adapted to the relatively cool conditions and shorter growing season of continental Europe, before spreading farther north (Krauss et al., Reference Krauss, Marinova, Brue and Weninger2018). Additionally, stable climatic conditions were extremely important for harvest success. For example, Bronze Age societies in the Peloponnese flourished under favourable climate conditions, but were sensitive to droughts (Weiberg et al., Reference Weiberg, Bonnier and Finné2021). Furthermore, observations from the past decades as well as palaeoecological studies show how sensitive Mediterranean forests are to changes in precipitation (Tinner et al., Reference Tinner, van Leeuwen, Colombaroli, Vescovi, van der Knaap, Henne, Pasta, D'Angelo and La Mantia2009; Beffa et al., Reference Beffa, Pedrotta, Colombaroli, Henne, van Leeuwen, Süsstrunk and Kaltenrieder2016; Cramer et al., Reference Cramer, Guiot, Fader, Garrabou, Gattuso, Iglesias and Lange2018; Gazol et al., Reference Gazol, Camarero, Vicente-Serrano, Sánchez-Salguero, Gutiérrez, Luis and Sangüesa-Barreda2018) and there is increasing concern about the resilience of forests to the projected rise in droughts based on the current climate change scenarios (IPCC, 2022).
The combination of palaeoecological and archaeological studies can help us to explore and better understand the underlying mechanisms of long-term human–environment dynamics (Crabtree and Dunne, Reference Crabtree and Dunne2022; Silva et al., Reference Silva, Coward, Davies, Elliott, Jenkins, Newton and Riris2022). Previous palaeoecological contributions to the vegetation history of Northern Greece confirm the complex interactions between climate, vegetation, and early agriculture (e.g., Bottema, Reference Bottema1974; Glais et al., Reference Glais, López-Sáez, Lespez and Davidson2016; Gassner et al., Reference Gassner, Gobet, Schwörer, van Leeuwen, Vogel, Giagkoulis and Makri2020); however, the temporal resolution of these records does not allow the disentanglement of the different factors involved. High-resolution, continuous, multiproxy studies with robust chronologies from sites close to prehistoric settlements are necessary to study the impact of climate change on the environment and human societies (Berger et al., Reference Berger, Lespez, Kuzucuoğlu, Glais, Hourani, Barra and Guilaine2016). One site suitable for such a high-resolution study is Limni Zazari, a small lake in Northern Greece, where the onset of farming activities coincides with a period of forest opening and possibly lower lake levels between 8600 and 8200 cal yr BP (Gassner et al., Reference Gassner, Gobet, Schwörer, van Leeuwen, Vogel, Giagkoulis and Makri2020). Multiple Neolithic and Bronze Age settlements have been excavated close to the site, with some assigned to the Early Neolithic (~8500–7800 yr BP; Kokkinidou and Trantalidou, Reference Kokkinidou and Trantalidou1991; Chrysostomou et al., Reference Chrysostomou, Pandermalis, Tiverios, Andreou, Adam-Velené and Misailidou-Despotidou2015; Chrysostomou, Reference Chrysostomou, Pandermalis, Tiverios, Andreou, Adam-Velené and Misailidou-Despotidou2015).
This study aims to provide a better understanding of the environmental history during the transition from Mesolithic (~9700–8500 cal yr BP) hunter-gatherer to Neolithic (~8500–5300 cal yr BP) farming societies in Northern Greece by studying lake sediments from Limni Zazari at a high resolution. We use pollen and microscopic charcoal to reconstruct the Mesolithic and Neolithic vegetation and regional fire dynamics from ca. 10,900 to 5060 cal yr BP. To reconstruct the environmental conditions in and around the lake we study the biogeochemical composition of the sediments by using X-ray fluorescence (XRF) elemental composition scanning and hyperspectral imaging (HSI) of pigments in the sediment cores. The results of the different analyses are compared with other palaeoenvironmental and palaeoclimatic studies from the eastern Mediterranean to understand the effects of climate change on vegetation dynamics during the Mesolithic–Neolithic transition. We are especially interested in answering the question of how climate change might have influenced the onset of the Neolithic. Additional focus is placed on human impact on the vegetation, with special emphasis on the timing and nature of the earliest Neolithic land use.
STUDY SITE
Limni Zazari is a small and shallow lake (surface: 2 km2; maximum depth: 6.3 m) in the Eordea basin in Macedonia, Greece (606 metres above sea level; 40°37′31′′N, 21°32′50′′E, Fig. 1). Geologically, the Eordea basin belongs to the north Pelagonian zone and consists of crystalline limestones and marbles, with recent alluvial and lacustrine deposits around the lakes (Pavlides and Mountrakis, Reference Pavlides and Mountrakis1987). Today, Zazari has an inlet and outlet, but it is likely that in the past the lake was hydrologically closed. During the 1950s, a stream was rerouted to flow into Zazari and an outlet was constructed connecting the lake with Limni Chimaditis (Fig. 1). During this period, the extensive peatlands and marshes around Chimaditis were drained to create arable land (Papastergiadou et al., Reference Papastergiadou, Retalis, Apostolakis and Georgiadis2008). In the past, the marshes would flood during the winter and dry up during the summer (Bottema, Reference Bottema1974). The vegetation around the lake is dominated by grassland and shrubs, with scattered deciduous trees such as Quercus pubescens, Quercus frainetto, Carpinus orientalis, Fraxinus excelsior, and Fraxinus angustifolia. Such communities belong to the sub-Mediterranean vegetation type as defined by the occurrence of, for example, Q. pubescens, Q. frainetto, and C. orientalis (Lang et al., Reference Lang, Ammann, Schwörer, Tinner, Lang, Ammann, Behre and Tinner2023a). Various reeds and herbs (e.g., Phragmites australis, Artemisia) grow on the lakeshore. The lowlands in the region are used for arable land, with the hills to the northwest of the lake covered with lowland sub-Mediterranean mixed oak forests. At higher elevations, forest composition changes to oro-Mediterranean beech forests and coniferous forests with Pinus nigra and Pinus sylvestris. Several Neolithic and Bronze Age settlements have been found in the area around Zazari and Chimaditis (Fig. 1). The earliest settlements are typologically dated to the Early Neolithic (~6500–5800 BCE; 8450–7750 cal yr BP) and occupation shifted between different sites, including dryland sites and pile dwellings (Chrysostomou et al., Reference Chrysostomou, Pandermalis, Tiverios, Andreou, Adam-Velené and Misailidou-Despotidou2015; Chrysostomou, Reference Chrysostomou, Pandermalis, Tiverios, Andreou, Adam-Velené and Misailidou-Despotidou2015).
Study site (sources: EEA, 2016; Esri, 2023). Top left: Overview of the wider region around Limni Zazari. Top right: Overview of regionally important sites for this study. Lakes and marshes (blue dots): 1, Limni Zazari (red dot); 2, Limni Orestiás; 3, Lake Ohrid, Limni Prespa, and former Lake Maliq; 4, Limni Gramousti; 5, Limni Ioannina; 6, Limni Xinias; 7, Lake Dojran; 8, Tenaghi-Philippon marsh; 9, Rila mountains; 10, Lake Iznik; 11, Lake Brazi. Archaeological sites (black dots): 8, Dikili Tash; 12, Mavropigi-Filotsairi; 13; Paliambela Kolindros, Revenia-Korinos; 14, Franchthi cave; 15, Knossos; 16, Çukuriçi Höyük; 17, Ulucak; 18, Barçin. Speleothems (green dots): 19, Limnon cave; 20, Sofular cave. Bottom: The surroundings of Limni Zazari, with the coring site (red dot) and different archaeological sites dated between ca. 6500 and 1500 BCE (~8450–3450 yr BP, white dots; Kokkinidou and Trantalidou, Reference Kokkinidou and Trantalidou1991; Chrysostomou et al., Reference Chrysostomou, Pandermalis, Tiverios, Andreou, Adam-Velené and Misailidou-Despotidou2015; Giagkoulis, Reference Giagkoulis2019). The shaded area is the approximate extent of the peatlands in 1945; during the 1960s these were drained (Bottema, Reference Bottema1974; Papastergiadou et al., Reference Papastergiadou, Retalis, Apostolakis and Georgiadis2008).

The climate at Limni Zazari is warm-temperate Mediterranean (Csa according to Köppen Geiger; Beck et al., Reference Beck, Zimmermann, McVicar, Vergopolan, Berg and Wood2018) with a mean annual air temperature of 12.3°C, mean temperatures of 22.5°C for July and 2.6°C for January, and an average annual precipitation of 541 mm (Limnochori weather station, 1974–2004: Grimpylakos et al., Reference Grimpylakos, Karacostas and Albanakis2013). Most of the precipitation falls during the winter months whereas the summers are rather dry.
METHODS
Sediment cores and radiocarbon dating
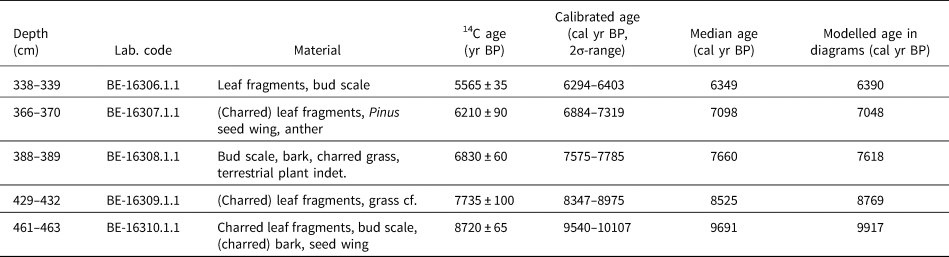
The sediment cores used in this study were retrieved in 2016, and an overview of the vegetation and environmental history covering the past 20,000 years at low temporal resolution was recently published (Gassner et al., Reference Gassner, Gobet, Schwörer, van Leeuwen, Vogel, Giagkoulis and Makri2020). We added 12 new radiocarbon samples of terrestrial plant macrofossils to those published in Gassner et al. (Reference Gassner, Gobet, Schwörer, van Leeuwen, Vogel, Giagkoulis and Makri2020) in order to increase the robustness and detail of the overall chronology (Table 1, Supplementary Table S1, Supplementary Fig. S1). The samples were dated with accelerator mass spectrometry (AMS) in the Laboratory for the Analysis of Radiocarbon with AMS (LARA) at the University of Bern. We used the R package “rBacon” (Blaauw and Christen, Reference Blaauw and Christen2011), with the IntCal20 calibration curve (Reimer et al., Reference Reimer, Austin, Bard, Bayliss, Blackwell, Bronk Ramsey and Butzin2020), to calibrate the radiocarbon dates to years before present (cal yr BP) and to construct the age–depth model (Fig. 2, Supplementary Fig. S1). In total, 12 radiocarbon dates were located within the focus period (10,900–5060 cal yr BP) of this paper, five of them new (Table 1).
New radiocarbon dates for the high-resolution sequence from the master core of the Limni Zazari sediment record. For the complete table with all the radiocarbon dates used see the supplementary material (Supplementary Table S1) and Gassner et al. (Reference Gassner, Gobet, Schwörer, van Leeuwen, Vogel, Giagkoulis and Makri2020).

Age–depth model and lithology for the Mesolithic and Neolithic high-resolution sequence of Limni Zazari. The blue horizontal integrals show the probability density functions of the individual radiocarbon dates (IntCal 20; Reimer et al., Reference Reimer, Austin, Bard, Bayliss, Blackwell, Bronk Ramsey and Butzin2020), the red dotted line represents the modelled chronology (Bacon; Blaauw and Christen, Reference Blaauw and Christen2011), the grey envelop shows the 95% confidence interval, and the black dashed lines show the 95% confidence intervals from the generalised additive model (GAM; Heegaard et al., Reference Heegaard, Birks and Telford2005) considering both age and depth uncertainties. The five radiocarbon dates from Table 1 are marked with their laboratory code; the unmarked dates were published in Gassner et al. (Reference Gassner, Gobet, Schwörer, van Leeuwen, Vogel, Giagkoulis and Makri2020). The age–depth model for the complete core and the full table of radiocarbon dates can be found in the supplementary material (Supplementary Fig. S1, Supplementary Table S1).

Pollen, stomata, and charcoal analyses
For the palynological and microscopic charcoal analyses, we took a total of 199 sediment samples of 1 cm3. The sampling is in contiguous 1 cm steps between 275 and 476 cm, with 1 cm missing (at 380 cm) as a result of cutting the 3-m-long core into 1-m-long segments. We prepared the samples following standard procedures (Moore et al., Reference Moore, Webb and Collinson1991) with mounting in glycerine and by adding a known number of Lycopodium spores to the samples beforehand to estimate concentrations and influx (i.e., accumulation rates; Stockmarr, Reference Stockmarr1971). Pollen, spores, stomata, and algae were identified under a light microscope at 400× or 1000× magnification using different keys (e.g., Trautmann, Reference Trautmann1953; Moore et al., Reference Moore, Webb and Collinson1991; Jankovská and Komárek, Reference Jankovská and Komárek2000; Beug, Reference Beug2004; van Geel and Aptroot, Reference van Geel and Aptroot2006) and the reference collection at the Institute of Plant Sciences, University of Bern. Cerealia type pollen were grouped into different size classes according to Bottema (Reference Bottema1992): 40–49 μm (may include many wild grasses in the study region), 50–59 μm (may include various wild grasses), and ≥60 μm (includes only cultivated cereals). We distinguished three different types of Quercus pollen: Q. frainetto type, which includes Q. frainetto, Quercus petraea, and Q. pubescens in the study area; Quercus cerris type, including Q. cerris and Quercus trojana; and Quercus ilex type, including Q. ilex and Quercus coccifera (Beug, Reference Beug2004). Generally, the terrestrial pollen sum, excluding pollen of aquatic plants and spores, was over 500. Microscopic charcoal (>10 μm) was analysed following Tinner and Hu (Reference Tinner and Hu2003) and Finsinger and Tinner (Reference Finsinger and Tinner2005) to reconstruct regional fire activity (Whitlock and Larsen, Reference Whitlock, Larsen, Smol, Birks, Last, Bradley and Alverson2001; Conedera et al., Reference Conedera, Tinner, Neff, Meurer, Dickens and Krebs2009). We subdivided the pollen diagram into local pollen assemblage zones (LPAZ) by using the zonation method of optimal partitioning by the sum-of-squares criterion (Birks and Gordon, Reference Birks and Gordon1985) and by identifying statistically significant zones with the broken-stick model (Bennett, Reference Bennett1996).
Biogeochemical analysis
The methodology and equipment used for the geochemical XRF spectroscopy and HSI analyses are described in detail by Gassner et al. (Reference Gassner, Gobet, Schwörer, van Leeuwen, Vogel, Giagkoulis and Makri2020). The sampling resolutions were 5 mm for XRF and 0.069 mm for HSI scanning, but we smoothed the HSI to a resolution of 2 mm for the diagrams. We use the element counts of titanium (Ti) as a proxy for terrigenous sediment input from the watershed (e.g., Haug et al., Reference Haug, Hughen, Sigman, Peterson and Röhl2001). The ratio of Zr/Al is used as a proxy for sediment grain size, with high values indicating larger grain sizes; this ratio can also be used as a proxy for shoreline proximity to the coring site and thus low lake-level stands (Haberzettl et al., Reference Haberzettl, Corbella, Fey, Janssen, Lücke, Mayr and Ohlendorf2007). We assume that calcium (Ca) is predominantly related to endogenic calcite precipitating in the lake during periods of increased precipitation, high evaporation, and/or elevated temperatures. This is common for many lakes in the southern Balkans with karst-dominated catchments (e.g., Vogel et al., Reference Vogel, Wagner, Zanchetta, Sulpizio and Rosén2010; Francke et al., Reference Francke, Wagner, Leng and Rethemeyer2013). We use the ratio of Ca/Ti as an indicator for sedimentary calcite content, which serves as a proxy for moisture availability, with higher values indicating wetter and warmer conditions. The ratio of Rb/K is used as a proxy for chemical alteration of lithogenic sediments being deposited at the coring site, with higher values pointing towards more intensely weathered sediments (e.g., Burnett et al., Reference Burnett, Soreghan, Scholz and Brown2011). From the HSI analysis, we use RABD673 as an indicator of “green pigments” (chlorophyll-a and diagenetic products) and aquatic primary production, and RABD845 as a proxy for bacteriopheophytin a (Bphe a) and meromixis (Zander et al., Reference Zander, Wienhues and Grosjean2022).
Numerical methods
Ordination analysis and cross-correlations
To infer environmental gradients in the pollen assemblages, we used a principal component analysis (PCA) performed in Canoco 5.15 (ter Braak and Šmilauer, Reference ter Braak and Šmilauer2012). Before the PCA, we log transformed the percentage data to reduce the effects of dominant species. Several types of data were added passively to the analysis as supplementary variables, including microscopic charcoal influx as a proxy for fire activity, Sporormiella type influx as a proxy for grazing, July and January insolation (Laskar et al., Reference Laskar, Robutel, Joutel, Gastineau, Correia and Levrard2004), and the ratio of calcium and titanium counts (ln(Ca/Ti)) as a proxy for moisture availability and temperature (higher values indicate wetter and warmer conditions).
We calculated cross-correlations (Green, Reference Green1981; Tinner et al., Reference Tinner, Hubschmid, Wehrli, Ammann and Conedera1999) to identify leads and lags between fire (microscopic charcoal influx), moisture availability (−ln(Ca/Ti)), and vegetation (pollen percentages) by using R (R Core Team, 2023). The sign of ln(Ca/Ti) was reversed, to emphasise the response of vegetation to a decrease instead of an increase in moisture. Additionally, the −ln(Ca/Ti) was smoothed and resampled to match the resolution of the pollen samples. We analysed two time periods: 8700–7130 cal yr BP (ZAZ-3 to 6, 56 samples, 1 lag = 27.3 ± 5.7 yr) and 7720–6310 cal yr BP (ZAZ-6 to 8, 60 samples, 1 lag = 22.9 ± 7.2 yr) to assess the role of fire and moisture as drivers of vegetation change. For each period we calculated the cross-correlation coefficients for fire (as inferred from microscopic charcoal influx) versus vegetation (pollen percentages) and for moisture availability (−ln(Ca/Ti)) versus vegetation (pollen percentages) at ±10 lags and plotted them as correlograms. The 95% confidence intervals of the correlations were estimated by computing ±2 SE of the correlation coefficients, which corresponds to a two-sided significance level of α = 5% (Tinner et al., Reference Tinner, Hubschmid, Wehrli, Ammann and Conedera1999).
Biodiversity analysis and anthropogenic impact
Species diversity is a complex function of species richness and species evenness (Legendre and Legendre, Reference Legendre and Legendre2012). To investigate biodiversity trends in the past, we calculated the palynological richness index (PRI), the evenness detrended palynological richness index (DE-PRI; Colombaroli and Tinner, Reference Colombaroli and Tinner2013), and the probability of interspecific encounter (PIE; Hurlbert, Reference Hurlbert1971). PIE can be used as a proxy for evenness to estimate to what extent the total number of taxa in a sample is influenced by dominant taxa, and DE-PRI reduces the effects of unevenness on palynological richness. To account for differences in sample size (i.e., pollen sums) we used a rarefaction analysis (Birks and Line, Reference Birks and Line1992) with a minimum pollen sum of 487 (excluding aquatic taxa and ferns) by using the “vegan” package in R (version 2.6-4; Oksanen et al., Reference Oksanen, Blanchet, Friendly, Kindt, Legendre, McGlinn and Minchin2020).
We calculated the land use probability (LUP) index (Deza-Araujo et al., Reference Deza-Araujo, Morales-Molino, Conedera, Henne, Krebs, Hinz, Heitz, Hafner and Tinner2022) to investigate and quantify the impact of human land use. The LUP is a probabilistic way to weight and summarise cultural indicator pollen taxa. We used the anthropogenic indicator values (AIV) of LUP for the indicator taxa of the sub-Mediterranean vegetation belt as published by Deza-Araujo et al. (Reference Deza-Araujo, Morales-Molino, Conedera, Henne, Krebs, Hinz, Heitz, Hafner and Tinner2022), except for the Cerelia type pollen where we adjusted the AIV to reflect the different categories of Cerealia pollen weighted according to their diagnostic value (40–49 μm, AIV 5; 50–59 μm and ≥60 μm, AIV 10).
RESULTS
Chronology
The age–depth model for the high-resolution sequence from 10,900 to 5000 cal yr BP contains 12 radiocarbon dates (Fig. 2, Table 1) and is based on the model for the entire core (Supplementary Table S1, Supplementary Fig. S1). We rejected four radiocarbon dates from the complete model as they were clearly too young or did not fit the model (Supplementary Fig. S1). Sediment accumulation rates range between 20 and 40 yr/cm, except for one section between 310 and 340 cm with increased accumulation rates of ca. 10 yr/cm.
Biogeochemical proxies
At the start of the high-resolution record (10,900 cal yr BP), terrigenous sediment input (Ti) is moderately high; lake levels (ln(Zr/Al+1)) were likely lowered and sediments entering the lake experienced little chemical weathering prior to transport (low ln(Rb/K)), pointing towards drier and cooler conditions (Fig. 3). After 10,300 cal yr BP, increases in ln(Ca/Ti) and ln(Rb/K) suggest an increase in moisture, followed by a decrease in ln(Zr/Al+1) indicating higher lake levels. Periods of hypolimnetic anoxia or even meromixis (increased RABD845) and increased aquatic productivity (higher RABD673) are observed from ca. 9800 cal yr BP onwards. These conditions persisted until 8600 cal yr BP, when a period with high terrigenous sediment input and reduced Ca precipitation started. The biogeochemical proxies together suggest a period of lower lake levels, drier conditions, cessation of hypolimnetic anoxia, and reduced primary production between 8600 and 7800 cal yr BP. Afterwards, the previous conditions mostly returned, but primary production was now elevated and periods of hypolimnetic anoxia were more common. Between 7100 and 6150 cal yr BP, terrigenous sediment influx is higher and chemical weathering is reduced, indicating increased erosion. A reduction in endogenic calcite precipitation, together with high terrigenous sediment input, takes place during the last ca. 150 years of this phase (ZAZ-9), suggesting another period with drier conditions and lower lake levels between 6300 and 6150 cal yr BP.
Comparison of the summary pollen diagram from Limni Zazari with X-ray fluorescence and hyperspectral imaging measurements. Titanium (Ti) counts are used as a proxy for lithogenic input; increased calcite (Ca, ln(Ca/Ti)) content is linked to more humid and/or warmer conditions, with higher values indicating wetter and warmer conditions; the ratio of rubidium and potassium (ln(Rb/K)) is used as a proxy for the chemical alteration of sediments deposited, with higher values indicating less alteration; the ratio of zirconium and aluminium (ln(Zr/Al+1)) is used as an indicator for increased grain size and lake level low stands, with higher values indicating coarser grain size and lower lake levels; RABD673 is used as a proxy for aquatic productivity and RABD845 for meromixis (see Supplementary Fig. S4 and Gassner et al. [2020] for the full record). LPAZ, statistically significant local pollen assemblage zones. The orange-coloured bars highlight periods with drier conditions.

Vegetation and fire history
We found 11 statistically significant LPAZ in the high-resolution Limni Zazari record (Figs. 4 and 5, ZAZ-1 to ZAZ-11). For ease of comparison, all data sets and diagrams use the LPAZ.
Selected pollen, spore, and green algae percentages of Limni Zazari based on the terrestrial pollen sum, together with the radiocarbon dates, microscopic charcoal influx, pollen richness (black solid line = palynological richness, red dotted line = detrended palynological richness), and pollen evenness. Empty curves show 10× exaggeration. LPAZ, statistically significant local pollen assemblage zones.

Selected pollen and spore percentages of Limni Zazari based on the terrestrial pollen sum, together with the microscopic charcoal influx and the land use probability index (Deza-Araujo et al., Reference Deza-Araujo, Morales-Molino, Conedera, Henne, Krebs, Hinz, Heitz, Hafner and Tinner2022). Empty curves show 10× exaggeration; the coloured Cerealia curves show 20× exaggeration. Archaeology: phases of different Neolithic settlements in the area around Limni Zazari (Fig. 1). Red dotted bars are based on typo-chronology, blue bars are radiocarbon dated (Kokkinidou and Trantalidou, Reference Kokkinidou and Trantalidou1991; Chrysostomou et al., Reference Chrysostomou, Pandermalis, Tiverios, Andreou, Adam-Velené and Misailidou-Despotidou2015). The blue cereal ear represents the first dated cereal grains from the early Neolithic settlement Mavropigi-Filotsairi (Fig 1; Karamitrou-Mentessidi et al., Reference Karamitrou-Mentessidi, Efstratiou, Kaczanowska and Kozłowski2015). LPAZ, statistically significant local pollen assemblage zones.

Between 10,900 and 9900 cal yr BP (ZAZ-1), the pollen data suggest that the vegetation around Zazari developed from a species-rich herbaceous steppe (non-arboreal pollen >50%; high pollen richness, e.g., Poaceae, Rumex acetosella type, Galium type, Achillea type, Artemisia, Chenopodiaceae) to open parklands with shrubs and tree stands (Pistacia, Q. frainetto type). Around 9900 cal yr BP (ZAZ-2), arboreal pollen (AP) reaches values of 80%, indicating the establishment of sub-Mediterranean mixed oak woodlands (e.g., Q. frainetto type, Q. cerris type, Tilia, Ulmus, Corylus). These woodlands were initially rather open but became closed around 8700 cal yr BP (ZAZ-3) with high pollen percentages of deciduous oaks and Tilia. Low percentages of Pinus suggest that pines were growing in the wider catchment. Charcoal influx is low at the start of the record but increases from 9900 cal yr BP onwards with frequent peaks, indicating a change from low (ZAZ-1) to increased fire activity (ZAZ-2).
Starting at 8600 cal yr BP (transition from ZAZ-3 to 4), oaks (Q. frainetto type, Q. cerris type, Q. ilex type) along with Tilia decline and AP rapidly falls to ca. 60%. Concurrently, steppe taxa (e.g., Artemisia, Poaceae, Chenopodiaceae) and Polygonum aviculare type expanded, suggesting a marked opening of the mixed oak woodlands and a return of the parklands within less than 100 years. Interestingly, Abies pollen percentages did not decrease, but show a small increase to 3–4% during this period. Simultaneously with the opening of the woodlands, pollen richness and pollen evenness increased (Fig. 4), suggesting higher diversity. Also, cultural indicator taxa (e.g., Plantago lanceolata type, first appearance of Cerealia type ≥60 μm) and the LUP increase, suggesting the start of agricultural activities in the area at ca. 8500 cal yr BP. Charcoal influx shows no major change, indicating that fire activity remained stable. Between 8000 and 7300 cal yr BP (ZAZ-5, 6), AP increases again (>80%) and the steppe pollen decreases, showing a return to forested conditions. However, the composition of the forest changed; pollen percentages of Pinus (>30%) together with Q. frainetto type (~25%) now dominate, suggesting a change to mixed oak–pine forests. Also, other tree taxa such as Ostrya type and Carpinus betulus increase or reach their empirical pollen limit (a proxy for local establishment; Lang et al., Reference Lang, Tinner, Morales-Molino, Schwörer, van Vugt, Gobet, Ammann, Lang, Ammann, Behre and Tinner2023b). Medium-sized Cerealia pollen (inc. Hordeum type and Triticum type; Fig. 5) appear more regularly, suggesting a continuation of agricultural activities. Between 7600 and 7200 cal yr BP (ZAZ-6), charcoal influx is low and the regular fire peaks from before have disappeared, indicating reduced fire activity.
Between 7300 and 6900 (ZAZ-6, 7), tree pollen percentages show a marked decline (from 80 to 55%) mostly driven by decreasing Pinus pollen, but also Abies and Tilia show lower percentages. Pollen percentages of Juniperus type and herbaceous taxa (Poaceae, R. acetosella type, Artemisia) increase, whereas the cultural indicators and the LUP remain stable. Conifers may have declined in response to fire, as concurrently charcoal influx increases. Subsequently, tree pollen percentages rapidly increase, but the forest does not fully recover. AP fluctuates between 75 and 85%, suggesting a period of minor woodland openings that lasts until ca. 6150 cal yr BP (ZAZ-8, 9). Pinus and Tilia percentages were mainly affected by the disturbances, whereas taxa like Ostrya type, C. betulus, and Fagus increased. Large Cerealia pollen (≥60 μm) appear regularly, pointing to agricultural activities nearby. Charcoal influx shows large and irregular peaks, indicating periods of high fire activity. During the last 150 years of this phase (6310–6160 cal yr BP; ZAZ-9), percentages of riparian taxa (Alnus glutinosa type, Salix) increase for a short period and Pinus stomata appear frequently, indicating a change in the lakeshore vegetation. Taxus reaches its empirical limit, pointing to the establishment of this temperate coniferous tree (Landolt et al., Reference Landolt, Bäumler, Erhardt, Hegg, Klötzli, Lämmler and Nobis2010) in the region.
Afterwards (6160–5060 cal yr BP; ZAZ-10, 11), AP reaches over 90% suggesting that the mixed oak–pine forests fully closed. With the closing of the forest, pollen richness and pollen evenness decrease, suggesting a decline in diversity. Cerealia type appears less regularly and the largest category is not present anymore, indicating a decrease in agricultural activities. Charcoal influx is relatively low but suggests two periods of moderate fire activity.
Numerical analyses
PCA axis 1 (Fig. 6) explains 38% of the variance in the pollen assemblages and represents a gradient from steppe and parklands dominated by deciduous oaks (<50% AP; negative PC1) to closed pine–deciduous oak forests (>90% AP; positive PC1). The sample scores of axis 1 plotted against time show a clear change around 8000 cal yr BP, at the same time as the shift in forest composition, suggesting a major change in the vegetation around this time (Fig. 7). Axis 2 explains a further 16% of the variance and might be related to changes in moisture availability (high correlation with ln(Ca/Ti)) and/or land use (LUP). The sample scores of axis 2 plotted against time show the biggest change between 8500 and 7700 cal yr BP, a period with drier conditions, open parklands, and the first agriculture, further suggesting an important role for moisture availability and/or land use.
Principal component analysis (PCA). PCA scatterplot of the samples and selected taxa. Microscopic charcoal influx (Char) as a proxy for fire, Sporormiella type influx (Spor) as a proxy for grazing, the land use probability index (LUP; Deza-Araujo et al., Reference Deza-Araujo, Morales-Molino, Conedera, Henne, Krebs, Hinz, Heitz, Hafner and Tinner2022), July and January insolation (July insol, Jan insol; Laskar et al., Reference Laskar, Robutel, Joutel, Gastineau, Correia and Levrard2004), and the natural logarithmic transformed ratio of calcium and titanium counts (ln(Ca/Ti)) as a proxy for hydrological conditions (higher values indicate wetter conditions) are supplementary explanatory variables and were projected passively onto the ordination (red arrows). Samples are grouped according to the local pollen assemblage zones (LPAZ).

Comparison of the vegetation and environmental history of Limni Zazari with different climate records: (a) summary diagram of the vegetation history; (b) sum of Cerealia ≥50 μm pollen percentages (10× exaggeration in grey); (c) land use probability (LUP) index (5× exaggeration in grey with loess smoothing, span = 0.1); (d) PCA axis 1 and axis 2 sample scores; (e) pollen influx of Quercus frainetto type and Pinus on a logarithmic scale; (f) pollen influx of Artemisia; (g) ln(Ca/Ti) at Limni Zazari as a proxy for climatic conditions, higher values indicating wetter and warmer conditions; (h) log-transformed ratio between calcium and titanium X-ray fluorescence counts from Limni Prespa as a proxy for climatic conditions; (i) δ13C values from the Limnon cave (Peloponnese, Greece) stalagmite record as a proxy for winter precipitation (Peckover et al., Reference Peckover, Andrews, Leeder, Rowe, Marca, Sahy, Noble and Gawthorpe2019); (j) δ13C values from the Sofular cave (Türkiye) stalagmite as a proxy for spring–summer–autumn effective moisture availability (Fleitmann et al., Reference Fleitmann, Cheng, Badertscher, Edwards, Mudelsee, Göktürk and Fankhauser2009; Göktürk et al., Reference Göktürk, Fleitmann, Badertscher, Cheng, Edwards, Leuenberger, Fankhauser, Tüysüz and Kramers2011); (k) chironomid-based July air temperature reconstruction from Lake Brazi (Carpathians, Romania; Tóth et al., Reference Tóth, Magyari, Buczkó, Braun, Panagiotopoulos and Heiri2015); temperatures were transformed to the altitude of Limni Zazari (0.6°C/100 m); (l) stack of Mediterranean sea-surface temperature (SST) anomalies (Marriner et al., Reference Marriner, Kaniewski, Pourkerman and Devillers2022); (m) July and January insolation for 40.6°N (Laskar et al., Reference Laskar, Robutel, Joutel, Gastineau, Correia and Levrard2004). Dashed lines are the local pollen assemblage zone (LPAZ) boundaries; the orange-coloured bars represent the different dry phases found in the biogeochemical proxies (Fig. 3).

The cross-correlation analysis (Fig. 8, Supplementary Fig. S3) underscores the importance of moisture availability on vegetation dynamics, showing negative correlations between increased −ln(Ca/Ti) and AP as well as Q. frainetto type, suggesting that decreased moisture availability affected forest growth (note the inversed sign for ln(Ca/Ti)). The strong positive correlation of Artemisia and P. aviculare type already before lag 0 may indicate that another factor than moisture availability could have influenced the vegetation ca. 40–60 years (minimum at lags −2 and −3) before the lake-level shift. Given that P. aviculare is classified as a human indicator taxon (Behre et al., Reference Behre, van der Knaap, Lang, Morales-Molino, Tinner, Lang, Ammann, Behre and Tinner2023) it may point to human impact, which would also explain the correlation with P. lanceolata type and the LUP. However, in Greece, P. aviculare is also associated with marshes and areas that seasonally flood and dry out (Bottema, Reference Bottema1974; Strid, Reference Strid1986; Willis, Reference Willis1992), suggesting moisture availability may have played a role. The cross-correlations between charcoal influx and different pollen taxa during the Neolithic show that fires promoted the expansion of herbs (e.g., Artemisia) at the expense of trees (e.g., AP, Pinus).
Cross-correlation diagrams from Limni Zazari with: (a) −ln(Ca/Ti) as a proxy for moisture availability versus selected pollen percentages (arboreal pollen, Quercus frainetto type, Pinus, Artemisia, Polygonum aviculare type, Plantago lanceolata type, Cerealia type) and the land use probability index (LUP) for zones ZAZ-3 to ZAZ-6 (8700–7130 cal yr BP); 1 lag corresponds to 27.3 ± 5.7 years. The sign of ln(Ca/Ti) was reversed, to emphasise the response of vegetation to a decrease instead of an increase in moisture; (b) microscopic charcoal influx (particles per cm2/yr) as a proxy for fire activity versus selected pollen percentages and the LUP for zones ZAZ-6 to ZAZ-8 (7720–6310 cal yr BP); 1 lag corresponds to 22.9 ± 7.2 years. The dotted horizontal lines mark the significance level (P < 0.05).

DISCUSSION
Early Holocene vegetation dynamics driven by changes in moisture
In Europe and the Mediterranean region, climate is generally regarded as the main driver of vegetation change before the introduction of farming, with changes in temperature, precipitation, but also seasonality playing an important role (e.g., Eastwood, Reference Eastwood, Griffiths, Krystufek and Reed2004; Tinner et al., Reference Tinner, van Leeuwen, Colombaroli, Vescovi, van der Knaap, Henne, Pasta, D'Angelo and La Mantia2009; Davis et al., Reference Davis, Collins and Kaplan2015; Roberts et al., Reference Roberts, Fyfe, Woodbridge, Gaillard, Davis, Kaplan and Marquer2018; Giesecke et al., Reference Giesecke, Wolters, van Leeuwen, van der Knaap, Leydet and Brewer2019; Lang et al., Reference Lang, Ammann, Behre and Tinner2023c). Our high-resolution record starts during the Early Holocene at 10,900 cal yr BP when the landscape was dominated by forest-steppe vegetation with scattered mixed oak stands. Climatic conditions during the Early Holocene were still rather continental with warm summers and cold winters (Laskar et al., Reference Laskar, Robutel, Joutel, Gastineau, Correia and Levrard2004; Vogel et al., Reference Vogel, Wagner, Zanchetta, Sulpizio and Rosén2010; Francke et al., Reference Francke, Wagner, Leng and Rethemeyer2013), and moisture availability was relatively low at the start of our high-resolution record (Fig. 7; Peckover et al., Reference Peckover, Andrews, Leeder, Rowe, Marca, Sahy, Noble and Gawthorpe2019). The continental climate explains the prevalence of grassland steppe, where only few temperate deciduous trees were able to grow on moister habitats (e.g., riparian areas, north-facing slopes). The drought-adapted forest-steppe was diverse and dominated the landscape until 9800 cal yr BP, when forests started to close. During the Early Holocene, forest-steppe or maquis vegetation was widespread in the eastern Mediterranean (e.g., Lake Dojran, Limni Prespa, Lake Iznik; Fig. 1; Panagiotopoulos et al., Reference Panagiotopoulos, Aufgebauer, Schäbitz and Wagner2013; Miebach et al., Reference Miebach, Niestrath, Roeser and Litt2016; Masi et al., Reference Masi, Francke, Pepe, Thienemann, Wagner and Sadori2018), but also in the central and western Mediterranean (e.g., Sadori and Narcisi, Reference Sadori and Narcisi2001; Tinner et al., Reference Tinner, van Leeuwen, Colombaroli, Vescovi, van der Knaap, Henne, Pasta, D'Angelo and La Mantia2009; Lang et al., Reference Lang, Ammann, van der Knaap, Morales-Molino, Schwörer, Tinner, Lang, Ammann, Behre and Tinner2023d).
The closing of the forest at Zazari was delayed compared to the onset of the Holocene (~11,650 cal yr BP) and to the onset of wetter/warmer conditions indicated by increased carbonate deposition in Zazari starting at ca. 10,300 cal yr BP (Fig. 3). The change from forest-steppe or mixed deciduous oak parklands (50–70% AP, see Magyari et al., Reference Magyari, Chapman, Passmore, Allen, Huntley and Huntley2010; Lang et al., Reference Lang, Ammann, van der Knaap, Morales-Molino, Schwörer, Tinner, Lang, Ammann, Behre and Tinner2023d) via open woodlands (70–80% AP) to mixed deciduous oak forests (AP >80%) only started at ca. 9800 cal yr BP. The delay in the formation of closed forest can be observed in several records of the central-eastern Mediterranean (Fig. 1; e.g., Lake Maliq, Dojran, Volvi, Prespa, Tenaghi Philippon, and Iznik; Wijmstra, Reference Wijmstra1969; Denèfle et al., Reference Denèfle, Lézine, Fouache and Dufaure2000; Panagiotopoulos et al., Reference Panagiotopoulos, Aufgebauer, Schäbitz and Wagner2013; Glais et al., Reference Glais, López-Sáez, Lespez and Davidson2016; Miebach et al., Reference Miebach, Niestrath, Roeser and Litt2016; Masi et al., Reference Masi, Francke, Pepe, Thienemann, Wagner and Sadori2018; Ganz et al., Reference Ganz, van Vugt, Gobet, Morales-Molino, Giagkoulis, Ogi and Hächler2024) and is even more pronounced further to the east, with forests in central Anatolia first closing at ca. 8000 cal yr BP (Roberts et al., Reference Roberts, Reed, Leng, Kuzucuoğlu, Fontugne, Bertaux and Woldring2001). Similarly, afforestation was delayed until 8000–7000 years ago at the warmest thermo-Mediterranean sites in the western and central Mediterranean (e.g., Fletcher et al., Reference Fletcher, Boski and Moura2007; Tinner et al., Reference Tinner, van Leeuwen, Colombaroli, Vescovi, van der Knaap, Henne, Pasta, D'Angelo and La Mantia2009; Lang et al., Reference Lang, Ammann, van der Knaap, Morales-Molino, Schwörer, Tinner, Lang, Ammann, Behre and Tinner2023d). This Early Holocene delay in afforestation is generally attributed to low humidity and limited moisture availability caused by a maximum in boreal summer insolation (Fig. 7; Tzedakis, Reference Tzedakis2007; Kotthoff et al., Reference Kotthoff, Pross, Müller, Peyron, Schmiedl, Schulz and Bordon2008; Tinner et al., Reference Tinner, van Leeuwen, Colombaroli, Vescovi, van der Knaap, Henne, Pasta, D'Angelo and La Mantia2009). In agreement with today's moisture gradient, sites located to the west of the Pindus mountains were less affected and forests closed at the onset of the Holocene (e.g., Ioannina and Gramousti; Fig. 1; Willis, Reference Willis1992; Lawson et al., Reference Lawson, Frogley, Bryant, Preece and Tzedakis2004). This moisture gradient is caused by the Pindus mountains, with higher orographic precipitation and thus moisture availability west of the Pindus (Lawson et al., Reference Lawson, Frogley, Bryant, Preece and Tzedakis2004).
At Zazari, deciduous oaks (especially Q. frainetto type) rapidly expanded from 10,100 cal yr BP to form semiclosed woodlands from 9800 cal yr BP onwards. We assume that moisture availability started to increase after 10,300 cal yr BP (Figs. 3 and 7), synchronous with the start of a more humid phase in the central-south Mediterranean (Magny et al., Reference Magny, Combourieu-Nebout, Beaulieu, Bout-Roumazeilles, Colombaroli, Desprat and Francke2013). Indeed, afforestation by Quercus and the onset of sapropel S1 formation at about 10,000 cal yr BP has been attributed to increasing precipitation in the eastern Mediterranean (e.g., Rossignol-Strick, Reference Rossignol-Strick1999; Kotthoff et al., Reference Kotthoff, Pross, Müller, Peyron, Schmiedl, Schulz and Bordon2008; Tinner et al., Reference Tinner, van Leeuwen, Colombaroli, Vescovi, van der Knaap, Henne, Pasta, D'Angelo and La Mantia2009; Masi et al., Reference Masi, Francke, Pepe, Thienemann, Wagner and Sadori2018). In support of this argument, increasing moisture availability was reconstructed from different types of proxies from Greece and the southern Balkans (Figs. 1 and 7); for example, in speleothems (e.g., Limnon cave; Peckover et al., Reference Peckover, Andrews, Leeder, Rowe, Marca, Sahy, Noble and Gawthorpe2019), lake-level reconstructions (e.g., Limni Xinias; Digerfeldt et al., Reference Digerfeldt, Sandgren and Olsson2007), and in stable isotopes (e.g., Lake Ohrid and Dojran; Francke et al., Reference Francke, Wagner, Leng and Rethemeyer2013; Lacey et al., Reference Lacey, Francke, Leng, Vane and Wagner2015). However, at Zazari it did take about 500 years for the forest to close; possible causes for this lag might be a gradual increase in moisture availability and/or changes in the seasonality of the precipitation with the majority of the precipitation falling outside the growing season (Stevens et al., Reference Stevens, Wright and Ito2001; Tzedakis, Reference Tzedakis2007; Roberts et al., Reference Roberts, Jones, Benkaddour, Eastwood, Filippi, Frogley and Lamb2008; Peyron et al., Reference Peyron, Goring, Dormoy, Kotthoff and Pross2011). With the establishment of the mixed oak woodlands, a new fire regime with regular fires established, likely linked to an increase in available biomass (Turner et al., Reference Turner, Roberts and Jones2008; Vannière et al., Reference Vannière, Power, Roberts, Tinner, Carrión, Magny and Bartlein2011; Lawson et al., Reference Lawson, Tzedakis, Roucoux and Galanidou2013).
Forest disturbance driven by rapid climate change
The forest opening phase from 8600 to 8000 cal yr BP is one of the most striking features of our record. Pollen percentages and influx both show a significant reduction in deciduous oak forests and the expansion of Artemisia–P. aviculare type-dominated open lands (Fig. 7). This period is also well reflected in the biogeochemical proxies as a period of low carbonate deposition, increased soil erosion, and lower lake levels suggesting colder and drier conditions (Figs. 3 and 7). It is synchronous with a distinct RCC event in the eastern Mediterranean dated to ca. 8600–8000 cal yr BP that is characterised by cooler and drier conditions (Rohling et al., Reference Rohling, Jorissen and Stigter1997; Mayewski et al., Reference Mayewski, Rohling, Curt Stager, Karlén, Maasch, Meeker and Meyerson2004; Migowski et al., Reference Migowski, Stein, Prasad, Negendank and Agnon2006; Marino et al., Reference Marino, Rohling, Sangiorgi, Hayes, Casford, Lotter, Kucera and Brinkhuis2009; Göktürk et al., Reference Göktürk, Fleitmann, Badertscher, Cheng, Edwards, Leuenberger, Fankhauser, Tüysüz and Kramers2011; Aufgebauer et al., Reference Aufgebauer, Panagiotopoulos, Wagner, Schaebitz, Viehberg, Vogel, Zanchetta, Sulpizio, Leng and Damaschke2012; Francke et al., Reference Francke, Wagner, Leng and Rethemeyer2013; Schemmel et al., Reference Schemmel, Niedermeyer, Schwab, Gleixner, Pross and Mulch2016). The so-called “8.2 ka BP event” is a much shorter-lived event (~8250–8090 cal yr BP) associated with widespread Northern Hemisphere cooling and is superimposed onto the longer 8600–8000 cal yr BP RCC event (Alley et al., Reference Alley, Mayewski, Sowers, Stuiver, Taylor and Clark1997; Rohling and Pälike, Reference Rohling and Pälike2005; Rasmussen et al., Reference Rasmussen, Bigler, Blockley, Blunier, Buchardt, Clausen and Cvijanovic2014). During the longer 8600–8000 cal yr BP RCC event, sea-surface temperature reconstructions show a cooling of 2–4°C in the Aegean Sea (Rohling et al., Reference Rohling, Mayewski, Abu-Zied, Casford and Hayes2002; Marino et al., Reference Marino, Rohling, Sangiorgi, Hayes, Casford, Lotter, Kucera and Brinkhuis2009). Pollen-based temperature reconstructions from Tenaghi Philippon and Maliq also suggest a lowering of winter temperatures by ca. 3–4°C and a reduction in annual precipitation of 200–250 mm (Bordon et al., Reference Bordon, Peyron, Lézine, Brewer and Fouache2009; Pross et al., Reference Pross, Kotthoff, Müller, Peyron, Dormoy, Schmiedl, Kalaitzidis and Smith2009). Pollen-independent terrestrial temperature reconstructions, though rare, do not show significant changes in July or annual temperature (Lake Brazi and Limni Dojran; Fig. 7; Tóth et al., Reference Tóth, Magyari, Buczkó, Braun, Panagiotopoulos and Heiri2015; Thienemann et al., Reference Thienemann, Masi, Kusch, Sadori, John, Francke, Wagner and Rethemeyer2017). Since pollen-inferred climate reconstructions cannot be used to study the impact of climate on vegetation, as it would lead to circularities, this scarcity of independent evidence makes it difficult to assess how pronounced the cooling at Zazari was. However, the disappearance of Q. ilex type during this period (Fig. 4) might have been caused by lower winter temperatures and especially frost (Lang et al., Reference Lang, Tinner, Morales-Molino, Schwörer, van Vugt, Gobet, Ammann, Lang, Ammann, Behre and Tinner2023b). Studies into moisture availability and hydrologic conditions are more widespread, with several lake records and speleothems from the eastern Mediterranean suggesting a period with drier conditions and lower lake levels (Fig. 7; Göktürk et al., Reference Göktürk, Fleitmann, Badertscher, Cheng, Edwards, Leuenberger, Fankhauser, Tüysüz and Kramers2011; Aufgebauer et al., Reference Aufgebauer, Panagiotopoulos, Wagner, Schaebitz, Viehberg, Vogel, Zanchetta, Sulpizio, Leng and Damaschke2012; Francke et al., Reference Francke, Wagner, Leng and Rethemeyer2013; Peckover et al., Reference Peckover, Andrews, Leeder, Rowe, Marca, Sahy, Noble and Gawthorpe2019). The leaf wax record from Tenaghi Philippon (Fig. 1), ca. 200 km to the east of Zazari, attributes the drier conditions to reduced summer precipitation and lower humidity between 8700 and 8200 cal yr BP (Schemmel et al., Reference Schemmel, Niedermeyer, Koutsodendris, Pross, Fiebig and Mulch2017).
Particularly drier summer conditions would have negatively impacted the mixed broadleaved forests as they are sensitive to summer droughts and would have enabled Artemisia to quickly expand around the lake (Fig. 7). Our cross-correlations clearly show how susceptible the mixed oak forests are to changes in moisture availability (Fig. 8). It is likely that parts of the marshes surrounding Chimaditis (Fig. 1) dried out (Bottema, Reference Bottema1974), further expanding the available space for Artemisia-dominated steppe. A reduction in mixed broadleaved forests and a steppe expansion can be observed in several records in the southern Balkans (e.g., Prespa, Maliq, Tenaghi Philippon; Fig. 1; Denèfle et al., Reference Denèfle, Lézine, Fouache and Dufaure2000; Pross et al., Reference Pross, Kotthoff, Müller, Peyron, Dormoy, Schmiedl, Kalaitzidis and Smith2009; Panagiotopoulos et al., Reference Panagiotopoulos, Aufgebauer, Schäbitz and Wagner2013), showing that the response to the RCC was not confined to Zazari. Interestingly, Dojran (Fig. 1) does not show any changes in the pollen percentages, but the pollen influx of Quercus robur type (same as Q. frainetto type) was reduced during the RCC event (Masi et al., Reference Masi, Francke, Pepe, Thienemann, Wagner and Sadori2018).
Intriguing is the large role that P. aviculare type plays at Zazari, as it already expanded together with Artemisia and P. lanceolata type a few decades before conditions became most arid (Fig. 8). This pollen type is associated with anthropogenic disturbances, as many of the taxa included are ruderals, spreading after forest openings or under livestock grazing (Strid, Reference Strid1986; Bottema and Woldring, Reference Bottema, Woldring, Bottema, Entjes-Nieborg and van Zeist1990; Brechbühl et al., Reference Brechbühl, van Vugt, Gobet, Morales-Molino, Volery, Lotter and Ballmer2024). It is likely that Neolithic farmers started to play an active role in the vegetation dynamics around this time, as the LUP index shows a clear increase after ca. 8500 cal yr BP (Figs. 5 and 7; LUP does not include P. aviculare type and Artemisia). On the other hand, the PCA and the cross-correlations (Figs. 6 and 8) suggest that climate was the most important driver. Polygonum aviculare type was present during the Late Glacial period and only disappeared at the onset of the Holocene, suggesting that under cold and dry conditions it was part of the native flora (Gassner et al., Reference Gassner, Gobet, Schwörer, van Leeuwen, Vogel, Giagkoulis and Makri2020); today, P. aviculare is also associated with marshes and seasonally wet/dry areas (Bottema, Reference Bottema1974; Strid, Reference Strid1986; Willis, Reference Willis1992).
After 8000 cal yr BP, the forest expanded and the previous vegetation structure was re-established, while vegetation composition changed significantly. Deciduous oaks only partly recovered, whereas pines rapidly expanded within the catchment of Zazari (Fig. 4). Similar vegetation changes occurred in the mountains of southwestern Bulgaria (Tonkov, Reference Tonkov2021) and (less pronounced) at Prespa and Iznik (Panagiotopoulos et al., Reference Panagiotopoulos, Aufgebauer, Schäbitz and Wagner2013; Miebach et al., Reference Miebach, Niestrath, Roeser and Litt2016), suggesting a widespread shift. Several authors have proposed a change in precipitation across the Mediterranean linked to changes in atmospheric circulation (e.g., Eastwood et al., Reference Eastwood, Leng, Roberts and Davis2007; Magny et al., Reference Magny, Combourieu-Nebout, Beaulieu, Bout-Roumazeilles, Colombaroli, Desprat and Francke2013; Schemmel et al., Reference Schemmel, Niedermeyer, Koutsodendris, Pross, Fiebig and Mulch2017). Plant waxes from Tenaghi Philippon (Fig. 1) suggest a shift from low to higher summer precipitation around 8000 cal yr BP (Schemmel et al., Reference Schemmel, Niedermeyer, Schwab, Gleixner, Pross and Mulch2016, Reference Schemmel, Niedermeyer, Koutsodendris, Pross, Fiebig and Mulch2017), and Tonkov et al. (Reference Tonkov, Bozilova and Possnert2016) attributed the establishment of a coniferous belt in the Bulgarian Rilin mountains (Fig. 1; including Pinus and Abies) to a climate shift towards cooler summers, warmer winters, and increased precipitation in the northern Mediterranean region. Besides climate, the start of anthropogenic disturbances during the RCC event likely played a role as well, with human impact ultimately leading to irreversible shifts in Mid- and Late Holocene plant communities.
Earliest farming and the impact of Neolithic land use on the vegetation composition
The earliest radiocarbon evidence for the start of the Neolithic is dated to ca. 8600–8500 cal yr BP in Greek Macedonia at the sites of Mavropigi-Filotsairi, Revenia-Korinos, and Paliambela Kolindros (Fig. 1), followed by a general increase in dates at 8400 cal yr BP (Maniatis, Reference Maniatis, Evangelia, Merousis and Dimoula2014; Weiberg et al., Reference Weiberg, Bevan, Kouli, Katsianis, Woodbridge, Bonnier and Engel2019; Reingruber, Reference Reingruber, Tasić, Urem-Kotsou and Burić2020). The appearance of the first documented Neolithic settlements coincides with the drought-driven forest opening, the increase of P. lanceolata type pollen, the first appearance of the largest Cerealia type pollen, and the increase of LUP at Zazari (Figs. 5 and 7). It is likely that the opening of the forest and the return to the parklands or forest-steppe facilitated the establishment of the first farming activities. Specifically, the RCC event promoted environmental conditions similar to the Levant and Anatolia, where people also preferred open parklands for their settlements, as crop cultivation and pastoralism were easier and there was no need to clear the forest first (Tinner et al., Reference Tinner, van Leeuwen, Colombaroli, Vescovi, van der Knaap, Henne, Pasta, D'Angelo and La Mantia2009; Krauss et al., Reference Krauss, Marinova, Brue and Weninger2018). Furthermore, it seems that during the RCC event, Neolithic farmers moved away from central/southeastern Anatolia and started to settle the coasts of the Aegean (e.g., Barçin, Çukuriçi Höyük, Ulucak, Mavropigi, Fig. 1; Maniatis, Reference Maniatis, Evangelia, Merousis and Dimoula2014; Weninger et al., Reference Weninger, Clare, Gerritsen, Horejs, Krauß, Linstädter, Özbal and Rohling2014; Horejs et al., Reference Horejs, Milić, Ostmann, Thanheiser, Weninger and Galik2015; Clare, Reference Clare2016). During the RCC event, coastal areas would have had more favourable climatic conditions, with less severe winters and less drought, and would have posed lower risks to the Neolithic lifestyle (Clare, Reference Clare2016).
Even though Cerealia type pollen (inc. Hordeum type, Triticum type, Avena type) already occurs from the start of our record more than 10,000 years ago, this pollen pattern cannot be interpreted as evidence for cereal cultivation. The smaller Cerealia type pollen (<60 μm) includes various wild grasses, including the wild ancestors of barley and wheat (Bottema, Reference Bottema1992; Beug, Reference Beug2004). These grasses were a common component of the steppe and deciduous oak parklands in the eastern Mediterranean (Harlan and Zohary, Reference Harlan and Zohary1966), and can be found throughout the Holocene and the Late Glacial period in Northern Greece (e.g., Huttunen et al., Reference Huttunen, Huttunen, Vasari, Panovska and Bozilova1992; Lawson et al., Reference Lawson, Frogley, Bryant, Preece and Tzedakis2004; Kouli and Dermitzakis, Reference Kouli and Dermitzakis2008). Furthermore, archaeobotanical remains from Franchthi cave show that wild barley (Hordeum vulgare ssp. spontaneum) and oats (Avena sp.) were regularly collected by Mesolithic foragers (Hansen and Renfrew, Reference Hansen and Renfrew1978; Kotzamani and Livarda, Reference Kotzamani and Livarda2018). The largest Cerealia type pollen (≥60 μm, exclusively cultivated cereals; Bottema, Reference Bottema1992) only appeared after 8500 cal yr BP in our record, after the archaeologically inferred onset of the Neolithic and concurrent with the first radiocarbon-dated cereal macrofossils from the wider region (e.g., Mavropigi, Revenia; Figs. 1 and 5; Maniatis, Reference Maniatis, Evangelia, Merousis and Dimoula2014; Chrysostomou et al., Reference Chrysostomou, Pandermalis, Tiverios, Andreou, Adam-Velené and Misailidou-Despotidou2015; Karamitrou-Mentessidi et al., Reference Karamitrou-Mentessidi, Efstratiou, Kaczanowska and Kozłowski2015; Tsartsidou and Kotsakis, Reference Tsartsidou and Kotsakis2020; Maniatis and Adaktylou, Reference Maniatis and Adaktylou2021). The majority of the larger Cerealia type pollen in our record belong to Hordeum type, with Triticum type appearing less regularly (Fig. 5). This is in contrast with the archaeobotanical record from Northern Greece, where macrofossils of glume wheats and einkorn (Triticum) dominated the settlement assemblages, although barley (Hordeum) is also well represented (Marinova and Valamoti, Reference Marinova, Valamoti, Chevalier, Marinova and Peña-Chocarro2014; Kotzamani and Livarda, Reference Kotzamani and Livarda2018; Valamoti, Reference Valamoti2023). Grains of rye (Secale) and oat (Avena) are very rare in Neolithic archaeobotanical assemblages (Zohary et al., Reference Zohary, Weiss, Hopf, Zohary, Hopf and Weiss2012b; Valamoti, Reference Valamoti2023); most likely these cereals were not cultivated and our Avena type and Secale pollen stem from wild varieties. Our interpretation is supported by the generally low LUP values prior to 8600 cal yr BP; LUP does include Cerealia type pollen <60 μm, but gives more weight to the combined occurrence of crops and weeds (Deza-Araujo et al., Reference Deza-Araujo, Morales-Molino, Conedera, Henne, Krebs, Hinz, Heitz, Hafner and Tinner2022).
From ca. 8000 cal yr BP (~6050 BCE), the number of settlements in the area around Zazari rose, with about half classed as lakeside settlements (Chrysostomou et al., Reference Chrysostomou, Pandermalis, Tiverios, Andreou, Adam-Velené and Misailidou-Despotidou2015). The higher values of Cerealia type pollen between 8000 and 5900 cal yr BP and the regular small-scale forest openings between 7400 and 6100 cal yr BP are most likely linked to the increased activities associated with these settlements. Although most of the settlements are dated based on pottery typology, radiocarbon dates from Anarghiri IXb are concentrated during the period of forest disturbances (Fig. 5; Giagkoulis, Reference Giagkoulis2019). Interestingly, Anarghiri IXb changed from a wetland site to a dryland site at some point between ca. 6650 and 5200 cal yr BP (4700–3250 BCE; Giagkoulis, Reference Giagkoulis2019). Indeed, around the same time, a short dry period from 6310 to 6160 cal yr BP at Zazari is also indicated by grain-size proxies suggesting lower lake levels and a decrease in carbonate deposition pointing to drier and colder climate conditions (Figs. 3 and 7). Towards the end of the Neolithic (~6450–5200 cal yr BP; ~4500–3250 BCE), settlement densities decreased (Chrysostomou et al., Reference Chrysostomou, Pandermalis, Tiverios, Andreou, Adam-Velené and Misailidou-Despotidou2015); unfortunately, there are no precise dates for when the settlements around Zazari were abandoned. However, the closing of the forest around 6100 cal yr BP, a general decline in radiocarbon dates in Northern Greece (Weiberg et al., Reference Weiberg, Bevan, Kouli, Katsianis, Woodbridge, Bonnier and Engel2019), and the abandonment of several Neolithic sites (Renfrew, Reference Renfrew1971; Andreou et al., Reference Andreou, Fotiadis and Kotsakis1996; Kotsakis, Reference Kotsakis, Dietz, Mavridis, Tankosic and Takaoğlu2018) would suggest limited anthropogenic activity towards the end of the Neolithic. Nevertheless, surveys show that settlements were still present, but smaller and more widely dispersed across the landscape (Weiberg et al., Reference Weiberg, Bevan, Kouli, Katsianis, Woodbridge, Bonnier and Engel2019).
Neolithic farming in Northern Greece is often characterised as intensive farming on small garden-like plots, supplemented with nuts and fruits from foraging in the forest (Bogaard, Reference Bogaard2005; Bogaard et al., Reference Bogaard, Fraser, Heaton, Wallace, Vaiglova, Charles and Jones2013; Marinova and Ntinou, Reference Marinova and Ntinou2018). In agreement, the short-lived forest disturbances between 7400 and 6100 cal yr BP and the relatively low values of cultural indicator taxa at Zazari (Fig. 5) suggest small-scale activities with minor to moderate impact on the local vegetation structure and compares well with the use of small plots for crop cultivation. The lower pollen percentages of Q. frainetto type from 8100 to 6200 cal yr BP could reflect the use of deciduous oaks as the main woodland resource in Neolithic settlements in Northern Greece (Marinova et al., Reference Marinova, Tonkov, Bozilova and Vajsov2012; Marinova and Ntinou, Reference Marinova and Ntinou2018). Also, at Anarghiri IXb oaks were predominantly used for the construction of the settlement and made up approximately 80% of the wooden piles analysed (Giagkoulis, Reference Giagkoulis2019, Reference Giagkoulis, Hafner, Dolbunova, Mazurkevich, Pranckenaite and Hinz2020).
Although the forest quickly recovered after small to moderate anthropogenic disturbances, its composition gradually changed and its diversity increased (Fig. 4). The decline of disturbance-sensitive Tilia and the expansion of disturbance-adapted Ostrya type (includes Ostrya carpinifolia and C. orientalis) is likely linked to human impact. Both Ostrya type species are light-loving, excellent resprouters, and were often used for fodder production; it is likely they benefitted from fire, cutting, and grazing disturbances (Horvat et al., Reference Horvat, Glavač and Ellenberg1974; Gobet et al., Reference Gobet, Tinner, Hubschmid, Jansen, Wehrli, Ammann and Wick2000; Pasta et al., Reference Pasta, de Rigo, Caudullo, San-Miguel-Ayanz, de Rigo, Caudullo, Houston Durrant and Mauri2016; Sikkema and Caudullo, Reference Sikkema, Caudullo, San-Miguel-Ayanz, de Rigo, Caudullo, Houston Durrant and Mauri2016). Also, Fagus and C. betulus are rather disturbance tolerant and may have been favoured by anthropogenic disturbance (Brechbühl et al., Reference Brechbühl, van Vugt, Gobet, Morales-Molino, Volery, Lotter and Ballmer2024). However, climatic change may have co-determined the expansion of these tree species (Bottema, Reference Bottema2003); for example, O. carpinifolia generally prefers humid summer conditions (Pasta et al., Reference Pasta, de Rigo, Caudullo, San-Miguel-Ayanz, de Rigo, Caudullo, Houston Durrant and Mauri2016; Lang et al., Reference Lang, Tinner, Morales-Molino, Schwörer, van Vugt, Gobet, Ammann, Lang, Ammann, Behre and Tinner2023b). Likewise, Fagus is even more mesophilous than O. carpinifolia, which may have advantaged its Late Holocene expansion as also observed in other Mediterranean areas (Morales-Molino et al., Reference Morales-Molino, Steffen, Samartin, van Leeuwen, Hürlimann, Vescovi and Tinner2021). Fire seems to have played a moderate role in the vegetation dynamics at Zazari, negatively affecting trees and promoting herbs (Fig. 8). The higher diversity of the vegetation can be partly explained by the openness of the forest, as it generally leads to a more even distribution of the pollen types, higher pollen richness, and thus more diverse conditions (Giesecke et al., Reference Giesecke, Ammann and Brande2014). In addition, Neolithic land use likely led to the formation of new vegetation communities, which also increased the diversity of the vegetation (Marinova et al., Reference Marinova, Tonkov, Bozilova and Vajsov2012).
CONCLUSIONS
Limni Zazari provides the first continuous, high-resolution multiproxy palaeoecological and palaeoenvironmental reconstruction of the Mesolithic–Neolithic transition for Northern Greece by combining pollen, microscopic charcoal, and biogeochemical proxies. Such uninterrupted time series can provide novel ecological insights into the response of vegetation to discrete disturbance events such as drought, frost, or fire. We can show that the natural forests in this region were sensitive to changes in climate and reacted quickly to RCC events with reduced moisture availability. Drier conditions between 8600 and 8000 cal yr BP opened the woodlands and enabled the re-expansion of forest-steppe vegetation. The introduction of farming in Northern Greece and thus mainland Europe was likely advantaged by this climate-induced vegetation change that had already started before the “8.2 ka event”. We assume that early farmers took advantage of the openings in the deciduous oak forests to cultivate cereals on small plots between the tree stands. Conversely, Neolithic farmers only had a small impact on the forest structure, e.g., by using fire to open the vegetation to grow crops and graze animals. Changes in vegetation composition were facilitated by land use, creating legacy effects that after 8000 years still persist today. Climate change projections predict decreasing precipitation for the Mediterranean region if greenhouse gas emissions are not drastically reduced (IPCC, 2022). According to our data, a reduction in moisture availability and related increase in fire incidence will severely affect the forest cover and related ecosystem services in Northern Greece. More detailed precipitation and temperature records would be very valuable to better understand the drivers of Holocene ecosystem and land use changes.
Supplementary material
The supplementary material for this article can be found at https://doi.org/10.1017/qua.2024.40.
Acknowledgments
We would like to thank Jacqueline van Leeuwen and Giorgia Beffa for helping with the pollen identification, and Sandra Brugger for help during the fieldwork. Many thanks go to Giulia Wienhues for discussions on the XRF and HSI data, Christoph Schwörer for help with the statistical analysis, and to Boris Vannière for discussing the charcoal data. We would also like to thank Steve Amsel for the lively discussions on Mediterranean woodlands. We thank the Greek Ministry of Culture and Sports, and Florina's Ephorate of Antiquities for the coring permissions. Suggestions provided by Sampson Panajiotidis and an anonymous reviewer are gratefully acknowledged.
Funding
Research into Limni Zazari was conducted in the framework of the project “Exploring the dynamics and causes of prehistoric land use change in the cradle of European farming” (EXPLO). This project was financially supported by the European Union's Horizon 2020 research and innovation programme under the grant agreement No. 810586 (project EXPLO). We acknowledge the University of Bern for financing the fieldwork (ID-Grant 2015/003 to A. Hafner and W. Tinner).
Competing interests
The authors declare that there are no conflicts of interest.


 Open access