


Introduction
Cardiovascular diseases (CVDs) are the leading cause of morbidity and mortality, taking ~18 million lives a year worldwide (Vaduganathan et al., Reference Vaduganathan, Mensah, Turco, Fuster and Roth2022). While high blood pressure (BP) is the leading risk factor for CVD, BP variability has also been associated with worse CVD outcomes and mortality independent of mean BP (Ernst et al., Reference Ernst, Chowdhury, Beilin, Margolis, Nelson, Wolfe, Tonkin, Ryan, Woods, McNeil, Reid and Group2020; Vaduganathan et al., Reference Vaduganathan, Mensah, Turco, Fuster and Roth2022). Disrupted 24-hour BP fluctuation is linked to endothelial dysfunction and cardiovascular damage. BP variability predicts cardiovascular events, worse stroke outcomes, and mortality, making it an independent, modifiable CVD risk factor and a potential therapeutic target (Sega et al., Reference Sega, Corrao, Bombelli, Beltrame, Facchetti, Grassi, Ferrario and Mancia2002; Mezue et al., Reference Mezue, Goyal, Pressman, Matthew, Horrow and Rangaswami2018; Ernst et al., Reference Ernst, Chowdhury, Beilin, Margolis, Nelson, Wolfe, Tonkin, Ryan, Woods, McNeil, Reid and Group2020; Stulberg et al., Reference Stulberg, Harris, Zheutlin, Delic, Sheibani, Anadani, Yaghi, Petersen and de Havenon2023).
Gut microbiota dysfunction, referred to as dysbiosis (Safarchi et al., Reference Safarchi, Al-Qadami, Tran and Conlon2025), is an emerging risk factor for CVD and has been linked to a range of CVDs (Masenga et al., Reference Masenga, Hamooya, Hangoma, Hayumbu, Ertuglu, Ishimwe, Rahman, Saleem, Laffer, Elijovich and Kirabo2022). Gut microbiome (GM), comprising gut microbiota, their genomes, and functions, is recognized as a key modulator of BP, supported by compelling evidence from both animal and human studies (Li et al., Reference Li, Zhao, Wang, Chen, Tao, Tian, Wu, Liu, Cui, Geng, Zhang, Weldon, Auguste, Yang, Liu, Chen, Yang, Zhu and Cai2017; Marques et al., Reference Marques, Mackay and Kaye2018; Verhaar et al., Reference Verhaar, Collard, Prodan, Levels, Zwinderman, Backhed, Vogt, Peters, Muller, Nieuwdorp and van den Born2020; Jama et al., Reference Jama, Rhys-Jones, Nakai, Yao, Climie, Sata, Anderson, Creek, Head, Kaye, Mackay, Muir and Marques2023). The GM metabolites, including short-chain fatty acids (SCFAs), mediate BP by promoting vasodilation and reducing systemic inflammation through multiple mechanisms (Marques et al., Reference Marques, Mackay and Kaye2018; Jama et al., Reference Jama, Rhys-Jones, Nakai, Yao, Climie, Sata, Anderson, Creek, Head, Kaye, Mackay, Muir and Marques2023). The GM dysbiosis has been consistently associated with hypertension across large cohorts spanning diverse ethnic groups (Verhaar et al., Reference Verhaar, Collard, Prodan, Levels, Zwinderman, Backhed, Vogt, Peters, Muller, Nieuwdorp and van den Born2020). Recent studies indicate that GM-based therapies, such as probiotics and SCFA supplements, effectively reduce BP in humans, highlighting their therapeutic potential in BP regulation (Marques et al., Reference Marques, Mackay and Kaye2018; Jama et al., Reference Jama, Rhys-Jones, Nakai, Yao, Climie, Sata, Anderson, Creek, Head, Kaye, Mackay, Muir and Marques2023). Despite a plethora of investigations into the associations between GM and BP, it remains unclear if GM is associated with BP variability.
The composition of GM exhibits rhythmic fluctuations over a 24-hour period, consistent with variations in BP within the same timeframe (Chakraborty et al., Reference Chakraborty, Mandal, Cheng, Galla, Hindupur, Saha, Yeoh, Mell, Yeo, Vijay-Kumar, Yang and Joe2020), suggesting GM may be associated with 24-hour BP variability. Currently, only two clinical studies have reported a plausible association between GM and SBP/diastolic BP (DBP) variability in sex-unstratified cohorts (Dinakis et al., Reference Dinakis, Nakai, Gill, Ribeiro, Yiallourou, Sata, Muir, Carrington, Head, Kaye and Marques2022; Lin et al., Reference Lin, Sayols-Baixeras, Baldanzi, Dekkers, Hammar, Nguyen, Nielsen, Eklund, Varotsis, Holm, Nielsen, Lind, Bergstrom, Smith, Engstrom, Arnlov, Sundstrom, Orho-Melander and Fall2025). These studies utilized the standard deviation (SD) of 24-hour BP as the BP variability metric, which fails to adequately reflect short-term BP variations (Mena et al., Reference Mena, Pintos, Queipo, Aizpurua, Maestre and Sulbaran2005; Mena et al., Reference Mena, Felix, Melgarejo and Maestre2017). Yet investigations using average real variability (ARV), which is considered a more reliable prognostic index of 24-hour BP variability (Mena et al., Reference Mena, Pintos, Queipo, Aizpurua, Maestre and Sulbaran2005; Mena et al., Reference Mena, Felix, Melgarejo and Maestre2017), are lacking. Moreover, previous studies lacked adjustment for key confounding factors, including sleep quality, which can significantly influence both 24-hour BP variability and GM (Dinakis et al., Reference Dinakis, Nakai, Gill, Ribeiro, Yiallourou, Sata, Muir, Carrington, Head, Kaye and Marques2022; Lin et al., Reference Lin, Sayols-Baixeras, Baldanzi, Dekkers, Hammar, Nguyen, Nielsen, Eklund, Varotsis, Holm, Nielsen, Lind, Bergstrom, Smith, Engstrom, Arnlov, Sundstrom, Orho-Melander and Fall2025). Disruption of sleep patterns and host molecular clock proteins has been associated with GM dysbiosis (Liang et al., Reference Liang, Bushman and FitzGerald2015), underscoring the importance of accounting for sleep quality in studies investigating the association between GM and abnormal BP variability. While we have previously shown sex differences in association between GM and hypertension (Virwani et al., Reference Virwani, Qian, Hsu, Pijarnvanit, Cheung, Chow, Tang, Tse, Xian, Lam, Lee, Lo, Liu, Ho, Chow, Leung, Tsang, Lo, Tung, Chung, Yuen, Leung, Ip, Hung, Louie, el-Nezami, Ho and Lau2023), whether there are sex-specific effects on the GM–BP variability relationship remains to be investigated. To address these gaps, we conducted a cross-sectional study to investigate the link between GM profiled by shotgun metagenomic sequencing and 24-hour BP variability assessed by 24-hour SBP/ DBP ARV. Sex-stratified analysis was conducted under different statistical models, adjusting for various confounding factors.
Methods
Study design and population
This study was approved by the Institutional Review Board of the University of Hong Kong/ Hospital Authority Hong Kong West Cluster (UW 18–498), and informed consent was obtained from all participants. Two hundred and eighty-four individuals residing in Hong Kong were enrolled between July 2018 and June 2020 through community recruitment by open advertisements. The study design was as previously described (Virwani et al., Reference Virwani, Qian, Hsu, Pijarnvanit, Cheung, Chow, Tang, Tse, Xian, Lam, Lee, Lo, Liu, Ho, Chow, Leung, Tsang, Lo, Tung, Chung, Yuen, Leung, Ip, Hung, Louie, el-Nezami, Ho and Lau2023). In brief, inclusion criteria were age 40–65 years, Chinese ethnicity, with no known symptomatic cardiovascular, neurological, gastrointestinal, neurodegenerative, autoimmune diseases, or malignancy. Participants with recent gastroenteritis, febrile illness, steroids, antibiotics, or probiotics use within 4 weeks and recent travel to tropical areas within 6 months were excluded. After excluding 43 participants who took anti-hypertensive agents and further excluding 6 participants with fewer than 10 consecutive daytime readings and three consecutive nighttime readings, 235 participants were included in the final analysis.
BP measurement and calculation of 24-hour BP variability
A calibrated ambulatory BP monitoring device, TM-2441 (A&D Medical, Japan) (Kario et al., Reference Kario, Hoshide, Saito, Sato, Hamasaki, Suwa and Tomitani2019), was fitted onto the participants, with the BP cuff placed on their non-dominant arm to record the 24-hour ambulatory BP. The BP was measured every 30 minutes from 06:00 to 22:00 h (daytime) and then every 60 minutes from 22:00 to 06:00 h (nighttime). Data points from the first and last hour of each 24-hour blood pressure monitoring were included in the analysis. Of the 235 recordings, a mean of 36 points per recording was utilized (range: 16–44, total study included 8,556 points). This represents a 95% success rate for data acquisition. Hypertension was defined according to the 2025 American College of Cardiology/American Heart Association Joint Committee Guidelines (Jones et al., Reference Jones, Ferdinand, Taler, Johnson, Shimbo, Abdalla, Altieri, Bansal, Bello, Bress, Carter, Cohen, Collins, Commodore-Mensah, Davis, Egan, Khan, Lloyd-Jones, Melnyk, Mistry, Ogunniyi, Schott, Smith, Talbot, Vongpatanasin, Watson, Whelton and Williamson2025): 24-hour mean BP (SBP ≥ 130 or DBP ≥ 80 mm Hg). Variability in 24-hour SBP and DBP was assessed using the average real variability (ARV) index. ARV was calculated from all consecutive SBP and DBP readings obtained over the 24-hour monitoring period. The formula used was:
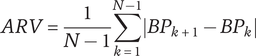
where N represents the total number of valid readings, and BPₖ and BPₖ₊₁ are consecutive BP measurements (Mena et al., Reference Mena, Pintos, Queipo, Aizpurua, Maestre and Sulbaran2005). Resting clinic BP was also measured with an automatic monitor, the Microlife BP A200 AFIB (Microlife, Taiwan), after the participant had been seated and resting for at least 15 minutes. Three measurements were taken at intervals of at least 1 minute, and the average of these readings was used for analysis.
Stool collection, DNA extraction, library preparation, and sequencing
Each participant was given a stool collection kit consisting of a stool collection pan (2-piece sample collector, DYND36500, Medline Industries Inc., USA) and a stool container during the clinic visit. If the participants could not provide the stool sample during the clinic visit, they were instructed to collect the stool at home, refrigerate the stool sample, and return to the laboratory within 24 hours in the provided ice bag and ice packs. The stool samples were homogenized, subsampled into four equal aliquots, and stored at −80 °C until further processing (Jones et al., Reference Jones, Reinke, Ali, Palmer and Christophersen2021). DNA extraction and next-generation sequencing were performed at the Centre for PanorOmic Sciences of the University of Hong Kong. DNA was extracted from 200 mg of frozen stool samples by using QIAsymphony DSP Virus/Pathogen DNA Midi Kit (QIAgen, Hilden, Germany) as previously described (Virwani et al., Reference Virwani, Qian, Hsu, Pijarnvanit, Cheung, Chow, Tang, Tse, Xian, Lam, Lee, Lo, Liu, Ho, Chow, Leung, Tsang, Lo, Tung, Chung, Yuen, Leung, Ip, Hung, Louie, el-Nezami, Ho and Lau2023). Shotgun metagenomics was performed on Illumina NovaSeq 6000 (Illumina) in multiple batches (n = 80 per batch) (Virwani et al., Reference Virwani, Qian, Hsu, Pijarnvanit, Cheung, Chow, Tang, Tse, Xian, Lam, Lee, Lo, Liu, Ho, Chow, Leung, Tsang, Lo, Tung, Chung, Yuen, Leung, Ip, Hung, Louie, el-Nezami, Ho and Lau2023).
Taxonomic and functional profiling of raw sequencing data
Sequencing read pre-processing and analysis methods were as previously described (Virwani et al., Reference Virwani, Qian, Hsu, Pijarnvanit, Cheung, Chow, Tang, Tse, Xian, Lam, Lee, Lo, Liu, Ho, Chow, Leung, Tsang, Lo, Tung, Chung, Yuen, Leung, Ip, Hung, Louie, el-Nezami, Ho and Lau2023). In brief, raw sequencing reads were quality filtered and trimmed using Bbduk from the BBmap Suite (Bushnell, Reference Bushnell2014). Contaminant sequences were removed by aligning to human and PhiX reference genomes. Species abundances were estimated using MetaPhlAn 4.1.1 (Blanco-Míguez et al., Reference Blanco-Míguez, Beghini, Cumbo, McIver, Thompson, Zolfo, Manghi, Dubois, Huang, Thomas, Nickols, Piccinno, Piperni, Punčochář, Valles-Colomer, Tett, Giordano, Davies, Wolf, Berry, Spector, Franzosa, Pasolli, Asnicar, Huttenhower and Segata2023), and gene family abundances were estimated using HUMAnN v4.0.0.alpha.1 (Beghini et al., Reference Beghini, McIver, Blanco-Míguez, Dubois, Asnicar, Maharjan, Mailyan, Manghi, Scholz, Thomas, Valles-Colomer, Weingart, Zhang, Zolfo, Huttenhower, Franzosa and Segata2021) and then regrouped into Kyoto Encyclopedia of Genes and Genomes (KEGG) ontology higher-level functional annotations (Kanehisa et al., Reference Kanehisa, Sato, Kawashima, Furumichi and Tanabe2016).
Blood biochemical tests and assessments of covariates
Blood samples were collected from participants during the clinic visit after an overnight fast. Serum was separated by centrifugation and stored at −80 °C. Fasted serum total cholesterol, triglycerides, high-density lipoprotein (HDL), and low-density lipoprotein (LDL) levels were estimated using commercial kits (TECO Diagnostics, USA #C507–480, #T532-1 L, #H513–100, #L530–100). Serum glucose was measured using a glucose meter, ACCU-CHEK Performa (Roche, USA). To estimate sleep parameters, participants wore an Actigraphy watch (Actigraph, LA) for 7 days and were instructed to only take off the watch when they took a shower and when they swam. Sleep and wake-up times were estimated by the Actigraph watch, and sleep latency was automatically estimated using the Actigraph software. The urinary sodium and creatinine were measured in the second morning spot urine using commercial kits (Abcam, UK #ab 211096, #ab 204537) to estimate the daily sodium intake as described by Kawasaki et al. (Reference Kawasaki, Itoh, Uezono and Sasaki1993).
Assessment of dietary intake based on a 7-day dietary recall
Trained staff recorded participants’ weekly consumption, covering foods and beverages such as grains, seafood, meat, eggs, dairy, fruits/vegetables, soups, snacks, drinks, condiments, oils, cooking methods, fats/oils, and dairy fat content. Portion sizes were estimated using common utensils and reference guides, (Hong Kong population-based food consumption survey 2005–2007 [Food and Environmental Hygiene Department, 2010]; Australian health survey food model booklet [Australian Bureau of Statistics, 2010]). Total energy, macronutrients, and micronutrients were calculated with FoodWorks (v10). Most values came from Hong Kong Center for Food Safety (HKCFS), with supplementary data from the Australian Food and Nutrient Database (AUSNUT 2011–2013), the United States Department of Agriculture (USDA), and the Taiwan Food and Drug Administration databases when HKCFS data were unavailable.
Statistical and bioinformatics analysis
Statistical analyses were performed using the R statistical environment (version 4.3). Taxonomic features were filtered based on a minimum relative abundance threshold of >0.01% abundance at a prevalence of 10%. This resulted in the inclusion of 341 total species. Relative abundances were transformed using the centered log ratio (CLR) transform after the addition of a universal pseudo-value equal to the lowest non-zero abundance per species (Lin et al., Reference Lin, Sayols-Baixeras, Baldanzi, Dekkers, Hammar, Nguyen, Nielsen, Eklund, Varotsis, Holm, Nielsen, Lind, Bergstrom, Smith, Engstrom, Arnlov, Sundstrom, Orho-Melander and Fall2025). Functional gene abundances were similarly filtered and normalized after grouping KEGG orthology (KO) terms into higher functional annotation terms. Due to the sparsity and large number of features in the functional gene data stratified by bacterial species, we applied abundance filtering and CLR transformation individually to each pathway subset. Alpha (α-) and beta (β-) diversity indices, Bray–Curtis distance matrix, and permutational multivariate analysis of variance (PERMANOVA) analysis were performed using the vegan package (Oksanen et al., Reference Oksanen, Simpson, Blanchet, Kindt, Legendre, Minchin, O’Hara, Solymos, Stevens, Szoecs, Wagner, Barbour, Bedward, Bolker, Borcard, Borman, Carvalho, Chirico, Caceres, Durand, Evangelista, FitzJohn, Friendly, Furneaux, Hannigan, Hill, Lahti, Martino, McGlinn, Ouellette, Cunha, Smith, Stier, Braak and Weedon2020). Principal coordinates analysis (PCoA) was performed using classical multidimensional scaling (MDS) with Bray–Curtis distances. Statistical association testing was performed using linear regression models, which allowed adjustment of confounding variables. The following covariate adjustment models (m) were applied: m1: no covariate adjustment; m2: age, sex, and BMI; m3: m2 + sodium intake estimated by using spot urine analysis, smoking status, sleep latency, and mean 24-hour SBP or DBP. We considered statistical significance under two frameworks: an unadjusted p-value threshold of 0.01 and Benjamini–Hochberg false discovery rate (FDR) adjusted p-value threshold of 0.05.
Baseline summary statistics were performed using the Mann–Whitney U-test for continuous variables and Fisher’s exact test for binary categorical variables across sex. Data were presented as mean ± SD for continuous variables and rounded counts and percentages for categorical variables.
Results
Baseline clinical characteristics
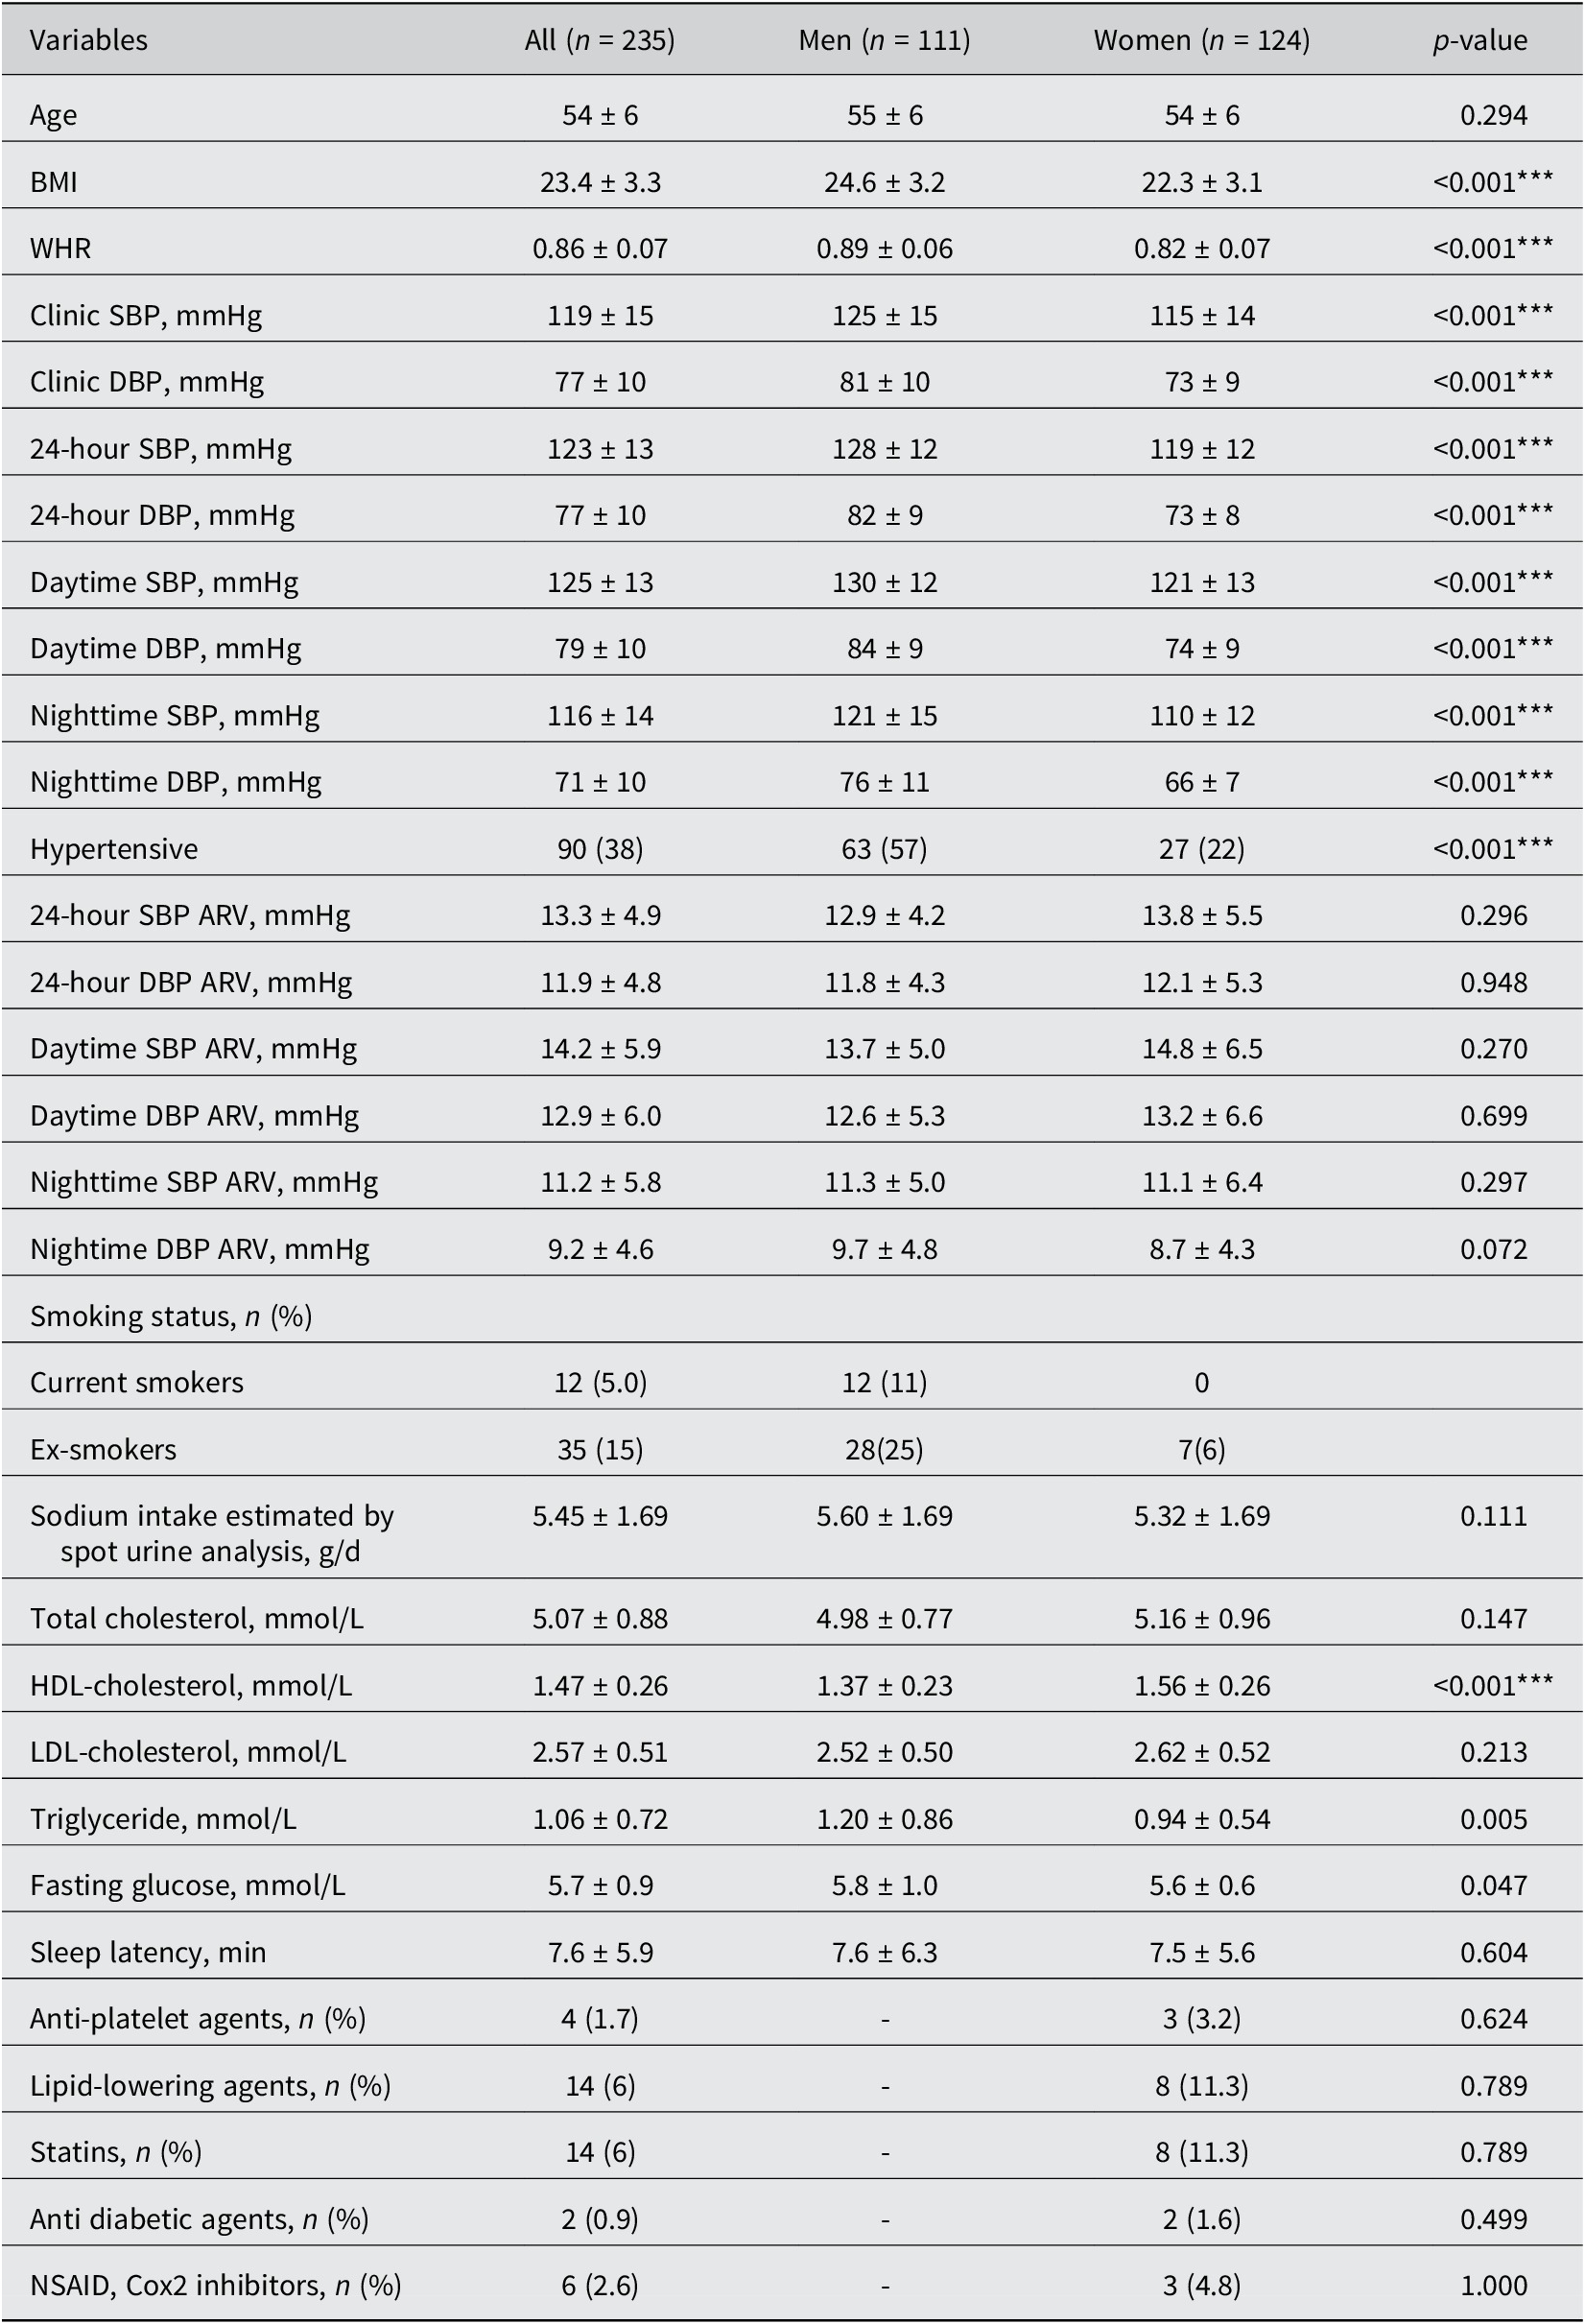
The baseline clinical characteristics of 235 participants (mean [SD] age 54 [6] years; 53% women), 24-hour SBP/DBP (mean [SD] 123 [13]/77 [10] mmHg), and comparisons between men and women are described in the Table 1. The dietary intake of fibre, macronutrients, and micronutrients was not significantly associated with 24-hour SBP/DBP ARV Supplementary Material (Table S1).
Clinical characteristics of the study population.
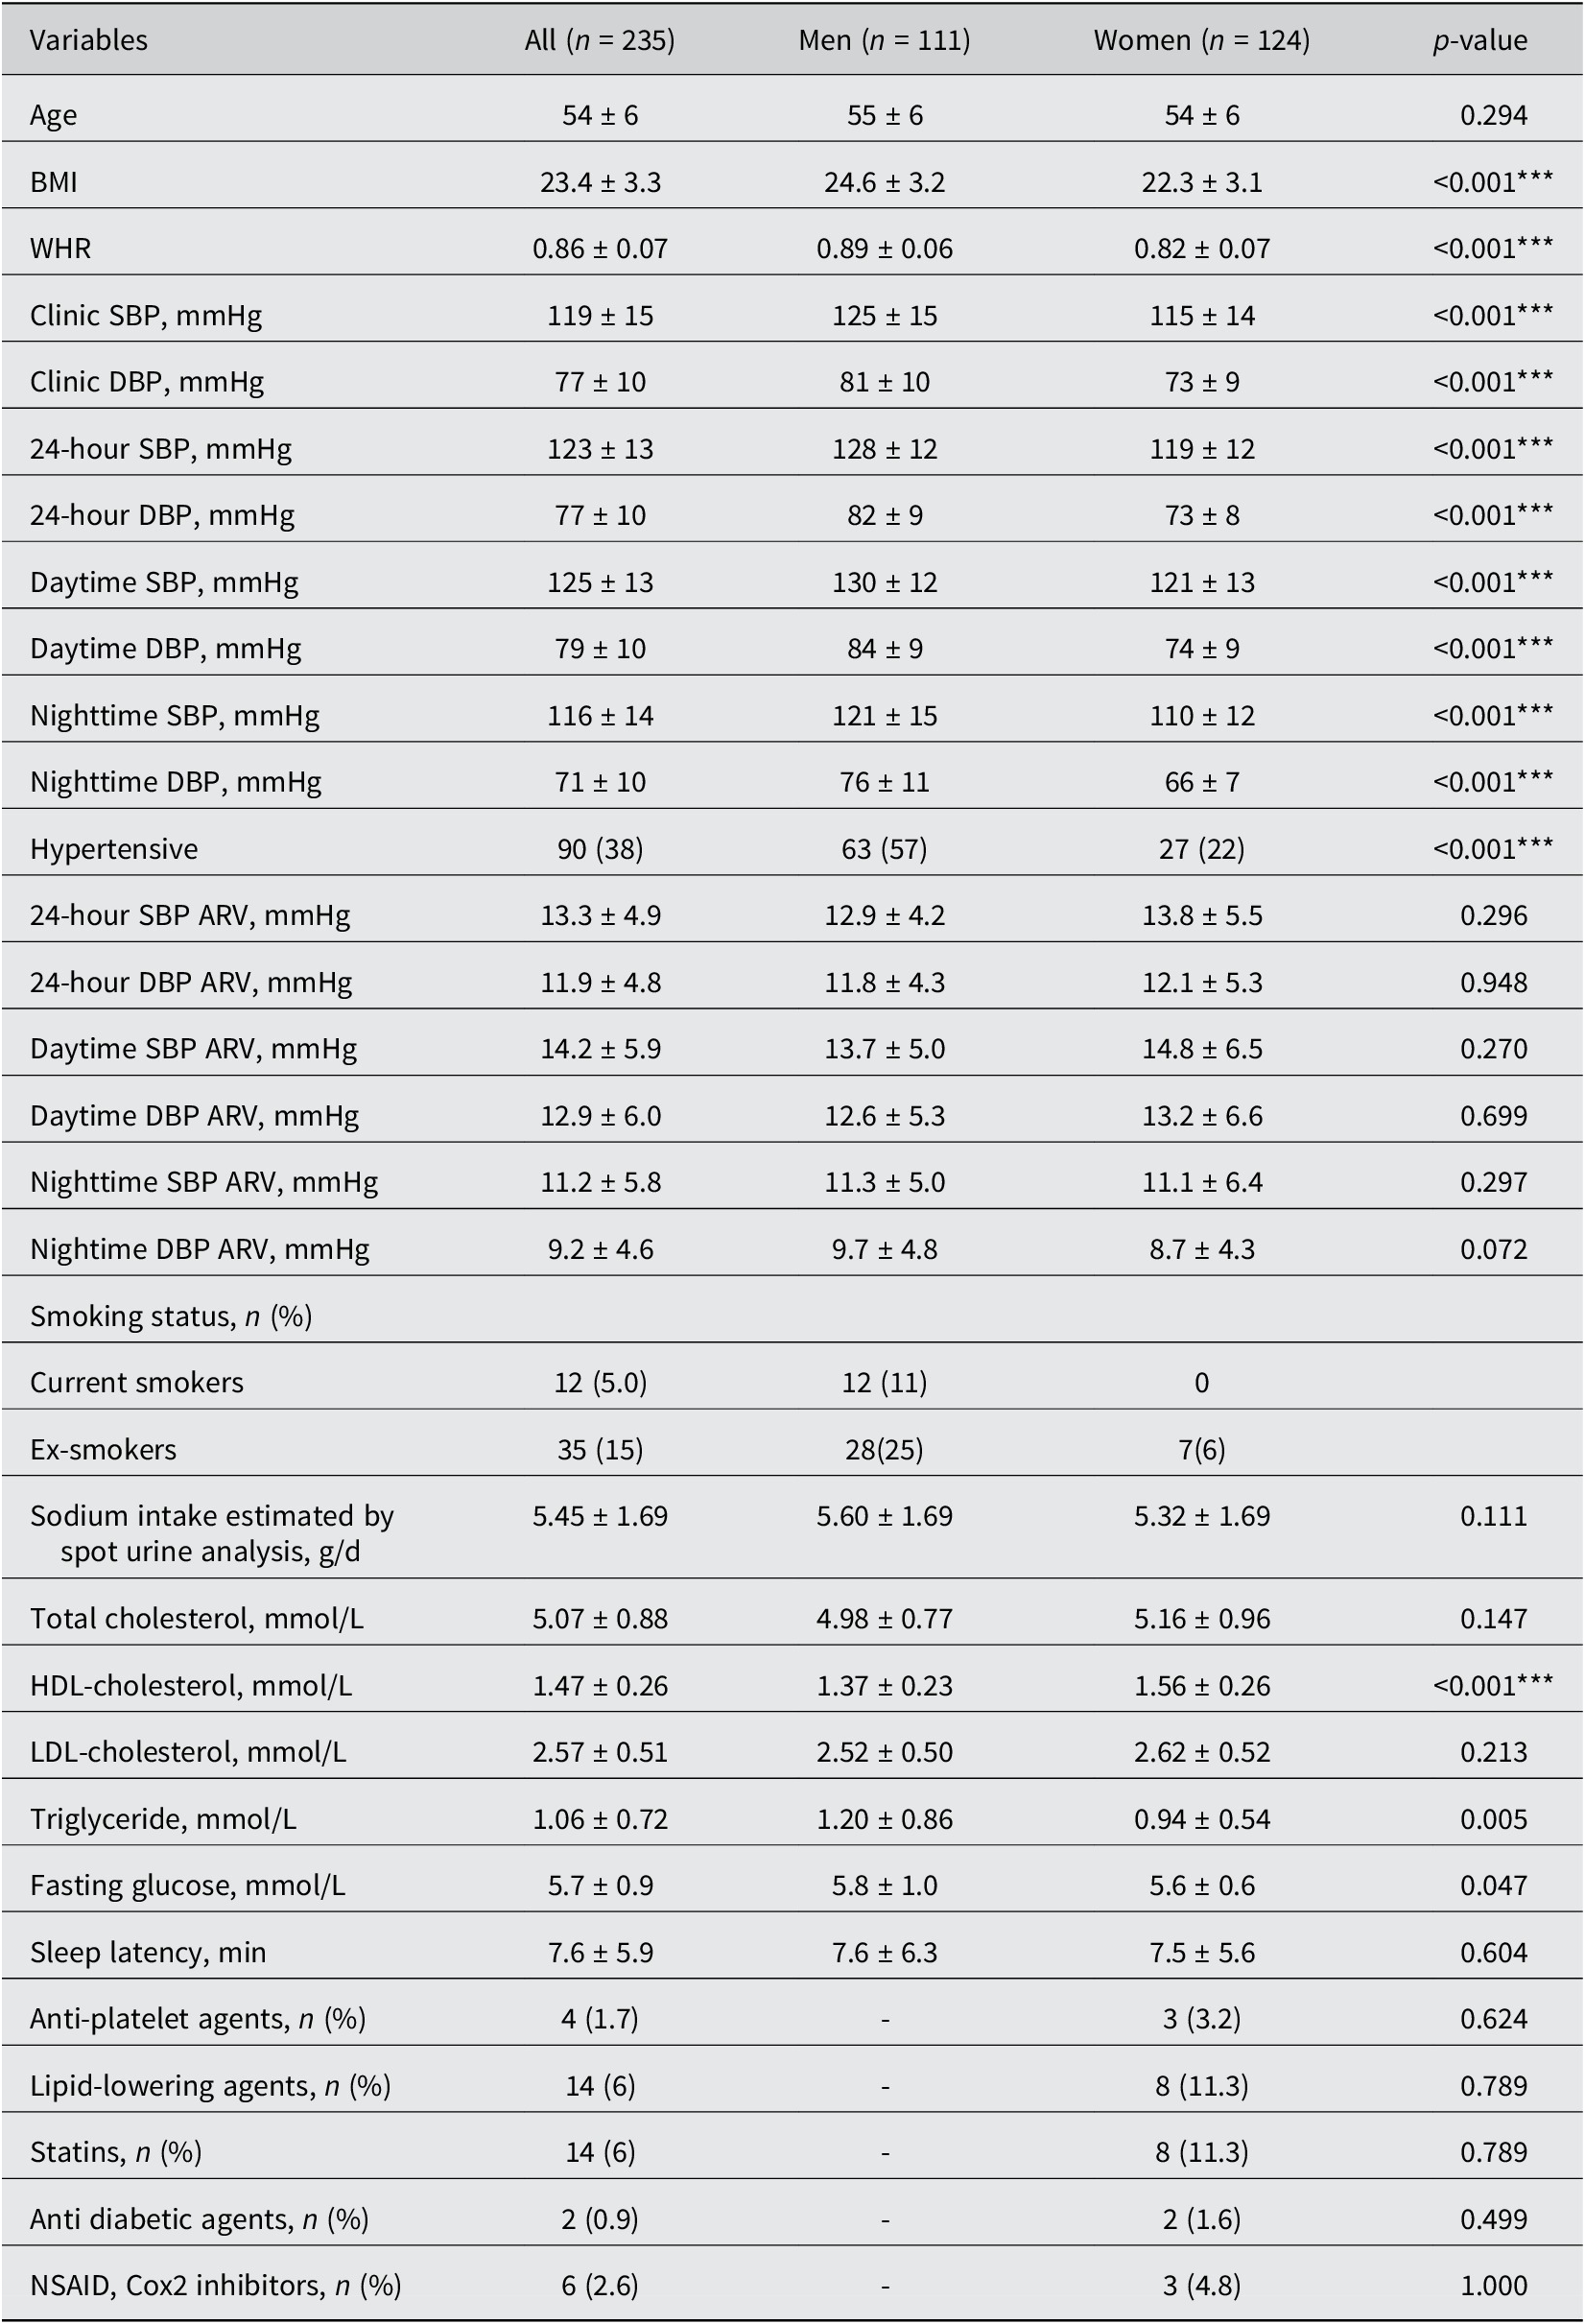
Table 1. Long description
Top left panel describes the study population as community-dwelling Chinese adults not on blood pressure lowering medication, with a mean age of 54 plus or minus 6 years, 111 men and 124 women. Top center panel outlines the methodology: 24-hour blood pressure average real variability, gut microbiota shotgun sequencing, and covariates adjusted including age, sex, mean 24-hour systolic blood pressure, body mass index, smoking status, sleep latency, and sodium intake. Top right panel introduces the main variable, systolic blood pressure variability, and lists associated changes: decreased gut microbiota species alpha-diversity and beta-diversity, decreased gut microbiota functional beta-diversity, and increased Oscillibacter species E R 4. Bottom left panel shows that increased systolic blood pressure variability is associated with decreased gut microbiota species alpha-diversity, with C. symbiosum contributing to functional pathways and increased cytoskeleton proteins. Bottom center panel details increased gut microbiota species beta-diversity and functional beta-diversity, increased B. nordii, increased steroid biosynthesis, increased 3-oxo-5-alpha-steroid 4-dehydrogenase, and increased arylsulfatase. Bottom right panel lists species contributing to functional pathways with increased systolic blood pressure variability: B. nordii (steroid hormone biosynthesis, L P S biosynthesis, phenylalanine metabolism, sulphur metabolism, fatty acid biosynthesis, glycan degradation, arginine and proline metabolism), P. dorei, B. thetaiotaomicron (D alanine metabolism), and C. symbiosum (cytoskeleton proteins).
Note: Hypertensive status was based on 24-hour ambulatory BP. The data are represented as mean ± standard deviation. Statistical significance was assessed by Mann–Whitney U-test for continuous variables and Fisher’s exact test for binary categorical variables across sex. Statistically significant differences between men and women are indicated by ***P < 0.001. Abbreviations: BMI, body mass index; DBP, diastolic blood pressure; SBP, systolic blood pressure; WHR, waist-to-hip ratio; HDL, high-density lipoprotein; LDL, low-density lipoprotein; NSAID, nonsteroidal anti-inflammatory drug.
GM α- and β-diversity is associated with 24-hour SBP and DBP ARV in a sex-specific manner
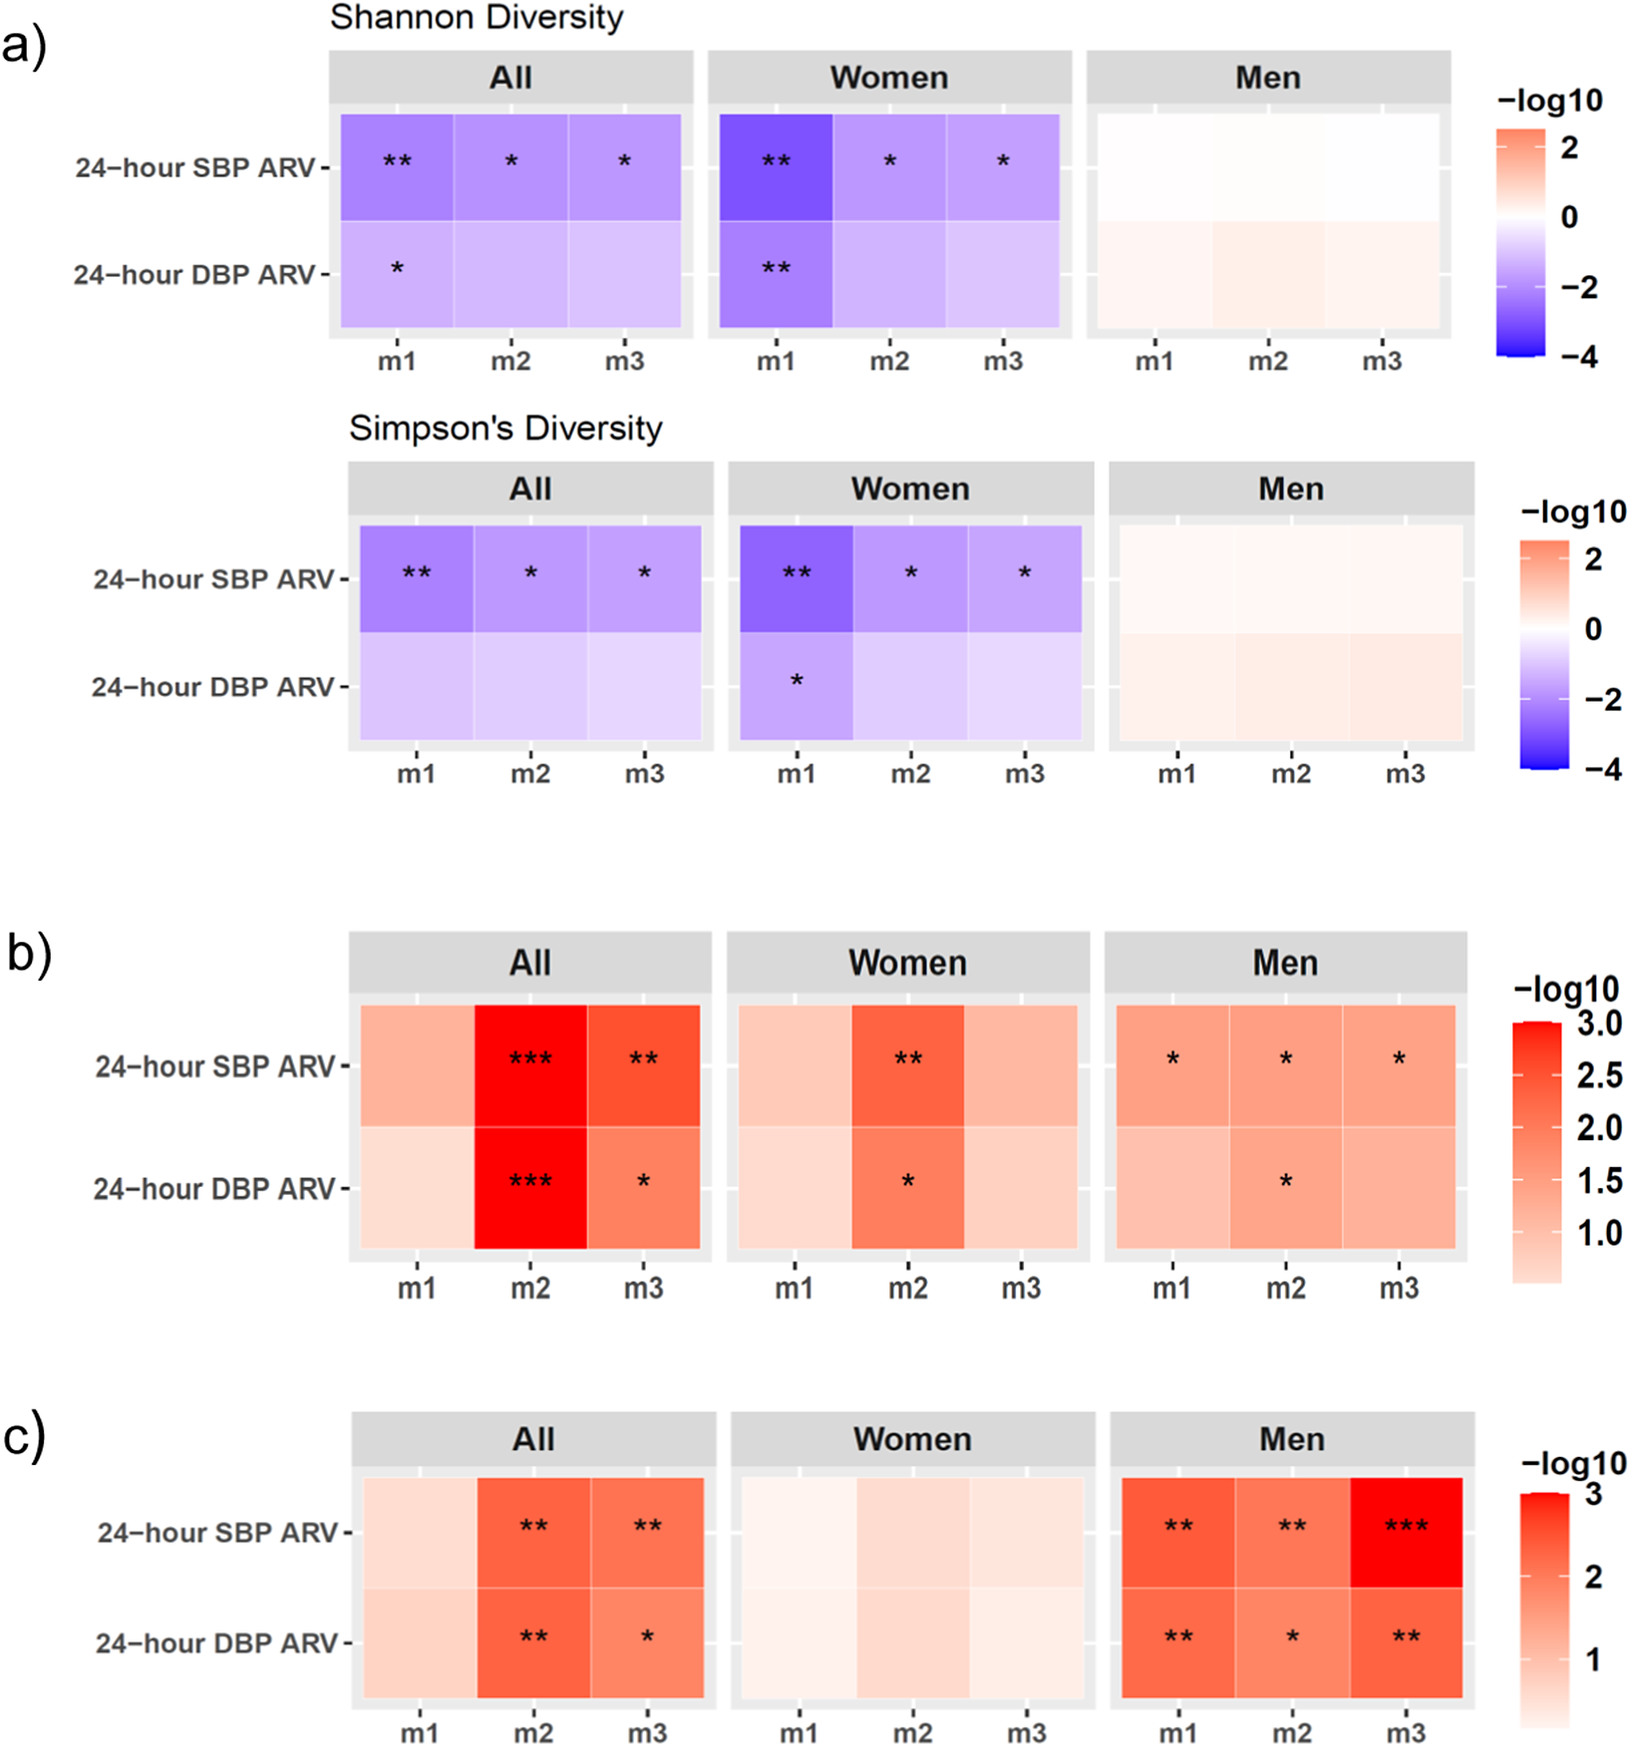
Whole-genome shotgun sequencing of 235 stool samples yielded 29.6 ± 6.6 (mean ± SD) million reads per sample after filtering. There was a negative association between GM α-diversity measures, Shannon and Simpson’s diversity index, and 24-hour SBP ARV in the full cohort, which remained significant after adjusting for covariates in m2 and m3 (Figure 1A; Supplementary Material Table S2). Sex-stratified analyses indicated that Shannon and Simpson’s diversity index associations with SBP ARV were significant only in women (Figure 1A; Supplementary Material Table S2), but not men, suggesting reduced GM species α-diversity in women with greater SBP variability. The association of Shannon and Simpson’s index with DBP ARV was not significant in covariate-adjusted models (Figure 1A; Supplementary Material Table S2). In the full cohort, GM composition and function β-diversity was not significantly associated with 24-hour SBP/DBP ARV in the unadjusted analysis (m1), but the association became significant in covariate-adjusted m2 and m3 (Figure 1B, C; Supplementary Materials Tables S3, S4), indicating that demographic, lifestyle, and clinical covariates may confound β-diversity associations. In sex-stratified analysis, GM composition β-diversity was significantly associated with SBP ARV, and function β-diversity was associated with both SBP and DBP ARV across m1–m3 in men (Figure 1B, C; Supplementary Materials Table S3, S4), suggesting its relationship with BP variability is robust and largely independent of major lifestyle and cardiometabolic confounders in men within our cohort. Taken together, these findings demonstrate distinct dysbiosis signatures in men and women with increased SBP variability at both GM composition and function levels.
Sex differences in the associations of the markers of gut microbiome (GM) dysbiosis and 24-hour SBP/DBP ARV. (A) GM species Shannon diversity (top panel) and Simpson’s diversity (bottom panel) associations analysed by linear regression analysis. (B) GM species beta-diversity and (C) GM functional beta-diversity associations with 24-hour SBP/DBP ARV analysed by PERMANOVA testing. All data were analysed in the full cohort (all) and in sex-stratified cohorts (men and women) after adjusting for confounding factors in three models (m) of covariate adjustment: m1, no covariate adjustment; m2: age, sex, and BMI; m3: m2+ 24-hour mean SBP or DBP, sleep latency, sodium intake based on spot urine analysis, and smoking status. The statistically significant p-values are indicated as *P < 0.05, **P < 0.01, ***P < 0.001. Abbreviations: ARV, average real variability; BMI, body mass index; DBP, diastolic blood pressure; GM, gut microbiome; SBP, systolic blood pressure.
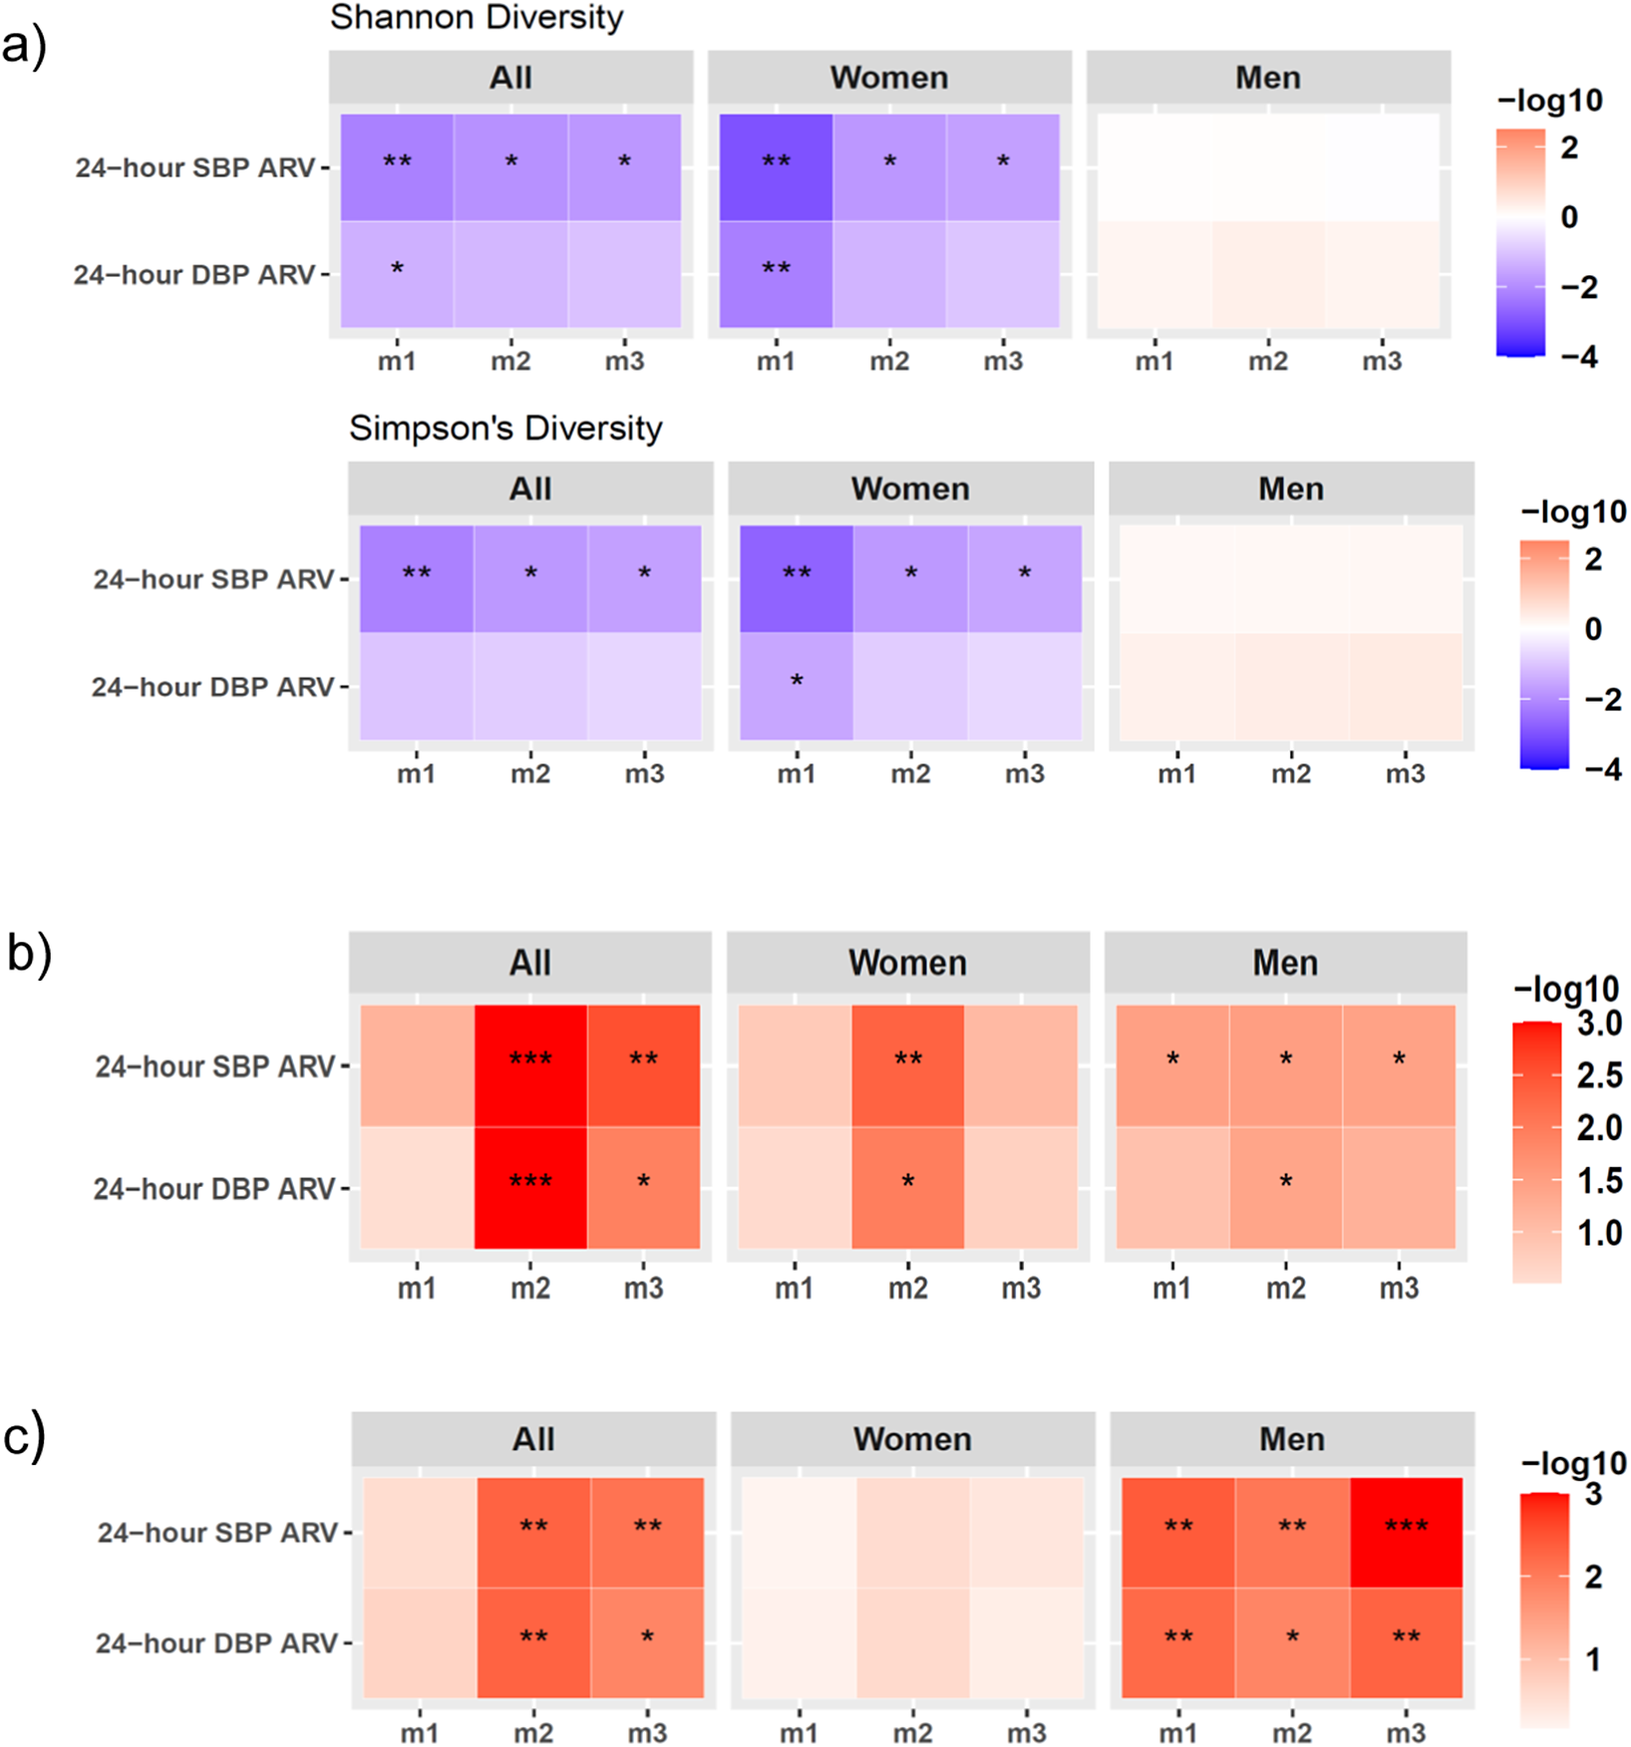
Figure 1. Long description
The visual consists of three labeled panels, each with three heatmaps arranged horizontally for ‘All’, ‘Women’, and ‘Men’. Each heatmap displays two rows for 24-hour S B P A R V and 24-hour D B P A R V, and three columns for models m1, m2, m3. Panel a shows Shannon and Simpson's diversity with color scale from blue (negative log10) to red (positive log10). Significant negative associations (blue, asterisks) are seen for ‘All’ and ‘Women’ in both diversity indices, especially in m1 and m2, but not in ‘Men’. Panel b shows species beta-diversity with a red color scale, indicating significant positive associations (red, asterisks) for ‘All’ in m2 and m3, for ‘Women’ in m2 and m3, and for ‘Men’ in all models, with the strongest in m2 for ‘All’. Panel c shows functional beta-diversity, with significant positive associations for ‘All’ in m2 and m3, and for ‘Men’ in all models, especially m3. Color bars at the right of each panel indicate the log10 scale used. Asterisks denote statistical significance: one for P less than 0.05, two for P less than 0.01, three for P less than 0.001.
Distinct gut bacterial species are associated with 24-hour SBP and DBP ARV in men versus women
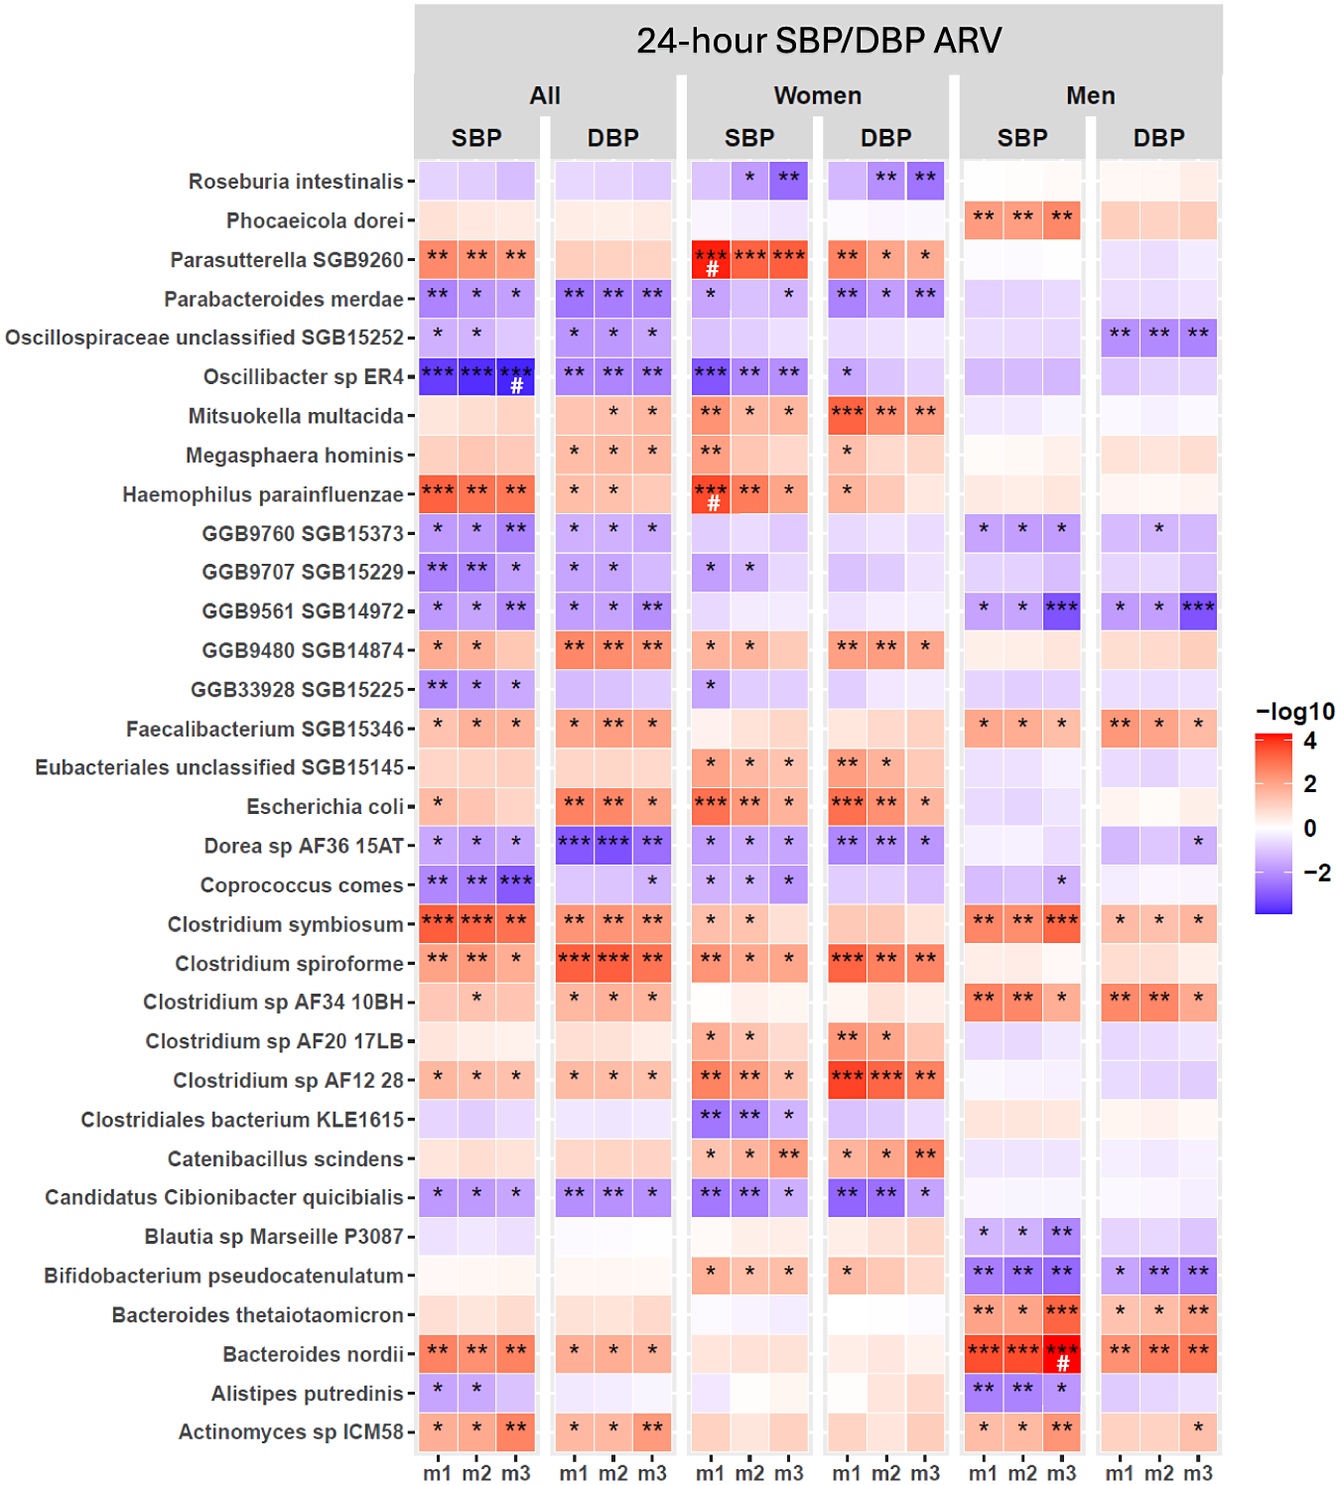
Shotgun sequencing analysis identified several bacterial species with significant associations with 24-hour SBP/DBP ARV in the full cohort across covariate-adjusted models (Figure 2; Supplementary Material Table S5); sex-stratified analyses revealed that these associations were either driven by women or men, with no shared species (Figure 2; Supplementary Material Table S5). In women, GM species associated with both SBP/DBP variability across m1–m3 were Parasutterella SGB9260, Mitsuokella multacida , Escherichia coli , Candidatus Cibionibacter quicibialis , Catenibacillus scindens , and Clostridium species, Clostridium spiroforme and C. AF12 28 (Figure 2; Supplementary Material Table S5). In men, Bacteroides nordii , Bacteroides thetaiotamicron, Clostridium symbiosum, Clostridium sp. AF3410BH, and Faecalibacterium SGB15346 had a positive association, whereas Bifidobacterium pseudocatenulatum had a negative association with SBP/DBP variability across all models (Figure 2; Supplementary Material Table S5). Notably, associations of Oscillibacter sp. ER4 and B. nordii with SBP ARV remained significant after 5% FDR correction in m3 adjusted for various demographic, lifestyle, and clinical confounding variables in the full cohort and men, respectively (Figure 2; Supplementary Material Table S5). However, no GM species were significantly associated with 24-hour DBP ARV after FDR correction in either the full cohort or sex-stratified analysis (Figure 2; Supplementary Material Table S5). In women, Haemophilus parainfluenza and Parasutterella SGB 9260 were significantly associated with 24-hour SBP ARV in the unadjusted analysis (m1) after 5% FDR correction, but this association did not persist after adjustment of covariates in m2 and m3 (Figure 2; Supplementary Material Table S5). Taken together, we identified distinct GM species associated with SBP/DBP variability in men and women, with minimal overlap between the sexes, suggesting potential sex differences in GM association with SBP/DBP variability.
Gut microbiome (GM) bacterial species associated with 24-hour SBP/DBP ARV in the full cohort and sex-stratified analyses. Linear regression analysis was performed systematically for each bacterial species in the full cohort (all) and under sex-stratified cohorts (men and women) in three statistical models for covariate adjustment: m1: no covariate adjustment; m2: age, sex, and BMI; m3: m2 + 24-hour mean SBP or DBP, sleep latency, sodium intake based on spot urine analysis, and smoking status. Only species with P < 0.01 significance in at least one model are shown. The statistically significant P-values are indicated as *P < 0.05, **P < 0.01, ***P < 0.001. False discovery rate correction was applied separately for each sex and model subset using the Benjamini–Hochberg (BH) procedure at 5% FDR, and a significant q-value is indicated as #. Abbreviations: ARV, average real variability; BMI, body mass index; DBP, diastolic blood pressure; GM, gut microbiome; SBP, systolic blood pressure.
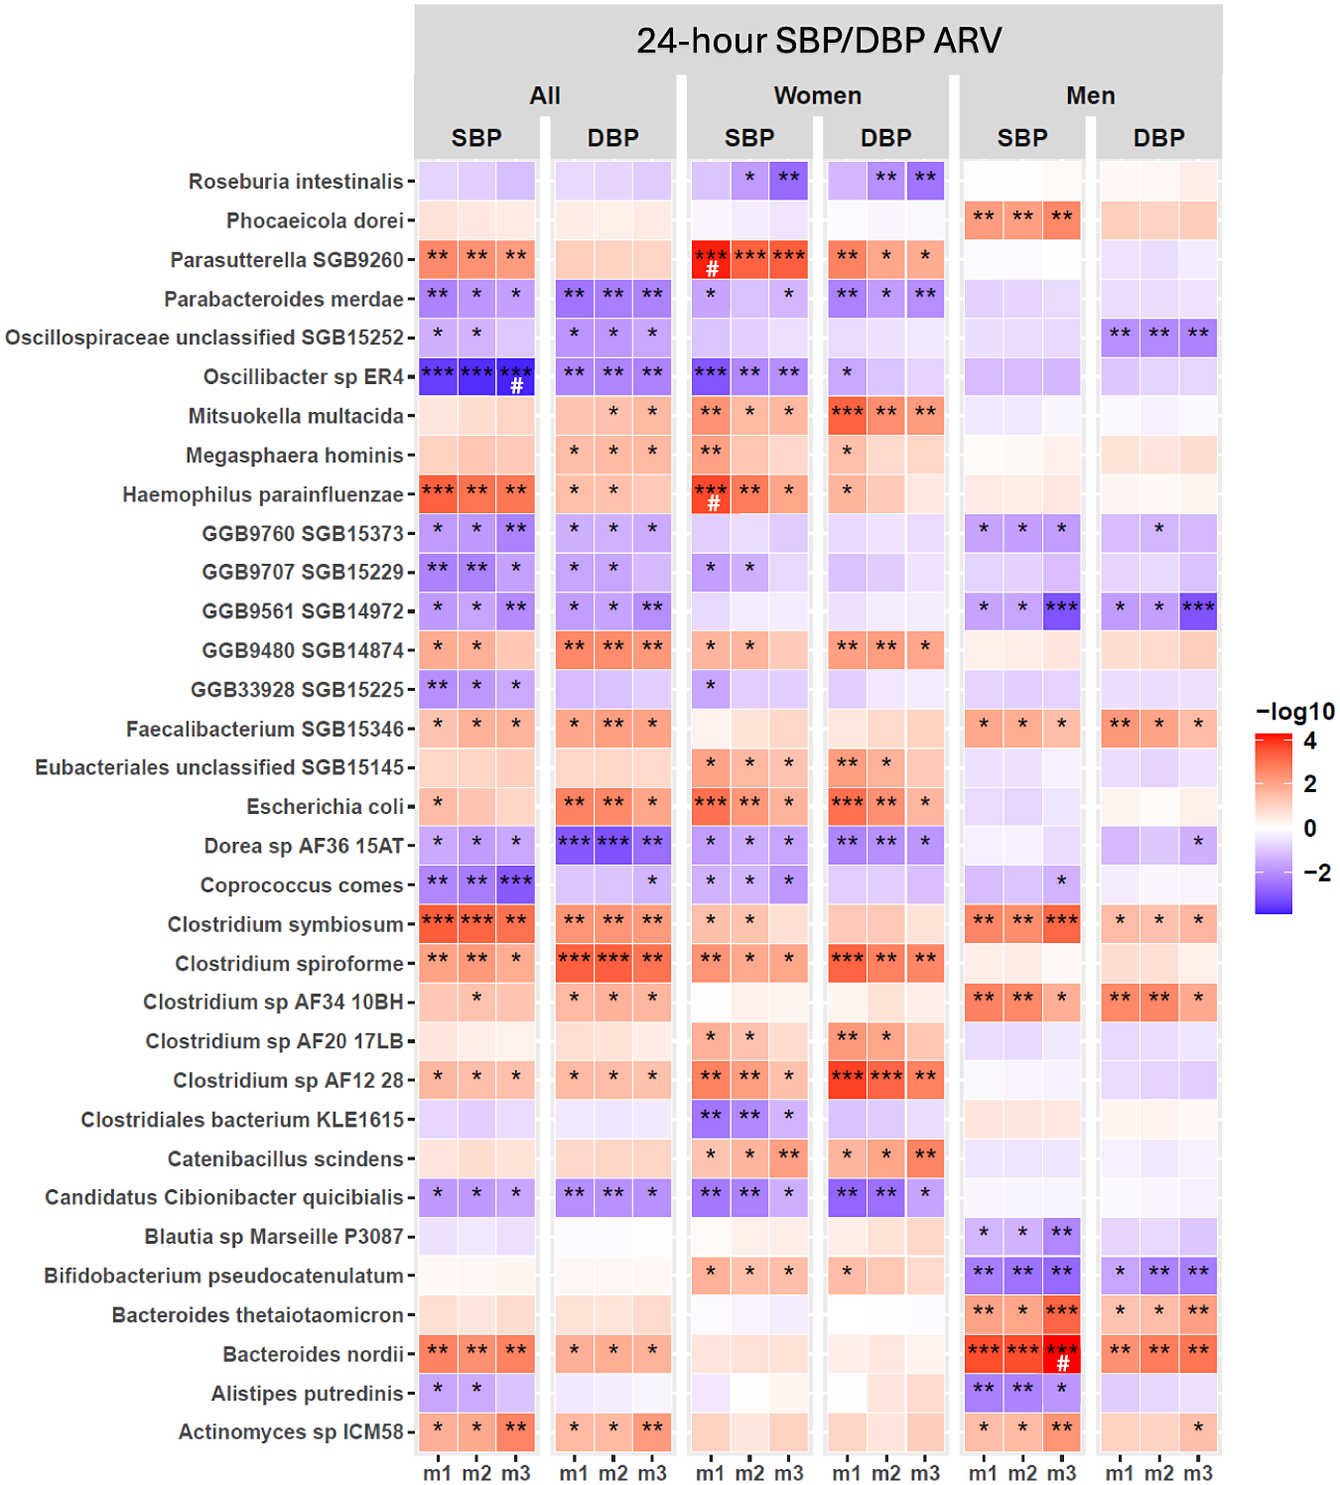
Figure 2. Long description
The heatmap consists of six main vertical panels labeled at the top as All, Women, and Men, each split into S B P and D B P columns. The y-axis lists 32 gut bacterial species, from Roseburia intestinalis at the top to Actinomyces sp I C M 58 at the bottom. Each panel contains three subcolumns labeled m1, m2, and m3, representing different covariate adjustment models. Each cell is colored on a gradient from blue (negative association, -log10 values) to red (positive association, +log10 values), with deeper colors indicating stronger associations. Statistical significance is marked by asterisks: one for P less than 0.05, two for P less than 0.01, three for P less than 0.001, and a hash symbol for significant q-values after Benjamini–Hochberg correction. Notable findings include strong positive associations (deep red) for Parasutterella S G B 9260 with S B P in women under m1, and negative associations (deep blue) for Oscillospiraceae unclassified S G B 15252 with D B P in all and women under m3. Patterns of significance and directionality vary by species, cohort, and model, highlighting sex-specific and model-dependent relationships between gut microbiome composition and blood pressure variability.
Distinct GM functional pathways are associated with 24-hour SBP and DBP ARV in men and women
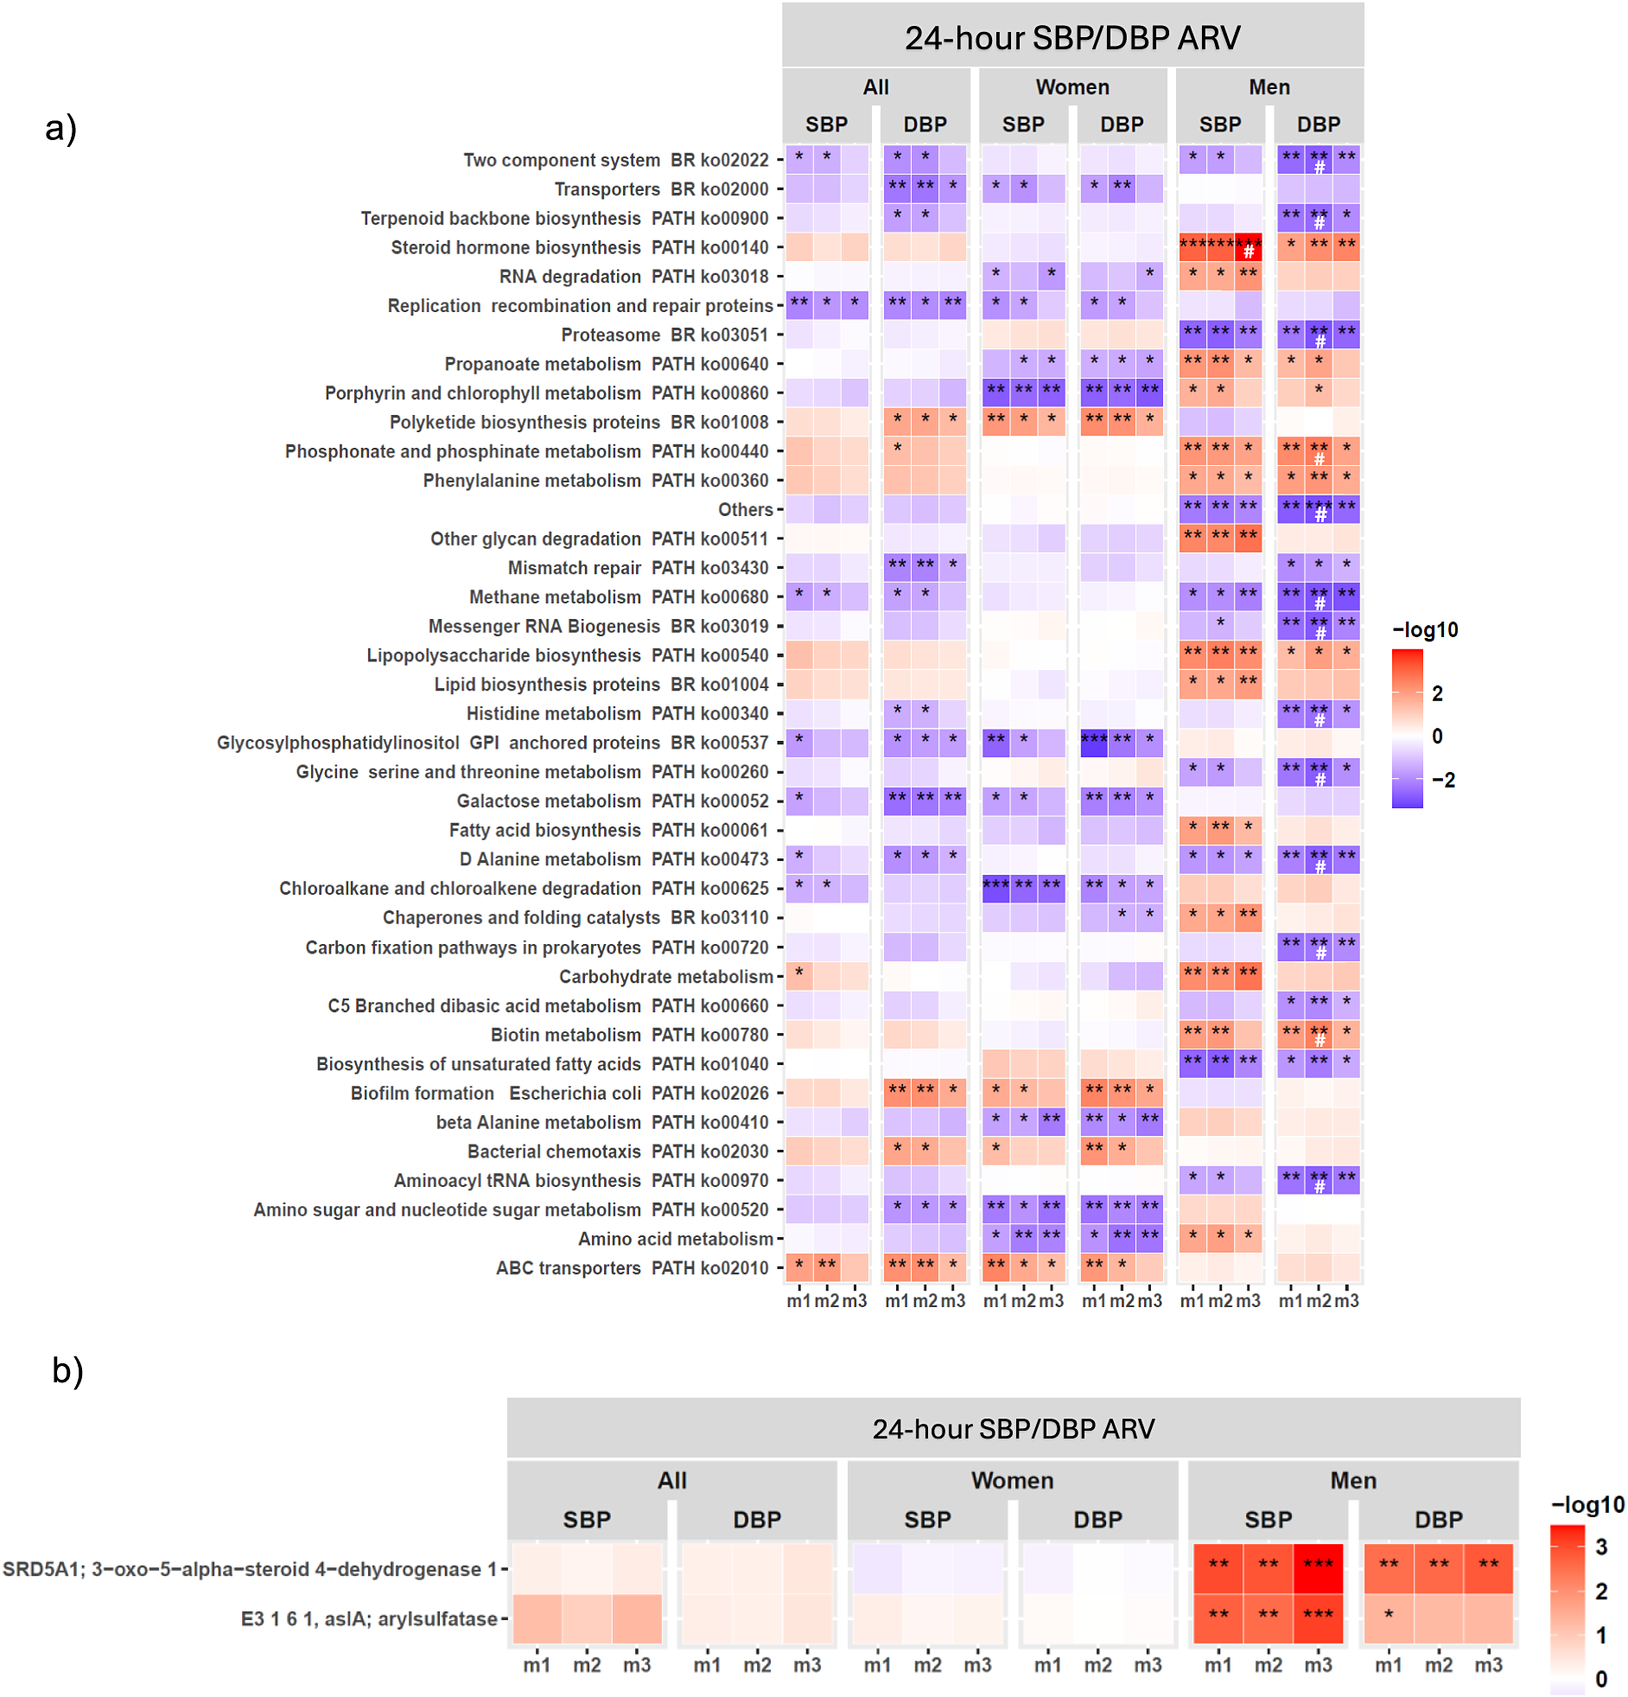
Functional GM analysis showed a few KEGG functional pathways were associated with SBP/DBP ARV across m1–m3 in the full cohort (Figure 3A; Supplementary Material Table S6), which did not remain significantly associated after 5% FDR correction. Consistent with our findings of significant functional β-diversity associations with SBP/DBP ARV in men (Figure 1C; Supplementary Material Table S6), sex-stratified analysis showed significant associations between microbial functional pathways and SBP/DBP ARV were predominantly detected in men (Figure 3A; Supplementary Material Table S6). Key microbial functional pathways significantly associated with both SBP/DBP ARV across m1–m3 in men included steroid biosynthesis, proteasome, phosphonate and phosphinate metabolism, phenylalanine metabolism, methane metabolism, lipopolysaccharide (LPS) biosynthesis, D-alanine metabolism, biotin metabolism, and biosynthesis of unsaturated fatty acids in men (Figure 3A; Supplementary Material Table S6). Several of these functional pathway associations with DBP ARV remained significant after 5% FDR correction in m2 adjusted for age and BMI, but they no longer remained significant when mean BP, sleep latency, sodium intake, and smoking status were included in m3 (Figure 3A; Supplementary Material Table S6). This pattern suggests that the associations between these microbial functional pathways and DBP variability may be partly dependent on DBP, sleep, and lifestyle parameters. Notably, the steroid hormone biosynthesis pathway was the sole pathway that remained significantly associated with SBP ARV in men after 5% FDR correction in full covariate-adjusted m3 (Figure 3A; Supplementary Material Table S6). Gene family-level analysis showed that 3-oxo-5-alpha-steroid 4-dehydrogenase of the steroid hormone biosynthesis pathway was strongly associated with SBP/DBP ARV across m1–m3, while arylsulfatase was significantly associated with SBP ARV, after 5% FDR correction across m1–m3 (Figure 3B). In women, no KEGG functional pathways were significantly associated with SBP/SBP ARV after FDR correction (Figure 3A; Supplementary Material Table S6). Consistent with our findings on GM composition, we observed minimal overlap in functional genes associated with SBP/DBP ARV between men and women (Figure 3A; Supplementary Material Table S6), further supporting that GM may influence BP variability through distinct, sex-specific mechanisms.
Gut microbiome (GM) functional pathways associated with 24-hour SBP/DBP ARV in the full cohort and sex-stratified analyses. Association of (A) KEGG functional pathways (B) gene families comprising KEGG steroid biosynthesis pathway, with SBP/DBP ARV through linear regression analysis in the full cohort (all) and sex-stratified analysis (men and women) after adjusting for confounding factors in three models (m) of covariate adjustment. False discovery rate (FDR) correction was applied separately for each sex and model subset using the Benjamini–Hochberg (BH) procedure at 5% FDR. (A) Only functional KEGG pathways with P < 0.01 significance in at least one model are shown. The statistically significant P-values are indicated as *P < 0.05, **P < 0.01, and ***P < 0.001, and a significant FDR-corrected q-value is indicated as #. (B) Significant FDR-corrected q-values are indicated as *q < 0.05, **q < 0.01, and ***q < 0.001. Covariate adjusted models (m): m1, no covariate adjustment; m2: age, sex, and BMI; m3: m2 + 24-hour mean SBP or DBP, sleep latency, sodium intake based on spot urine analysis, and smoking status. Abbreviations: ARV, average real variability; BMI, body mass index; DBP, diastolic blood pressure; KEGG, Kyoto Encyclopedia of Genes and Genomes; SBP, systolic blood pressure.
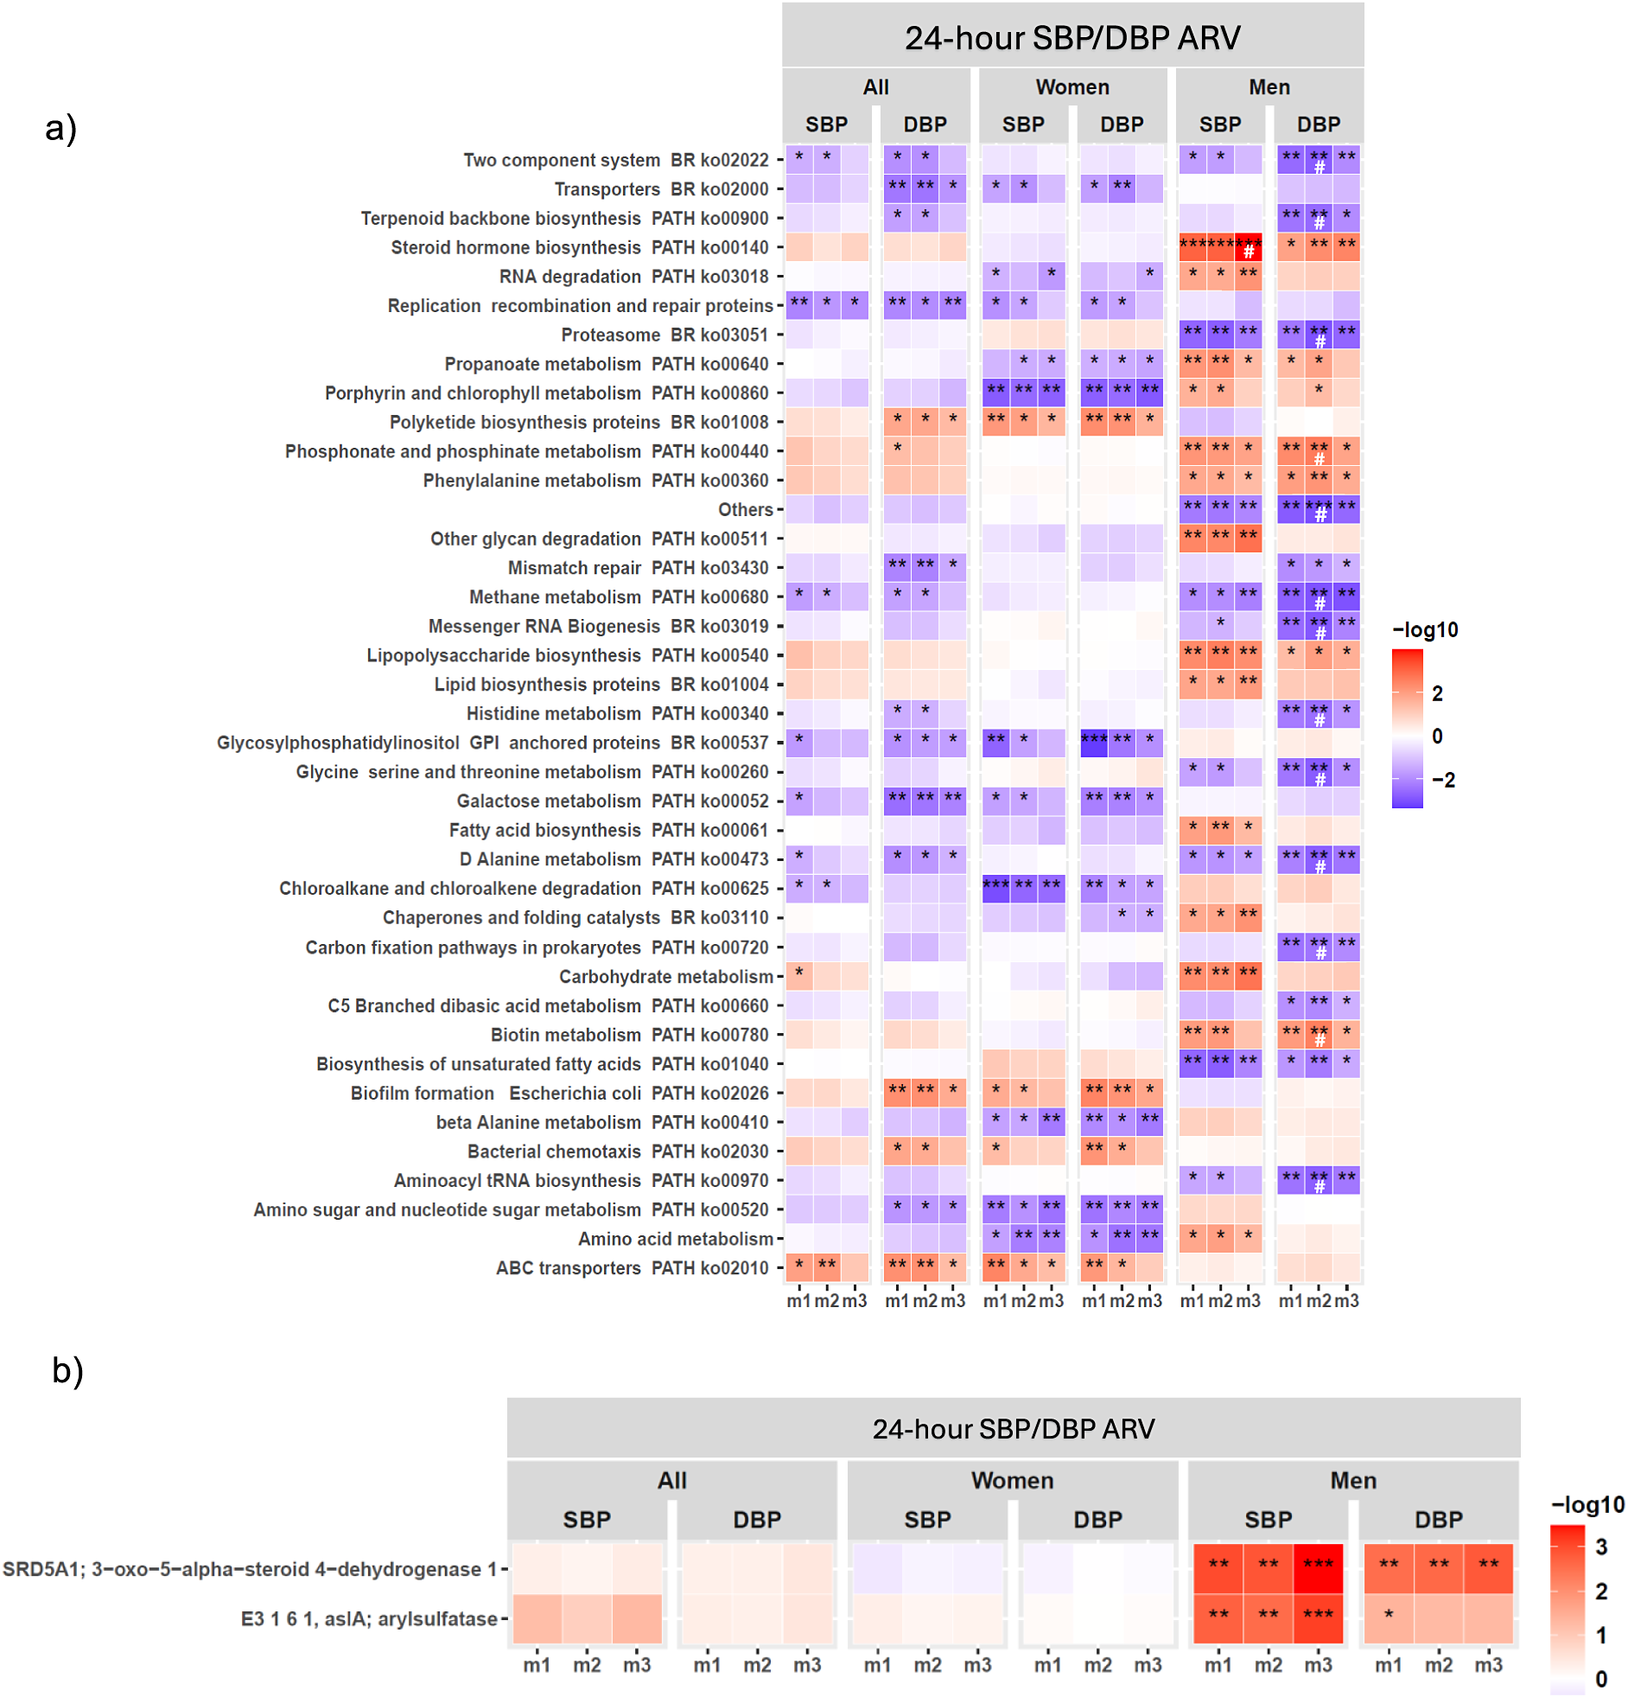
Figure 3. Long description
Panel a at the top displays a heatmap with rows listing KEGG pathways such as Two component system, Transporters, Terpenoid backbone biosynthesis, and others. Columns are grouped under 24-hour SBP or DBP ARV, divided into All, Women, and Men, each with SBP and DBP, and further split into m1, m2, m3 models. Each cell is colored from blue (negative association, -log10 values) to red (positive association, +log10 values), with intensity reflecting significance. Asterisks indicate statistical significance: one for P less than 0.05, two for P less than 0.01, three for P less than 0.001, and hash for FDR-corrected q-value. Notable positive associations (red) are seen for Steroid hormone biosynthesis in men for SBP and DBP, especially in m2 and m3. Other pathways like RNA degradation and Replication recombination and repair proteins show negative associations (blue) in women. Panel b below shows a similar heatmap for gene families within the KEGG steroid biosynthesis pathway, with rows labeled SRD5A1, E3 1 6 1, and arylsulfatase. The strongest positive associations (deep red, three asterisks) are observed for men in m2 and m3 for both SBP and DBP. The color bar on the right of each panel indicates the -log10 scale from -2 (blue) to 3 (red).
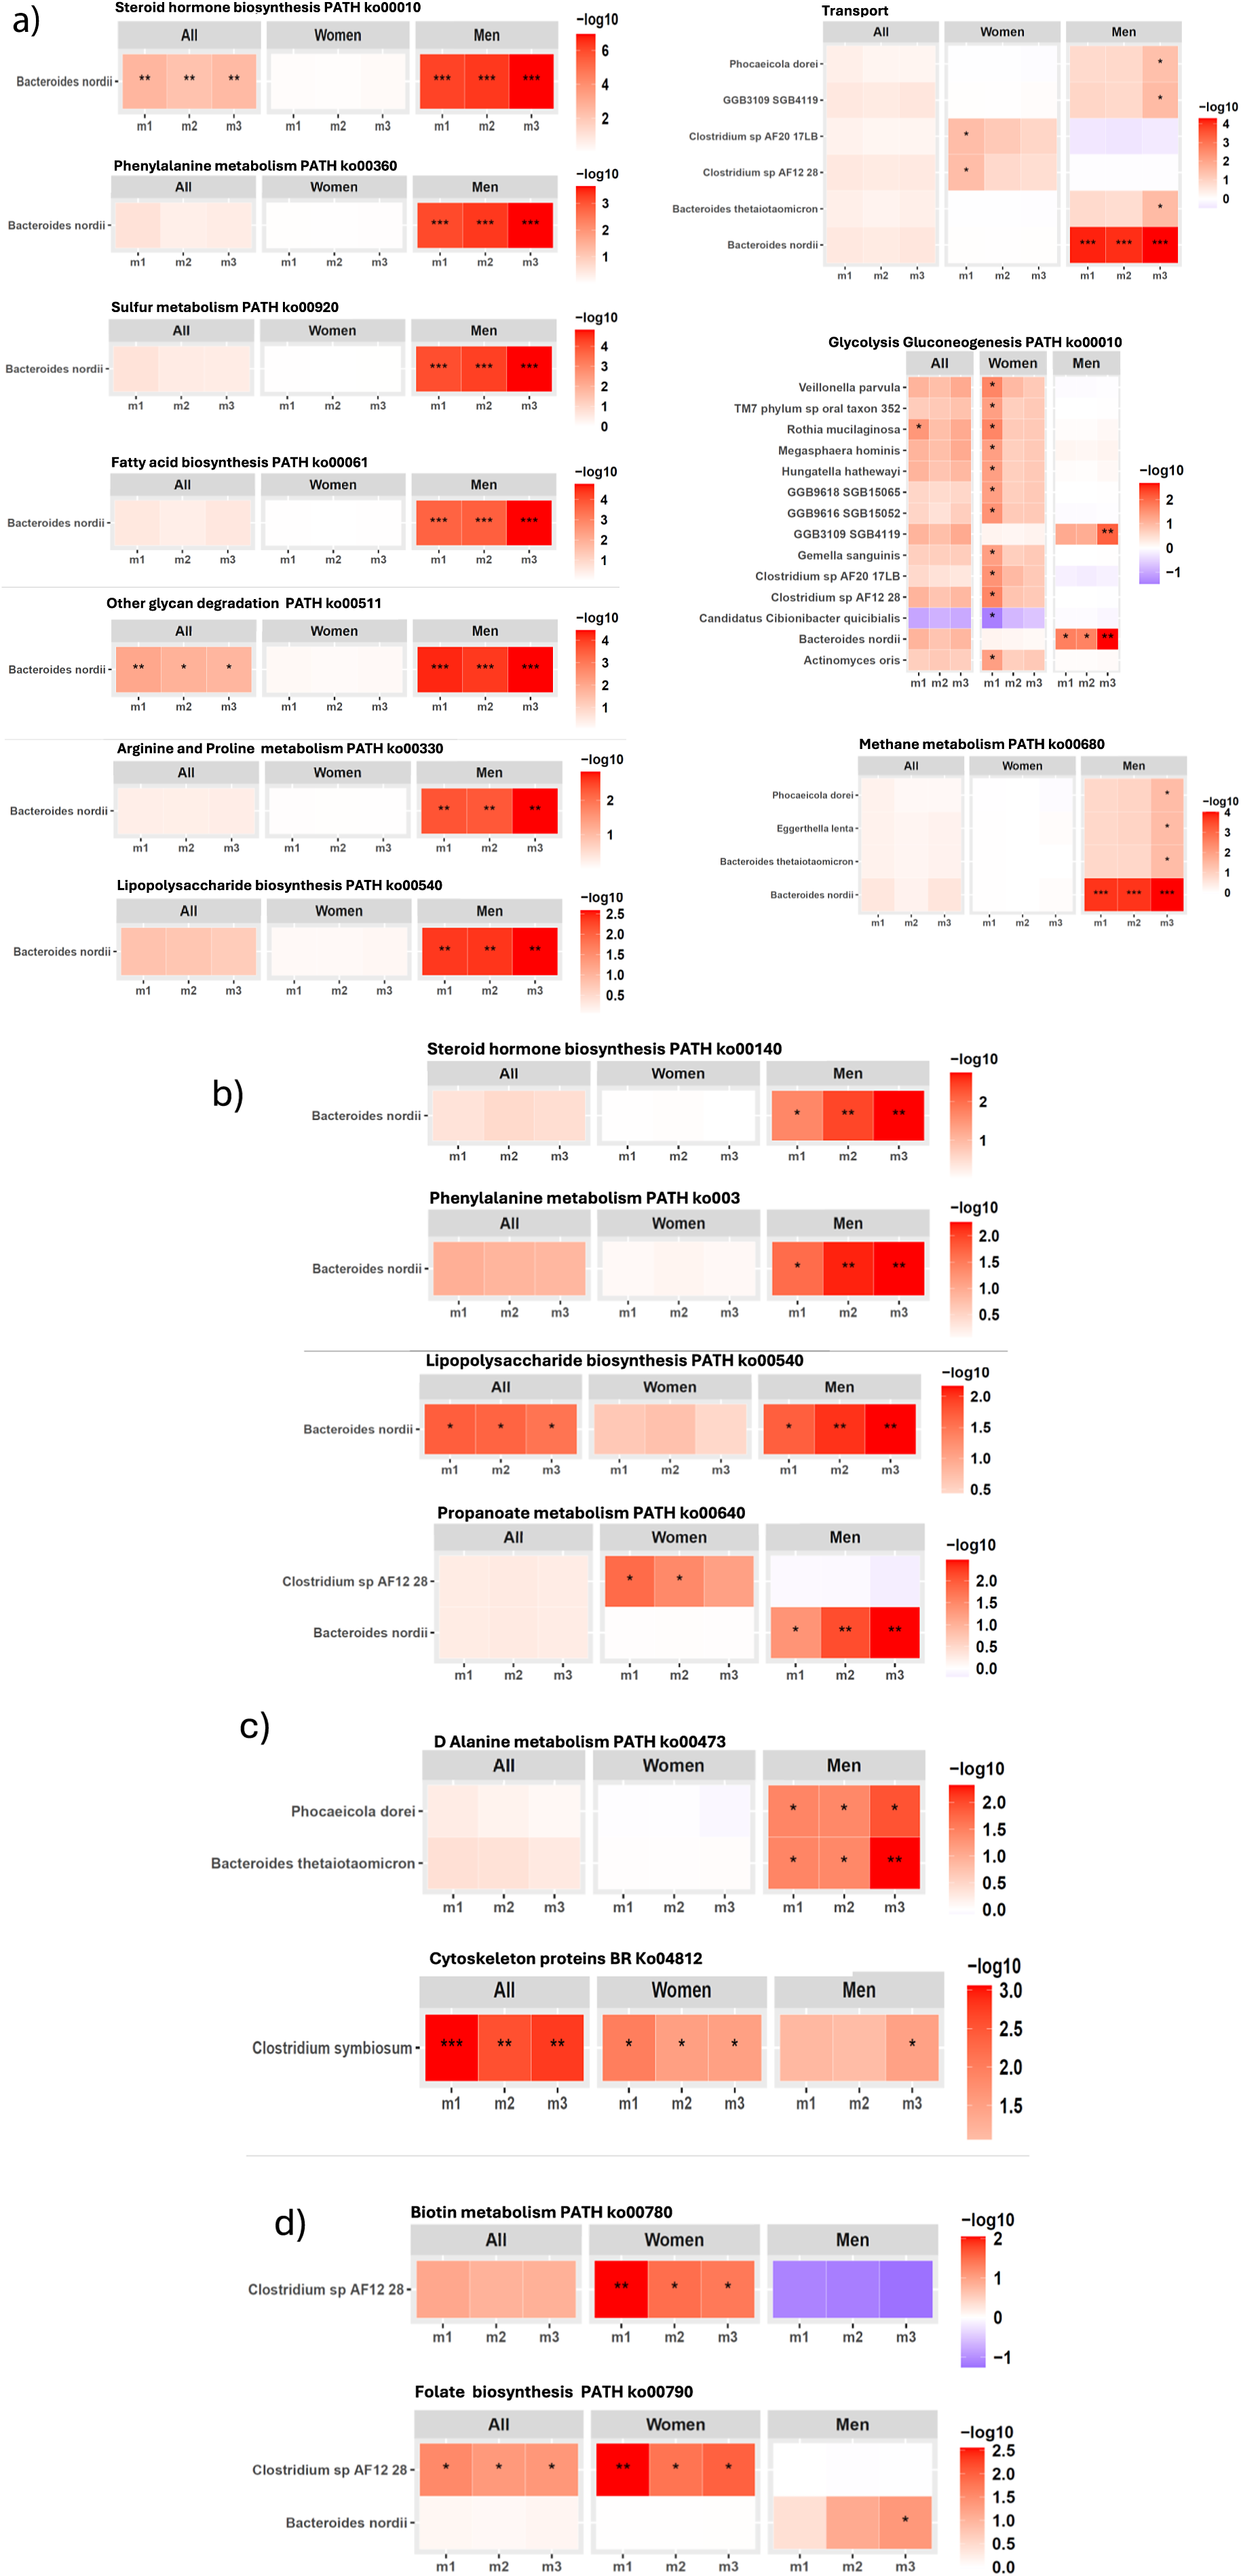
Next, we investigated which GM species contributed to the functional pathways that were found associated with SBP/DBP ARV across m1–m3 in our cohort (Figure 4; Supplementary Material Table S7, S8). In men, B. nordii-encoded gene families involved in several functional pathways, including steroid hormone biosynthesis, phenylalanine metabolism, sulphur metabolism, LPS biosynthesis, glycan degradation, fatty acid biosynthesis, glycolysis/gluconeogenesis, were significantly associated with SBP ARV across covariate-adjusted models after 5% FDR correction (Figure 4A; Supplementary Material Table S7). Additionally, B. nordii-encoded gene families of steroid hormone and LPS biosynthesis, and phenylalanine and propanoate metabolism were also significantly associated with DBP ARV in men after FDR correction (Figure 4B; Supplementary Material Table S8). Taken together with the robust positive association of B. nordii abundance with SBP ARV in men (Figure 2; Supplementary Material Table S5), B. nordii may provide a mechanistically driven therapeutic target to alleviate SBP/DBP variability, particularly in men.
Gut microbiome bacterial species contribution to the KEGG functional pathways associated with 24-hour SBP/DBP ARV in our cohort. Significant association between gene families of KEGG functional pathways encoded by B. nordii with (A) 24-hour SBP ARV, (B) 24-hour DBP ARV. (C–D) Significant association between gene families of KEGG functional pathways encoded by other bacterial species with (C) 24-hour SBP ARV (D) 24-hour DBP ARV, analysed through linear regression analysis after adjusting for confounding factors in three models (m) of covariate adjustment: m1, no covariate adjustment; m2: age, sex, and BMI; m3: m2 + 24-hour mean SBP or DBP, sleep latency, sodium intake based on spot urine analysis, and smoking status. False discovery rate (FDR) correction was applied separately for each sex and model subset using the Benjamini–Hochberg procedure at 5% FDR. The statistically significant q-values after FDR correction are indicated as *q < 0.05, **q < 0.01, and ***q < 0.001. Abbreviations: ARV, average real variability; BMI, body mass index; DBP, diastolic blood pressure; GM, gut microbiome; KEGG, Kyoto Encyclopedia of Genes and Genomes; SBP, systolic blood pressure.
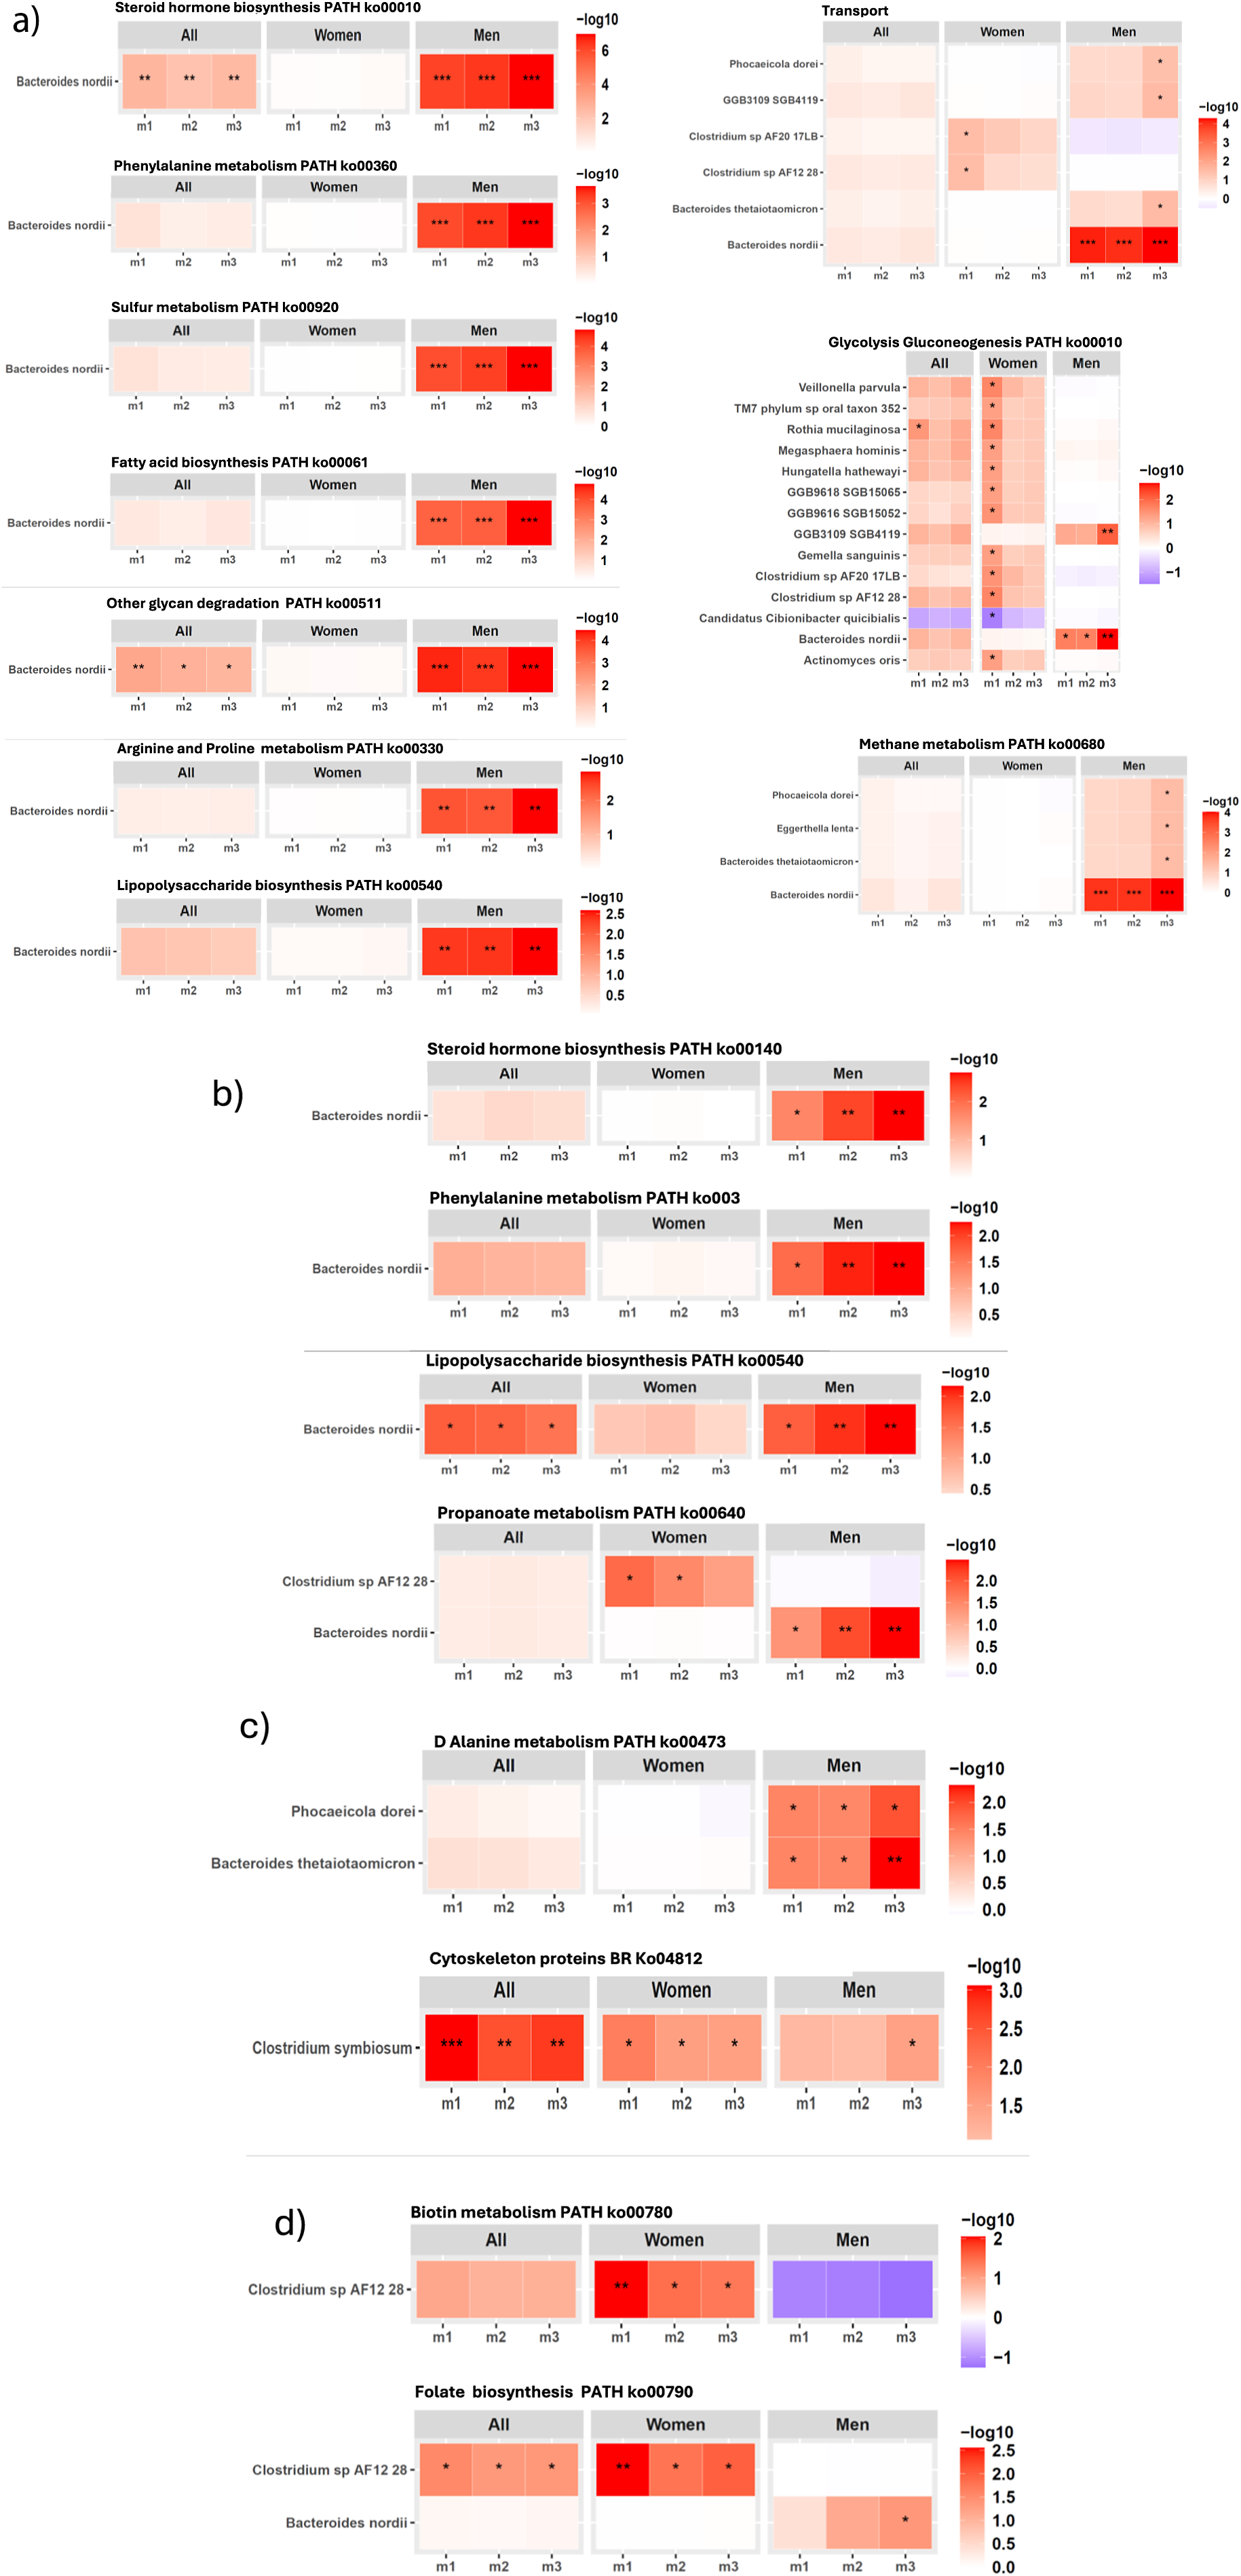
Figure 4. Long description
The layout consists of nine heatmap panels, each representing a metabolic pathway or function. For each panel, columns are divided into All, Women, and Men, with subcolumns m1, m2, m3. Rows represent either Bacteroides nordii or a list of microbes. Color intensity ranges from white to red (or purple for negative values in Glycolysis Gluconeogenesis), corresponding to log 10 values shown in the scale bar to the right of each panel. In the top left, Steroid hormone biosynthesis shows significant enrichment (darker red, up to log 10 of 6) for Men, especially in m1 and m2, with asterisks marking significance. Phenylalanine metabolism, Sulfur metabolism, Fatty acid biosynthesis, Other glycan degradation, Arginine and Proline metabolism, and Lipopolysaccharide biosynthesis all show stronger enrichment in Men, with varying log 10 values and significance. The Transport panel (top right) includes five microbes, with Bacteroides nordii showing the highest enrichment in Men, m1 and m2. Glycolysis Gluconeogenesis (middle right) includes 12 microbes, with Clostridium sp AF21 28 showing a negative log 10 value (purple) in Men, m2, while other microbes show moderate enrichment in Women and Men. Methane metabolism (bottom right) shows Bacteroides nordii with strong enrichment in Men, m1 and m2. Across all panels, Men generally show higher pathway enrichment, especially for Bacteroides nordii, as indicated by darker red cells and multiple asterisks.
Other notable bacterial species contributing to KEGG functional pathways significantly associated with SBP ARV in men included a significant positive association of SBP ARV with D-alanine metabolism gene families encoded by Phocaeicola dorei and Bacteroides thetaiotamicron (Figure 4C, top panel; Supplementary Material Table S7). In women, cytoskeleton gene families encoded by C. symbiosum had a significant positive association with SBP ARV (Figure 4C, bottom panel; Supplementary Material Table S7), while biotin metabolism and folate biosynthesis gene families encoded by Clostridium sp. AF12 28 were significantly associated with DBP ARV after 5% FDR correction across covariate-adjusted models (Figure 4D; Supplementary Material Table S8).
Discussion
In the present cross-sectional study, we report previously unexplored GM associations with 24-hour BP ARV, which captures rapid BP changes, providing a closer reflection of true short-term variability and superior prediction of CVD risk compared to SD-based measurements (Mena et al., Reference Mena, Pintos, Queipo, Aizpurua, Maestre and Sulbaran2005; Mena et al., Reference Mena, Felix, Melgarejo and Maestre2017). Given that only two prior clinical studies have linked GM to 24-hour BP variability using SD (Dinakis et al., Reference Dinakis, Nakai, Gill, Ribeiro, Yiallourou, Sata, Muir, Carrington, Head, Kaye and Marques2022; Lin et al., Reference Lin, Sayols-Baixeras, Baldanzi, Dekkers, Hammar, Nguyen, Nielsen, Eklund, Varotsis, Holm, Nielsen, Lind, Bergstrom, Smith, Engstrom, Arnlov, Sundstrom, Orho-Melander and Fall2025), which is considered a suboptimal metric to assess short term BP variability (Mena et al., Reference Mena, Pintos, Queipo, Aizpurua, Maestre and Sulbaran2005; Mena et al., Reference Mena, Felix, Melgarejo and Maestre2017), our findings of GM association with a more reliable short-term BP variability metric, ARV, address a key research gap. Furthermore, we conducted sex-stratified analyses and adjusted for key variables, including sleep parameters and mean BP, which can significantly impact 24-hour BP variability (Liu et al., Reference Liu, Yan, Bullock, Barksdale and Logan2021), thereby addressing additional gaps in the literature. GM exhibits circadian rhythmicity over 24 hours, and sex may modulate these GM circadian oscillations (Munyoki, Reference Munyoki, Goff, Kolobaric, Long, Mullett, Burns, Jenkins, DePoy, Wendell, McClung, Morrison and Jašarevic2023). We were the first to report sex differences in GM associations with hypertension (Virwani et al., Reference Virwani, Qian, Hsu, Pijarnvanit, Cheung, Chow, Tang, Tse, Xian, Lam, Lee, Lo, Liu, Ho, Chow, Leung, Tsang, Lo, Tung, Chung, Yuen, Leung, Ip, Hung, Louie, el-Nezami, Ho and Lau2023). Subsequently, a growing body of recent studies is documenting significant sex differences in relationships of GM with hypertension and other CVD risk factors influencing BP (Salvado et al., Reference Salvado, Lugones-Sanchez, Santos-Minguez, Gonzalez-Sanchez, Quesada, Benito, Rodriguez-Sanchez, Gomez-Marcos, Guimaraes-Cunha, Hernandez-Rivas, Mira, Garcia-Ortiz and Mivas2025; Fu et al., Reference Fu, Bu, Aimaier, Yang, Bao and Wulasihan2025; Wang et al., Reference Wang, Yao, Yan, Wang, Wang, Liu, Hu, Dong and Li2026), underscoring the importance of sex as a key determinant of GM associations with BP. This study uncovers sex differences in the association between GM and SBP/DBP variability, contributing to the growing body of evidence on plausible sex-linked associations between GM and BP regulation.
Reduced α-diversity is a marker of GM dysbiosis and has been associated with CVD (Masenga et al., Reference Masenga, Hamooya, Hangoma, Hayumbu, Ertuglu, Ishimwe, Rahman, Saleem, Laffer, Elijovich and Kirabo2022). In our cohort, GM α-diversity showed a significant inverse association with SBP ARV. Similar inverse associations between GM α-diversity and 24-hour BP variability (DBP SD) were reported in the Swedish SCAPIS cohort (Lin et al., Reference Lin, Sayols-Baixeras, Baldanzi, Dekkers, Hammar, Nguyen, Nielsen, Eklund, Varotsis, Holm, Nielsen, Lind, Bergstrom, Smith, Engstrom, Arnlov, Sundstrom, Orho-Melander and Fall2025), suggesting that higher 24-hour BP variability may be associated with lower microbial α-diversity across ethnicities. However, sex-stratified analysis in our cohort suggested that within-individual microbial richness or evenness (α-diversity) may relate to 24-hour SBP variability risk more in women, and between-individual differences in β-diversity in GM community composition may drive increased SBP variability risk more in men, potentially due to sex-specific host–microbiome interactions or hormonal influences.
In the full cohort and sex-stratified analyses, shotgun metagenomic sequencing uncovered several bacterial species significantly associated with SBP/DBP ARV in unadjusted analyses, with persisted significance after adjustment for confounders in models M2 and M3. Although most species did not retain significance after 5% FDR correction, the robust negative association of Parabacteroides merdae (Qiao et al., Reference Qiao, Liu, Sun, Wang, Dai, Wang, Bao, Li, Wang, Liu and Liu2022), Coprococcus comes (Notting et al., Reference Notting, Pirovano, Sybesma and Kort2023), and Bifidobacterium psudocatenulatum (Li et al., Reference Li, Yang, Xu, Bian, Shi, Wu and Li2026) with SBP/DBP ARV across all models is noteworthy given they are known SCFA producers with potential cardioprotective and metabolic health benefits (Qiao et al., Reference Qiao, Liu, Sun, Wang, Dai, Wang, Bao, Li, Wang, Liu and Liu2022; Notting et al., Reference Notting, Pirovano, Sybesma and Kort2023; Li et al., Reference Li, Yang, Xu, Bian, Shi, Wu and Li2026), and positive association of Haemophilus influenza (MacAlasdair et al., Reference MacAlasdair, Pontinen, Ling, Mallawaarachchi, Thaipadungpanit, Nosten, Turner, Bentley, Croucher, Turner and Corander2025), C. symbiosum (Ren et al., Reference Ren, Zhuang, Xie, Yang, Xia, Xie, Liu, Kang, Leng, Lu, Zhang, Chen, Xu, Zhao, Wang, Wang, Cui, Tan, Liu, Liu, Sun, Wang, Dai, Wang, Bao, Li, Wang, Liu, Liu and Fang2024), and C. spiroforme (Wang et al., Reference Wang, Guo and Xu2021) due to their pathogenic roles (Wang et al., Reference Wang, Guo and Xu2021; Ren et al., Reference Ren, Zhuang, Xie, Yang, Xia, Xie, Liu, Kang, Leng, Lu, Zhang, Chen, Xu, Zhao, Wang, Wang, Cui, Tan, Liu, Liu, Sun, Wang, Dai, Wang, Bao, Li, Wang, Liu, Liu and Fang2024; MacAlasdair et al., Reference MacAlasdair, Pontinen, Ling, Mallawaarachchi, Thaipadungpanit, Nosten, Turner, Bentley, Croucher, Turner and Corander2025). Oscillibacter sp. ER4 was the top species negatively associated with SBP ARV in the full cohort, and B. nordii was the top species positively associated with SBP ARV in men, after covariate adjustment (m3) and FDR correction.
Our results are consistent with recent findings of a significant negative association between an Oscillospiraceae species, ER4 sp.900317525, and SBP variability in mixed-sex analyses of the SCAPIS Swedish cohort (Lin et al., Reference Lin, Sayols-Baixeras, Baldanzi, Dekkers, Hammar, Nguyen, Nielsen, Eklund, Varotsis, Holm, Nielsen, Lind, Bergstrom, Smith, Engstrom, Arnlov, Sundstrom, Orho-Melander and Fall2025). Oscillibacter sp. ER4 was recently shown to have an inverse association with chronic liver histological damage (Wang et al., Reference Wang, Wu, Ni, Xie, Shen, Chen, Ma, Yao, Wang, Xu, Xiang, Zhao, Chen and Li2025), implying potential protective effects. Furthermore, Oscillibacter abundance has been strongly associated with lower cholesterol and reduced CVD risk (Li et al., Reference Li, Strazar, Mohamed, Pacheco, Walker, Lebar, Zhao, Lockart, Dame, Thurimella, Jeanfavre, Brown, Ang, Berdy, Sergio, Invernizzi, Tinoco, Pishchany, Vasan, Balskus, Huttenhower, Vlamakis, Clish, Shaw, Plichta and Xavier2024). In contrast, B. nordii is an opportunistic pathogen reported to be enriched in Covid19 patients (Zuo et al., Reference Zuo, Zhang, Lui, Yeoh, Li, Zhan, Wan, Chung, Cheung, Chen, Lai, Chen, Tso, Fung, Chan, Ling, Joynt, Hui and Chan2020; Bredon et al., Reference Bredon, Hausfater, Khalki, Tijani, Cheikh, Brot, Creusot, Rolhion, Trottein, Lambeau, Georgin-Lavialle, Bleibtreu, Baudel, Lefevre, Emond, Tubach, Simon-Tillaux, Simon, Gorochov, Zaid and Sokol2025) and advanced colorectal cancer (Chen et al., Reference Chen, Li, Tang, Jin and Yan2025). Notably, sex-stratified analyses in our cohort showed that Oscillibacter sp. ER4 association with SBP ARV were driven by women, whereas B. nordii was found to be strongly associated with SBP ARV only in men. Taken together, Oscillibacter sp. ER4 and B. nordii may influence SBP variability via distinct mechanisms in men and women. Analysis of functional β-diversity showed a significant association with both SBP/DBP ARV across statistical models only in men. Consistently, multiple KEGG functional pathways were predominantly associated with SBP/DBP ARV in men. Most noteworthy, the steroid hormone biosynthesis pathway, and 3-oxo-5-alpha-steroid 4-dehydrogenase 1 and arylsulfatase enzymes within this pathway were significantly associated with SBP ARV after FDR correction in covariate-adjusted models in men. An in vivo study demonstrated that GM mediated high-salt-diet-induced kidney injury by upregulating the steroid hormone biosynthesis pathway (Liu et al., Reference Liu, Xie, Yu, Wang, Bai, Zhu, Niu, Chen, Xiao, Wei and Zhang2025). Although understudied, recent work is increasingly focusing on elucidating the roles of GM steroid metabolism enzymes that may impact various health outcomes (Arp et al., Reference Arp, Jiang, Dufault-Thompson, Levy, Zhong, Wassan, Grant, Li, Hall and Jiang2025). Taken together, these results imply a potential microbiome-driven mechanism for increased SBP variability via steroid hormone biosynthesis in men.
To gain further mechanistic insights into the role of GM in mediating SBP/DBP variability, we investigated which bacterial species encoded the genes in the pathways that were significantly associated with SBP/DBP variability in our cohort. Interestingly, steroid hormone biosynthesis and several other functional pathways, including phenylalanine and sulphur metabolism, glycan degradation, LPS, and fatty acid biosynthesis gene families solely encoded by B nordii, had a significant positive association with SBP/DBP ARV after FDR correction across unadjusted and covariate-adjusted models. The GM sulfur metabolism converts dietary sulphur compounds into hydrogen sulfide (Moon et al., Reference Moon, Kye, Ko and Yoo2023), a signalling molecule that promotes intestinal inflammation and epithelial damage and is strongly linked to colorectal cancer and inflammatory bowel disease, while the phenylalanine metabolic pathway processes dietary phenylalanine into precursors of phenylacetylglutamine (Krishnamoorthy et al., Reference Krishnamoorthy, Kalyan, Hediyal, Anand, Kendaganna, Pendyala, Yelamanchili, Yang, Chidambaram, Sakharkar and Mahalakshmi2024), a metabolite strongly associated with atherosclerotic CVD. LPS biosynthesis in gut bacteria yields endotoxin (An et al., Reference An, Wirth, Koch, Schirren, Drefs, Koliogiannis, Niess, Andrassy, Guba, Bazhin, Werner and Kuhn2022), a key Gram-negative membrane component that is well-known to promote chronic inflammation and insulin resistance upon systemic translocation. Upregulation of LPS biosynthesis pathways has been reported in hypertension (Guo et al., Reference Guo, Li, Wang and Yu2021), suggesting GM-derived LPS may contribute to systemic inflammation underlying hypertension. Additionally, upregulation of glycan degradation genes by GM may promote pathogenic mechanisms by breaking down host mucosal glycans, degrading the protective mucus barrier, fuelling inflammation, and metabolic dysregulation (Sun et al., Reference Sun, Shen, Li, Guo, Zhu, Zuo, Zhao, Gu, Gong and Li2016). Although B. nordii is a relatively less abundant Bacteroides species (Zhang et al., Reference Zhang, Cole, Coyne, Lin, Dylla, Smith, Waligurski, Ramaswamy, Woodson, Burgo, Little, Moran, Rose, McMillin, McSpadden, Sundararajan, Sidebottom, Pamer and Comstock2024), our results indicate that it is functionally active and may significantly impact SBP/DBP variability by contributing to several pathogenic mechanisms of GM, particularly in men.
We acknowledge that the present study also has several limitations. First, our results are based on cross-sectional analysis, so causality cannot be inferred from our results and conclusions. Second, our sample size is relatively small and needs to be validated in larger cohorts. Third, we used a single-ethnicity cohort; therefore, external validation in multiethnic populations is required to ensure generalizability. We estimated sodium intake from spot urine analyses, which are subject to substantial analytical and biological bias compared with 24-hour urine collection (Santos et al., Reference Santos, Li, Huang, McLean, Petersen, Di Tanna and Webster2020). Additionally, the present study lacks analysis of other microbial kingdoms, including fungi, viruses, and archaea, which can be identified using shotgun sequencing data and may contribute to GM-mediated BP (Han et al., Reference Han, Yang, Zhong and Ning2018). Although faecal metagenomics is the most widely adopted approach for studying gut microbiota and offers a broad view of the microbial community, it inadequately represents species in different segments of the gut and the small intestine (Leite et al., Reference Leite, Weitsman, Parodi, Celly, Sedighi, Sanchez, Morales, Villanueva-Millan, Barlow, Mathur, Lo, Jamil, Paski, Rezaie and Pimentel2020). Finally, the sex-specific microbial associations observed in our study may partly reflect baseline physiological and metabolic dimorphisms between men and women rather than direct biological interactions with blood pressure pathways. Despite these limitations, we have addressed several research gaps in the field by employing deep sequencing techniques to investigate previously unexplored GM relationship with 24-hour BP ARV, which is a more reliable index of short-term BP variability, while adjusting for key confounding factors including sleep latency and mean 24-hour BP, thus providing robust evidence for association between GM and 24-hour BP variability and differences in these associations between men and women.
In summary, sex-stratified analyses showed minimal overlap of GM composition and functions associated with SBP/DBP variability between men and women. Stratifying by sex in our analyses revealed GM associations that were obscured in unstratified analyses, supporting exploration of sex-dimorphic GM effects on BP in future mechanistic and interventional studies. Most notably, our results indicate B. nordii may impact SBP/DBP variability via pro-pathogenic metabolites produced by GM-mediated LPS, steroid, phenylalanine, and sulphur metabolism pathways, warranting further investigation for its causal role.
Supplementary material
The supplementary material for this article can be found at http://doi.org/10.1017/gmb.2026.10026.
Data availability statement
All of the processed GM species abundance data and clinical metadata, the scripts for data processing and generating figures have been deposited in an HKU GitHub repository, which can be accessed using the following link: https://github.com/holab-hku/bp_variability_study. Raw data are available from the corresponding author upon reasonable request.
Acknowledgements
The authors would like to gratefully acknowledge Dr. Ruby Szeto, Dr. Isabelle Ngai, Dr. Carmen Ho, Dr. Cecilia Cheuk, Mr. Brian Shum, Mr. Sean Wong, Mr. Jacky Yueh, Mr. Jacky Wong, Mr. James Ng, and Mr. Chapman for their assistance in data collection of this cohort. The authors would like to thank Dr. Yuen Kwun Wong for her assistance in ABPM data quality control. The authors would also like to thank the Genomics Core of the Centre for PanorOmic Sciences (CPOS), The University of Hong Kong, for providing sample processing and metagenomic sequencing services.
Author contribution
Conceptualization: K.K.L., J.W.K.H., and P.D.V. Methodology: K.K.L., J.W.K.H., P.D.V., and G.Q. Formal analysis: P.D.V. and G.Q. Data curation: M.S.S.H., T.K.K.T.S.P., C.N.M.C., Y.H.C., L.K.T., Y.H.T., J.W.X., S.S.W.L., R.K.C.L., P.D.V., C.P.I.L., C.C.W.L., T.L.H., and B.Y.C. Writing – original draft: P.D.V. and G.Q. Writing – review and editing: K.K.L., J.W.K.H., P.D.V., C.P.I.L., and G.Q. Supervision: K.K.L., K.C.T, J.W.K.H., H.E.N., S.Y.L., I.F.N.H., and M.F.Y. Funding acquisition: K.K.L., J.W.K.H and S.Y.L.
Funding
This work was supported in part by the Croucher Foundation, the Hong Kong Jockey Club Charities Trust, and AIR@InnoHK, administered by the Innovation and Technology Commission.
Disclosure statement
KKL received grants from the Research Fund Secretariat of the Food and Health Bureau, Innovation and Technology Bureau, Research Grants Council, Amgen, Boehringer Ingelheim, Eisai, and Pfizer; and consultation fees from Amgen, Boehringer Ingelheim, Daiichi Sankyo, and Sanofi, all outside the submitted work. SYL has received research sponsorship from Pfizer, Merck, Servier, and Curegenix, all outside the submitted work.


 Open access

