

Ultra-processed foods are rapidly dominating the global food system( Reference Monteiro, Moubarac and Cannon 1 ). These products are formulated and manufactured industrially employing processes and ingredients not commonly used in traditional culinary preparations( Reference Monteiro, Cannon and Levy 2 ). Studies from Canada, Brazil and the USA describe these products as being high in energy density and high in free/added sugars content, with low fibre and micronutrient densities, compared with unprocessed or minimally processed foods (even when the latter are combined with salt, sugar or fat used as culinary ingredients)( Reference Moubarac, Batal and Louzada 3 – Reference Martínez Steele, Popkin and Swinburn 6 ). Cross-sectional and cohort studies have shown significant positive associations between ultra-processed food consumption and obesity( Reference Canella, Levy and Martins 7 – Reference Mendonça, Pimenta and Gea 9 ) and other diet-related non-communicable diseases( Reference Monteiro, Levy and Claro 10 – Reference Mendonça, Lopes and Pimenta 13 ).
Several reports have concluded that a high intake of added sugars increases the risk of weight gain( 14 – Reference Vos, Kaar and Welsh 17 ), excess body weight( 16 ), obesity( 16 – 18 ), type 2 diabetes mellitus( 16 , 18 ), higher serum TAG( Reference Johnson, Appel and Brands 15 – Reference Vos, Kaar and Welsh 17 , Reference Kell, Cardel and Bohan Brown 19 ), dyslipidaemia( Reference Vos, Kaar and Welsh 17 ), high blood cholesterol( 18 ), higher blood pressure( Reference Johnson, Appel and Brands 15 , Reference Vos, Kaar and Welsh 17 – Reference Kell, Cardel and Bohan Brown 19 ), hypertension( Reference Kell, Cardel and Bohan Brown 16 ), stroke( 16 , 18 ), CHD( 16 , 18 ), cancer( 16 ) and dental caries( 14 – 16 , 18 ). In fact, the WHO guidelines recommend limiting free sugars intake to less than 10 % of total energy intake to prevent excess body weight and dental caries, and to less than 5 % for additional health benefits( 14 ). Free sugars include sugars added to foods by the manufacturer, cook and consumer, plus sugars naturally present in honey, syrups and fruit juices( Reference Cummings and Stephen 20 ). A recent report using nationally representative dietary data from the USA (population aged >1 year) showed a strong association between the consumption of ultra-processed foods and the intake of added sugars, suggesting the need to limit consumption of ultra-processed foods as an effective way of reducing excessive intake of added sugars( Reference Martínez Steele, Baraldi and Louzada 21 ). Yet, these estimates are a ‘conservative’ way to assess compliance with WHO dietary goals as added sugars include sugars added to foods or beverages during processing, preparation or at the table, but exclude naturally occurring sugars in fruit juices( 22 ).
In Chile, a study based on data collected by a national household food budget survey undertaken in 2006–2007 showed that ultra-processed foods and free sugars represented 52·8 and 16·1 % of total purchased energy, respectively, but no analyses of the association between these two variables were performed( Reference Crovetto, Uauy and Martins 23 ). Information on the intake of ultra-processed foods and added sugars and on the association between these two variables is particularly relevant in Chile, given the large-scale food policies being implemented in this country such as an increase in taxation of sugar-sweetened beverages and the law regulating food labelling and advertising( Reference Corvalán, Reyes and Garmendia 24 ). To address this gap, we used intake data from the most recent national dietary survey undertaken in Chile to assess the consumption of ultra-processed foods and to analyse its association with the dietary content of added sugars.
Methods
Data source and sampling
The data were obtained from the National Dietary Survey (Encuesta Nacional de Consumo Alimentario, ENCA) performed between November 2010 and January 2011. The survey used probability sampling by clusters, with stratification and multiple lottery stages, allowing it to represent the Chilean population aged 2 years or above in urban and rural areas of every geographic region: North, Center, South, South (Austral) and Metropolitan. The survey response rate was 85·5 % for a total of 5753 individuals excluding pregnant women and individuals who showed signs of altered mental status. A final sample of 4920 individuals was studied( 25 ).
Dietary intake
All individuals were eligible for one 24 h dietary recall interview, conducted using the US Department of Agriculture (USDA) Automated Multiple-Pass Method( 26 ). For children under 12 years of age, an adult caregiver responded the interview. Adolescents aged between 13 and 18 years answered in the presence of the caregiver. Individuals provided information on quantities (using home measurements) and preparation methods of each consumed food item, assisted by a photographic ‘atlas’ of typical Chilean foods and recipes specifically designed for this survey. Each home measurement was converted to grams or millilitres using a standardized conversion table. All reported values (n 150 156) were double checked and inconsistencies were verified by telephone, resulting in no missing values( 25 ).
Food classification according to processing
Every reported food item was classified according to the extent and purpose of food processing, following the NOVA procedure( Reference Monteiro, Cannon and Levy 2 ). Food items were sorted into mutually exclusive food subgroups within: (i) unprocessed or minimally processed foods (eleven subgroups: e.g. fresh meat, roots and tubers, cereals, vegetables, legumes, fruits); (ii) processed culinary ingredients (four subgroups: e.g. plant oils, table sugar, animal fats); (iii) processed foods (five subgroups: e.g. unpackaged fresh bread, cheese, ham and salted meat, vegetables and fruits preserved in brine or sugar syrup); and (iv) ultra-processed foods (seventeen subgroups: e.g. carbonated soft drinks, sweet or savoury snacks, confectionery, industrial desserts, reconstituted meat products, shelf-stable or frozen meals, industrial packaged bread)( Reference Monteiro, Cannon and Levy 2 ). Details are displayed in Table 1.
Distribution of total energy intake and energy intake from added sugars according to NOVA food group, and mean content of added sugars of each food group, in the diet of the Chilean population aged 2 years or above (2010)Footnote *

To convert to kJ, multiply kcal value by 4·184.
* National Nutrition Examination Survey 2010, n 4920.
† Other unprocessed or minimally processed foods: chilli pepper, garlic, basil, cinnamon, cumin, curry, merken, chamomile, oregano, plain water, coffee, tea, mate, noodles and powdered milk.
‡ Other processed culinary ingredients: table salt, honey and vinegar.
§ Other processed foods: chilli paste, wine and beer.
║ Other ultra-processed foods: dehydrated soup, artificial sweeteners and distilled liqueurs.
Assessing total energy and added sugars intakes
Energy and total sugars contents of reported food items were calculated using the US Food Composition Table (USDA National Nutrient Database for Standard Reference Release 28)( 27 ). For each reported food item, a USDA food code was assigned, taking into account the nutritional information in the Chilean Food Composition Table( Reference Jury, Urteaga and Taibo 28 ) and in the Nutrient Fact Panels obtained from Chilean packaged foods (80–120 % agreement in macronutrient and energy contents was required in order to assign a food code). Data on added sugars per food code were obtained by merging the USDA database on added sugars (Food Patterns Equivalents Database 2009–2010)( 22 ). For Chilean food items not found in the USDA database, added sugars were calculated using the algorithm proposed by the nutrient profile model launched by the Pan American Health Organization( 29 ).
Data analysis
First, we described the contribution of each of the NOVA groups and subgroups to total energy intake and to total added sugars intake for the overall sample. Thereafter, we analysed the average energy contribution of ultra-processed foods according to sociodemographic variables, namely sex, age group (2–19, 20–49, 50–46, ≥65 years), geographic region (North, Center, South, South (Austral) and Metropolitan), urban or rural setting, family income (1, 2, 3–5, ≥6 minimum wages) and years of schooling of the head of the family (≤8, 9–11, ≥12 years), using unadjusted and adjusted Gaussian regression analyses. For ordinal sociodemographic variables (age group, family income, years of schooling), tests of linear trend were performed. For categorical variables (sex, geographic region, urban or rural) and ordinal variables with no statistically significant linear trend, Wald tests were used to identify significant differences between categories. Gaussian regression analyses were also used to estimate the association between the dietary contribution of ultra-processed foods and the dietary content of added sugars (both as proportions of total energy intake). The dietary share of ultra-processed foods was transformed using restricted cubic spline functions with knots at 5th, 27·5th, 50th, 72·5th and 95th percentiles, to allow for non-linearity (the Wald test was used to assess non-linearity). We used Poisson regression models to analyse the proportion of individuals consuming more than 5 % and more than 10 % of total energy from added sugars( 14 , Reference Mann, Cummings and Englyst 30 ) across quintiles of the dietary share of ultra-processed foods. We also repeated these analyses stratifying by age group. Regression models evaluating the association between ultra-processed foods and added sugars were adjusted for sociodemographic variables associated with dietary intake of ultra-processed foods. Tests of linear trend were performed to evaluate the effect of quintiles as a single continuous variable. The ENCA sample weights were used in all analyses( 25 ). The Taylor series linearization variance approximation procedure was used for variance estimation in all analyses, in order to account for the complex sample design and the sample weights. Data were analysed using the statistical software package Stata version 14.
Results
Distribution of total energy intake by food group
The mean per capita daily energy intake among Chileans aged 2 years or above was 7611 kJ (1819 kcal). One-third (33·8 %) of the total energy intake came from unprocessed or minimally processed foods and 11·0 % came from processed culinary ingredients. The remaining energy was nearly equally distributed between processed foods (26·6 %) and ultra-processed foods (28·6 %; Table 1). Within unprocessed or minimally processed foods, meat was the leading contributor (7·3 % of total energy), followed by roots and tubers, cereals, vegetables, legumes and fruits (each subgroup contributing more than 2 % of total energy intake). Among processed culinary ingredients, plant oils (6·1 %) and table sugar (4·0 %) were the most consumed; while within processed foods, fresh bread provided the largest contribution to total energy intake (22·0 %). Among ultra-processed foods energy came from a diverse range of products (seventeen subgroups), led by carbonated soft drinks; cakes, cookies and pies; sauces, dressings and gravies; reconstituted meats; ‘milk’-based drinks; ‘fruit’ drinks/sweetened ‘waters’; and salty snacks, each one contributing more than 2·0 % of total energy.
Distribution of energy intake from added sugars by food groups
The mean per capita daily intake of energy from added sugars was 1017 kJ (243·0 kcal) or 13·2 % of total energy intake (Table 1). The group of ultra-processed foods contributed more than half of total added sugars consumption (58·6 %) mainly through soft drinks (24·1 %), fruit and water drinks (8·8 %) and cakes, cookies and pies (7·3 %). Processed culinary ingredients contributed 33·6 % of the total added sugars intake, mainly through table sugar consumed as part of home-made drinks, desserts or other preparations. A further 7·5 % of total added sugars came from processed foods, mainly from fresh bread (6·3 %).
Intake of ultra-processed foods according to sociodemographic variables
As shown in Table 2, individuals who were younger, living in urban areas, residing in the metropolitan region and with a higher income presented a significantly higher intake of ultra-processed foods, in both unadjusted and adjusted models. A significant inverse linear trend was observed between age and ultra-processed food consumption, while a significant positive linear trend was observed between family income and consumption of ultra-processed foods. Even though an increased intake of ultra-processed foods was observed among females and heads of families with higher schooling, differences were not statistically significant.
Dietary share of ultra-processed foods according to sociodemographic variables in the diet of the Chilean population aged 2 years or above (2010)Footnote *
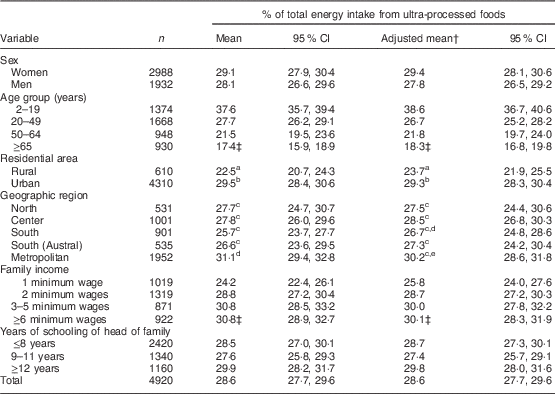
a,bMean values within the residential area (a, b) or geographic region (c–e) column with unlike superscript letters were significantly different (P<0·05).
* National Nutrition Examination Survey 2010, n 4920.
† Performed with a multiple linear regression model, averaging or otherwise integrating over the covariates (remaining variables in the table).
‡ P≤0·001 for linear trend.
Crude and adjusted associations between dietary share of ultra-processed foods and added sugars intake
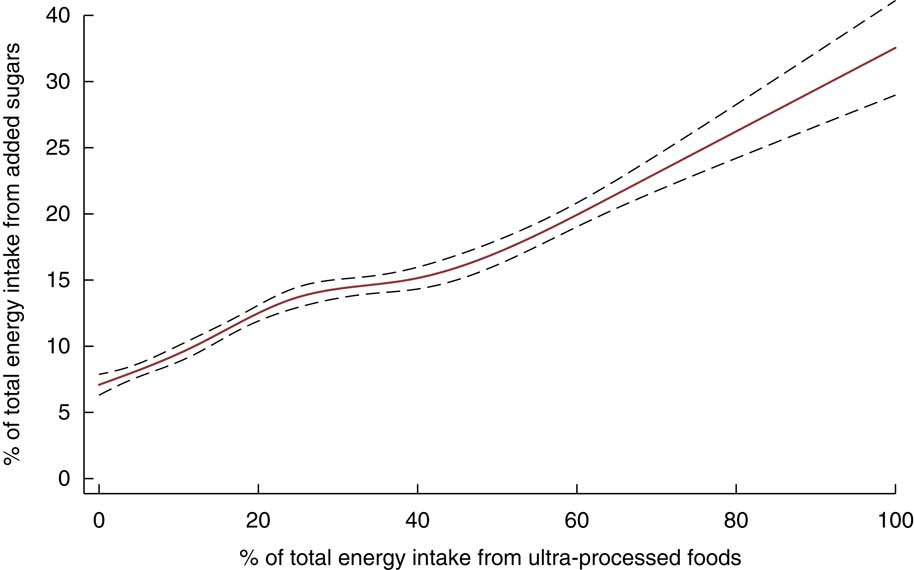
In unadjusted restricted cubic spline Gaussian regression analysis, a direct linear association was found between the dietary share of ultra-processed foods and the dietary content of added sugars (coefficient for linear term=0·22; 95 % CI 0·08, 0·34; Wald test for linear term, P=0·001; Wald test for all non-linear terms, P=0·07; Fig. 1). The linear association remained fairly unchanged after adjusting for several potential sociodemographic confounders: age, urban or rural setting, geographic region and family income (coefficient for linear term=0·20; 95 % CI 0·07, 0·34). Thus, a 5 percentage point increase in the dietary share of ultra-processed foods determined a 1 percentage point increase in the dietary content of added sugars. As shown in Table 3, the dietary content of added sugars increased significantly from 7·7 % in the lowest quintile of the energy contribution of ultra-processed foods to 19·7 % in the highest quintile. After adjusting for potential sociodemographic confounders, individuals in the highest quintile of dietary share of ultra-processed foods had 50 % greater probability of exceeding the 5 % added sugars cut-off compared with those individuals in the lowest quintile (adjusted prevalence ratio=1·5; 95 % CI 1·4, 1·6). Similarly, those individuals in the highest quintile of dietary share of ultra-processed foods were three times more likely to exceed the 10 % cut-off compared with those individuals in the lowest quintile (adjusted prevalence ratio=2·9; 95 % CI 2·4, 3·4; Table 3).
Association between the dietary share of ultra-processed foods and the dietary content of added sugars in the diet of the Chilean population aged 2 years or above (2010)* determined by unadjusted restricted cubic spline Gaussian regression analysis (![]() , predicted value;
, predicted value; ![]() , 95 % CI). *National Nutrition Examination Survey 2010, n 4920
, 95 % CI). *National Nutrition Examination Survey 2010, n 4920
Indicators of the dietary content of added sugars according to the dietary contribution of ultra-processed foods in the diet of the Chilean population aged 2 years or above (2010)Footnote *
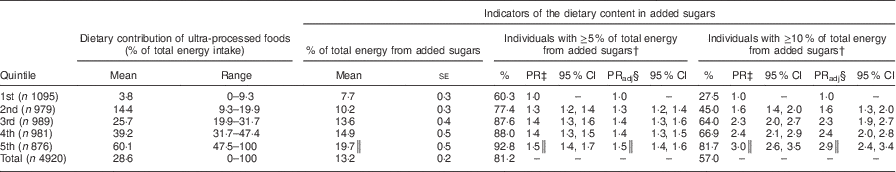
PR, prevalence ratio; PRadj, adjusted prevalence ratio.
* National Nutrition Examination Survey 2010 (n 4920).
† Cut-offs recommended for total energy intake from added sugars by WHO( 14 ).
‡ PR estimated using Poisson regression.
§ PR adjusted for age group (2–19, 20–49, 50–64, ≥65 years), residential area (urban and rural), geographic region (North, Center, South, South (Austral) and Metropolitan) and family income (1, 2, 3–5, ≥6 minimum wages).
║ P≤0·001 for linear trend.
Similar associations between the dietary contribution of ultra-processed foods and the dietary content of added sugars were seen in all age groups, being more pronounced among children and adolescents (see online supplementary material, Supplemental Tables 1 to 3). For instance, children and adolescents in the highest quintile of ultra-processed food consumption were four times more likely to exceed the 10 % added sugars cut-off than those in the lowest quintile (adjusted prevalence ratio=3·9; 95 % CI 2·7, 5·9). The same prevalence ratios were 2·7 (95 % CI 2·2, 3·3) among adults and 2·3 (95 % CI 1·8, 3·0) among the elderly.
Discussion
In the Chilean diet, ultra-processed foods provided 28·6 % of total energy intake and contributed more than half of total added sugars intake. A strong association was found between the consumption of these products and the dietary content of added sugars. After adjusting for several potential sociodemographic confounders, a 5 percentage point increase in the dietary share of ultra-processed foods determined a 1 percentage point increase in the dietary content of added sugars. The association between ultra-processed food consumption and the dietary content of added sugars was present in every age group, being more pronounced among children and adolescents.
The estimated dietary share of ultra-processed foods in Chile in 2010 was similar to that found in Mexico in 2012 (29·8 % of total energy intake; JA Marron, T Sánchez, ML et al., unpublished results), lower than those found in national surveys of industrialized countries such as the USA (57·9 %)( Reference Martínez Steele, Baraldi and Louzada 21 ) and Canada (47·7 %)( Reference Moubarac, Batal and Louzada 3 ), but greater than in Brazil (21·5 %)( Reference Louzada, Martins and Canella 4 ). A higher share of ultra-processed foods in Chile (52·8 % of total energy) was estimated for 2006–2007 by Crovetto et al.( Reference Crovetto, Uauy and Martins 23 ). Two differences may explain this discrepancy relative to our study: the origin of their estimate was based on household food purchasing data and the fact that all bread was classified as ultra-processed.
As in our study, recent evidence from the USA showed that a 5 percentage point increase in the dietary share of ultra-processed foods determined a 1 percentage point increase in the dietary content of added sugars( Reference Martínez Steele, Baraldi and Louzada 21 ). The US data also showed that the mean percentage of total energy intake from added sugars rose from 7·5 % in the lowest to 19·5 % in the highest quintiles of dietary share of ultra-processed foods( Reference Martínez Steele, Baraldi and Louzada 21 ). Similar results to our own were obtained by two studies quantifying free sugars. In Brazil( Reference Louzada, Martins and Canella 4 ), the mean percentage of total energy intake from free sugars increased from 10·9 % in the lowest to 20·2 % in the highest quintiles of dietary share of ultra-processed foods; while in Canada( Reference Moubarac, Batal and Louzada 3 ), free sugars increased from 7·7 to 19·4 % across these quintiles.
Our study showed that the content of added sugars in the Chilean diet (a total of 81·2 and 57·0 % of all individuals exceeded the 5 and 10 % WHO cut-offs, respectively) was closely associated with the consumption of ultra-processed food. Indeed, individuals with the highest consumption of ultra-processed foods (>47·5 % of energy intake) were three times more likely to exceed the 10 % cut-off compared with those having the lowest consumption (<9·3 % of energy intake). Even though ultra-processed food consumption was lower in Chile than in the USA for all quintiles, this prevalence ratio was exactly the same in both countries. Considering the evidence relating consumption of added sugars to risk of chronic diseases( 14 – Reference Kell, Cardel and Bohan Brown 19 ) and the current high prevalence of chronic disease-related risk factors in the Chilean population( Reference Araya, Padilla and Garmendia 31 , 32 ), these results have important implications for the public health agenda. This is especially true if we consider the rapid increase in the consumption of selected ultra-processed foods according to annual national food and drink sales data collected between 1999 and 2013( Reference Moubarac 8 ) and according to household food expenditure data collected in the Santiago metropolitan area between 1986 and 2007( Reference Crovetto and Uauy 33 ). Furthermore, our results support the regulations recently implemented by the Chilean Government to improve dietary quality, especially those targeting children and adolescents( Reference Corvalán, Reyes and Garmendia 24 , 34 ).
According to our study, almost 70 % of individuals in the lowest quintile of dietary share of ultra-processed foods met the <10 % cut-off for added sugars, even when the intake of table sugar as culinary ingredient in the Chilean population was comparatively high (33·5 % of total added sugars intake v. 8·7 % in the US population). This suggests that in Chile, promoting diets based on unprocessed or minimal processed foods, complemented with small amounts of processed culinary ingredients and processed foods (e.g. fresh bread), as recommended by recently launched food-based dietary guidelines in Brazil( 35 ) and Uruguay( 36 ), would help achieve the WHO added sugars recommendations( 14 ) and the FAO advice for food security( 37 ). Despite the cultural differences, this is also true in countries such as the USA where more than 70 % of individuals in the lowest quintile of dietary share of ultra-processed foods met the <10 % cut-off for added sugars( Reference Martínez Steele, Baraldi and Louzada 21 ).
The present study is not without limitations. Even though dietary data obtained by 24 h recalls are imperfect, electronic surveys and the multiple-pass method were used to prevent the interviewer from forgetting items frequently omitted by interviewees( 26 ). In addition, although information indicative of food processing such as place of meals or product brands was collected, these data were missing for some food items and thus may have led to errors in food classification. Since Chile does not have an updated Food Composition Table( Reference Jury, Urteaga and Taibo 28 ), the intakes of energy and total sugars were calculated using information from the US Food Composition Table (USDA National Nutrient Database for Standard Reference Release 28)( 27 ). For foods lacking information on added sugars, the algorithm proposed in the nutrient profile model launched by the Pan American Health Organization( 29 ) was used. Therefore, the consumption of ultra-processed foods or added sugars could be slightly under- or overestimated. Evidence suggests that some people may under-report consumption of foods with caloric sweetenersReference Bingham, Luben and Welch (38 – Reference Pryer, Vrijheid and Nichols 40 ). If so, this bias may lead to underestimation of the overall intake of added sugars or the dietary contribution of ultra-processed foods, but may less likely affect the association between these variables.
The present study has several strengths. It is based on a large, nationally representative sample of the Chilean population with data on individual consumption rather than on market or household purchases, which do not account for the fraction of wasted food. It is also the first study to examine the contribution of ultra-processed foods to total energy and added sugars intakes in the Chilean diet, providing updated and relevant results for informing the public health agenda. These may also serve as baseline results to measure the impact of a set of regulations being implemented by the Chilean Government aimed at improving diets( Reference Corvalán, Reyes and Garmendia 24 , 34 ).
Conclusions
We have documented that ultra-processed foods represent close to one-third of total energy intake and contribute more than half of total added sugars in the Chilean diet. Developing strategies to limit and decrease the consumption of ultra-processed foods is a potentially effective way to achieve WHO dietary recommendations on added sugars and to promote eating in accordance with food-based dietary guidance in Chile, especially for young children and adolescents.
Acknowledgements
Acknowledgements: The authors thank the Ministry of Health of Chile for supplying the database (Chilean National Dietary Survey, 2010) and the International Development Research Center for its support in obtaining information from Nutrient Fact Panels from packaged foods in 2015. Financial support: The analyses were supported by the Fundaçâo de Amparo à Pesquisa do Estado de São Paulo (FAPESP). G.C. is a beneficiary of a Postdoctoral Fellowship from FAPESP (grant number 2016/13522-3). FAPESP had no role in the design, analysis or writing of this article. Conflict of interest: The authors declare no conflict of interest. Authorship: C.A.M., M.R. and G.C. designed the research. G.C., M.L.d.C.L. and E.M.S. took care of data management and analyses. G.C., M.R., C.C. and R.U. interpreted the data. G.C. and M.R. wrote the first draft of the manuscript. All authors read, edited and approved the final manuscript. Ethics of human subject participation: Verbal consent was formally recorded.
Supplementary material
To view supplementary material for this article, please visit https://doi.org/10.1017/S1368980017001161


