

Introduction
Obesity has become one of the major health issues of the 21st century, affecting both developed and developing nations. It is estimated that 1·5 billion of the global population will be overweight or obese by the year 2030. The incidence of obesity in the UK alone continues to increase at an alarming rate(Reference Devaux and Sassi1, 2). In the UK, 42·3 % of men and 32·3 % of women are classified as overweight, with a further 23·3 % of men and 24·4 % of women classified as obese(2). Incidence of obesity in some ethnic groups in the UK is even higher, particularly among females of black Caribbean and black African ethnicities, compared with the general population(2). Levels of obesity in UK children remain high, with 23·1 % of 4- to 5-year-old children being classified as overweight or obese and 33·3 % of 10- to 11-year-olds classified as overweight or obese(2).
It is now generally accepted that elevated levels of body adiposity, especially ‘visceral’ (intra-abdominal adipose tissue) and hepatic fat, amplify the risks of developing chronic, life-threatening diseases. However, in recent years there have been a number of studies reporting subjects with metabolic profiles that do not always conform to that expected from their BMI. The underlying mechanism that allows this apparent disassociation is not fully understood; however, advances in in vivo imaging techniques, in combination with genetic models, are making significant inroads into this phenomenon. In this review, the evidence relating to the existence of individuals with normal metabolic profiles but elevated BMI (>30 kg/m2) and subjects with an abnormal metabolic profile and normal BMI ( < 25 kg/m2) are presented and discussed. The existence of these sub-phenotypes is making the scientific community reassess its understanding of the effects of body adiposity on health and disease.
Current status of knowledge
BMI and adiposity
There are many methods for estimating relative body adiposity, of which BMI (weight divided by height squared) is the most widely used. Most individuals in the UK attending a doctor's surgery or gym will undergo assessment of body composition by BMI for convenience and ease of interpretation. This is despite the fact that a substantial number of scientific publications have shown the limitations of this technique, particularly in different ethnic groups and athletes(Reference Prentice and Jebb3, Reference Deurenberg and Deurenberg-Yap4). Indeed, in athletes BMI may simply reflect increased muscle mass, which does not infer less favourable health(Reference Kragelund and Omland5). Similarly, a BMI of 20–25 kg/m2, which would be considered lean and by inference ‘healthy’ within a Caucasian population, corresponds to an elevated body fat content in other ethnic groups(Reference Deurenberg and Deurenberg-Yap4), which may therefore underestimate an individual's risk of metabolic disease.
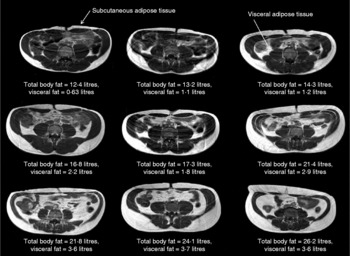
On a ‘population level’, a strong positive correlation between BMI and overall body fat content has been extensively reported(Reference Okorodudu, Jumean and Montori6). However, this can mask significant variations in the relationship between BMI and body fat distribution on an individual level. For instance, there is a strong correlation between adiposity and BMI for both sexes (males: r 0·64, P < 0·0001; females: r 0·82, P < 0·0001), with the latter showing a significantly higher percentage body fat at almost every BMI point(Reference Thomas, Parkinson and Frost7). However, significant variations between individuals within a given BMI can be observed. For instance, at a given BMI (for example, 24 kg/m2), the body fat content as measured by MRI in male and female subjects varies from 7·8 to 38·3 % and from 29·9 to 44·2 %, respectively(Reference Thomas, Parkinson and Frost7). This is further illustrated in Fig. 1, which shows the variation in adipose tissue distribution in transverse abdominal images of nine male subjects all having a BMI of 24 kg/m2. These images show that there is considerable inter-individual variation in the relative amount of abdominal subcutaneous and visceral fat present in subjects with an identical body fat content; indeed, the levels of visceral fat can vary by up to 400 %(Reference Thomas, Parkinson and Frost7). Despite evidence that BMI is of limited value in estimating the true body adiposity of an individual, it remains the method of choice in large population studies, particularly in genome-wide-association research programmes seeking to identify the genetic determinants of obesity(Reference Zhao, Bradfield and Zhang8, Reference Walters, Jacquemont and Valsesia9).
BMI is poorly predictive of adipose tissue content. In this figure nine transverse abdominal magnetic resonance images showing the distribution of abdominal fat are shown. Subcutaneous and visceral (intra-abdominal) adipose tissues (labelled) appear as bright signals as these are T1-weighted images. Elevated visceral fat is associated with an increased risk of metabolic disease. Subcutaneous fat is generally thought to carry less risk. Each image was taken at the level of the umbilicus from nine different Caucasian male subjects, all with an identical BMI (in this example 24 kg/m2). Despite these subjects having the same BMI, the distribution and amount of total and regional adipose tissue vary greatly (total body fat content range 12·4–26·2 litres, visceral fat content range 0·63–3·7 litres). These examples clearly show that BMI is not a good predictor of an individual's fat content.
Waist circumference
Whilst BMI is often used in research studies as an index of overall obesity, waist circumference is commonly used as a proxy of abdominal obesity(Reference Klein, Allison and Heymsfield10–Reference Lean, Han and Morrison12). Several studies have shown waist circumference to be associated with cardiometabolic disease and that it can be used to predict risk of type 2 diabetes(Reference Janssen, Katzmarzyk and Ross13, Reference Wang, Rimm and Stampfer14). However, the levels of adipose tissue, both subcutaneous and visceral, vary significantly for a single given waist circumference(Reference Thomas, Parkinson and Frost7). Fig. 2 shows how individuals with an identical waist circumference exhibit a considerable intra-individual variation in fat content and distribution. Direct measurement of individual fat depots appears to be imperative to unravel the relationship between body fat and metabolic dysregulation.
Waist circumference is a poor predictor of an individual's visceral fat content. In this figure nine transverse magnetic resonance images taken at the level of the umbilicus from nine different Caucasian male subjects each with an identical waist circumference of 84 cm (measured with a tape-measure at the mid-point of the waist) are shown. As can be clearly seen in the figure, there are very obvious visual differences between the images from different subjects, particularly in regards to the amount of visceral fat that is present. Indeed, the visceral fat content varies from 0·5–4·3 litres, suggesting that at least on an individual level, waist circumference is a very poor predictor of abdominal and, in particular, visceral fat content. The importance of this cannot be underestimated given that waist circumference is often used as a proxy of abdominal fat content.

Enhanced adiposity phenotyping
Indirect methods of body composition analysis, such as BMI, anthropometry, bioimpedance and plethysmography are not always suitable for detailed studies of body composition, since they cannot determine visceral adipose tissue distribution(Reference Prentice and Jebb3, Reference Deurenberg15–Reference Thomas, Collins and McCarthy21). Similarly, dual-energy X-ray absorptiometry, which is now commonly used to measure total and abdominal fat content, cannot be used to assess ectopic fat. Ectopic fat refers to fat deposited outside the classical adipose tissue depots into organs such as the liver, muscle and pancreas. Its presence in these organs conveys specific metabolic risk. As such, the ability to measure ectopic fat is a key factor in choosing suitable methodology for enhanced phenotyping. The inability of standard techniques to measure both adipose tissue and ectopic fat depots in detail has greatly hampered our ability to fully discern the cause–effect relationship between body adiposity and an individual's metabolic and cardiovascular risk factors. Indeed, using conventional methods of measuring body composition, individuals with a wide range of visceral and ectopic fat content can be categorised as having identical body adiposity.
The desire to accurately phenotype individuals has been one of the driving forces behind the development of direct, non-invasive methods, such as MRI and magnetic resonance spectroscopy (MRS), to measure total and regional adipose content(Reference Thomas, Saeed and Hajnal18, Reference Fowler, Fuller and Glasbey22–Reference Hu, Nayak and Goran39). The most commonly used MRI method in body composition tends to be T1-weighted imaging (conventional MRI images in which the fat appears bright and other tissues grey; examples of these images are shown in Fig. 1), especially for whole-body fat measurements. These are routine techniques that can be applied on both clinical and research MRI scanners, enabling widespread application. More recently multi-echo imaging and chemical shift-based techniques have also been developed to quantify fat deposition in the abdomen, liver and pancreas. These methods manipulate the frequency difference between water and fat signals to generate multiple images from which tissue fat content can be measured; these methods tend to be limited to specialist research centres(Reference O'Regan, Callaghan and Wylezinska-Arridge31–Reference Hu, Nayak and Goran39). For an in-depth review of MRI techniques to measure abdominal adipose tissue and organ fat content, see Hu et al. (Reference Hu, Nayak and Goran39).
Proton MRS (1H-MRS) to measure ectopic fat content in the muscle(Reference Schick, Eismann and Jung40–Reference Howald, Boesch and Kreis44) and liver(Reference Thomas, Hamilton and Patel45–Reference Tarasów, Siergiejczyk and Panasiuk49) has been extensively validated against other techniques, including biopsy(Reference Thomas and Bell50). More recently MRS has been used to assess fat content in organs such as the pancreas(Reference Hu, Kim and Nayak35, Reference Lingvay, Esser and Legendre51) and heart(Reference Szczepaniak, Dobbins and Metzger52). Measurement of fat in the pancreas and heart is more technically demanding than in the liver and muscle, partly related to the size, position and motion associated with these organs; as yet these measurements have not been fully validated. While 1H-MRS is considered the ‘gold standard’ to measure fat in the liver and muscle, further work is required before it can be regarded as such in the pancreas or heart.
Magnetic resonance-based techniques have become the methods of choice for enhanced adiposity phenotyping; in a single MRI examination total and regional adipose tissue content, in addition to muscle, liver and pancreatic fat content can be obtained (Fig. 3).
Measurement of fat content by 1H-magnetic resonance spectroscopy. Transverse magnetic resonance images were taken through the abdomen to identify the liver and pancreas, and the lower leg to identify soleus and tibialis muscles. Voxels were placed in the organ of interest avoiding bone, blood vessels and obvious fatty streaks. 1H-magnetic resonance spectra were obtained in approximately 2 min from (a) the liver, (b) pancreas and (c) soleus muscle. The ectopic fat content of the liver and pancreas was determined by measuring the ratio of the fat peak (specifically the CH2 resonance) to the water peak. The ectopic fat content in the muscle (or intramyocellular lipid; IMCL) was measured from the ratio of the fat (again the CH2 resonance), which arises from lipids within the myocyte, this time measured relative to total muscle creatine (Cr) content. These ratios were all corrected for T1 and T2 relaxation effects (these are NMR effects which are related to how long it takes for the NMR signal to relax back to equilibrium; correcting for them allows spectra to be obtained faster). ppm, Parts per million; EMCL, extramyocellular lipid; Cho, choline.

Body composition by whole-body MRI and magnetic resonance spectroscopy
Visceral fat and ectopic fat within the liver have been shown to be stronger and independent predictors of markers of the metabolic syndrome(Reference Demerath, Reed and Rogers53–Reference Hwang, Stein and Barzilai55) than subcutaneous fat depots. Indeed, subcutaneous adiposity appears to be relatively protective rather than harmful(Reference Pou, Massaro and Hoffmann19, Reference Porter, Massaro and Hoffmann56) and is the strongest predictor of plasma levels of leptin, the fat-derived hormone that reduces appetite(Reference Montague, Prins and Sanders57–Reference Magni, Liuzzi and Ruscica59). Conversely, ectopic muscle fat correlates with markers of insulin resistance and visceral adiposity(Reference Forouhi, Jenkinson and Thomas60–Reference Gan, Kriketos and Poynten62), while liver fat content correlates with total and visceral adiposity, and liver enzyme abnormalities(Reference Thomas, Hamilton and Patel45).
The identification of visceral fat and liver fat as fundamental contributors to the development of co-morbidities of obesity has led to a dynamic search for effective life-style and pharmacological/clinical interventions to contain or reduce their impact on health. Cross-sectional and interventional studies using imaging techniques have revealed a number of factors that make an impact on the amount, and crucially the distribution and composition, of fat deposited within the body. Whilst an in-depth review of this area of research is beyond the scope of the present paper, these phenotyping methods have enabled the study of the influences of: (i) diet on adipose tissue fatty acid composition(Reference Thomas, Frost and Barnard63, Reference Hwang, Bluml and Leaf64); (ii) ethnicity on ectopic fat and abdominal obesity(Reference Forouhi, Jenkinson and Thomas60, Reference Jones, Shen and St-Onge65–Reference Lê, Ventura and Fisher67); (iii) the environment in the womb, with preserved visceral fat in infants with growth retardation and fat changes during catch-up growth after birth(Reference Harrington, Thomas and Frost68, Reference Modi, Thomas and Harrington69); and (iv) sex differences on abdominal fat reduction with weight loss(Reference Kuk and Ross70). Furthermore, an increasing number of studies have shown associations of variants in various genes (for example, angiotensin-converting enzyme (ACE), adiponectin (ADIPOQ), β-2 adrenergic receptor (ADRB2), apoA2 (APOA2), fatty acid-binding protein-2 (FABP2), lymphotoxin-α (LTA), microsomal triglyceride transfer protein (MTTP), perilipin (PLIN), PPARγ (PPARG) and uncoupling protein-1 (UCP1)) with measures of body fat distribution, including visceral and abdominal subcutaneous fat, waist:hip ratio, waist circumference and sagittal diameter(Reference Rankinen, Zuberi and Chagnon71).
More recently, genome-wide-association study analysis has identify an insulin receptor substrate-1 (IRS1)-associated allele with reduced subcutaneous adipose tissue but paradoxically increased metabolic risk(Reference Kilpeläinen, Zillikens and Stančákova72), confirming the importance of accurate in-depth phenotypic characterisation in scientific research. Indeed, most genome-wide-association studies and SNP–environment interactions for obesity and diabetes studies have utilised the much-questioned BMI or waist:hip ratio as a measure of obesity and/or body adiposity(Reference Speliotes, Willer and Berndt73–Reference Heid, Jackson and Randall75). Similarly, studies on hepatic steatosis heritability have been carried out using computerised tomography (CT) in relatively small populations(Reference Speliotes, Massaro and Hoffmann76). This has greatly limited the relative health impact of such studies.
Metabolically normal obesity
Excess body fat does not always appear to be associated with metabolically adverse profiles such as increased risk of insulin resistance, glucose intolerance, type 2 diabetes and CVD(Reference Must, Spadano and Coakley77–Reference Kuk, Katzmarzyk and Nichaman79). There is a growing body of evidence that supports the existence of ‘metabolically normal obesity’. These subjects have been referred to as metabolically healthy obese (MHO)(Reference Stefan, Kantartzis and Machann80–Reference Karelis, St-Pierre and Conus84) and can carry considerable levels of body fat, but maintain normal insulin sensitivity and blood pressure, high HDL and low plasma TAG levels(Reference Wildman, Muntner and Reynolds81, Reference Karelis, St-Pierre and Conus84–Reference Bonora, Kiechl and Willeit86). The incidence of MHO varies between studies, partly due to the manner in which MHO is defined. In Germany, Stefan et al. (Reference Stefan, Kantartzis and Machann80) reported 24·4 % of their obese population as MHO, on the basis of their insulin sensitivity, whilst in an Italian study by Bonora et al. (Reference Bonora, Kiechl and Willeit86) approximately 20 % of their obese individuals fit the MHO profile. Similarly Wildman et al. (Reference Wildman, Muntner and Reynolds81) in the USA reported an incidence of MHO in 35·4 and 29·2 % of obese women and men, respectively. MHO was defined as having only one of six common cardiometabolic risk factors (elevated blood pressure, elevated TAG, C-reactive protein, insulin resistance, elevated glucose levels/diabetes, or decreased HDL)(Reference Wildman, Muntner and Reynolds81, Reference Karelis, St-Pierre and Conus84, Reference Wildman87).
A related phenotype includes obese subjects who are defined as ‘fat-fit’(Reference McAuley and Blair82, Reference Lee, Blair and Jackson88–Reference O'Donovan, Thomas and McCarthy90). At present it is unclear how much overlap there is between the MHO and fit-fat phenotypes. Interestingly, there is a growing body of evidence that fat but fit individuals have substantially lower mortality risk than normal-weight unfit individuals(Reference McAuley and Blair82, Reference Wei, Kampert and Barlow89, Reference O'Donovan, Thomas and McCarthy90). This apparent dissociation between body fat content and adverse metabolic profile may be in part related to body fat distribution, since different adipose tissue depots are known to carry proportionally different risk in terms of CVD(Reference Björntorp91).
A key contributory factor to this dissociation must therefore be a severance between visceral/liver fat and total body adiposity. This sub-phenotype has been clearly identified by our group and others, where subjects with elevated BMI show normal levels of visceral and ectopic fat depots (i.e. reduced compared with the general obese population) and healthy metabolic profiles(Reference Stefan, Kantartzis and Machann80, Reference O'Donovan, Thomas and McCarthy90, Reference Brochu, Tchernof and Dionne92). In many ways this is similar to the phenotype observed in Japanese Sumo wrestlers, who have reduced visceral adiposity accompanied by high insulin sensitivity despite their elevated total fat content(Reference Matsuzawa93, Reference Matsuzawa, Fujioka and Tokunaga94). The underlying mechanisms leading to the development of this sub-phenotype are not known, but factors such as increased physical activity may be important. Lee et al. (Reference Lee, Sui and Blair95) have shown that physical fitness reduces or eliminates the risks associated with obesity, while O'Donovan et al. (Reference O'Donovan, Thomas and McCarthy90) have reported that subjects with improved VO2max show a significant reduction in abdominal obesity despite their elevated BMI.
Excess body fat in normal-weight subjects
In addition to ‘metabolically normal obesity’, the opposite phenotype, comprising of lean subjects (BMI < 25 kg/m2) with the metabolic phenotype of an obese individual, has been reported and poses a potentially serious hidden risk for a significant proportion of the population. These individuals have been referred to as ‘metabolically obese but normal-weight’ (MONW)(Reference Ruderman, Schneider and Berchtold96). These subjects have been shown to have reduced insulin sensitivity, increased abdominal adiposity, a more atherogenic lipid profile, and raised blood pressure, accompanied by physical inactivity and a low VO2max. The combination of these factors is thought to predispose ‘metabolically obese but normal-weight’ subjects to an increased risk of type 2 diabetes and CVD(Reference Karelis, St-Pierre and Conus84, Reference Conus, Rabasa-Lhoret and Péronnet97–Reference Ruderman, Chisholm and Pi-Sunyer103).
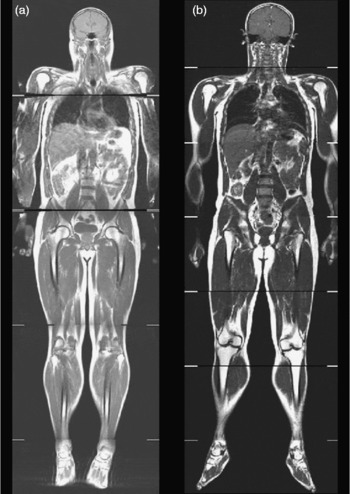
This phenotype has been further refined using MRI to show disproportionate deposition of visceral adipose tissue, with many lean subjects having more visceral adipose tissue than overweight or obese subjects (Fig. 4). This TOFI (thin-on-the-outside fat-on-the-inside) sub-phenotype has been observed in both male and female subjects, and increases an individual's risk of metabolic disease(Reference Thomas, Parkinson and Frost7). An example of this can be seen in Fig. 5. The elevated visceral fat found in individuals classified as TOFI (higher ratio of visceral:subcutaneous abdominal adipose tissue) was accompanied by increased levels of both liver and muscle fat. Identifying subjects classified as TOFI may be important, since they may be at increased risk of metabolic disease compared with more obese subjects with less visceral fat. Incidence of ‘metabolically-obese but normal-weight’ has been reported to be between 13 and 18 %(Reference Karelis, St-Pierre and Conus84, Reference Dvorak, DeNino and Ades102), which is similar to the incidence of TOFI (12 % women, 14 % men)(Reference Thomas, Parkinson and Frost7). Interestingly, a similar finding has been reported in obese individuals, where obese subjects with a disproportionate accumulation of visceral fat had increased incidence of disorders of glucose and lipid metabolism(Reference Matsuzawa, Nakamura and Shimomura104).
Overlap in visceral fat content between male (a) and female (b) lean and obese individuals. Absolute levels of visceral fat in lean (BMI 20–25 kg/m2; 156 male, 182 female), overweight (BMI 25–30 kg/m2; 213 male, eighty-six female), obese BMI (30–40 kg/m2; 140 male, 982 female) and morbidly obese (BMI >40 kg/m2; twelve male, thirteen female) subjects. Note the overlap between visceral fat levels between the different BMI groups. Many lean individuals have as much or more visceral fat than overweight, obese and, in some instances, morbidly obese subjects.

Whole-body coronal images demonstrating the TOFI (thin-outside fat-inside) phenomenon. The male individuals shown in this figure are of similar age, BMI and percentage body fat but have different levels of visceral fat and therefore different disease risks. Subject (a) is a TOFI (BMI 25·8 kg/m2; 3·3 litres of visceral fat); subjects (b) is a healthy volunteer (BMI 26·5 kg/m2; 2·2 litres of visceral fat).
Again, as with the MHO and ‘fat-fit’ individuals, the underlying mechanisms behind the accumulation of disproportionate levels of visceral and liver fat in subjects with a normal body weight are not fully understood. Potential causes include physical inactivity, ageing, sex hormones, dietary composition and genetic factors(Reference Ruderman, Chisholm and Pi-Sunyer103); further research is needed to explain the exact mechanisms responsible for this phenotype. Després & Lemieux(Reference Després and Lemieux105) proposed that excess visceral fat deposition could be a marker of ‘dysfunctional’ adipose tissue, which in turn is associated with increased ectopic fat deposition in the liver, heart, skeletal muscle and pancreas.
Obesity in lean tissue – the problem of ectopic fat
It has been recently suggested that in the development of insulin resistance and type 2 diabetes, accumulation of lipids outside the classical adipose tissue depots may be the critical factor(Reference Unger, Zhou and Orci106). Lipid accumulation in non-adipose cells (ectopic fat) may impair the normal housekeeping function of some tissues through a process known as ‘lipotoxicity’(Reference Unger107). Ectopic storage of excess lipids in ‘lean body mass’, via organs such as the liver, skeletal muscle and β-cells of the pancreas has therefore been proposed as the causative link between fat distribution and the metabolic syndrome(Reference Unger108). Ectopic fat deposition has also been shown to affect both renal and cardiovascular function and may contribute to the development of CVD(Reference Montani, Carroll and Dwyer109). For example, subjects with lipodystrophy have disproportionally raised levels of ectopic fat, despite very low levels of adipose tissue(Reference Petersen, Oral and Dufour110, Reference Hegele, Joy and Al-Attar111).
Early studies showed that TAG are elevated within muscle cells of rodent models of diabetes and in human diabetic patients(Reference Stearns, Tepperman and Tepperman112–Reference Falholt, Jensen and Lindkaer114), and this elevation was inversely related to insulin action(Reference Storlien, Jenkins and Chisholm115–Reference Pan, Lillioja and Kriketos118). Accumulation of liver fat (steatosis) in relation to diabetes was reported incidentally as early as 1884(Reference Pepper119), although, until recently, fat accumulation in the liver was assumed to be a relatively benign condition. However, reports showing increased incidence of cirrhosis in obese and type 2 diabetic subjects have challenged this view(Reference Zelman120–Reference Kern, Heger and Payne123). Recent studies have shown that 25–50 % of patients with steatosis subsequently became diabetic, suggesting that hepatic steatosis may have a direct causative effect in the development of diabetes(Reference Ekstedt, Franzén and Mathiesen124, Reference Adams, Waters and Knuiman125). Similarly, this has also been linked to the development of CVD(Reference Adams, Waters and Knuiman125), suggesting that non-alcoholic fatty liver disease is an independent risk factor for metabolic disease. Furthermore, an abundance of fat within the liver can also progress to steatohepatitis, cirrhosis and potentially hepatocellular carcinoma(Reference Powell, Cooksley and Hanson126). Non-alcoholic fatty liver disease is increasing in incidence and is a common finding in the general population; it is becoming the most prevalent cause of chronic liver disease worldwide. The prevalence of non-alcoholic fatty liver disease in Western countries is estimated to range from 6 to 30 %, and has been reported to be present in as many as 63–98 % of the obese and morbidly obese populations (Vernon et al. (Reference Vernon, Baranova and Younossi127) and references within).
There are a number of hypotheses as to the potential mechanism behind the increased accretion of ectopic fat(Reference Bays, Mandarino and DeFronzo128, Reference Lelliott and Vidal-Puig129). These include increased uptake, decreased oxidation/disposal and increased de novo synthesis of TAG in the liver, as well as the so-called ‘overflow hypothesis’ – where adipose tissue is unable to expand to uptake/retain excess fat from the circulation, necessitating accumulation of fat in non-adipocyte cells. Much of the current research appears to support the notion that each of these mechanisms, to varying extent, is implicated in accretion of ectopic fat in disease.
Until recently ectopic fat was assessed by the use of needle biopsy in combination with electron microscopy/oil staining. This had limited application in tissues such as the heart and pancreas, besides the issues for longitudinal studies in heterogeneous tissues, such as the liver. Non-invasive methods available include ultrasound, which tends to be regarded as an initial screening tool for hepatic steatosis due to being non-invasive, inexpensive, and widely available. However, poor sensitivity and specificity of ultrasound, particularly for mild to moderate ( < 20 %) levels of fat infiltration, have led many to question whether it is an appropriate screening tool for fatty liver disease(Reference Dasarathy, Dasarathy and Khiyami130). Today, the advent of computerised tomography (CT), MRI and MRS has revolutionised the study of ectopic fat, allowing fast and reproducible non-invasive quantitative measurement of lipids in the muscle, liver and pancreas (Fig. 3). Increased availability and access to magnetic resonance scanners have made it a more viable alternative as a clinical screening tool, rather than a pure research measurement.
The measurement of ectopic fat, particularly in the liver, has become an important issue in light of recent publications which have suggested that excess hepatic fat is more physiologically relevant than visceral fat in the development of the metabolic syndrome. Indeed, the phenotype of metabolically healthy obese individuals, as mentioned previously, has reduced fat in the liver(Reference Stefan, Kantartzis and Machann80, Reference O'Donovan, Thomas and McCarthy90). Fabbrini et al. (Reference Fabbrini, Magkos and Mohammed54) have suggested that increased liver fat is an independent indicator of multi-organ insulin resistance and postulate that the observed relationship between increased visceral fat and metabolic disease is essentially a confounding factor due to the correlation between visceral and liver fat. More recently, Magkos et al. (Reference Magkos, Fabbrini and Mohammed131) have shown that increased adiposity, without an increase in liver fat, does not cause abnormalities in adipose tissue, skeletal muscle and hepatic insulin sensitivity, and VLDL metabolism.
In addition to the accumulation of fat within muscle cells (intramyocellular lipid), several studies recently measured intermuscular adipose tissue using MRI, which is adipose tissue located between muscle bundles(Reference Yim, Heshka and Albu132), akin to the marbling found in steak (Fig. 6). Expansion of this depot has been shown to be related to insulin resistance(Reference Goodpaster, Thaete and Simoneau133).
Intermuscular adipose tissue increases with increasing age and decreasing insulin sensitivity. Transverse magnetic resonance images from the calf muscle from four Caucasian male volunteers: (a) an athlete aged 23 years; (b) a healthy volunteer aged 35 years; (c) a healthy volunteer aged 60 years; (d) a 68-year-old volunteer with type 2 diabetes. Fat (intermuscular adipose tissue, also referred to as extramyocellular lipid) accumulates between muscle fibres as muscles age and become more insulin resistant.

Life-style changes and body adiposity
A full understanding of the long-term health implications of abdominal obesity and associated metabolic, inflammatory and endocrine markers should drive innovative translational approaches directed towards better maintenance of health and quality of life. In small-scale interventional studies, health benefits have been observed with: (i) moderate exercise and dietary changes to alter muscle fat and liver fat, and reduce visceral fat as shown in Fig. 7(Reference Thomas, Brynes and McCarthy134–Reference Ross, Janssen and Dawson138); (ii) moderate energy restriction to reduce liver and visceral fat and improve insulin sensitivity(Reference Larson-Meyer, Heilbronn and Redman139–Reference Janssen, Fortier and Hudson142); (iii) influence of sex and ethnicity on life-style intervention(Reference Kuk and Ross70, Reference Doucet, St-Pierre and Alméras143, Reference Leenen, van der Kooy and Droop144); (iv) exercise training to alter muscle and fat volume that differs with a genetic variant indicating gene–environment interactions(Reference Montgomery, Marshall and Hemingway145–Reference Bouchard147); and (v) twin discordance on physical activity and body composition(Reference Hannukainen, Borra and Linderborg148, Reference Mustelin, Pietiläinen and Rissanen149). Many of these findings are beginning to find their way into the life-style choices of individuals, thus improving the health of the population as a whole.
Effect of 6 months' life-style intervention on adipose tissue and ectopic fat content. Life-style intervention over a 6-month period involving reducing portion size and increasing physical activity can have a dramatic effect on body fat content. This individual lost 33 kg of body fat. Three sample images from a total dataset of 113 slices are shown. These three images all show visual reductions in subcutaneous fat; they also show clear reductions in internal fat deposits from around organs including the heart (a), kidneys (b) and from intra-abdominal adipose tissue depots (c). These changes were accompanied by significant reductions in ectopic fat in both liver and muscle as can be seen in the spectra from the liver and muscle. Liver fat was reduced from 38 to 0·6 % (calculated as the ratio of CH2 of fat peak to water peak, corrected for T1 and T2 relaxation effects) and muscle fat was reduced from 18 to 6 % (calculated as the ratio of CH2 of fat peak to creatine (Cr) peak, corrected for T1 and T2 relaxation effects). Overall, this figure illustrates the benefit of enhanced phenotyping, from one examination combining MRI and magnetic resonance spectroscopy; reductions in adipose tissue and ectopic fat in response to life-style modification can be observed and quantified from several metabolically important sites. IMCL, intramyocellular lipid.

In conclusion, despite the well-known association between increased body fat content and increased adverse metabolic risk factors, the advent of non-invasive imaging techniques has allowed identification of a number of sub-phenotypes that point to the importance of fat distribution, as well as total fat content, in the development of chronic metabolic disorders.
Acknowledgements
The authors would like to acknowledge the contribution of Anthony Goldstone, Julie Fitzpatrick, Giuliana Durighel and Paul Baruya. The authors would like to acknowledge funding from the UK MRC (Medical Research Council) and NIHR (National Institute for Health Research) Biomedical Research Centre. All authors were involved in the design and writing of this paper. All authors gave final approval of the text. None of the authors has any conflict of interest to declare.


