





1. Introduction
An emerging trend in cognitive science and the social sciences involves using large-scale textual data to identify patterns of human cognition. These data further allow researchers to investigate cognitive evolution and to analyze socio-cultural change through historical corpora (Dodds et al., Reference Dodds, Clark, Desu, Frank, Reagan, Williams, Mitchell, Harris, Kloumann and Bagrow2015; Hills et al., Reference Hills, Proto, Sgroi and Seresinhe2019; Nguyen et al., Reference Nguyen, Liakata, DeDeo, Eisenstein, Mimno, Tromble and Winters2020). The relationship between human cognition and socio-cultural contexts is inherently reciprocal. Shifts in cognitive processes often reflect broader cultural transformations, while cultural change, in turn, shapes cognition. Despite these advances, challenges remain in identifying comprehensive linguistic expressions that reliably represent human cognition across diverse cultural settings. These challenges stem from the fact that cognitive development is jointly shaped by internal cognitive mechanisms and external socio-cultural influences. Nevertheless, linguistic patterns preserved in historical texts can provide valuable insights into cognitive evolution and socio-cultural change (Bollen et al., Reference Bollen, ten Thij, Breithaupt, Barron, Rutter, Lorenzo-Luaces and Scheffer2021; Fitch et al., Reference Fitch, Huber and Bugnyar2010; Scheffer et al., Reference Scheffer, van de Leemput, Weinans and Bollen2021), making it worthwhile to pursue these connections through systematic textual analysis. Beyond mere lexical choice, the way humans relate ideas in discourse serves as a revealing dimension of cognitive architecture. Through the explicit deployment of discourse connectives, we can observe the intersection of internal cognitive processing and the external, culturally grounded conventions of reasoning and communication.
Discourse connectives (DCs), words or phrases connecting or relating discourse units (e.g., because, however, meanwhile), are crucial for establishing textual discourse because they can typically represent logical connections in language. Their functions are to mark relationships between discourse units and guide readers or listeners in constructing coherent interpretations of texts. They typically encode semantic relations such as causal (because, therefore), contrastive (however, but), temporal (after, then), or additive (moreover, and) in discourse. DCs could form a heterogeneous functional class of linguistic expressions whose primary role is to signal coherence relationships between clauses, sentences or larger textual segments (Mauri & Van der Auwera, Reference Mauri, Van der Auwera, Allan and Jaszczolt2012; Sanders, Reference Sanders2005).
Although DCs explicitly signal relationships between discourse units, textual coherence does not depend merely on such markers. Many discourse relations remain implicit, emerging naturally from the semantic and pragmatic context of a text. However, pragmatic inference and effective communication can be difficult when logical relations are not made explicit in discourse. In such cases, explicit DCs often facilitate pragmatic inference by functioning as processing instructions that guide interpretation. This facilitating role of DCs has been consistently demonstrated in studies of language comprehension and discourse processing (Britton et al., Reference Britton, Cong, Y-Y, Chersoni and Blache2024; Prado et al., Reference Prado, Spotorno, Koun, Hewitt, Van der Henst, Sperber and Noveck2015; Van Silfhout et al., Reference Van Silfhout, Evers-Vermeul and Sanders2015).
For example, we have such a text: ‘As he stood on the harbour thinking about his son (1), he wondered if the family would ever get to make the journey (2). However, soon after this disappointment (3) the father discovered how lucky the family had been (4).’ In this text, ‘as’ provides the link between clause (1) and (2). This DC signals a temporal relation between clauses (1) and (2). Likewise, ‘soon after’ marks the temporal relation between clauses (3) and (4), while ‘however’ signals the contrast between the two larger discourse units. These connectives collectively contribute to the coherence of the text. Without them, the logical and temporal relations would be less transparent, making pragmatic inference and effective communication more difficult.
DCs could also play a central role in theoretical and computational approaches to discourse analysis. One prominent instance is the Penn Discourse Treebank (PDTB; Webber et al., Reference Webber, Prasad, Lee and Joshi2019), which relies primarily on DCs to annotate discourse relations in English. The PDTB framework treats each discourse relation as an individual unit, largely independent of the broader discourse context, and therefore emphasizes local coherence. This perspective underlies shallow discourse parsing, in which connectives function as heads that define dependency relations between textual segments. The PDTB has had a substantial influence on theoretical discourse research, corpus construction and computational discourse analysis.
Research on DCs and related phenomena, including discourse markers (DMs) and discourse particles, has become an essential area within pragmatics and discourse studies (Aijmer, Reference Aijmer2002; Fraser, Reference Fraser1999; Lenk, Reference Lenk1998). These studies have consistently shown that connectives convey crucial information about discourse organization and pragmatic interpretation. This growing interest has contributed to the hypothesis of the ‘Rise of Discourse Markers’, which has gained prominence in recent years (Heine et al., Reference Heine, Kaltenböck, Kuteva and Long2022). Because DCs constitute one component of the broader category of DMs, this line of research may create the impression that DC frequency has also increased. However, such an inference requires direct empirical verification rather than being assumed from the broader rise of DMs. More generally, frequency effects have been extensively studied in research on language variation, language processing and language acquisition (Ellis, Reference Ellis2002; Grainger, Reference Grainger1990; Monaghan & Roberts, Reference Monaghan and Roberts2021).
Analyzing DCs could be situated within the broader diachronic trend known as the rise of DMs, such as like, so, you know and well, which function to manage conversational flow, express speaker stance and coordinate shared knowledge (Schiffrin, Reference Schiffrin1987). Over the last centuries, increases in the frequency and functional diversity of DMs have been closely associated with the ‘colloquialization’ of written language, where features of spoken discourse increasingly enter prose. This shift is characterized by the decline of formal connectives, such as consequently and furthermore, alongside a corresponding rise in more colloquial markers, such as causal so, reflecting a systemic reorganization of discourse style. In this process, DMs often replace formal connectives by signaling coherence in a more interactive, pragmatic manner and by fostering implicitness, as writers rely more on shared context and reader inference than on explicit logical markers (Jin & de Marneffe, Reference Jin and de Marneffe2015).
However, diachronic frequency changes have rarely been investigated in relation to how they influence language use across multiple languages and historical periods using large-scale textual data. Given the general tendency toward colloquialization and recent claims about the rise of DMs, the hypothesis of a universal ‘rise’ calls for careful empirical evaluation. Convincing evidence would require that a comprehensive inventory of DMs be systematically identified and tracked over time. Nevertheless, this remains difficult, as there is still no consensus on the precise definition of discourse particles, and no publicly available corpora provide an exhaustive and standardized inventory of such forms.
In contrast, DCs are more systematically defined and therefore more suitable for quantitative cross-lingual analysis. Despite this advantage, relatively few data-driven studies have investigated historical trends in their use, and most existing research has focused primarily on English (Claridge, Reference Claridge2013; Lenker & Meurman-Solin, Reference Lenker and Meurman-Solin2007; Rysová, Reference Rysová, Menzel, Lapshinova-Koltunski and Kunz2017). The growing availability of discourse-annotated corpora across languages now makes it possible to compile large-scale datasets and to trace the diachronic evolution of connectives in a comparable manner. Building on this opportunity, the present study uses multilingual corpora to examine long-term frequency changes in DCs across several major languages, thereby providing a broader empirical foundation for understanding historical discourse patterns.
Furthermore, as written language became increasingly digitized, ‘culturomics’ and other big data approaches offer new opportunities to gain insight into the development of human cognition and society (Charlesworth et al., Reference Charlesworth, Yang, Mann, Kurdi and Banaji2021; Michel et al., Reference Michel, Shen, Aiden, Veres, Gray, Pickett, Hoiberg, Clancy and Norvig2011). As DCs encode logical relations and support pragmatic inference, their historical usage reflects how speakers and writers have deployed logical devices and prioritized communicative goals over time. Influential research indicates that the historical use of certain linguistic expressions can be linked to human cognitive and emotional trends in human populations (Bollen et al., Reference Bollen, ten Thij, Breithaupt, Barron, Rutter, Lorenzo-Luaces and Scheffer2021; Iliev & Axelrod, Reference Iliev and Axelrod2016; Scheffer et al., Reference Scheffer, van de Leemput, Weinans and Bollen2021). This large body of research has primarily relied on frequency and frequency-based metrics of linguistic expressions to relate language use to cognitive change.
Building on this line of inquiry, our study challenges the view that diachronic changes in DCs reflect shifts in human rationality or cognitive processing. These frequency changes are more plausibly attributed to stylistic change, particularly the gradual colloquialization of written discourse, rather than to fundamental cognitive evolution. By disentangling stylistic change from cognitive interpretation, our analysis seeks to clarify what historical patterns in DC use truly reveal about the dynamics of written communication and thought expression.
This study adopts diachronic quantitative methods to examine frequency changes in a broad set of DCs from a cross-lingual perspective and offers one of the first comprehensive cross-lingual analyses of diachronic DC frequency patterns. Our research questions are as follows:
-
1) Have the frequencies of DCs in English, Chinese, French, German and Spanish increased or declined significantly over the last two centuries?
-
2) What underlying factors account for these diachronic frequency changes, and to what extent might these patterns reflect broader developments in human rationality or socio-cultural transformation over time?
2. Methods
2.1. DCs and databases
The analysis requires a comprehensive inventory of DCs. A substantial body of research demonstrates that DCs play a critical role in both theoretical discourse analysis and computational discourse studies. Meanwhile, the linguistic community widely recognizes the difficulty of establishing a single, sharply defined cross-lingual definition, owing to the grammatical diversity of these items and their ongoing processes of grammaticalization. Given the large scale and the absence of fine-grained linguistic annotation, such as part-of-speech tags (Michel et al., Reference Michel, Shen, Aiden, Veres, Gray, Pickett, Hoiberg, Clancy and Norvig2011), we therefore adopt a list-based, frequency-driven operational definition as a principled and practical necessity.
Our set of DCs comprises a carefully curated list of high-frequency words and multi-word units in each language that are consistently recognized by standard grammatical and corpus studies as performing a cohesive discourse function. To mitigate the effects of polysemy, whereby a given form may function as a preposition or occur within nondiscourse constructions, we applied frequency weightings derived from annotated resources such as the PDTB. This approach allows us to concentrate on historical trends in explicit coherence marking and provides a robust first-order approximation of discourse function across two centuries of textual data.
The release of the PDTB (Webber et al., Reference Webber, Prasad, Lee and Joshi2019) offers a high-quality, large-scale discourse resource for English. The most recent version, PDTB3.0, includes a manual detailing various DCs along with their semantic meanings and frequencies. These data are particularly valuable for historical analyses, as they enable estimating the relative frequencies of different semantic senses associated with individual DCs. In addition, discourse-relation–annotated corpora have since been developed for eight languages, including Chinese, French and German, thereby enabling cross-lingual investigations. By adopting the PDTB discourse-relation taxonomy, we categorize DCs into major relation types such as Contrast, Contingency, Expansion and Temporality, which allows us to examine historical changes in the use of these relation types across languages.
After establishing DC inventories and semantic classifications, we extracted historical frequency data. The Google Books Corpora provide historical data on a number of languages (Michel et al., Reference Michel, Shen, Aiden, Veres, Gray, Pickett, Hoiberg, Clancy and Norvig2011). The Google Books Corpora enables us to conduct a cross-lingual study. We chose English, Chinese, French, German and Spanish to examine their historical changes over the last two centuries. The frequency data derived from the Google Books Corpora are normalized to yield a distribution of yearly z-scores from 1800 to 2019. To ensure robustness, we cross-validated these trends using frequency data from multiple independent databases. For English, we obtained historical frequency data from both the Google Books Corpora and the Corpus of Historical American English (COHA; Davies, Reference Davies2010) for cross-validation. Compared with the Google Books Corpora, the COHA provides a more balanced and genre-controlled representation of English across historical periods. As an additional robustness check, we also examined genre-specific subcorpora, such as fiction, to assess the stability of the observed trends across different text types.
The Google Books Corpora provide historical data for several languages, including Chinese, English, French, German, Hebrew, Italian, Russian and Spanish. However, some of these languages have undergone substantial standardization or reform only relatively recently. Modern Hebrew, for instance, has been in widespread use only since the mid-twentieth century. Following Italian unification in 1861, Tuscan was designated as the official national language, and modern Italian became dominant largely through the expansion of mass media such as radio, television and newspapers. Russian has also experienced multiple orthographic and linguistic reforms. Similarly, Chinese underwent major language reforms during the twentieth century. For these reasons, we focus our analyses on English, French, German, Spanish and Chinese (used as a control), which provide longer and more stable historical records suitable for diachronic comparison. The following sections describe in detail the procedures used to select DCs and to extract and process historical frequency data for these languages.
2.2. English
Figure 1 illustrates the hierarchy of semantic labels for DCs in the PDTB. The PDTB classification is organized into three levels: SENSE, CLASS and TYPE. All clause relations, that is, discourse semantic relations in PDTB 3.0, are grouped into four top-level senses: Comparison, Contingency, Expansion and Temporal, each of which comprises a set of more fine-grained semantic relation types (i.e., CLASS and TYPE). This annotation framework has also been adopted for other languages, including Chinese, French and German. Accordingly, DCs in these languages can be categorized into the same four major senses, allowing us to examine and compare their relative historical frequency changes across languages.
The hierarchical classification of clause relationships in PDTB3.0 (Note: three levels: Sense, Class and Type. For example, ‘Contingency’ is Sense, ‘Cause’ is Class and ‘Result’ is Type).

In the PDTB3.0, DCs are realized as lexical items, primarily subordinate and coordinate conjunctions, along with discourse adverbials. Discourse relations can also be inferred from adjacent discourse units in the absence of explicit connectives. Although most DCs in English are explicit, approximately 40% of discourse relations in the PDTB are annotated as implicit. The present study focuses on diachronic changes in the frequencies of explicit DCs. We identify 160 DCs together with their semantic labels from PDTB 3.0. To our knowledge, this inventory is among the most comprehensive available, as it is derived from the largest existing English discourse-annotated corpus and represents the widest set of explicitly identified DCs in the language. Each connective is further associated with a detailed semantic classification, including CLASS and TYPE, which enables fine-grained comparative analyses. We therefore adopted several strategies to extract and process the relevant frequency data.
Frequency weights: To address our research questions, it is not sufficient to rely solely on the historical frequencies of individual DCs, as a single DC can signal multiple discourse relations and thus carry different semantic meanings in the PDTB. For example, the connective although had a frequency of 158 occurrences per million words in the 1880s, yet it can express relations such as Comparison, Expansion and Temporal. To estimate how often although is used with each of these meanings, we derive frequency weights from the sense distributions reported in the PDTB 3.0 manual. These weights allow us to apportion the overall historical frequency of a given DC across its different semantic uses. A detailed description of the weighting procedure is provided below, with the main steps and results summarized in Tables 1 and 2.
An example of the calculation of frequency weights for the different PDTB classes of although

Weights for the different PDTB classes of this discourse connective

Specifically, the overall frequency value of ‘although’ for each decade can be obtained from the COHA (Davies, Reference Davies2010). However, the analysis focuses on estimating the frequency of each type of ‘sense.class’ for this connective. This is calculated using the equation $ \boxed{=\mathrm{overall}\ \mathrm{frequency}\times \mathrm{weight}} $
. Specifically, the frequency of each DC in a given decade was multiplied by the relative weight of each sense, as derived from PDTB3.0, to obtain the sense-specific frequency values. Consider the overall frequency (per million words) of ‘however’ in 1900 to be 378.76. In this case, its frequency of ‘Comparison.Concession’ is 378.76 × 0.9481707 = 359.14, the one of ‘Comparison.Contrast’ is 378.76 × 0.0442 = 16.74, the one of ‘Expansion. Exception’ is 378.76 × 0.006 = 2.31 and the frequency of ‘Temporal.Synchronous’ is 378.76 × 0.0015 = 0.57.
$ \boxed{=\mathrm{overall}\ \mathrm{frequency}\times \mathrm{weight}} $
. Specifically, the frequency of each DC in a given decade was multiplied by the relative weight of each sense, as derived from PDTB3.0, to obtain the sense-specific frequency values. Consider the overall frequency (per million words) of ‘however’ in 1900 to be 378.76. In this case, its frequency of ‘Comparison.Concession’ is 378.76 × 0.9481707 = 359.14, the one of ‘Comparison.Contrast’ is 378.76 × 0.0442 = 16.74, the one of ‘Expansion. Exception’ is 378.76 × 0.006 = 2.31 and the frequency of ‘Temporal.Synchronous’ is 378.76 × 0.0015 = 0.57.
Using the COHA, we obtained relative frequency data, measured per million words, for all DCs from 1810 to 2010. As illustrated in Figure 1, an individual DC may be associated with multiple semantic classes. We therefore computed decade-level frequencies for each class by applying the corresponding frequency weights.
Additionally, DCs can be categorized into three types based on their orthographic forms. For example, ‘however’ is a monogram (i.e., unigram, consisting of a single word), ‘because of’ is a bigram (two words) and ‘as soon as’ is a trigram (three words). The number of two-word DCs in our list is 50 and that of three-word (or more) DCs is 20. The number of unigram DCs is 90. We also use the 40 most frequent DCs as a different category to make comparison at multiple levels.
Aggregating frequencies: For the frequencies derived from Google Books Corpora, we computed a single aggregate annual frequency index for each language by combining the individual standardized $ z $
-scores of all DCs. For every language
$ z $
-scores of all DCs. For every language $ L $
in a given year
$ L $
in a given year $ Y $
, the Aggregate Frequency Index (
$ Y $
, the Aggregate Frequency Index ( $ {C}_Y $
) was calculated as the arithmetic mean of the individual
$ {C}_Y $
) was calculated as the arithmetic mean of the individual $ z $
-scores (
$ z $
-scores ( $ {Z}_{i,Y} $
) across all
$ {Z}_{i,Y} $
) across all $ N $
connectives, following the formula
$ N $
connectives, following the formula $ {C}_Y=\frac{1}{N}{\sum}_{i=1}^N{Z}_{i,Y} $
. This aggregation procedure allowed us to capture the collective temporal trend across the full set of connectives, ensuring that the annual index represented the standardized and combined historical shifts observed in the data. The resulting
$ {C}_Y=\frac{1}{N}{\sum}_{i=1}^N{Z}_{i,Y} $
. This aggregation procedure allowed us to capture the collective temporal trend across the full set of connectives, ensuring that the annual index represented the standardized and combined historical shifts observed in the data. The resulting $ {C}_Y $
served as the dependent variable in the subsequent statistical analyses, including the linear regression models reported in the Section of Results.
$ {C}_Y $
served as the dependent variable in the subsequent statistical analyses, including the linear regression models reported in the Section of Results.
In contrast, using COHA data from 1820 to 2010 at decade intervals, we computed an Aggregate Frequency Index for each decade by averaging the standardized z-scores of all DCs in English. For each connective, raw frequencies were first standardized across decades. Unlike the Google Books analysis, which relied on annual data, the COHA analysis used decadal units, yielding 19 data points. The resulting index served as the dependent variable in regression analyses examining historical trends in connective usage.
Normalization: The English language data on historical frequencies come from the Google Books Corpora (Google Ngram Viewer, eng_2019) and the COHA. Data were extracted from the Google Books Corpora and normalized to yield yearly z-scores. To cross-verify these data, we used the COHA, which includes balanced genres representing real-world English usage from 1820 to 2010 and provides frequency data on individual words decade by decade. The COHA data is processed to produce a decade z-score distribution. The $ z $
-score calculation is defined as
$ z $
-score calculation is defined as
 $$ Z=\frac{x_i-\mu }{\sigma }, $$
where the mean ( $ \mu $
) and standard deviation (
$ \mu $
) and standard deviation ( $ \sigma $
) are computed across the entire two-century period for each individual
$ \sigma $
) are computed across the entire two-century period for each individual $ n $
-gram. This procedure standardizes the relative frequency over time.
$ n $
-gram. This procedure standardizes the relative frequency over time.
Linear regression: To quantify the magnitude and direction of diachronic change in DC frequency, we applied simple linear regression ( $ y=\beta x+b $
) to normalized frequency data. The dependent variable
$ y=\beta x+b $
) to normalized frequency data. The dependent variable $ y $
represents the yearly (or decadal) z-score frequency, while
$ y $
represents the yearly (or decadal) z-score frequency, while $ x $
is the temporal unit (year or decade). The coefficient
$ x $
is the temporal unit (year or decade). The coefficient $ \beta $
indicates the slope, showing how much
$ \beta $
indicates the slope, showing how much $ y $
changes with a one-unit increase in
$ y $
changes with a one-unit increase in $ x $
, and
$ x $
, and $ b $
is the intercept, representing the predicted value of
$ b $
is the intercept, representing the predicted value of $ y $
when
$ y $
when $ x=0 $
. The magnitude of the slope reflects the overall trend in frequency change over time. All raw frequency counts were first converted to z-scores to ensure comparability across n-grams and languages. The regression slope (
$ x=0 $
. The magnitude of the slope reflects the overall trend in frequency change over time. All raw frequency counts were first converted to z-scores to ensure comparability across n-grams and languages. The regression slope ( $ \beta $
) was used as an indicator of the rate and direction of change, with analyses conducted separately for distinct historically meaningful periods.
$ \beta $
) was used as an indicator of the rate and direction of change, with analyses conducted separately for distinct historically meaningful periods.
To enhance robustness, regressions were run on two subsets: one including all DCs and another restricted to high-frequency terms (top 10 per language) to minimize the influence of sparse data. The resulting $ \beta $
coefficients thus reflect the average annual change in DC frequency within each historical window. Note that the methods of aggregating frequencies, normalization and linear regression were similarly applied in other languages.
$ \beta $
coefficients thus reflect the average annual change in DC frequency within each historical window. Note that the methods of aggregating frequencies, normalization and linear regression were similarly applied in other languages.
Cross-validation: Although the Google Books Corpora offer unmatched size, the COHA is more balanced and accurately curated for historical linguistic research. These corpora enable cross-validation. We implemented several strategies to strengthen cross-validation. First, we used two subcorpora from Google Books, namely English and English Fiction, to assess the stability of results across genres. Second, we compared trends based on the 40 most frequent DCs with those obtained from the full set of DCs across the five languages. Third, we examined historical frequency changes across different semantic senses and classes of DCs, following the PDTB hierarchy, to evaluate whether trends were consistent across levels of discourse relations. This strategy was also applied to French, German and Spanish.
Additionally, for items that can function both as DCs and as other parts of speech, such as after, before and as, we included only those senses annotated as discourse-related in PDTB 3.0. Although most English DCs are classified as conjunctions or prepositions, individual connectives may be associated with multiple part-of-speech (PoS) labels, which complicates PoS-based frequency analyses. For instance, the word ‘like’ can function as a verb (e.g., ‘I like to eat fruits’), an adjective (e.g., ‘Who painted the dog’s picture?’ or ‘It’s very like’), or as a DC (e.g., ‘I felt like I’d been kicked by a camel’), where it is categorized as a conjunction. Besides, ‘like’ can also serve as a noun, or adverb. Because nondiscursive uses of such forms cannot be reliably separated from discursive ones in large, minimally annotated corpora, we exclude highly polyfunctional items such as like from our analysis.
2.3. French and German
An inventory of the most frequent DCs (n = 40, e.g., ‘sondern’, ‘weil’, ‘inzwischen’, “außerdem’) in German was derived from the Potsdam Commentary Corpus (https://angcl.ling.uni-potsdam.de/resources/pcc.html). In addition, a complete list of DCs in German (n = 135) was obtained from Connective-Lex.info (Stede et al., Reference Stede, Scheffler and Mendes2019). In the two databases (the Potsdam Commentary Corpus and Connective-Lex.info), the PDTB-style annotations were adopted, which means we can classify these German DCs into the four senses that we used when investigating the English language. After obtaining a list of DCs, we extracted their historical frequency data from the Google Books Corpora (Google Ngram Viewer, ger_2019). Given that a German historical corpus with the balanced sampling of the COHA is currently unavailable, our longitudinal analysis relies exclusively on the Google Ngram dataset.
Similarly, an inventory of the most frequent DCs (n = 40, e.g., ‘et même’, ‘ensuite’, ‘comme pour’) in French was derived from the ConcoLeDisCo corpus. A complete list of DCs (n = 175) is also available from Connective-Lex.info. Both French resources adopt PDTB-style annotations, allowing French DCs to be classified according to the same four semantic senses used for English. However, historical frequency data for French could be obtained only from the Google Books Corpora (Google Ngram Viewer, fre_2019) as no historical corpus comparable to the COHA is currently available for French to support cross-verification. Despite this limitation, we conducted extensive cross-validation by comparing results based on the full DC inventory and the subset of the 40 most frequent DCs, as well as by examining trends across different semantic senses and across languages.
The frequency data derived from the Google Books Corpora on French and German were also processed to yield a distribution of a yearly z-scores from 1800 to 2019 for each year. The same normalization procedure was applied to the Spanish and Chinese data, ensuring that all historical frequency measures are expressed as yearly z-scores. In contrast to English, the available discourse-annotated corpora for French and German do not provide sufficiently detailed frequency information for different classes of DCs. As a result, we were unable to compute class-level frequency weights comparable to those used for English. Accordingly, for German and French, our analyses focus on historical changes at the level of DC senses rather than at the more fine-grained class level.
2.4. Spanish and Chinese
To date, we are not aware of any Spanish discourse corpora with systematic annotations of DCs comparable to PDTB-style resources, nor of databases from which a comprehensive inventory of Spanish DCs could be extracted. In addition, we found no large-scale diachronic studies focusing specifically on DCs in Spanish. Accordingly, rather than attempting to compile an exhaustive list, we extracted an inventory of the 40 most frequent DCs based on existing descriptive studies (e.g., ‘por ejemplo’, ‘en cambio’, ‘de ahı’) (Durán, Reference Durán2001; Sáez, Reference Sáez, Matilde, Pueo and Luz2003). Historical frequency data for these Spanish DCs were obtained from the Google Books Corpora (Google Ngram Viewer, spa_2019).
Regarding the Chinese language, we extracted a comprehensive inventory of DCs from the Chinese Discourse Treebank (i.e., CDTB; Zhou & Xue, Reference Zhou and Xue2015). To facilitate cross-lingual comparison, we also identified a subset of the 40 most frequent Chinese DCs (e.g., 因为, 不管, 但是). Because the CDTB lacks class-level frequency data for DCs, we analyze diachronic change in Chinese at the level of DC senses rather than classes. Historical frequency data were obtained from the Google Books Corpora (i.e., Ngram Viewer, chn_sim_2019). Nevertheless, the Chinese frequency data in the present study begin in the 1920s, reflecting the gradual establishment of Modern Chinese as the dominant written form. In contrast to English, French, German and Spanish, the historical development of Chinese over the past two centuries has involved a major transition in written language. Classical Chinese refers to the written language used from the late Han dynasty until the early twentieth century, when it was progressively replaced by vernacular written Chinese. During the transitional period between approximately 1920 and 1950, both classical and vernacular forms coexisted in written texts. Following the promotion of pŭtōnghuà (standardized vernacular Chinese) after 1955, vernacular written Chinese became dominant (Norman, Reference Norman1988). Because DCs in Classical Chinese differ substantially from those in Modern Chinese, our analysis of Chinese DC frequency changes is restricted to the period from the 1920s onward.
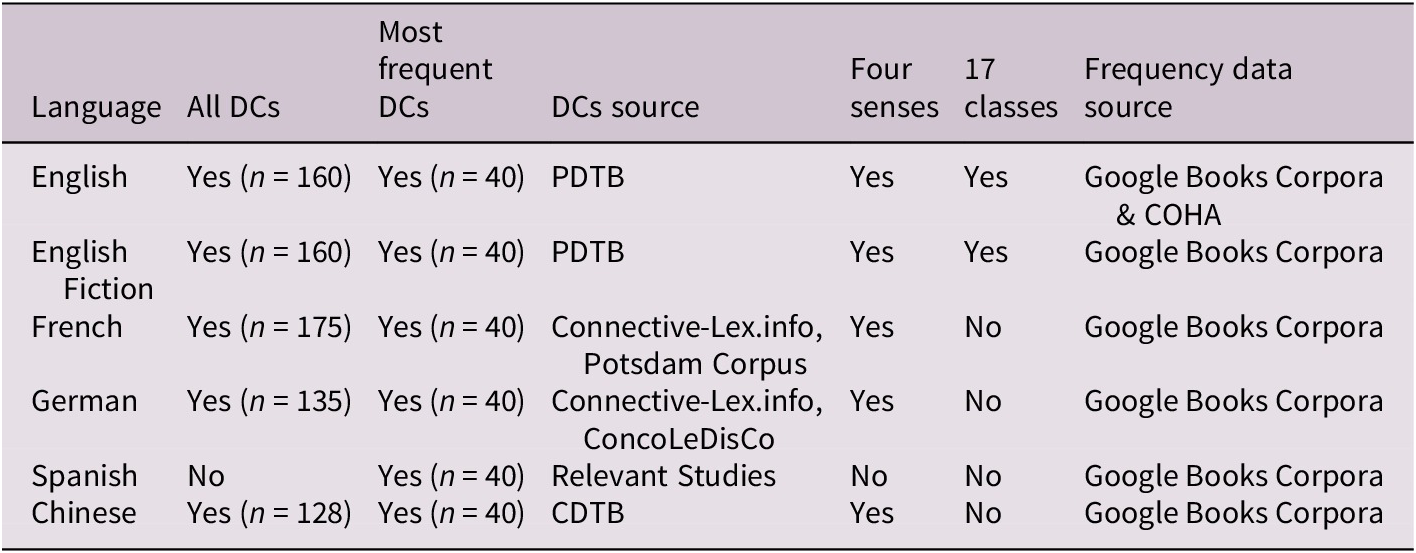
Table 3 overviews the materials we used in the current study. All data, code and list of DCs for different languages are available at https://github.com/fivehills/HisDisCon.
Languages, DCs and data sources
2.5. Complementary method of cross-validation
To cross-validate the historical changes in DCs and test whether their trend reflects a broader stylistic shift toward colloquialization or cognitive decline, we conducted four complementary tests tracking independent linguistic features that serve as stylistic proxies. These tests used the same historical corpora (the COHA for English; Google Books Corpora for English, French, German and Spanish) and time periods as our main DC analysis.
The first test examined personal pronoun frequency (involvement markers). Colloquial discourse is characterized by high personal involvement and direct address to the audience. We tracked the combined frequency of first- and second-person pronouns (I, we, you, your, our, my, me, us) per million words from the COHA. An increase in these pronouns would support colloquialization, as formal academic and professional writing historically avoided first-person reference and direct reader address (Hyland & Jiang, Reference Hyland and Jiang2017).
The second test analyzed nominalization frequency (syntactic density). Formal, academic style relies heavily on nominalization, that is, the conversion of verbal or adjectival concepts into noun phrases (e.g., ‘investigate’ $ \to $
‘investigation’). We tracked nominalization frequency by measuring the combined occurrence of common nominalizing suffixes: -tion, -sion, -ment, -ity, -ness, -ance, -ence per million words from the COHA. A decline in nominalization would indicate a shift away from the dense, noun-heavy style characteristic of formal writing (Biber & Gray, Reference Biber and Gray2010).
$ \to $
‘investigation’). We tracked nominalization frequency by measuring the combined occurrence of common nominalizing suffixes: -tion, -sion, -ment, -ity, -ness, -ance, -ence per million words from the COHA. A decline in nominalization would indicate a shift away from the dense, noun-heavy style characteristic of formal writing (Biber & Gray, Reference Biber and Gray2010).
The third test evaluated colloquial DM frequency. Beyond the comprehensive list of DCs, we specifically tracked two canonical colloquial DMs that are frequent in spoken language but traditionally avoided in formal writing: ‘so’ (when used as a causal/consecutive DM) and ‘well’ (when used as a DM indicating hesitation, topic shift or speaker stance). These markers represent the type of pragmatic linkers associated with conversational style (Aijmer, Reference Aijmer2002). An increase in their frequency would directly support colloquialization.
The fourth test assessed sentence length (via sentential-final punctuation). Colloquial style favors shorter, less complex sentences compared to the elaborate, multiclause constructions of formal writing. We used the frequency of sentential-final punctuation marks (periods, exclamation marks and question marks) as a proxy for sentence length across English, French, German and Spanish from Google Books Corpora, with higher punctuation frequency indicating shorter average sentence length. This approach has been validated in previous studies of historical language change (Hundt et al., Reference Hundt, Denison and Schneider2012; Liberman, Reference Liberman2011).
As for data processing and analysis, we extracted yearly or decadal frequency data normalized per million words, then converted these to z-scores for cross-lingual and cross-measure comparison. We applied simple linear regression ( $ y=\beta x+b $
) to assess overall trends, where y represents the standardized frequency (z-score), x represents year/decade,
$ y=\beta x+b $
) to assess overall trends, where y represents the standardized frequency (z-score), x represents year/decade, $ \beta $
represents the slope (rate of change), and b represents the intercept. Statistical significance was determined at p
$ \beta $
represents the slope (rate of change), and b represents the intercept. Statistical significance was determined at p $ < $
0.001.
$ < $
0.001.
If the decline in DCs reflects colloquialization rather than cognitive decline, these four independent measures should show consistent patterns: (1) increasing personal pronouns, (2) decreasing nominalization, (3) increasing colloquial DMs and (4) decreasing sentence length (increasing punctuation frequency). Convergent evidence across all measures would strongly support the stylistic rather than cognitive interpretation of our DC findings.
2.6. Data robustness and methodological limitations
This study relies on the Google Books Corpora for their unparalleled temporal coverage, but their use requires careful interpretation. A well-documented limitation concerns the misdating of reprinted materials, particularly after 2004, which may artificially inflate frequency estimates in the later period. To assess the robustness of our findings, English results derived from Google Books Corpora were cross-validated against the COHA, which applies stricter controls on publication dates and genre balance.
A further limitation concerns the granularity of cross-linguistic comparison. For English, the availability of the PDTB provides fine-grained semantic class frequency information, enabling frequency weighting across 17 semantic classes to account for connective polysemy. In contrast, comparable large-scale discourse corpora for French, German and Chinese lack sufficiently detailed class-level frequency data, precluding the computation of comparable class-level weights. As a result, cross-lingual analyses are necessarily restricted to aggregate, normalized frequency trends of DCs, or to their most frequent subsets, and to coarse-grained semantic categories (the four PDTB discourse-relation senses: Comparison, Contingency, Expansion and Temporal). Semantic analyses at the fine–coarse type level are therefore confined to English, while cross-lingual comparisons focus on broad frequency dynamics within the constraints imposed by current resource availability.
3. Results
3.1. English
English DCs exhibit a robust long-term decline across corpora and genres. Figure 2a illustrates the results from the data derived from Google Books Corpora. Specifically, ‘English’ and ‘English fiction’ underwent a significant decline in their frequencies. In each case, we also examined all the DCs and the 40 most frequent ones.
Comparison of English DCs across corpora. (a) Google Books Corpora; (b) the COHA. Note: When the p-value is smaller than 0.0001, we use $ \ast \ast \ast $
to indicate that it is highly significant. (a) English and English fiction from the Google Books Corpora exhibit similar trends. A curve denotes the linear regression. The slope and p-value in the legend text represent the simple linear regression model results. Here ‘EngFic_All’ represents all DCs in English Fiction from the Google Books Corpora. ‘EngFic_Mostfreq’ represents the 40 most frequent DCs in English Fiction in data obtained from the Google Books Corpora. ‘Eng_All’ represents all DCs. ‘Eng_Mostfreq’ represents the 40 most frequent DCs. (b) All the English DCs and the most frequent ones from the COHA exhibit similar trends. In Panels (a) and (b), the x-axis represents the year, and the y-axis represents the scaled normalized frequency data (z-score for each decade). The y-axis in Figures 1 and 2 represents the scaled normalized frequency. The slope and p-value in the legend text represent the simple linear regression results. Here ‘All DCs’ represents all the DCs. ‘Mostfreq DCs’ represents the 40 most frequent DCs.
$ \ast \ast \ast $
to indicate that it is highly significant. (a) English and English fiction from the Google Books Corpora exhibit similar trends. A curve denotes the linear regression. The slope and p-value in the legend text represent the simple linear regression model results. Here ‘EngFic_All’ represents all DCs in English Fiction from the Google Books Corpora. ‘EngFic_Mostfreq’ represents the 40 most frequent DCs in English Fiction in data obtained from the Google Books Corpora. ‘Eng_All’ represents all DCs. ‘Eng_Mostfreq’ represents the 40 most frequent DCs. (b) All the English DCs and the most frequent ones from the COHA exhibit similar trends. In Panels (a) and (b), the x-axis represents the year, and the y-axis represents the scaled normalized frequency data (z-score for each decade). The y-axis in Figures 1 and 2 represents the scaled normalized frequency. The slope and p-value in the legend text represent the simple linear regression results. Here ‘All DCs’ represents all the DCs. ‘Mostfreq DCs’ represents the 40 most frequent DCs.

In Figure 2a, all four curves show significant negative slopes (p-value $ < $
0.0001), indicating a substantial long-term decline in the use of explicit DCs in English over the last two centuries. Nevertheless, the four cases presented in Panel (a) display a pronounced increase after 2000, while the overall shapes of the curves remain highly consistent across cases within this panel.
$ < $
0.0001), indicating a substantial long-term decline in the use of explicit DCs in English over the last two centuries. Nevertheless, the four cases presented in Panel (a) display a pronounced increase after 2000, while the overall shapes of the curves remain highly consistent across cases within this panel.
Next, we visualized the historical changes in the frequencies of DCs extracted from the COHA, as shown in Figure 2b. Two analyses are presented: one based on the full set of DCs and the other restricted to the 40 most frequent connectives. In both cases, the regression analyses yield significant negative slopes (approximately –0.015, p $ < $
0.001), indicating a consistent long-term decline in DC usage. The close similarity of these trends across the two analyses provides cross-validation and further supports the robustness of the observed pattern.
$ < $
0.001), indicating a consistent long-term decline in DC usage. The close similarity of these trends across the two analyses provides cross-validation and further supports the robustness of the observed pattern.
Considered jointly, Figures 2a and 2b show strong consistency in both curve shape and regression slope, with estimated values of approximately $ \beta =-0.015 $
. Although the four cases presented in Panel (a) display a pronounced increase after 2000, the corresponding curves in Panel (b) exhibit only a modest post-2000 rise. Despite these recent divergences, the estimated slopes across all curves in both panels remain highly similar, at approximately –0.015, with consistently small p-values (p
$ \beta =-0.015 $
. Although the four cases presented in Panel (a) display a pronounced increase after 2000, the corresponding curves in Panel (b) exhibit only a modest post-2000 rise. Despite these recent divergences, the estimated slopes across all curves in both panels remain highly similar, at approximately –0.015, with consistently small p-values (p $ < $
0.0001). To sum up, these results indicate close agreement between the Google Books Corpora and the COHA, providing convergent evidence that the observed long-term trends are robust across data sources.
$ < $
0.0001). To sum up, these results indicate close agreement between the Google Books Corpora and the COHA, providing convergent evidence that the observed long-term trends are robust across data sources.
Additionally, we analyze historical frequency changes of DCs in the Google Books Corpora, classified by the four PDTB senses and 17 fine-grained semantic classes, as described in the Methods Section. The results for the four senses are shown in Figure 3 (together with other languages), while the results for the 17 fine-grained classes are summarized in Table 4. Due to space limits, we have put the results on four senses and 17 classes based on the COHA in the Supplementary Material (Section 1 of the Supplementary Material). When considered together, the historical trends observed for both the four senses and the 17 classes are broadly consistent across the Google Books Corpora and the COHA. In summary, these converging patterns indicate that both overall frequency changes and sense- or class-specific trends in DC usage can be cross-validated across corpora, further supporting the robustness of our findings on long-term diachronic change.
Cross-lingual decline in DC frequency across English, French, German and Spanish, shown for aggregate and sense-based measures (1800–2000). Here the y-axis represents the scaled normalized frequency (yearly z-score). The p-value in the legend text represents the simple linear regression model result. Specifically, when the p-value is smaller than 0.0001, we use ‘***’ to indicate that it is highly significant. The two plots in the first row represent the 40 most frequent DCs and the overall cases, while the four plots at the bottom display the cases categorized by four PDTB-style senses. Eng = English; Fre = French; Ger = German; Spa = Spanish.

Different types of relations in the PDTB3.0 and their historical changes
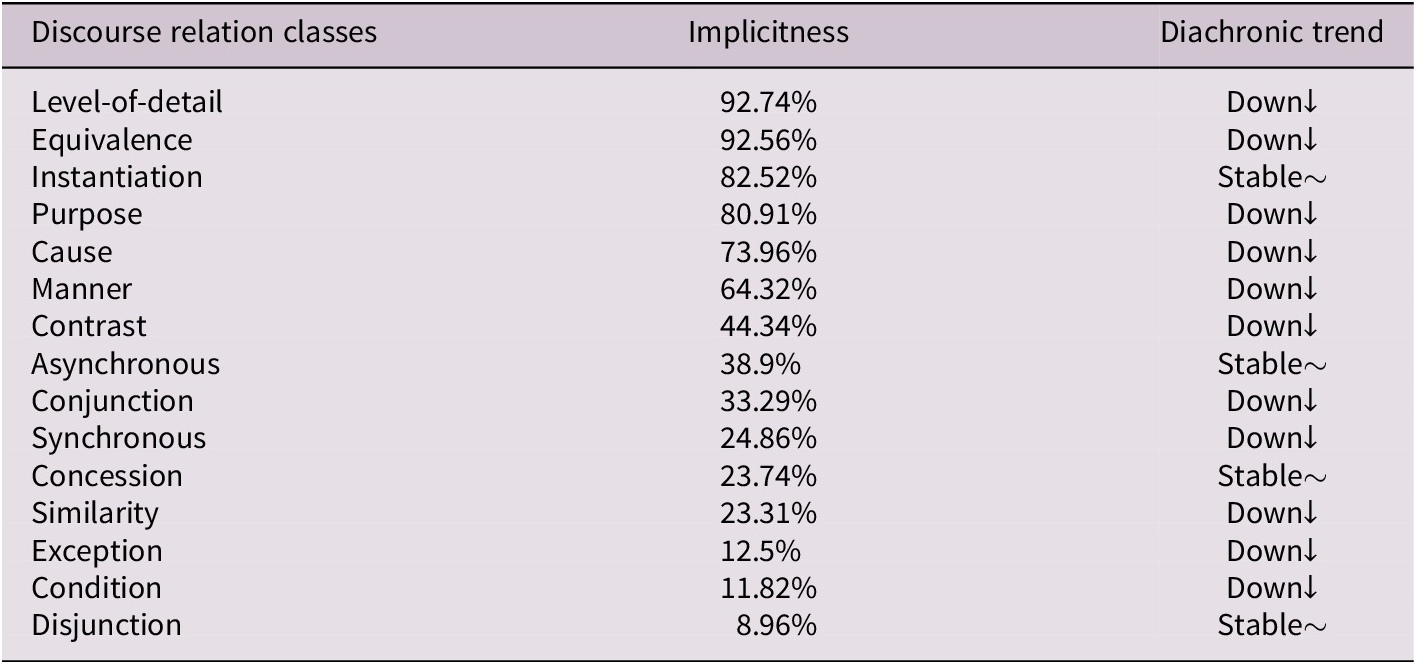
This analysis involves an important concept, namely implicitness. Implicitness is defined as the proportion of implicit discourse relations relative to the total frequency of a given relation (Asr & Demberg, Reference Asr and Demberg2012). A high level of implicitness indicates that language users rely less on explicit DCs to signal a particular relation. By contrast, relations with low implicitness tend to require explicit marking to ensure successful interpretation. For example, adversative relations often demand clearer cues to support comprehension, which explains why relations such as concession, condition and exception typically exhibit low implicitness. Explicit DCs are crucial for maintaining textual coherence, especially when expressing complex relationships between ideas. They are especially important for signaling low-implicitness relations that are not easily recovered from context alone. This observation suggests that explicit DCs facilitate clarity and interpretability in discourse, especially for relations that require explicit guidance. However, as shown in Table 4, the historical record reveals a general decline in the use of explicit forms for these discourse relations. With the exception of four relatively stable cases (marked as the red color), the majority of the 15 discourse classes (11/15) in English exhibit decreasing frequency trends over time.
3.2. French, German and Spanish
We analyze English, French, German and Spanish together to determine whether they exhibit similar patterns of change. To accomplish this, we investigated two different cases. First, we examined the changes by observing all DCs, as well as the 40 most frequent ones across these languages. Second, we assessed changes in DC frequencies by employing the four senses of discourse relations in the PDTB style. Both setups mirror those adopted in the preceding section, ensuring methodological consistency across analyses.
The results are illustrated in Figure 3. The panel labeled ‘Most frequent (40)’ illustrates the historical frequency changes of the 40 most frequent DCs in English, French, German and Spanish over the past two centuries. This panel reveals striking similarities in diachronic trends across the four languages. The panel labeled ‘All DCs’ shows frequency changes for the complete set of DCs in English, French and German. In terms of both curve shape and negative slope, the patterns observed in these two panels closely mirror those reported in Figures 2a and 2b, indicating a high degree of consistency across analyses and datasets. The German data exhibit a consistent long-term downward trend, as indicated by a significant negative slope. However, the diachronic pattern in German differs from that of the other languages. Specifically, the marked decline in the German aggregate frequency appears to have begun earlier, during the nineteenth century, whereas English and the Romance languages show a later and more gradual decrease over time.
In addition, the four panels labeled with the coarse-grained semantic categories Comparison, Contingency, Expansion and Temporal in Figure 3 illustrate diachronic changes in the four PDTB discourse-relation senses over the past two centuries in English, French and German. Across all panels, the patterns of change are broadly similar across the three languages. First, simple linear regression analyses indicate that all cases exhibit significant long-term declines, with p-values below 0.0001. Second, during the early period from 1800 to 1850, all three languages show an initial increase in DC frequencies, followed by a clear and sustained decline after 1850. By contrast, frequencies rise again after 2000, with the post-2000 increase being more pronounced in French and German than in English.
3.3. Chinese
Although Chinese was initially deemed unsuitable for inclusion due to substantial linguistic and stylistic shifts over the observed time span, we still incorporated it as a control case. The historical transition from Classical to Vernacular Chinese renders its data incomparable to Indo-European languages in studying DCs. However, the Chinese data indicate that the frequency of DCs reflects social change rather than the decline predicted by the cognitive decline hypothesis (Scheffer et al., Reference Scheffer, van de Leemput, Weinans and Bollen2021). This divergent trend suggests that reductions in explicit coherence marking are unlikely to reflect a universal cognitive phenomenon but one rooted in the specific socio-cultural and linguistic context of Indo-European languages, thereby reinforcing our argument that the primary driver is stylistic change rather than diminished logical capacity.
The changes in Chinese align closely with historical developments. As mentioned in the section on methods and materials, the modern written form of Chinese has been dominant since 1955. A mixture of modern Chinese and Classical Chinese was used between 1920 and 1955. Before 1920, the use of Classical Chinese was predominant in writing. We used DCs from Modern Chinese to explore how their frequencies have changed. During this period between 1920 and 1950, the use of Modern Chinese DCs began to increase but then increased dramatically after 1950. Some given DCs used in Classical Chinese, but not in Modern Chinese, are not represented in our data. How these connectives changed in Classical Chinese remains unclear. Nevertheless, shifts in the frequency of DCs in Modern Chinese can be observed quite clearly. Despite this, the use of DCs from Classical Chinese has gradually diminished, especially following the widespread adoption of Modern Chinese after the 1950s. The observed changes in DC usage during this period coincide with major reforms in the Chinese language and writing system, as well as with significant historical events over the last century.
The left panel in Figure 4 clearly demonstrates these changes from 1920 to 1950s. During the period, the use of DCs gradually became more popular in Modern Chinese. Nevertheless, frequencies declined sharply after 1960, as indicated by a sustained negative slope in the regression analysis. This shift may reflect changes in publishing practices during the Cultural Revolution and related political campaigns in China. During this period, published materials may have become more homogeneous, which could have affected the frequency distribution of discourse connectives in the corpus. Mass-distributed publications of this era often prioritized the dissemination of ideological doctrine over structural cohesion. For instance, Mao’s Little Red Book, a compilation of fragmented quotations of Chairman Mao, frequently lacks the discursive coherence and explicit logical signaling characteristic of conventional prose (Ji, Reference Ji2003). As a result, DCs might have been largely overlooked. This change is reflected in the data shown in the right panel of Figure 4. After the ‘Cultural Revolution’ ended in 1976, China underwent political, social and economic reforms. The diversity of books and the book market began to prioritize coherence and readability to appeal to readers. Consequently, DCs were increasingly used to enhance text cohesion, leading to a dramatic rise in their frequency. By the 1980s, these changes had stabilized. The difference is that since the year 2000, the frequencies were subject to relatively stable fluctuations. By contrast, there is a more obvious increase in English, French, German and Spanish since the year 2000.
Historical changes in DC frequencies in Chinese. Here, the y-axis represents the scaled normalized frequency (yearly z-score). ‘Chn_All’ $ = $
All the DCs in Chinese, ‘Chn_mostfreq’
$ = $
All the DCs in Chinese, ‘Chn_mostfreq’ $ = $
the 40 most frequent DCs in Chinese. The time span in the left panel is from 1920 to 2009, and that in the right panel is from 1950 to 2009.
$ = $
the 40 most frequent DCs in Chinese. The time span in the left panel is from 1920 to 2009, and that in the right panel is from 1950 to 2009.

3.4. Decline of DCs and cognitive default
Our results reveal a robust long-term decline in the use of DCs in English, French, German and Spanish over the last two centuries. The observed historical shifts in DC usage are consistent with prior research and theoretical expectations concerning the implicitness and explicitness of discourse relations. In particular, connectives expressing causal and expansion relations tend to be more readily inferred and thus are often implicit in human cognitive processing, whereas adversative and asynchronous relations are more likely to require explicit marking. As shown in Table 4, relations such as concession and disjunction remain relatively stable in their frequency trends. These relations typically rely on explicit connectives, and a substantial reduction in their overt marking could increase ambiguity or vagueness in discourse. Their stability therefore suggests functional constraints on how far explicit marking can be reduced without compromising communicative clarity.
These data further support the argument that discourse relations are increasingly left implicit, as noted in Section 3.1. Our findings suggest that English language users have historically relied less on explicit Expansion connectives. Because Expansion and Causation relations are among the more frequent discourse relations overall, they are often treated as default interpretations in discourse. When language users find that half of discourse relations are either expansion or causation, this high probability encourages them to assume that two discourse units are likely linked by one of these relations, resulting in reduced reliance on explicit connectives for these types. Our historical data confirms that English users have employed these connectives less frequently, with three exceptions: ‘instantiation’ and ‘disjunction’ under Expansion, and ‘concession’ under Comparison. The reasons for the stable frequencies of these exceptions remain unclear. For specific frequency changes of DC classes in the COHA, please see Section 1 of the Supplementary Material.
Although a decrease can be found with respect to these DCs, there was an overall downward tendency in the four types of DCs (12 classes) regardless of their meanings (more details are seen in the Section 1 of the Supplementary Material). Additionally, Biber and Gray (Reference Biber and Gray2010) found there is also evidence that the discourse style of English academic texts is moving toward a less explicit marking of meaning relations generally, which is consistent with that in the present study. They found that linking adverbials was quite common in English academic writings in the eighteenth and nineteenth centuries, but these linking adverbials underwent a rapid decrease in their use in the twentieth century.
Additionally, the uptick in DC frequency after 2004 in the Google Books Corpora data is likely a corpus artifact. This reversal is absent in the curated COHA corpus (see Figure 2a, where the COHA ends around 2000 in Figure 2b), indicating that it results from changes in the Google Books Corpora composition. The inclusion of noncanonical sources in the twenty-first century (e.g., digitized web content, unedited media and transcripts) likely introduced informal text that inflated frequency counts beyond what formal written prose would exhibit. Similar patterns appear in the French and German data (see Figure 3), where DC frequencies also accelerate around 2000. One plausible cause is the misdating of reprinted books added after 2004, leading older publications to be erroneously counted as recent. This distortion produces artificial spikes that do not reflect genuine linguistic or cultural trends. Misdating thus accounts for the apparent surge in DC usage during this period. Nonetheless, Google Books data prior to 2004 remain largely reliable. Accordingly, we excluded post-2004 data from our main analysis and focus on the robust long-term decline from 1800 to 2000. The consistency of this decline across both the Google Books Corpora and the COHA confirms it as a genuine diachronic trend supporting the colloquialization hypothesis.
Researchers using the Google Books Corpora should be aware of this issue and consider strategies to mitigate its effects, such as cross-validating data with other corpora (Younes & Reips, Reference Younes and Reips2019). We have employed various corpora to address these concerns. By cross-validating across multiple datasets, we increase confidence in the robustness of our results. The direct evidence for this observation lies in the trend based on data derived from the COHA, a balanced corpus in English, which is consistent with the trends observed in Google Corpora prior to 2004. As mentioned in the Methods Section, the data from the two databases can be cross-verified with each other (Figures 2a and 2b). Another piece of evidence is that the subcorpus of Google Books labeled ‘English Fiction’ exhibits the same trend as the entire Google Books Corpora. This suggests that the erroneous inclusion of reprinted books after 2004 occurred across various genres, including both fiction and nonfiction. More importantly, the trends for each class of DCs (17 classes in the PDTB hierarchy) based on Google Corpora are generally consistent with those from the COHA (see Section 1). Furthermore, four additional tests reported in Section 3.5, together with complementary cultural–social evidence in the Supplementary Material, cross-validate the DC frequency results derived from the Google Books corpora and COHA. The statistical analyses and main conclusions are conservatively restricted to the 1800–2000 period, ensuring that evidence is robust. Overall, all of these provide strong evidence that our results are reliable.
As noted in the Introduction section, the hypothesis of the ‘Rise of DMs’ has gained increasing attention. This view, however, may create the false impression that the use of DCs has steadily increased over time. In contrast, our data show a significant long-term decline in DC frequency over the last two centuries, followed by a modest rebound beginning in the 1980s and a sharper increase after 2000 in four European languages, although the latter pattern may be influenced in part by corpus-related artifacts. As discussed earlier, DCs constitute a core subset of DMs. Therefore, our findings do not necessarily support the hypothesis of a ‘rise of DMs’. Further discussion is provided in Section 4.
3.5. Results of the cross-validated tests
To cross-validate our interpretation that the decline in DCs reflects stylistic colloquialization rather than cognitive decline, we examined multiple independent linguistic features across the same historical period. All analyses yielded patterns strongly consistent with the colloquialization hypothesis.
First, personal pronouns (first- and second-person) increased significantly across all examined languages. In English (COHA data), pronoun frequency showed a marked upward trend ( $ \beta $
= +0.014, p
$ \beta $
= +0.014, p $ < $
0.0001), indicating greater personal involvement and directness characteristic of informal discourse.
$ < $
0.0001), indicating greater personal involvement and directness characteristic of informal discourse.
Second, nominalizations exhibited a clear declining trend. In English, the frequency of nominalizing suffixes (-tion, -ment, -ity, etc.) decreased significantly from 1820 to 2010 ( $ \beta $
=
$ \beta $
= $ - $
0.013,
$ - $
0.013, $ p $
$ p $ $ < $
0.001), reflecting a shift away from the syntactically dense style of formal academic writing.
$ < $
0.001), reflecting a shift away from the syntactically dense style of formal academic writing.
Third, colloquial DMs showed substantial increases. The DM well increased dramatically ( $ \beta $
= +0.018, p
$ \beta $
= +0.018, p $ < $
0.0001), as did causal so (
$ < $
0.0001), as did causal so ( $ \beta $
= +0.015, p
$ \beta $
= +0.015, p $ < $
0.0001). These markers are strongly associated with conversational style and were historically avoided in formal writing. The trends of the three measures are illustrated in Figure 5.
$ < $
0.0001). These markers are strongly associated with conversational style and were historically avoided in formal writing. The trends of the three measures are illustrated in Figure 5.
Systemic colloquialization in American English (1820–2010). Five independent linguistic features show convergent trends reflecting a shift from formal to informal register. Top panel: Declining formal features include DCs (n = 160) (red circles, $ \beta $
=
$ \beta $
= $ - $
0.016, p
$ - $
0.016, p $ < $
0.0001) and nominalizations (n = 7) (purple squares,
$ < $
0.0001) and nominalizations (n = 7) (purple squares, $ \beta $
=
$ \beta $
= $ - $
0.015, p
$ - $
0.015, p $ < $
0.0001). Bottom panel: Rising informal features include first-person pronouns (n = 8) (pink circles,
$ < $
0.0001). Bottom panel: Rising informal features include first-person pronouns (n = 8) (pink circles, $ \beta $
= +0.014), second-person pronouns (n = 2) (blue squares,
$ \beta $
= +0.014), second-person pronouns (n = 2) (blue squares, $ \beta $
= +0.017), DM well (green triangles,
$ \beta $
= +0.017), DM well (green triangles, $ \beta $
= +0.018), and DM so (orange diamonds,
$ \beta $
= +0.018), and DM so (orange diamonds, $ \beta $
= +0.015; all p
$ \beta $
= +0.015; all p $ < $
0.0001). The opposing trajectories (average correlation
$ < $
0.0001). The opposing trajectories (average correlation $ \rho $
=
$ \rho $
= $ - $
0.88) and strong within-category correlations (formal:
$ - $
0.88) and strong within-category correlations (formal: $ \rho $
= 0.89; informal:
$ \rho $
= 0.89; informal: $ \rho $
= 0.85) indicate a unified register transformation rather than isolated changes. Distinct colors and marker styles enhance visual accessibility. All frequencies normalized to z-scores. Source: COHA, 1820–2010.
$ \rho $
= 0.85) indicate a unified register transformation rather than isolated changes. Distinct colors and marker styles enhance visual accessibility. All frequencies normalized to z-scores. Source: COHA, 1820–2010.

Finally, sentence length decreased significantly over time, as evidenced by increasing frequencies of sentential-final punctuation marks across all four languages (English: $ \beta $
= +0.014, p
$ \beta $
= +0.014, p $ < $
0.0001; French: slope = +0.012, p
$ < $
0.0001; French: slope = +0.012, p $ < $
0.0001; German:
$ < $
0.0001; German: $ \beta $
= +0.008, p
$ \beta $
= +0.008, p $ < $
0.0001; Spanish:
$ < $
0.0001; Spanish: $ \beta $
= +0.010, p
$ \beta $
= +0.010, p $ < $
0.0001). Higher punctuation frequency indicates shorter, simpler sentences typical of colloquial style. The historical changes in sentential-final punctuation marks are shown in Figure 6.
$ < $
0.0001). Higher punctuation frequency indicates shorter, simpler sentences typical of colloquial style. The historical changes in sentential-final punctuation marks are shown in Figure 6.
Historical changes in sentential-final punctuation marks in English, French, German and Spanish. The sentential-final punctuation marks include periods, exclamation marks and question marks. The y-axis represents the z-scores of frequencies. An increase of sentential-final punctuation marks indicates a shorter sentence length. The simple linear regression analysis result is shown in the legend text of each panel. When the p-value is smaller than 0.0001, we use ‘***’ to indicate that it is highly significant.

Furthermore, these measures showed strong intercorrelations, indicating they reflect a unified stylistic transformation rather than independent changes. Formal features (DCs and nominalizations) were highly correlated ( $ \rho $
= 0.89, p
$ \rho $
= 0.89, p $ < $
0.0001), as were informal features (personal pronouns and colloquial DMs:
$ < $
0.0001), as were informal features (personal pronouns and colloquial DMs: $ \rho $
= 0.87, p
$ \rho $
= 0.87, p $ < $
0.0001). Formal and informal features showed strong negative correlations (
$ < $
0.0001). Formal and informal features showed strong negative correlations ( $ \rho $
=
$ \rho $
= $ - $
0.85 to
$ - $
0.85 to $ - $
0.92, all p
$ - $
0.92, all p $ < $
0.0001), confirming a bidirectional stylistic shift.
$ < $
0.0001), confirming a bidirectional stylistic shift.
4. Discussion
In this section, we further explore the primary factors contributing to these diachronic changes. Our results indicate that the frequencies of DCs in English, French, German and Spanish have declined significantly over the last two hundred years, whereas the historical pattern for Chinese appears more complex and heterogeneous. Importantly, the observed changes in DC frequency provide little support for the hypothesis that these trends are driven primarily by shifts in human cognitive abilities.
Although the decline in DC frequency is noteworthy, it does not by itself constitute sufficient evidence for a stylistic shift. The strength of the present study lies instead in the convergence of evidence across five independent indicators of textual style. In the English data, the long-term decrease in DC frequency systematically co-occurs with (1) an increase in personal pronoun use, reflecting a less formal narrative voice; (2) a decline in nominalization, indicating a move away from academic or bureaucratic style; (3) an increase in colloquial DMs and (4) a reduction in average sentence length. Collectively, these mutually reinforcing trends across all five metrics provide the main empirical basis for rejecting the cognitive hypothesis, which attributes the change to a decline in human rationality, and for supporting the ‘colloquialization’ hypothesis, which posits a gradual shift toward a more personal, informal and speech-like written style over the last two centuries. These results highlight the importance of stylistic and communicative developments in written discourse, suggesting that changes in textual conventions and pragmatic norms, rather than fundamental cognitive evolution, better account for the observed patterns across languages.
4.1. The impacts of the ‘colloquialization’ trend
Researchers increasingly use ‘culturomics’ to draw a big picture in investigating human cognition evolution and social shifts (DeDeo, Reference DeDeo2022). For instance, Scheffer et al. (Reference Scheffer, van de Leemput, Weinans and Bollen2021) found that the ratio of emotion words to fact-related words has dropped, while emotionally laden language has surged. Another study (Iliev & Axelrod, Reference Iliev and Axelrod2016) employed a similar method and found a historical increase in the use of causal linguistic expressions. Similarly, the distinction between rational and emotional words in the study of Scheffer et al. (Reference Scheffer, van de Leemput, Weinans and Bollen2021) may partially overlap with the contrast between more formal and more informal lexical styles, but the two distinctions should not be treated as equivalent. Even so, the historical trajectories of rational/emotional vocabulary appear to parallel those of formal/informal vocabulary, which (Sun, Reference Sun2022) interprets in terms of colloquialization.
Colloquialization is the process of making written language more informal and conversational, similar to spoken language. It involves using colloquial expressions, contractions and personal pronouns, making written communication more casual and speech-like. Numerous recent studies have identified a trend toward colloquialization in the development of language (Leech, Reference Leech, Aijmer and Altenberg2004). A significant stylistic shift is due to the way in which written language has become more similar to spoken language and more tolerant of various degrees of informality (Hiltunen et al., Reference Hiltunen, Räikkönen and Tyrkkö2020; Hyland & Jiang, Reference Hyland and Jiang2017). Such a colloquialization trend has also been found in other languages (Hummel et al., Reference Hummel, Chircu, Sánchez, García-Hernández, Koch, Porcel and Wissner2019; Pi, Reference Pi2020).
The trend of colloquialization effectively explains changes in the frequency of DCs. As written language increasingly resembles spoken language, speakers tend to use fewer DCs. This shift occurs primarily because speech and speech-oriented texts do not require the same level of DCs to convey meaning and maintain coherence. DCs range in formality from formal to neutral to informal. For example, nevertheless and consequently are formal, because and but are neutral and anyway and plus are informal. Historically, the use of formal DCs (including neutral DCs) has decreased, whereas informal ones have seen an increase in frequency (the details are seen in Supplementary Section 2.1 and Supplementary Figure 8). This evidence aligns with the trend of colloquialization, suggesting that it has differentially influenced the changes in these connectives. In summary, the colloquialization trend allows language users to reduce their use of formal and neutral DCs but increase the use of informal connectives.
4.2. Other evidence
Our cross-validated tests provide converging evidence that the observed decline in DCs reflects a systemic shift in written register toward colloquial norms, rather than cognitive decline. Correlation analyses across formal and informal features (Figure 5) reveal consistently strong inverse associations. In particular, the synchronous decline in formal syntactic density (nominalization) and the rise in personal involvement markers (especially second-person pronouns) and pragmatic DMs (well, so) provide robust internal evidence from a single corpus (COHA, 1820–2010) that the reduction in DC use is not an isolated lexical phenomenon. Instead, the strong negative correlations between formal features (DCs, nominalizations) and informal features (pronouns, pragmatic markers) indicate a systemic, multilevel stylistic shift toward colloquial norms. The near-inverse relationship between DCs and second-person pronouns further suggests that American written English underwent a coordinated register change, simultaneously adopting oral-influenced features while retreating from literate-specific devices such as explicit connectives and nominal syntax.
In addition, independent evidence from shorter sentence length further helps to explain the observed decline in the use of DCs. Previous studies have shown that average sentence length has gradually decreased over time (Hundt et al., Reference Hundt, Denison and Schneider2012; Liberman, Reference Liberman2011; Rudnicka, Reference Rudnicka and Whitt2018; Sun & Wang, Reference Sun and Wang2019). Because DCs primarily function to connect clauses and sentences, a shift toward shorter sentences naturally reduces the need for explicit connective marking. Consistent with this account, similar trends toward shorter sentence length have been documented in French, German and Spanish. Sentence length can be indirectly assessed through the frequency of sentence-final punctuation marks, such as periods, exclamation marks and question marks. As shown in Figure 6, the frequencies of these punctuation marks increase significantly across all four languages, indicating a growing prevalence of shorter sentences. This pattern closely aligns with the observed decline in DC frequency, suggesting that changes in sentence length and connective use are closely related. Importantly, the trend toward shorter sentences can itself be interpreted as a consequence of colloquialization. Spoken language typically favors shorter, less syntactically complex sentences, and as written language increasingly adopts speech-like characteristics, shorter sentence structures become more common. In this context, colloquialization promotes sentence forms that require fewer explicit DCs, offering a coherent explanation for the parallel historical trends observed in sentence length and DC usage.
Another plausible explanation for the decreasing use of DCs is that many of their functions have gradually been assumed by more informal expressions characteristic of spoken discourse, a process closely linked to colloquialization. As discussed in Section 2.1 of the Supplementary Material, informal elements such as sentence-initial interjections (look, hey) or discourse-opening phrases (the thing is, what I’m saying is) can serve pragmatic roles similar to those of traditional connectives like however, meanwhile, in any case, in fact or in short. Likewise, colloquial adverbials such as anyways or so yeah can signal continuation or conclusion in ways that parallel formal connectives like in any case or to sum up. These functional substitutions point to a broader stylistic reorganization of written discourse, reflecting an increasing alignment with the interactive, context-dependent patterns characteristic of spoken language.
A related but distinct phenomenon involves the replacement of formal DCs by alternative lexical or syntactic devices that express comparable logical relations. For instance, Iliev and Axelrod (Reference Iliev and Axelrod2016) reported an overall increase in the use of causal expressions (causality) from 1800 to 2000. While some of these expressions overlap with contingency-related DCs, most occur as verbs and nouns rather than conjunctions. Their analysis, which was based on 108 lexical items from the Cause category in LIWC (Tausczik & Pennebaker, Reference Tausczik and Pennebaker2010), therefore captures only a limited subset of explicit causal markers. By contrast, more comprehensive causality resources (Dunietz et al., Reference Dunietz, Levin and Carbonell2017; Li et al., Reference Li, Li, Zou and Ren2021) demonstrate that causal relations can be realized through a broad range of linguistic forms, including verbs, conjunctions, prepositions, adverbs and clausal constructions. Consequently, the upward trend reported by Iliev and Axelrod (Reference Iliev and Axelrod2016) should not be interpreted as reflecting the overall historical path of causal expression in language. It is also plausible that some causal expressions have functionally displaced traditional contingency-related DCs. Our analyses lend support to this interpretation, showing that while the frequency of certain causal expressions has increased, others have declined (see Section 2.2 of the Supplementary Material for details). In summary, these findings provide convergent evidence that colloquialization has played a crucial role in shaping the historical use of DCs.
4.3. Other socio-cultural effects
We have examined how colloquialization has influenced the historical use of DCs. In the following section, we broaden the discussion to situate these findings within a larger theoretical context, focusing on their implications for claims about declining human rationality versus socio-cultural change.
We begin by addressing the question of human rationality and cognitive capacity. As language users have become less reliant on explicit DCs over time, a natural concern is whether this shift has resulted in increased discursive incoherence or reflects a decline in logical reasoning and rational thinking. At first glance, the reduced use of DCs might appear to weaken explicit logical structure in discourse.
However, several factors argue against this interpretation. First, the long-term trend toward shorter sentence length reduces the structural need for explicit connectives, as fewer clauses are packaged within a single sentence. Second, colloquialization enables speakers and writers to employ alternative linguistic resources that can fulfill similar pragmatic and coherence-building functions, potentially compensating for the reduced use of traditional DCs. Crucially, we find no direct evidence that overall discourse coherence has diminished as a result of declining DC frequency.
It is therefore plausible that the emergence of a more colloquial written style has not weakened coherence but instead has reshaped how coherence is achieved. Rather than signaling logical relations through formal connectives, writers may increasingly rely on contextual inference, pragmatic cues and reader engagement to support interpretation. In this sense, changes in DC usage are better understood as reflecting evolving communicative strategies and stylistic norms, rather than a decline in human rational or cognitive capacities.
We argue that colloquial expressions can enhance meaning and coherence through alternative discourse-organizing devices. These alternatives link ideas and signal relationships like causality, contrast or addition. Specifically, lexical chains establish semantic connections without explicit markers, while inferential phrases like ‘this suggests that’ prompt conclusions. Punctuation (dashes, colons, semicolons) can also indicate relationships between clauses, and structures like parallelism or juxtaposition imply connections without explicit connectives. For instance, juxtaposing clauses instead of using ‘however’ creates subtler contrasts, as in ‘The economy is struggling. Signs of improvement are emerging.’ Although these alternatives may be less explicit and demand more cognitive effort, they reflect a trend toward implicit discourse coherence and provide different pragmatic effects, such as shifts in tone or emphasis, offering a flexible approach to connecting ideas in contemporary writing.
As discussed above, the decline in DC frequency appears to be accompanied by an increased reliance on alternative expressions that perform comparable discourse functions. Rather than indicating a loss of coherence, this pattern suggests a rebalancing of how logical relations are signaled in discourse. Evidence from causal relations, in particular, indicates that logical reasoning and rational capabilities have not diminished despite reduced reliance on explicit DCs. Moreover, several adversative connectives remain relatively stable in frequency, helping to constrain ambiguity in contexts where explicit marking remains functionally necessary. While the majority of DCs show declining usage, a small subset has remained largely unaffected.
Crucially, there is no direct evidence that changes in DC frequencies have disrupted human logical reasoning or cognitive capacities. Instead, our findings point to stylistic change as the primary driver, with colloquialization reshaping the mechanisms through which coherence is achieved in written discourse. At the same time, assessing whether such linguistic shifts have broader cognitive consequences remains challenging, as it is difficult to disentangle changes in communicative conventions from potential changes in underlying cognitive processes.
Second, a range of crucial socio-cultural factors contribute to the frequency changes of DCs. Our analyses show that the distribution of DC growth rates broadens during periods in which multiple social and stylistic forces interact, a pattern observable across the past two centuries. The recent peaks in German and French DC frequencies are comparable in magnitude to those observed approximately 150 years ago. By contrast, changes in literary production and readership appear to have contributed directly to colloquialization and to shorter sentence structures, which in turn may have driven the long-term decline in DC usage (details on literary rate impacts are seen in Section 3 of Supplementary Material). We therefore argue that although explicit DC usage has decreased over time, a functional balance has been maintained in discourse coherence through compensatory strategies involving alternative linguistic resources.
More broadly, language change is widely understood to be shaped by the co-evolution of social, technological and political factors, including population size, levels of literacy and patterns of education (Koselleck, Reference Koselleck1989; Wichmann & Holman, Reference Wichmann and Holman2009). While such factors exert a general influence on language change, their specific configurations vary across linguistic communities, leading to distinct diachronic patterns. For instance, changes in the use of DCs in Chinese have been strongly shaped by major socio-cultural transformations unique to the Chinese-speaking context (Sun et al., Reference Sun, Liu and Xiong2021). Comparable historical conditions did not occur in the same way in the other language communities examined here. Consequently, whereas DC usage in Indo-European languages appears to be primarily shaped by gradual colloquialization and related stylistic shifts, Chinese exhibits a qualitatively different pattern of change.
In spite of this, this divergence does not undermine our central argument but instead reinforces it. While English, French, German and Spanish show a long-term decline in DC usage consistent with colloquialization, the post-1950 increase in Modern Chinese DCs reflects a distinct socio-historical process. This increase is best understood not as evidence of a rise in human rationality, but as a consequence of the widespread adoption of vernacular written Chinese (Báihuà), which progressively replaced Classical Chinese. Classical Chinese relied heavily on juxtaposition and contextual inference rather than explicit connectives to signal discourse relations. The incorporation of modern DCs therefore marks a shift toward a more explicit, standardized and, in some respects, Western-influenced written style. In short, these cross-lingual patterns strongly suggest that historical changes in DC frequency are rooted in socio-cultural and stylistic transformations rather than in changes to fundamental human rational or cognitive capacities.
Beyond this, the historical decline in explicit DCs reflects deep socio-cultural and technological transformations rather than a purely linguistic change. The spread of mass education and literacy democratized writing, aligning it more closely with spoken vernaculars and favoring simpler, paratactic constructions over the complex, hypotactic forms marked by formal DCs (Biber & Gray, Reference Biber and Gray2013). Globalized publishing and standardized style guides further reinforced this shift by promoting concise, direct expression and discouraging verbose connectives such as consequently or nevertheless. The rise of fast-paced media and digital communication amplified the trend, rewarding brevity and allowing implicit relations to replace overt markers. In summary, these forces explain the decline of DCs as a product of evolving textual conventions and communicative efficiency, not merely a reduction in linguistic sophistication.
Overall, we conclude that the decline in the use of DCs is primarily a stylistic phenomenon driven by colloquialization, rising literacy rates and broader socio-cultural factors. This shift allows written language to more closely approximate spoken discourse and to accommodate a wider range of communicative contexts and degrees of informality. Although increased literacy is generally associated with enhanced access to abstract reasoning and formal modes of thought, directly measuring or verifying the impact of colloquialization on such cognitive capacities remains challenging and lies beyond the scope of the present study. Importantly, despite the reduced reliance on explicit DCs, discourse coherence does not appear to be compromised. Instead, a functional balance is maintained through alternative linguistic resources, enabling logical connections to be established and coherence to be preserved in written texts.
5. Conclusion
The present study examined diachronic changes in the use of DCs in Chinese, English, French, German, and Spanish using historical corpora. We found a significant long-term decline in DC frequency in English, French, German, and Spanish over the last two centuries. In these four languages, the data also indicate a late-period rebound beginning in the 1980s and becoming more pronounced after 2000, although this latter increase should be interpreted cautiously because part of it may reflect corpus composition effects rather than a fully robust diachronic change. Chinese, by contrast, displays a more complex diachronic trajectory, shaped by major linguistic and sociohistorical changes that make it less directly comparable to the four European languages. Overall, these patterns are consistent with independent stylistic indicators and support a stylistic rather than cognitive interpretation. The findings therefore do not support the hypothesis that changes in DC usage reflect cognitive decline, nor should the observed reduction in explicit DCs be taken as evidence of diminished human rationality or logical reasoning. Instead, the results point to broader stylistic and sociocultural dynamics, driven primarily by colloquialization and further shaped by rising literacy and other social transformations. This study also shows how quantitative diachronic methods can be used to investigate long-term changes in discourse style and their relation to wider social and cultural change.
Supplementary material
The supplementary material for this article can be found at http://doi.org/10.1017/langcog.2026.10072.
Data availability statement
All data and code supporting this study are publicly available at https://github.com/fivehills/HisDisCon.
Acknowledgments
We sincerely thank the two anonymous reviewers for their insightful and constructive comments that improved earlier versions of this study. We are also indebted to the General Editor, Prof. Eva Zehentner, for her dedicated editorial oversight and for her efforts in substantially improving the quality of this work. This research was supported by the Deutsche Forschungsgemeinschaft (DFG, German Research Foundation) – Project ID 527671319 (“Komplexe Wörter im Kontext”). We also acknowledge support from the Open Access Publication Fund of the University of Tübingen for the funding of the article processing charge.



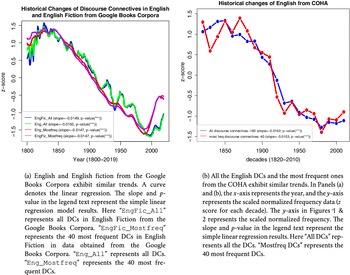

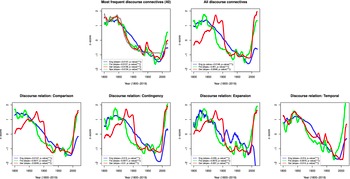
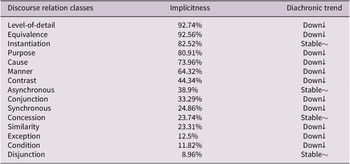


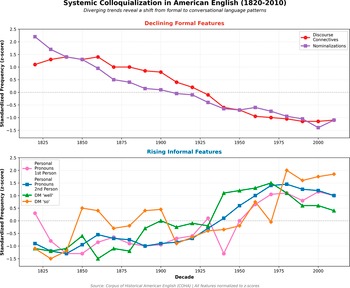


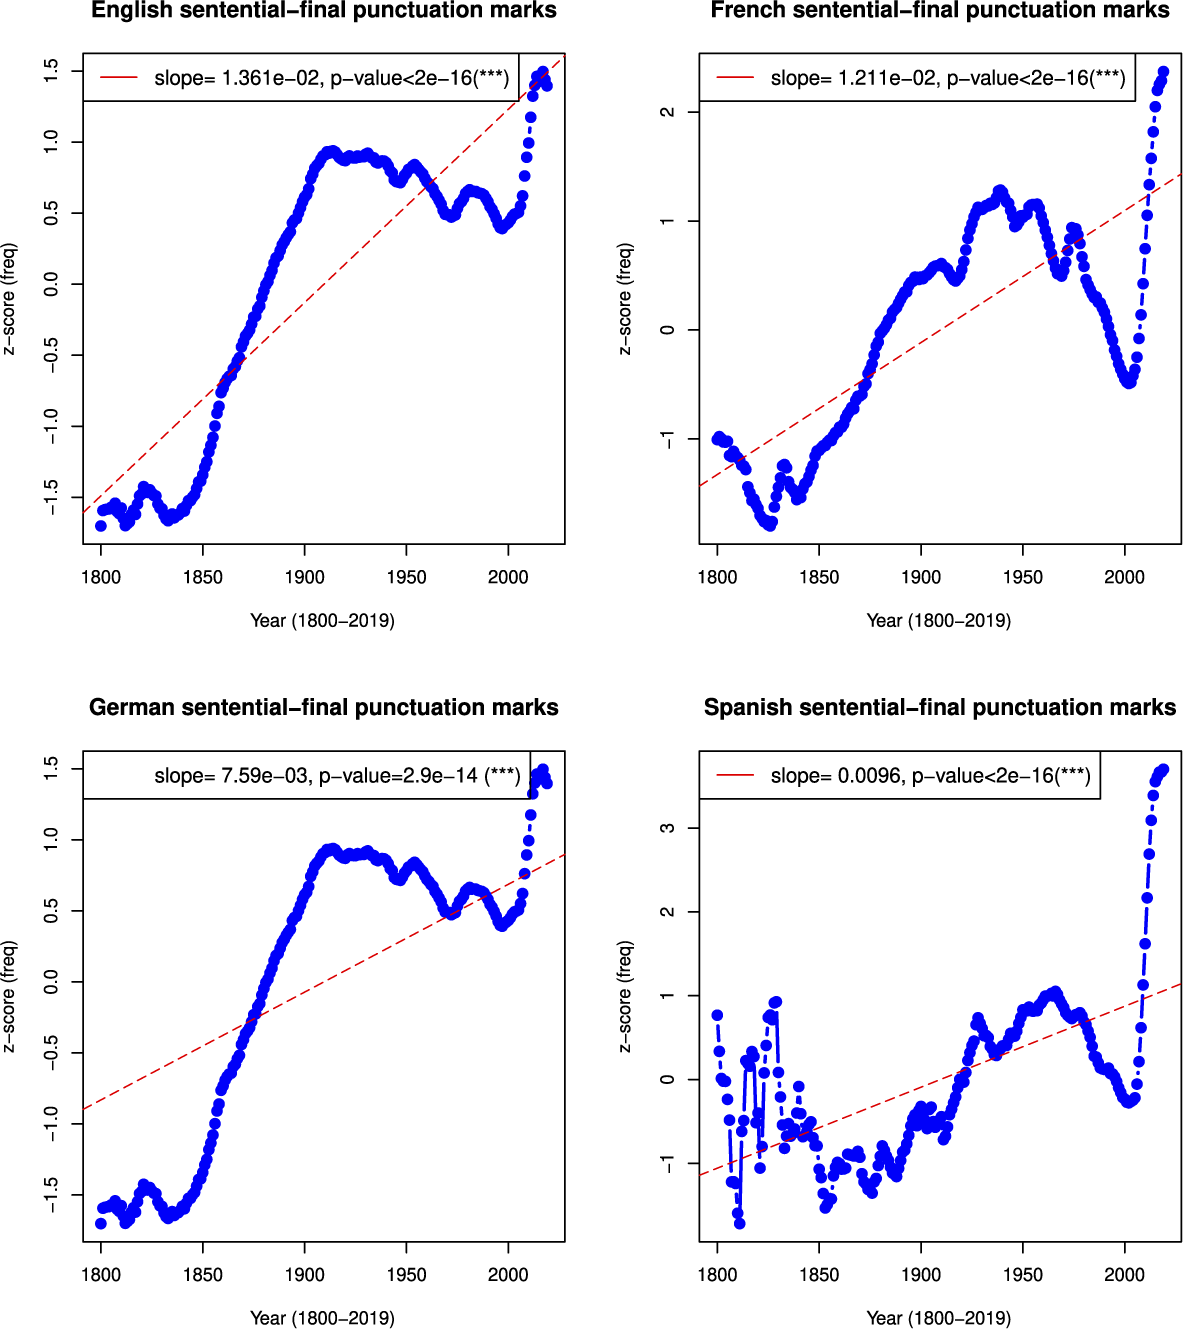


 Open access

