

The high global prevalence of overweight and obesity over the past three decades parallels increased consumption of sweet beverages, of which sugar-sweetened beverages are of particular concern( Reference Malik, Schulze and Hu 1 ). The consumption of sugar-sweetened beverages is associated with weight gain in children( Reference de Ruyter, Olthof and Seidell 2 ) and adults( Reference Malik, Schulze and Hu 1 , Reference Dhingra, Sullivan and Jacques 3 ). Moreover, ingestion of energy in the form of liquids rather than energy-matched solid foods has been shown to increase energy consumption due to the lower satiety provided by liquid foods( Reference Blundell, de Graaf and Hulshof 4 ).
Over the past few years, the package size of sweet beverages has increased( Reference Steenhuis, Leeuwis and Vermeer 5 ) and research indicates that larger packages are positively associated with energy intakes( Reference Wansink 6 ). However, in many high-income countries it is a requirement to provide nutritional information on all packed food and beverage items( 7 ), including a recommended serving size which reflects ‘the recommended amount to consume in one sitting’( Reference Faulkner, Pourshahidi and Wallace 8 ). In Australia and New Zealand, it is mandatory to display a recommended serving size as per the Australia New Zealand Food Standards code( 9 , 10 ); however, standard serving sizes for food and beverages are not provided( 9 ). In contrast, regulated food and beverage serving sizes are available for Canada and the USA( 10 , 11 ). These recommendations include acceptable ranges in millilitres within which beverage serving sizes must fall. For example, according to the Canadian Food Inspection Agency, the prescribed reference amount for soft drink is 355 ml, with an acceptable range between 250 and 375 ml( 12 ). If a single serving size container is 150 % or less than the reference amount (150 % of 355 ml=532·5 ml) then the quantity may still be termed ‘one serving’. However, a container larger than 150 % of the reference amount that is intended to be consumed in one sitting may also still be termed ‘one serving’( 10 ). This regulation provides manufacturers with flexibility to provide an appropriate serving size recommendation taking into account the energy density and/or package size of the product( 10 ). Moreover, this regulation allows single serving size containers outside the recommended range to be termed ‘one serving’.
Although not all governments of high-income countries provide standards or reference serving size amounts for food and beverage items, there are other groups, such as non-government organisations, that do. For example, a recent study regarding serving size guidance in the UK showed a variety in serving size schemes proposed by profit and non-profit organisations( Reference Faulkner, Pourshahidi and Wallace 8 ). Consequently, there is a wide range of serving sizes displayed on products available for consumers( Reference Church 13 – Reference Cleanthous, Mackintosh and Anderson 15 ) and there may be discrepancies between recommended serving sizes suggested by the non-government organisations, health-care professionals and the food industry( Reference Lewis, Ahern and Jebb 16 ). A recent study among a large number of European consumers showed that consumers do factor serving size into their judgements of the healthiness of a product. Moreover, the study revealed that when nutritional values for half serving sizes in comparison to single servings or per 100 g/100 ml were presented, these products were judged as healthier( Reference Raats, Hieke and Jola 17 ). New European Union food labelling laws came into effect in December 2014; however, they do not include mandatory or comprehensive regulations regarding serving size labelling. Nevertheless, the new law states that ‘in order to provide comparable indications relating to portions or consumption units, the commission should be empowered to adopt rules on the expression of the nutrition declaration per portion or per consumption unit for specific categories of food’( 18 ).
The aim of the present study was to assess the package size and recommended serving size of sweet beverages across four high-income countries. It was hypothesized that there would be a wide range of package and recommended serving sizes available within and between countries, for similar products.
Materials and methods
Participating countries
This research was undertaken within the framework of the Global Food Monitoring Group established in 2011 to systematically monitor and report on the nutritional composition of packaged foods around the world and to bring transparency and objectivity to the monitoring process( Reference Dunford, Webster and Metzler 19 ). There are currently thirty-one member countries ranging from low- to high-income in terms of OECD (Organisation for Economic Co-operation and Development) classifications. Four high-income member countries of this group with similar food supplies (Australia, Canada, the Netherlands and New Zealand) were included in the current study. For these four countries, nutrition labelling (including serving size) is provided on the majority of foods and beverages. In Australia, New Zealand( 9 ) and Canada( 10 ), it is mandatory for packaged products to display the package size and serving size. In the Netherlands it is mandatory for packaged products to display the package size( 20 ), although it is voluntary to display the serving size.
Data collection and measures
Cross-sectional surveys were undertaken in two large stores representing the two supermarket chains with the highest market share in each country. Stores were located in the biggest cities of each participating country (Amsterdam, Auckland, Toronto and Sydney). As such, the main drink varieties of each county were represented. Surveys were undertaken in 2012 (Australia; between July and December) and 2013 (Netherlands, New Zealand and Canada; between March and September). Product and serving size data were collected by the research assistants, directly from the Nutrition Information Panels displayed on packages of all sweet beverages for sale in each store( 21 ). Sweet beverages were defined as those that were sugar- or artificially sweetened and energy content was determined by kJ per 100 ml. Sweet beverages can be divided into ‘lite’ beverages (those that are artificially sweetened or explicitly declared as being a ‘diet’, ‘lower calorie’, ‘lite’ or ‘less in sugar’ on the package) and regular beverages (those that are sugar-sweetened or drinks with no declarations about ‘diet’, ‘lower calorie’ or ‘less in sugar’ but usually contain naturally occurring sugar, e.g. fruit juice).
Data were collected using bespoke smartphone applications (apps) which were developed prior to the current study and outlined in more detail elsewhere( Reference Dunford, Trevana and Goodsell 22 ). For data entry and quality purposes, photographs of the front of the package, Nutrition Information Panel and ingredients list were taken for each product. Data from each country were automatically entered into specially developed software or Microsoft® Excel for manual value range checks and data cleaning. Data were checked by a researcher from each county (M.P.P., H.E., E.D. and A.S.) and when values for outcome variables were substantially outside of the range, they were checked using source documents (photographs) and amended where necessary.
Products were placed into six categories based on the standard categorisation system of the Global Food Monitoring Group( 21 ). These were: (i) soft drinks (e.g. cola and other fizzy drinks); (ii) fruit-flavoured & iced-tea drinks (e.g. fruit-based drinks which usually contain less diluted fruit juice and added sugar, and iced teas); (iii) fruit & vegetable juices (e.g. shelf-stable and refrigerated orange juice, apple juice, tomato juice); (iv) energy drinks (caffeine- and/or taurine-containing drinks); (v) sport (electrolyte) drinks (drinks specifically targeted at sport preparation, improvement, recovering); and (vi) flavoured waters (e.g. vitamin water). Cordials (powdered concentrate and liquid) and hot drink mixes (such as hot chocolate, coffee) were excluded because their serving size and energy content (in the unprepared form) differ greatly from that of ready-to-drink beverages. Plain waters were also excluded because Nutrition Information Panels and serving size data were not mandatory or not available for many of these products. Milk and milk substitutes (i.e. soya/rice milk) were excluded because milk is generally considered part of a healthy diet.
All sweet beverages were then further categorized into two types: (i) individual pack size (IPS) drinks, which were packages containing an amount that is reasonable to consume in one sitting (e.g. a 500 ml bottle); and (ii) bulk pack size (BPS) drinks, which were packages containing an amount that is reasonable to consume over more than one sitting (e.g. a 2000 ml bottle). Packages with a volume of 600 ml or less and displaying a manufacturer recommendation of one or two servings per package were included as IPS drinks( 23 ). Packages with a volume of more than 600 ml were included as BSP drinks. However, some exceptions were made. Packages larger than 600 ml that specifically indicated on the Nutrition Information Panel to contain one serving were included as IPS drinks. Packages of 600 ml or less that specified on the Nutrition Information Panel to contain three or more servings were included as BPS drinks. These values and exceptions were chosen for several reasons. First, packages that contain two servings are customarily consumed at a single eating occasion( Reference Lando and Lo 24 ). Second, it was previously emphasized that the serving size of IPS drinks did not always correspond with the size of the package and thus the amount consumed in one sitting( Reference Walker, Woods and Rickard 14 ). Third, there are differences in serving size regulations across various brands and countries (e.g. a 500 ml bottle of soft drink in the Netherlands is commonly intended to contain two servings whereas a 600 ml bottle of soft drink in New Zealand is commonly intended to contain one serving). Multi-packs (e.g. a six-pack containing six cans or a family package containing four 1·5 litre bottles) were excluded.
Analyses were conducted separately for the two package size categories. To gain insight into how often different servings sizes were used in each country, serving sizes were further divided into five sub-categories based on the Canadian regulations for sweet beveragesFootnote * ( 10 ): (i) <250 ml; (ii) 250 to <312·5 ml; (iii) 312·5 to <375 ml; (iv) 375 to <600 ml; and (v) >600 ml. To gain insight into how often different package sizes were for sale, similar categories were used for IPS drinks and for BPS drinks the following sub-categories were used: (i) ≤1000 ml; (ii) >1000 to ≤1500 ml; (iii) >1500 to ≤2000 ml; (iv) 2000 to ≤2500 ml; and (v) >2500 ml.
Statistical analysis
Data were analysed in the statistical software package IBM SPSS Statistics version 21. Descriptive statistics were undertaken for the mean (and standard deviation), range and median serving size and package size. The percentage of products within each serving size category was calculated for both IPS and BPS drinks, for each country separately. In addition, the number of different serving sizes for each beverage category was calculated for all countries together and for each country separately. In the main analysis, all beverages (both sugar- and artificially sweetened) were included because the study focused on differences between countries in serving or package size, rather than drink category or nutrient content. However, secondary analyses were conducted to provide insight into the main differences in package size and serving size for the included beverage categories and for the differences in serving sizes for regular v. lite drinks.
For the main analysis, ANOVA tests were conducted to determine differences in mean package and recommended serving sizes between countries. Where significant differences were observed, Fisher’s least significant difference post hoc analyses were conducted to determine for which countries these determinants differed. The t test was used to determine the differences in serving sizes (dependent variable) for single serving or multiple serving containers within each country. Similar tests were conducted to determine differences in mean package or recommended serving size between different beverage categories or for regular v. lite drinks. All tests were two-sided and α=0·05 was used for all analyses. As such, multiple tests were not accounted for. However, they were considered in assessing the results.
Results
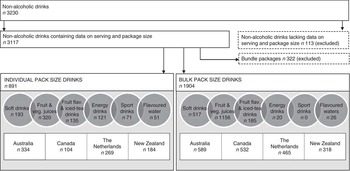
Overall, data on 3230 beverage items in four countries were collected. Beverages with missing package or serving size data were excluded (n 113Footnote †) to give a final sample of 3117 (891 IPS drinks and 2226 BPS drinks). Of the 2226 BPS drinks, 322 were excluded as they were bundle packages (e.g. a six-pack of IPS drinks). Therefore, 891 IPS drinks and 1904 BPS drinks were included in the final analysis (Fig. 1).
Flowchart showing the included sweet beverages (veg., vegetable; flav., flavoured)
The mean (sd) kJ/100 ml of the included regular beverages for Australia, Canada, the Netherlands and New Zealand was 175·4 (44·2), 179·3 (56·1), 158·5 (53·9) and 179·5 (53·7) consecutively. Mean kJ/100 ml of regular beverages was significantly lower in the Netherlands compared with the other countries (F=47·7, P<0·00). The mean (sd) kJ/100 ml of the included lite beverages for Australia, Canada, the Netherlands and New Zealand was 8·4 (9·9), 9·6 (27·7), 21·4 (30·6) and 22·6 (41·6) consecutively. Mean kJ/100 ml content of Dutch and New Zealand lite beverages was significantly higher compared with Australian and Canadian lite beverages (F=5·16, P=0·02).
Package size and serving size of individual pack size drinks
Package size
Both package and serving size of IPS drinks ranged from 118 ml (sport drink packaged in metallic pouch; Canada and Australia) to 1000 ml (plastic bottle of sport drink; New Zealand). For all countries, the median package size was 355 ml, which was on average 25 ml more than the median serving size (330 ml). The mean package size of IPS drinks was significantly different between all the countries (F=25·3, P<0·00; Table 1). Figure 2 illustrates how the package size of the exact same product varied within and between different countries at the time of the measurements for the present paper. Most (39 %) individual pack sizes were between 375 and 600 ml. The exception was Australia where most of the packages (34 %) were between 250 and 312·5 ml. No IPS drinks above 600 ml were available in the Netherlands, and only 5 % of the packages (n 15) were above 600 ml in Australia. In contrast, 21 % of IPS packages were above 600 ml in Canada and New Zealand (Table 1). Secondary analysis showed that for all countries, the package size of flavoured waters and sport drinks was significantly the biggest and the package size of fruit & vegetable juices the smallest (Table 2).
Individual package sizes for regular Coca Cola in four high-income countries (2012–2013)

Package size and serving size of individual pack size drinks (non-alcoholic sweet beverages) for sale in market-leading supermarkets of four high-income countries in 2012/2013

a,b,c,dMean values within a column with unlike superscript letters were significant different (P<0·05): results of ANOVA tests with mean package size or mean serving size as dependent variable and country as independent variable.
* In millilitres.
† Number and percentage of package sizes or serving sizes within the serving size categories.
Mean, standard deviation and median package size, and number and percentages within package size categories, according to beverage category, of drinks (non-alcoholic sweet beverages) for sale in mark-leading supermarkets of four high-income countries in 2012/2013

a,b,c,dMean values within a column with unlike superscript letters were significant different (P<0·05): results of ANOVA tests with mean package size as dependent variable and beverage category as independent variable.
* In millilitres.
† Number and percentage of individual pack size drinks and bulk pack size drinks within the package size categories.
Serving size
With the exception of Australian and Canada, the mean serving size was significantly different between all the countries (Table 1). Moreover, a wide variety of serving sizes for IPS drinks were available. For example, of all IPS soft drinks (n 193), twenty-two different serving size recommendations were provided, ranging from 150 to 710 ml (see Supplemental Table 1 in the online supplementary material).
Differences in mean serving size were observed across beverage categories for all countries. However, secondary analysis showed that New Zealand displayed significantly larger mean (sd) serving sizes for sport drinks (752 (150) ml, F=17·7, P<0·00) and fruit & vegetable juices (330 (93) ml, F=11·2, P<0·00) compared with Australia (554 (134) ml and 262 (75) ml), Canada (507 (224) ml and 243 (50) ml) and the Netherlands (387 (125) ml and 265 (77) ml). The Netherlands had smaller mean (sd) serving sizes (278 (67) ml, F=23·0, P<0·00) for soft drinks compared with Australia (374 (113) ml), Canada (397 (150) ml) and New Zealand (445 (148) ml).
The mean (sd) serving size of lite IPS drinks was significantly higher in Australia (lite: 404 (131) ml v. regular: 336 (145) ml, t=2·44 P=0·02) and New Zealand (lite: 595 (208) ml v. regular: 458 (187) ml, t=2·87, P<0·00) compared with regular drinks. This was opposite in the Netherlands (lite 271 (68) ml v. regular 308 (105) ml, t=−3·14 P<0·00), while in Canada no significant difference between lite and regular mean serving sizes was found (lite 349 (92) ml v. regular 366 (165) ml, t=−0·6, P=0·54).
Package or serving size of bulk pack size drinks
Package size
Package size of BPS drinks across all countries ranged from 400 ml (Australia) to 3000 ml (Australia, Canada, New Zealand). Compared with other countries, the Netherlands had significantly smaller BPS drinks (F=21·6, P<0·01; Table 3). However, the mean serving size of BPS drinks was significantly different across all the countries (F=118·7, P=< 0·00). Secondary analysis indicated that, for all countries, soft drinks and fruit-flavoured & iced-tea drinks were most often available in packages of >1000 to ≤1500 ml whereas flavoured waters, fruit & vegetable juices and energy drinks were most often available in packages of 1000 ml or less (Table 2). BPS sport drinks were not available.
Package size and serving size of bulk pack size drinks (non-alcoholic sweet beverages) for sale in market-leading supermarkets of four high-income countries in 2012/2013

a,b,c,dMean values within a column with unlike superscript letters were significant different (P<0·05): results of ANOVA tests with mean package size or mean serving size as dependent variable and country as independent variable.
* In millilitres.
† Number and percentage of package sizes within the package size categories.
‡ Number and percentage of serving sizes within the serving size categories.
Serving size
The serving size presented on BPS drinks ranged from 90 ml (New Zealand) to 355 ml (Canada) and the mean serving size of all counties was 231 (sd 32) ml. The mean serving size of BPS drinks was significantly different across all the countries (F=118·7, P<0·00). Also, a large number of different serving sizes were displayed on BPS drinks. For example, for the 520 multi-serving containers of soft drinks included, eleven different serving size recommendations were displayed (see Supplemental Table 1 in the online supplementary material).
Including all countries, secondary analysis revealed differences in mean serving size of soft drinks (F=33·5, P<0·00) and fruit & vegetable juices (F=179·3, P<0·00). Post hoc analysis indicated that the Netherlands had significantly smaller mean (sd) serving sizes for soft drinks (238 (27) ml) and fruit & vegetable juices (217 (25) ml), and Canada had significantly larger serving sizes for soft drinks (272 (43) ml) and fruit & vegetable juices (242 (56) ml), compared with the other countries.
In all countries, the mean (sd) serving size of lite BPS drinks was significantly larger than the serving size of regular drinks; Australia (lite: 248 (11) ml v. regular: 221 (29) ml, t=14·2, P<0·00), Canada (lite: 265 (37) ml v. regular: 245 (29) ml, t=3·96, P<0·00), the Netherlands (lite: 234 (29) ml v. regular: 211 (29) ml, t=6·70, P=<0·00) and New Zealand (lite: 249 (8) ml v. regular: 238 (27) ml, t=3·41, P<0·00).
Individual pack size drinks v. bulk pack size drinks
The mean serving size of IPS drinks (359 ml) was 128 ml larger than the mean serving size of BPS drinks (231 ml; t=23·9, P<0·00). This trend was seen for all countries, with the largest difference for New Zealand (233 ml; 473 v. 240 ml), followed by Australia (118 ml; 341 v. 223 ml), Canada (115 ml; 363 v. 248 ml) and the Netherlands (86 ml; 302 v. 216 ml; Tables 1 and 3). In all countries, a wide range of serving sizes was used to provide information on the amount appropriate to consume in one sitting (Tables 1 and 3). However, a large number of different serving sizes was observed more often for IPS drinks than for BPS drinks. Also, the median serving size of the beverage categories included was smaller for BPS drinks than for IPS drinks, with an exception for fruit & vegetable juices (see Supplemental Table 1 in the online supplementary material).
Discussion
As hypothesized, there was substantial variation within and between the four high-income countries with respect to package and recommended serving sizes of IPS drinks and BPS drinks; even package and serving sizes of the same beverages of the same brand were found to vary internationally. Moreover, there was a substantial difference in recommended serving sizes between IPS drinks and BPS drinks. Nevertheless, this finding is in line with Canadian regulations allowing single serving containers to be bigger than the suggested reference serving size to be classified as ‘one serving’, provided they are deemed a reliable amount to consume in one sitting (as determined by the manufacturer)( 10 ). Greater variation in recommended serving size was also observed for IPS compared with BPS drinks. Moreover, secondary outcomes indicated that there was a large variety in package size and serving size for the different beverage categories, especially for IPS drinks. Another important finding is that New Zealand, which has the third highest overweight and obesity rates according the OECD( Reference Sassi 25 ), has consistently the largest package size and recommended serving size of IPS drinks of all four countries assessed.
Strengths of the study include that data were collected from major supermarkets, thus covering the most popular sweet beverages purchased in the four countries. Moreover, when the same beverage was presented in a range of different package sizes, data on all packages were taken into account. In doing so, differences in serving size of similar beverages were identified. Weaknesses of the study include the cross-sectional nature of the study and the exclusion of some beverage categories (e.g. cordials). Moreover, only beverages for purchase in the supermarket were included and it is possible that inclusion of beverages available in vending machines, smaller stores, cafeterias or cafés would have altered our findings. Nevertheless, it is difficult to know in which direction.
Results are consistent with previous research showing that countries and food manufacturers lack clear regulations regarding recommended serving sizes( Reference Faulkner, Pourshahidi and Wallace 8 , Reference Cleanthous, Mackintosh and Anderson 15 ). The considerable variation in serving size between countries likely reflects this lack of regulation. However, even in the presence of more consistent regulations, such as in Canada, substantial variation in serving size of sweet beverages was still found. Further, significantly smaller bulk package sizes were observed in the Netherlands, where no package or serving size regulations exist. This finding suggests that factors other than regulation play a role in manufacturer package and serving sizes. For example, cultural and social norms may influence package and serving sizes within a country( Reference Rozin, Kabnick and Pete 26 ); since the late 1950s BPS package sizes in the Netherlands doubled from 750 to 1500 ml( Reference Steenhuis, Leeuwis and Vermeer 5 ). However, in the USA the package sizes of IPS drinks increased up to ten times their original size( Reference Young and Nestle 27 ). In order to prevent further and more excessive increases in pack size, regulations should now be considered.
A large number of recommended serving sizes were observed within and across the four countries in our study, especially for IPS drinks. This could be explained by differences in the presence or absence of serving size regulations and/or the reference amounts included in existing regulations. For example, soft drink servings can range from 250 to 375 ml according to the Canadian guidelines. Second, in countries where serving size labelling is voluntary, or in the absence of serving size regulations, manufacturer standards, which are likely to vary by company, might be used. Further, in the absence of regulation, a serving size could be chosen which makes a product appear healthier, to encourage increased consumption. However, the results presented in the current study cannot confirm this assumption. Nevertheless, providing manufacturers and thus consumers with standardized and regulated serving sizes would make it easier to compare products and assist individuals in making healthier food choices.
Our findings suggest that the current approach taken by Canada to allow a range of reference serving sizes for a product is not optimal. A recent study indicated that individuals have difficulties in selecting appropriate amounts to consume because of a lack of clarity or irrelevance of suggested serving size guidance( Reference Spence, Livingstone and Hollywood 28 ). Future serving size regulations need to be clearer and perhaps fixed for different types of beverages. An alternative is to provide nutrition information only per 100 ml. If voluntary efforts of the food industry to optimize the package and serving size regulation are ineffective, policy efforts should be considered( Reference Young and Nestle 29 ).
In addition to more consistent regulation of serving sizes, additional strategies can be used to stimulate appropriate use of serving size guidance by consumers. People often have difficulties in determining appropriate portion sizes to consume and larger amounts than recommendations are often the social norm. Therefore, public awareness campaigns to educate people on appropriate serving sizes might be useful. In addition, labelling and food packages should become more supportive in their serving size guidance. A dual-column labelling approach, such as that used in New Zealand and Australia, or providing the energy content per container may help consumers to make more healthier choices for containers with two (or more) servings( Reference Lando and Lo 24 , Reference Vanderlee, Goodman and Sae Yang 30 ). For multi-serving packages it may be helpful to provide serving size tools in household measures (e.g. one glass)( Reference Faulkner, Pourshahidi and Wallace 8 ). Recently, the US Food and Drug Administration proposed to update the US Nutrition Facts label. The updated labels will include ‘energy (kJ) per package’ information and will communicate more realistic serving sizes( 31 ).
Because package size influences the amount consumed, package sizes may be even more important than serving size in the regulation of energy intake. Previous studies have indicated that people consume more in one sitting from larger packages than from smaller ones( Reference Zlatevska, Dubelaar and Holden 32 ). In recent years, larger package sizes of sweet beverages have become available( Reference Steenhuis, Leeuwis and Vermeer 5 ), although industry has already introduced smaller packages for sweet beverages recently( 33 ) in response to public health advocates. Nevertheless, as our research shows, large packages are still widely available. This was highlighted by the attempt of New York’s former mayor Bloomberg to prohibit single-serving sugar-sweetened beverages larger than 16 fl oz (~473 ml), sold in restaurants, movie theatres and mobile food vendors( Reference Pomeranz and Brownell 34 ). Moreover, value size pricing on larger packages makes it difficult for consumers to choose newly available smaller packages. Additionally, smaller package sizes may increase packaging costs for industry( Reference Vermeer, Steenhuis and Seidell 35 ). Therefore, alongside the effort to standardize serving sizes, package size regulations should also be considered.
Conclusions
The present paper provides new evidence for inconsistencies in serving sizes and package sizes of pre-prepared sweet beverages in four high-income countries. A large range of package and serving sizes were displayed within and across Australia, Canada, the Netherlands and New Zealand, making it difficult for people in these countries to make healthy beverage choices. Clear, consistent and appropriate serving sizes displayed on packages of sweet beverages are urgently needed for consumers. Serving size and potentially package size regulations, preferably set by governments and global health organisations, would provide this consistency. Finally, it is important to conduct longitudinal research and monitor package and serving sizes over time in response to regulation, political and non-political initiatives.
Acknowledgements
Acknowledgements: The authors would like to thank Dr Yannan Jiang (University of Auckland, New Zealand) for her advice on statistical analysis. Financial support: M.P.P. was supported by the EMGO+ Travel Grant of the EMGO+ Institute for Health and Care Research, VU University Medical Center, Amsterdam, the Netherlands. The study was funded by ZonMW, the Dutch Institute for Research in Health Care (project number 121020019). The Canadian data collection was funded by the Canadian Institute of Health Research. H.E. is supported by a Heart Foundation of New Zealand fellowship (#1463). The EMGO+ Travel Grant supported the travel of the principal author to undertake this research. The funders had no role in the design, analysis or writing of this article. Conflict of interest: B.N. was a Member of the Pepsico Global Scientific Advisory Board (2010–2012) and holds funding from the Australian Food and Grocery Council as part of a National Health and Medical Research Council of Australia Partnership project (2010–2014). The other authors have no conflict of interest to declare. Authorship: M.P.P., H.E. and C.N.M. contributed to the original design. M.P.P., H.E., E.D. and A.S. organised and/or conducted data collection. M.P.P., H.E., E.D. and A.S. were involved in reorganising and recoding the data for the final database. M.P.P., H.E. and C.N.M. conducted the statistical analyses. M.R.L., B.N., J.C.S. and I.H.M.S. were active in the interpretation of the results. The manuscript was drafted by M.P.P. and H.E. and reviewed by all authors. All authors have approved the final report. M.P. is the corresponding author for this study. Ethics of human subject participation: Ethics approval was not required.
Supplementary material
To view supplementary material for this article, please visit http://dx.doi.org/10.1017/S1368980015001974


