


Introduction
India is being projected as a bright spot in the global economy.Footnote 1 It is expected to emerge as the world’s third-largest economy by 2027, with a GDP exceeding US $5 trillion.Footnote 2 In addition, in the last ten years, India has been internationally presented as a country of good governanceFootnote 3 in terms of transparency, efficiency and responsiveness, and free of major corruption. Indeed, it has been asserted that ‘India’s governance model has become an example for several countries in the world as the nation has lifted 25 crore people from poverty in 10 years, adopted innovative practices of (pro-people) good governance and worked for the welfare of the poorest people without any discrimination’.Footnote 4 It is opined that this high growth – free and fair socio-economic environment – would lead to prosperity for its people with proper employment, income, and overall standard of living.Footnote 5 In this context, we wish to study how the country is performing in terms of employment, and in particular, considering the quality of employment. Stated otherwise, we intend to analyse how far this good/high growth and good governance discourse is corroborated by the actual standard of quality of employment in India.
Given the scenario, we explore the over-time trend of quality of employment in India, in order to understand its macroeconomic determinants. We particularly focus on good economic growth and governance, which could explain specific trends (increase/decrease) in the quality of employment in India. We use nationally representative large-scale individual-level data from 2009–10 to 2022–23 and show that the very policy environment and the pattern of economic growth in India are largely responsible for the lack of availability of quality employment for the great mass of the population.
This study could be an important contribution to Indian literature for the following reasons: first, it looks at the pan-India quality of employment; next, it considers the over-time trends. Further, an attempt to understand the plausible reasons/factors that could explain the specific trends in quality of employment by using a macroeconomic framework could be relevant in the global context. Finally, the analysis of these probable macro-level factors, particularly good growth and so-called good governance influencing employment quality in the context of India, should add value to the existing literature.
The paper is organised into nine sections. In the next section, the literature review and the gaps are presented. The third section deals with the specific questions of the paper. Next, the methodology and data sources are discussed in detail. Findings from the empirical analysis are reported in the fifth section. The theoretical framework and the confirmatory analysis are presented in the next two sections. Next, the discussion of the findings is undertaken in the eighth section. Finally, the implications of the study and policy prescriptions are mentioned in the concluding section.
Literature review
There is a deficit in the quantity and quality of employment in India (Basole et al Reference Basole, Jayadev, Shrivastava and Abraham2018; IHD 2014; International Labour Organization [ILO] 2024a; NCEUS 2009). The high rate of economic growth is accompanied by low employment growth, often termed as ‘jobless growth’ (Kannan and Raveendran Reference Kannan and Raveendran2009, Reference Kannan and Raveendran2019; Kannan Reference Kannan2022; Tejani Reference Tejani2016; Unni and Raveendran Reference Unni and Raveendran2007). When gross value added (GVA) was growing at 6.2% between 2000 and 2012, the employment growth rate was 1.6%, which declined further and was nearly negligible at 0.01 between 2012 and 2019, while the GVA continued to grow at 6.7% (ILO 2024a, 52). Although the employment growth rate has improved since 2019, the increase in employment is mainly in self-employment-based activities as own-account workers and unpaid family workers. (ILO 2024a, 52).
Moreover, the majority of the workforce in India is engaged in the informal sector, accounting for about 82% working in vulnerable conditions (Basole et al Reference Basole, Jayadev, Shrivastava and Abraham2018; ILO 2024a; Kantor et al Reference Kantor, Rani and Unni2006; Papola and Sahu Reference Papola and Sahu2012; Verick and Chaudhary Reference Verick and Chaudhary2016). Although the share of formal sector (FS) workers has increased from 11% to 19% from 2009 to 2022 (and was 20% in 2019), the increase in jobs in the FS is mainly of an informal kind (Basole et al Reference Basole, Jayadev, Shrivastava and Abraham2018; ILO 2024a; Kannan Reference Kannan2022). Most intriguingly, informalisation is increasing even among the regular salaried/wage workers, i.e., among the most privileged category of workers (Basole et al Reference Basole, Abraham, Rakshit, Vijayamba, Shrivastava and Halder2023; ILO 2024a). Besides, job instability among regular workers is growing. A large proportion of regular workers are without any written contract, and the share of regular workers with long-term contracts has also decreased over time (ILO 2024a, 25). In addition, in recent years with digitalisation and the introduction of new technologies, the types of new jobs with limited/no social security coverage are rising (i.e. mainly in the platform or gig economy) (ILO 2024a, 46; ILO 2024b).
Next, literature is scanty regarding the probable determinants of the quality (or lack of quality) of employment in India, particularly regarding macroeconomic factors. However, many studies exist examining the (individual-level) determinants of formal/informal sector employment. Researchers, notably Abraham (Reference Abraham2016, Reference Abraham2017), Bairagya Reference Bairagya(2012), Narayanan (Reference Narayanan2015), and Sheikh and Gaurav (Reference Sheikh and Gaurav2020), have found that factors such as age, gender, education, skills (i.e. technical and vocational education), socio-religious identities, and place of residence of individuals are significant in explaining their participation in the formal/informal sectors as formal/informal workers. For example, an increase in age (up to about 60 years), and higher levels of education and skills, increase the probability of getting a job in the FS as formal workers rise (Abraham Reference Abraham2016, Reference Abraham2017; Bairagya Reference Bairagya2012; Narayanan Reference Narayanan2015; Sheikh and Gaurav Reference Sheikh and Gaurav2020). In addition, higher quality employment is more likely for males rather than females, for workers in the urban areas rather than rural areas (in the non-farm sector), and for the upper caste than the formally designated Scheduled TribeFootnote 6 (STs) and Scheduled Caste (SCs), and Other Backward ClassesFootnote 7 (OBCs) (Abraham Reference Abraham2016; Sheikh and Gaurav Reference Sheikh and Gaurav2020).
Regarding macro-level factors influencing employment quality, researchers argue that high economic growth does not necessarily lead to high employment growth, especially with regard to better productive and remunerative employment (Aggarwal Reference Aggarwal2018; Dev Reference Dev2006; Ghosh and Chandrasekhar Reference Ghosh and Chandrasekhar2007; Papola Reference Papola2013). Moreover, the earlier Institute of Human Development (IHD) report (2014) recommends that organised sector growth, particularly growth in the manufacturing sector, leads to a process of economy-wide productivity growth, along with growth in employment and the condition of workers. However, informal employment should not grow at the cost of formal employment in this sector. Furthermore, there is a huge ongoing debate on the impact of business regulatory environment reforms and labour market reforms on employment (Bhattacharjea Reference Bhattacharjea2006, Reference Bhattacharjea2021; Rodgers and Menon Reference Rodgers and Menon2013). In this respect, Besley and Burgess (Reference Besley and Burgess2004) and Hasan et al (Reference Hasan, Kapoor, Mehta and Sundaram2017) found that states which adopted pro-worker policies experienced lower output, productivity, investment, and employment in the FS. However, other researchers, notably Rodgers and Menon (Reference Rodgers and Menon2013), found that pro-worker policies improved job quality (in terms of job security, likelihood of full-time work and cash wages), particularly for women.
Literature gap
Studies on the over-time trend of quality of employment in India are limited. Furthermore, studies on the probable determinants (particularly the macro-level factors) that could explain the specific trend (increase/decrease) of quality of employment, are also sparse in India. Hence, although a sizeable global literature exists, the relevant literature on India is incomplete in terms of the coverage of the issues. Only a few comprehensive writings exist in the Indian context that look at the overtime trend of employment quality, with relatively few examining macroeconomic factors such as good growth and good governance that could influence the specific trends in the quality of employment.
Specific questions
Given this literature gap, a few fundamental questions arise:
1. What is the over-time trend in the quality of employment? Is it improving or deteriorating over time?
2. What is the theoretical framework that could explain the specific trend (increase/decrease) of quality of employment? Whether good growth and good governance influence employment quality or not?
3. Is the theoretical framework corroborated by the Indian data?
Methodology
This paper intends to examine the quality of employment in India, considering the crucial dimensions of ‘decent work’ as proposed by the International Labour Organization. The idea of ‘decent work’ was first articulated in 1999 by the ILO Director-General in his report to the 87th Session of the International Labour Conference (ILO 2008, 4). This framework covers ten substantive elements corresponding to the four strategic pillars of the Decent Work Agenda. The four strategic pillars are full and productive employment, rights at work, social protection, and promotion of social dialogue. And the ten elements are employment opportunities; adequate earnings and productive work; decent working time; combining work, family and personal life; work that should be abolished; stability and security of work; equal opportunity and treatment in employment; safe work environment; social security; and social dialogue, and employers’ and workers’ representation (ILO 2012, 7; presented in Table A1, appendix). Out of this list of ten traits, we have focused on three crucial elements/dimensions: paid employment opportunities, stability and security of paid work, and social security for the working people. We have chosen these three, as these dimensions are also among the key indicators of Millennium Development Goals and Sustainable Development Goals. We will now consider these three dimensions.
Employment opportunities
Is a crucial dimension of the quality of employment from a macro perspective, even though that may not be important from a micro/individual perspective of employment quality. This dimension is comprised of indicators that provide insights about the labour market conditions (i.e. quantity of labour demand and supply) as well as give an idea regarding the nature of employment. (ILO 2012, 45).
Stability and security of work
‘Is a dimension that allows the differentiation of workers into those whose jobs are characterized by a degree of relative permanence and soundness from others … ’. (ILO 2012, 127).
Social security
‘Covers all measures that provide benefits, whether in cash or in kind, to secure protection, inter alia, from (a) lack of work-related income (or insufficient work-related income) caused by sickness, disability, maternity, employment injury, unemployment, old age, or death of a family (working) member; (b) lack of access or unaffordable access to health care; (c) insufficient family support, particularly for children and adult dependants; and (d) general poverty and social exclusion’. (ILO 2012, 148).
Based on these three dimensions, the findings are derived as follows: to study the quality of employment in India, first, we build composite indices using the above three elements/dimensions of employment quality; then, to understand the over-time trends, we focus on 2009–10 to 2022–23 and use the nationally representative unit/individual level data published by the Government of India. Next, we construct a theoretical framework to identify the probable macroeconomic factors, which could explain the specific trends in employment quality. Finally, we perform confirmatory analysis to understand whether the theoretical framework is corroborated by the Indian data.
We have selected key indicators provided by the ILO for each of these dimensions as categories in column 3 of Table 1. On the basis of these categories, we have drawn out specific proxy variables (based on the availability of relevant large-scale data on India).
Dimensions, indicators, categories, and variables chosen for our study and the corresponding values assigned*
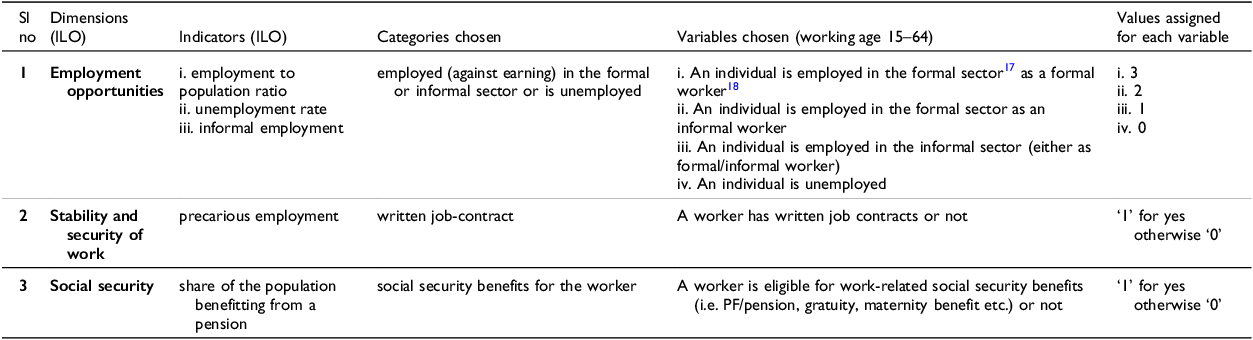
Source: ILO (2012) Table no-A, 16–17.
*Note: We have constructed the variables as categorical/ordinal variables. These variables have been ordered from better to worse, where the best among the categories have been marked with the highest values/scores; the worst among the categories are given the value/score as ‘0’.
Next, we construct three different composite indices of quality of employment: First, to understand the general picture of overall quality of employment in India, we build a comprehensive index taking all the above-mentioned three dimensions and variables. Then, in the second index, we take up the two dimensions of quality of employment, excluding employment opportunities. The values/scores of the variable for these two indices remain the same as mentioned above. Finally, to see the condition of workers in the FS, we take up two dimensions ‘employment opportunities’ and ‘stability and security of work’ (both for the FS only), to build an index. As eligibility of getting social security benefits is a primary criterion to distinguish between formal and informal employment, the ‘social security’ dimension has been dropped. For capturing ‘employment opportunities’, we take variables: an individual is – (i) employed in the FS as a formal worker (assigned value 2), and (ii) employed in the FS as an informal worker (assigned value 1).
The above-mentioned composite indices have been created by aggregating the dimensions. These indices are a composite measure of an individual’s working conditions in terms of the dimensions of employment quality. An equal weight has been given to all the dimensions (as a simplifying method). Our composite indices are as follows:
A. Index-1 = I 1 = Employment opportunities (3/2/1/0) + Stability and security of work (1/0) + Social security (1/0)
B. Index-2 = I 2 = Stability and security of work (1/0) + Social security (1/0)
C. Index-3 = I 3 = Employment opportunities (2/1) + Stability and security of work (1/0)
These indices give the total score for each individual on the basis of her/his achievement of the above-mentioned indicators. As such, the index score for the first index ranges from 0 to 1.66 (i.e. worse to better). The index score is ‘0’ if an individual is unemployed (and all other dimensions to get 0), ‘0.33’ if an individual is employed in the informal sector but is deprived in terms of other indicators, while the highest score ‘is 1.66’ if an individual is employed as formal worker in the FS and all the other criteria are fulfilled. Accordingly, the index score ranges from ‘0 to 1’, and from ‘0.5 to 1.5’ for the second and third indices, respectively.
Information on these variables has been collected from the unit-level (individual-level) secondary data of the National Sample Survey Office (NSSO),Footnote 8 Government of India, for the years 2009–10, 2018–19 and 2022–23. This individual-level data for nineteen major statesFootnote 9 within the working-age group 15–64 years have been used for our analysis. The total numbers of working-age persons in our sample are 276022, 239559, and 236926 during the three time periods of study, respectively. We have used the usual statusFootnote 10 data for all. Apart from this, the data on other economic sectors and aggregate economic activities are collected from government sources like the Annual Survey of Industries – Central Statistical Organization, Reserve Bank of India, Planning Commission, Population census, and Public Affairs Centre (non-government).
Next, we construct a macroeconomic framework to identify the probable factors that could explain the specific trend of employment quality. Subsequently, we derive propositions on these probable macroeconomic factors and test these propositions in the Indian context.
To do so, ordered logistic regressions have been applied. The ordered logistic regression is undertaken mainly to predict ordered categorical variables given one or more independent variables. We use this kind of regression model because the dependent variables of interest (i.e. I 1 , I 2 , and I 3 ) are ordinal in nature. We convert the values of composite indices into ordered categorical variables by giving codes, ranging from 0 to 5, 0 to 2 and 1 to 3, respectively, for I 1 , I 2 , and I 3 . The dummies of the categories under each of these variables have been ordered from better to worse, where the best among the categories have been marked with the highest values or scores; the worst among the categories is considered as the benchmark and valued with zero. To verify the validity of the regression models, different statistical tests (such as, Wald test and likelihood ratio test to validate the proportional odds assumption; multicollinearity test, etc.) have been performed.
The logit regression model is represented as -
 $${\rm{Li}} = {\rm{Ln}}\left( {{{\rm{P}}_{\rm{i}}}{\rm{/1 - }}{{\rm{P}}_{\rm{i}}}} \right) = {{\rm{Z}}_{\rm{i}}} = {{\rm{\beta }}_{\rm{0}}} + {{\rm{\beta }}_{\rm{i}}}{{\rm{X}}_{\rm{i}}} + {{\rm{u}}_{\rm{i}}}$$
where (P i /1–P i ) is simply the set of odd ratios, X i is the set of explanatory variables, and β i is the set of regression coefficients.
We take both the micro and macro level factors as independent variables. However, following the cue from literature mentioned above, micro/individual level factors such as age, education, skills, gender, socio-religious identity and rural-urban locations have been taken as control variables. As stated otherwise, the individual-level characteristics have been controlled to remove their probable influence on the quality of employment.
The probable macro-level factors (taken up in our study) that could influence the quality of employment are given in detail in the confirmatory analysis section (i.e. in the seventh section).
Empirical analysis and findings
In this section, we focus on the over-time trend of the quality of employment in India.
-
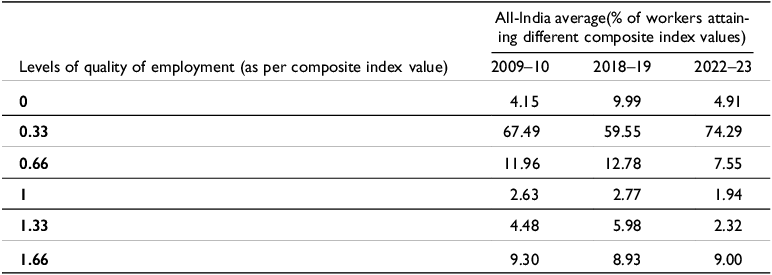
Index-1(I 1 ): The overall quality of employment in India for the majority of the workers (15–64 years of age) is not only poor but is deteriorating. In terms of the composite index I 1 (combining three dimensions, as derived earlier in the paper), the score for more than two-thirds of the workers is very low i.e. 0.33 (refer to Table A2 and Figure 1; appendix). In addition, the share of workers with the lowest scores has increased by 7% between 2009–10 and 2022–23. This is essentially because, most of the working-age people are employed as informal workers, and are deprived of job contracts and social security benefits. Most importantly, the increase in shares of these workers over time indicates the proliferation of informality.
Figure 1.The quality of employment index-I1 values/scores in India.


Strikingly, only for about 9% of the workers in the entire labour force, the index score is highest (i.e. 1.66). Moreover, the share of workers at the higher levels of the index value has either reduced or remained stagnant over time.
-
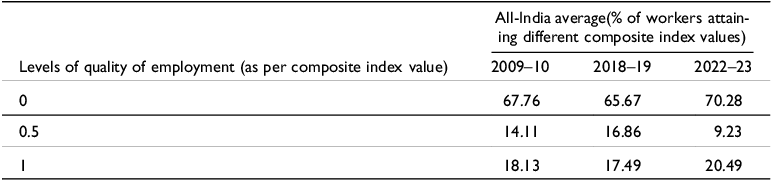
Index-2 (I 2 ): The quality of employment as per this index (i.e. combining only two dimensions, excluding ‘employment opportunities’) is low and not improving for most of the workers (Table A3 and Figure 2). As such, the index value is ‘0’ for about two-thirds of the workers, indicating that a large share of workers is deprived of both job contracts and social security benefits. Moreover, the condition of the workers has remained almost stagnant over time.
Figure 2.The quality of employment index-I2 values/scores in India.
-
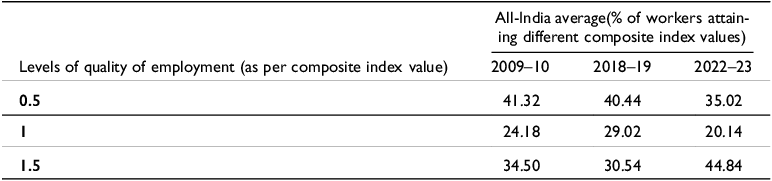
Index-3 (I 3 ): The scenario of quality of employment is not very encouraging even in the FS. More than half of the FS workers have low index values, indicating persistence of informality even in the FS (Table A4 and Figure 3). Although the percentage of workers attaining the highest index value has increased in 2022–23, the share of these workers is still less than 50%.
Figure 3.The quality of employment index-I3 values/scores in India.


Overall, we find that the quality of employment is not only poor in India but is either not improving over time or deteriorating. Now, the question arises: What are the plausible reasons that have led to the stagnation and deterioration of employment quality in India despite high economic growth and good governance?
To identify the probable factors (mainly focussing on macroeconomic characteristics) that could explain the lack and deterioration/stagnation of quality of employment, we develop a theoretical framework in the section below.
Theoretical framework
We build this theoretical framework following the works of Bhaduri, Reference Bhaduri2018), Chakrabarti (Reference Chakrabarti2013, Reference Chakrabarti2016), Sadhu and Chakrabarti (Reference Sadhu and Chakrabarti2018), Sanyal (Reference Sanyal2007), and Sanyal and Bhattacharyya (Reference Sanyal and Bhattacharyya2009).
The basic structure of the framework is illustrated in Figure 4.
Dynamics of the framework.
Note. The numbers represent the sequence of the framework.
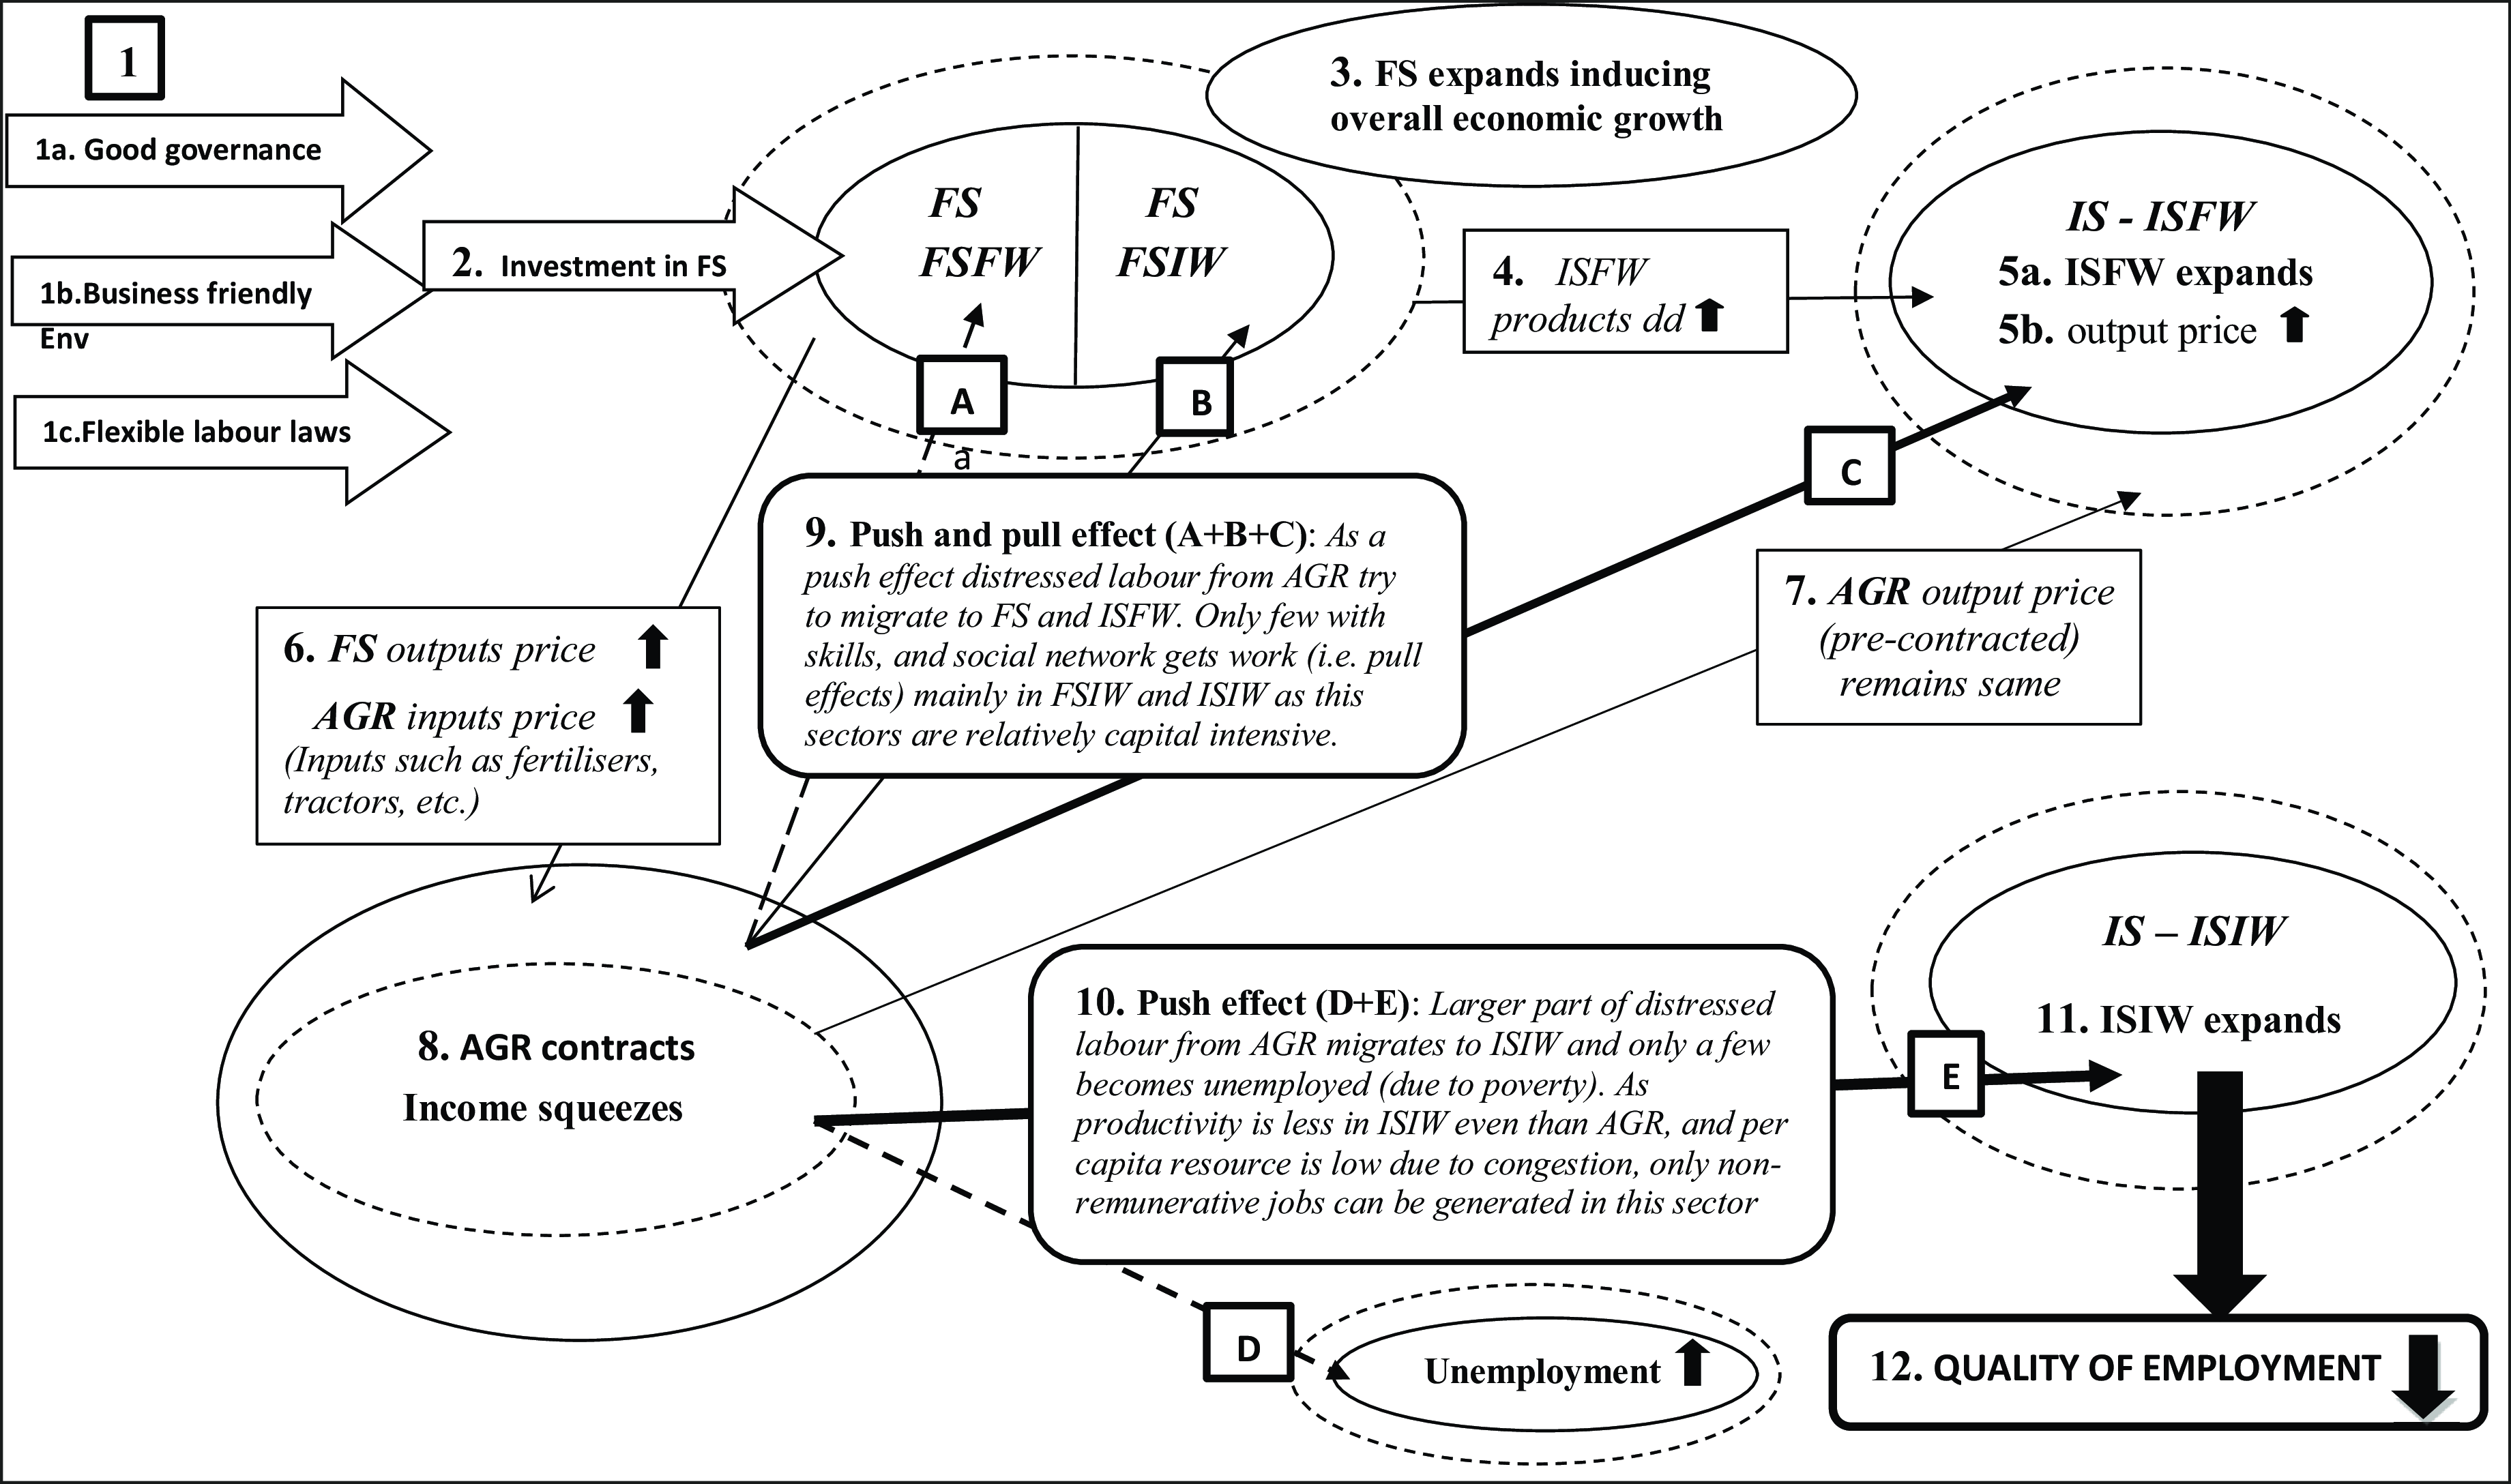
Basic features of our economy
There are three broad sectors: (1) capitalist FS (abbreviated as FS) with two segments: (i) FS with formal workers (referred as FSFW) and (ii) FS with informal workers (referred as FSIW); (2) Informal sector (abbreviated as IS) with two segments: (i) informal sector with formal workers (referred as ISFW) and (ii) informal sector with informal workers (referred as ISIW); and (3) Agricultural sector (represented as AGR). Workers in the labour force are either engaged in one of these three sectors or are unemployed (i.e. willing to work but unable to get the job).
The FS is driven by capital accumulation and is highly capital-intensive. FS produces investment and consumption goods (both food and non-food items) using modern technology, resources, and modern organisation. It also produces inputs (such as machinery, pesticides, fertilisers, etc.) for the agricultural sector and consumer goods (like fast-moving consumer goods, garments, consumer durables, etc.) for all. This sector depends on the ISFW (informal sector with formal workers) to purchase cheaper commodities both for production and consumption (via market linkages/subcontracting).
The ISFW consists of mainly urban and large units and is relatively capital-intensive. ISFW produces non-farm products using machinery, skilled and hired labour, and indigenous resources. ISIW consists of rural and small units and is labour-intensive. This sub-sector produces non-farm products, using mainly family labour, rudimentary tools, indigenous resources, and traditional organisations (such as family firms/ cottage industries, etc.). Moreover, productivity in this sector (ISIW) is not only less than FS and ISFW but is also lower than that of the agricultural sector (AGR) (Sadhu and Chakrabarti Reference Sadhu and Chakrabarti2018).
The AGR supplies food and agro raw materials to all other sectors while demand for inputs such as machinery, HYV, pesticides, etc., from FS and consumption goods (such as garments, traditional equipment, etc.) from the ISFW and ISIW. Further, the petty farmers in the AGR do not have any control over their output price, as their output is acquired by the big traders and intermediaries of the ISFW at a (pre-) contracted fixed price. Even if there is a variation (mainly a decrease) in the quantity of output, this (pre-contracted) price will not change with the presence of hoarders and brokers.
Dynamics of the framework (Pull and push effects)
Referring to Figure 4, we describe the stages of dynamics of the framework as below:-
1. The better standard of governance accompanied by a business-friendly environment and flexible labour law regulations create an atmosphere conducive to investment in the FS sector
2. Investment in the FS increases,
3. This leads to the expansion of the FS and also enhances the overall economic growth.
4. When FS expands, the level of demand for ISFW output increases (as they are linked through input-output relations).
5. Increase in output demand induces ISFW activities, given that there are underutilised resources, resulting in (a) expansion of ISFW, and (b) increase in the price of ISFW outputs.
6. With a rise in ISFW output price, there is a cost-push increase in FS product price, too (as ISFW output is used as consumer goods and inputs in the FS). Consequently, the price of FS outputs rises. The AGR sector uses FS outputs as inputs. Hence, the AGR sector faces high input prices due to a price rise in the FS.
7. However, the farmers cannot get a higher price than the pre-contracted one due to the presence of the big traders and intermediaries despite cost increase.
8. Moreover, this leads to a fall in the terms of trade for the AGR sector vis-à-vis the rest of the economy. Consequently, the real income of the farmers is squeezed, resulting in a distressed condition in this sector.
9. Now, these changes will have both push and pull effects. As a push effect, the distressed labour from the AGR sector will try to migrate to FS and ISFW. However, this migrant labour cannot be absorbed into these sectors; only a few with skills, education, work experience, and social and economic networks will be able to get employment (through the pull effects) as these sectors (FS and ISFW) are capital-intensive. Moreover, FS is relatively capital intensive than the other sectors, and very little employment (mainly as an informal worker) is generated in this sector with its expansion.
10. So, a large part of the distressed labour, therefore, will be pushed to ISIW or become unemployed. Nevertheless, most of the individuals (particularly the marginalised sections), due to extreme poverty cannot afford to remain unemployed. (Basole et al Reference Basole, Abraham, Rakshit, Vijayamba, Shrivastava and Halder2023; Kapoor Reference Kapoor2020)
11. Subsequently, the ISIW expands.
12. However, productivity in ISIW is lower than in the other sectors, including agriculture. Additionally, the per capita resource will be reduced due to congestion. As a result, the per capita income in the ISIW will be less. Consequently, only non-remunerative informal jobs can be generated in the ISIW. Moreover, this may have resulted in a deterioration of the quality of employment.
Overall, this framework indicates that the general economic progress and efforts towards good governance, better business regulatory environment, and better labour law-related compliance, are not contributing substantially to the quality of employment. Perhaps, the very pattern of growth and the so-called good governance initiatives (pushing for formalisation and accumulative growth) are leading to the proliferation of informality, and putting a drag on employment quality.
Based on this, we posit the following propositions:
The quality of employment is negatively influenced by –
1. overall economic growth/an increase in macroeconomic activities
2. an increase in FS activities
3. the quality of governance
4. better business regulatory environment and flexible labour law-related compliance
We will explore whether these propositions are corroborated by the Indian data.
Probable determinants of quality of employment in India
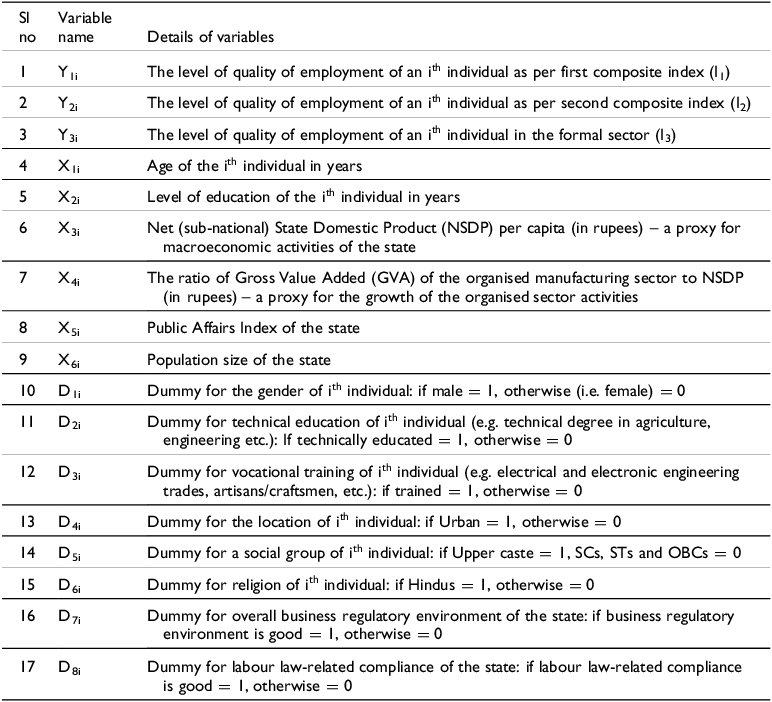
To find out the probable determinants that could influence the pattern (deterioration/stagnation) of quality of employment in India, we take up the composite indices (I1, I2 and I3), which we constructed earlier, as dependent variables. As noted above in the methodology section, we take the individual-level aspects such as age, gender, education, skills, rural-urban locations, and socio-religious identities of an individual as control variables.
Now, we turn to the main determinants, i.e. the macro-level determinants of employment quality, following the theoretical framework and literature. We take up aspects such as expansion of the macroeconomic activities, extension of the organised sector, improvement in the quality of governance, increased flexibility of the business regulatory environment, and the relaxation of the labour regulations. Accordingly, ‘Net State Domestic Product (NSDP) per capita’ is taken as a proxy variable for capturing the increase in macroeconomic activities. Next, we use a variable ‘the share of GVA (gross value added) of the organised/formal manufacturing sector out of the total NSDP’ representing the expansion of the organised sector. ‘Public Affairs Index’Footnote 11 data, as reported by the Public Affairs Centre, has been taken as a substitute for measuring good governance. The ranking/rating of Indian states on the business regulatory environmentFootnote 12 and labour law-related complianceFootnote 13 in the manufacturing sector, as given by the Planning Commission, Government of India (2014), have been used as proxy variables for measuring the business regulatory environment and better labour law regulations.
Moreover, the population of a state is the proxy for state size, and a greater size should have administrative issues and should adversely affect the overall quality of employment. However, we are using state population mainly as a control variable.
Lastly, our understanding is that the overall economic environment is crucial for getting decent work for the people. If the environment becomes conducive, there is a higher probability of getting quality employment. Consequently, as a method, we have taken the following strategy: for all the individuals of a particular sub-national state, we assign the same state-level value; as we move to another state, for the other group of individuals, we assign a different state-level value (as per data for this second state).
Taking these variables, we run the ordered logistic regressions on three composite indices. The regression models are given below in Box 1, while the details of the variables are given in Table 2. Table A5 (appendix) gives the mean and standard deviation of the variables we deal with.
The ordinal logistic regression model
Equation 1:
 $$\eqalign{ & {Y_{1i}} = {\rm{ }}{\beta _o} + {\rm{ }}{\beta _1}{X_1}_i + {\beta _2}{X_2}_i + {\beta _3}{X_3}_i + {\beta _4}{X_4}_i \cr & + {\beta _5}{X_5}_i + {\rm{ }}{\beta _6}{X_6}_i + {\beta _7}{D_1}_i + {\beta _8}{D_2}_i + {\beta _9}{D_3}_i \cr & + {\beta _{10}}{D_4}_{i{\rm{ }} + }{\beta _{11}}{D_5}_i + {\beta _{12}}{D_6}_{i{\rm{ }} + }{\beta _{13}}{D_7}_i + {\beta _{14}}{D_8}_i + {\rm{ }}{\mu _{ii}} \cr} $$
Equation 2:
 $$\eqalign{ & {Y_{2i}} = {\rm{ }}{\beta _o} + {\rm{ }}{\beta _1}{X_1}_i + {\beta _2}{X_2}_i + {\beta _3}{X_3}_i + {\beta _4}{X_4}_i + \cr & + {\beta _5}{X_5}_i + {\rm{ }}{\beta _6}{X_6}_i + {\beta _7}{D_1}_i + {\beta _8}{D_2}_i + {\beta _9}{D_3}_i \cr & + {\beta _{10}}{D_4}_{i{\rm{ }} + }{\beta _{11}}{D_5}_i + {\beta _{12}}{D_6}_{i{\rm{ }} + }{\beta _{13}}{D_7}_i + {\beta _{14}}{D_8}_i + {\rm{ }}{\mu _{ii}} \cr} $$
Equation 3:
 $$\eqalign{ & {Y_{3i}} = {\beta _o} + {\rm{ }}{\beta _1}{X_1}_i + {\beta _2}{X_2}_i + {\beta _3}{X_3}_i + {\beta _4}{X_4}_i + {\beta _5}{X_5}_i \cr & + {\rm{ }}{\beta _6}{X_6}_i + {\beta _7}{D_1}_i + {\beta _8}{D_2}_i + {\beta _9}{D_3}_i + {\beta _{10}}{D_4}_{i{\rm{ }} + }{\beta _{11}}{D_5}_i \cr & + {\beta _{12}}{D_6}_{i{\rm{ }} + }{\beta _{13}}{D_7}_i + {\beta _{14}}{D_8}_i + {\rm{ }}{\mu _{ii}} \cr} $$
where i=1,2,3……………………….n
The details of variables taken for our study
Regression models: The regression equations are given in the boxes below.
Results of ordered logistic regression
The regression results (1–3) given in Table 3 illustrate that most of the macro-level factors (taken up in our study) have a significant negative impact on the quality of employment. Intrinsically, we see:
1. The quality of employment (overall as well as in the FS) is likely to decrease with an increase in overall macroeconomic activities (as measured in terms of per capita NSDP).
2. Although growth in the FS activities is likely to increase the overall quality of employment (in terms of both I1 and I2), it does not ensure improvement in the quality of employment in the FS (i.e. for I3).
3. The quality of employment in the FS is likely to increase with improvement in the quality of governance. However, in general, the quality of employment is likely to reduce with the extent of good governance.
4. The quality of employment (overall as well as in the FS) is likely to decrease with a better business regulatory environment and flexible labour laws.
The ordered logistic regression estimates
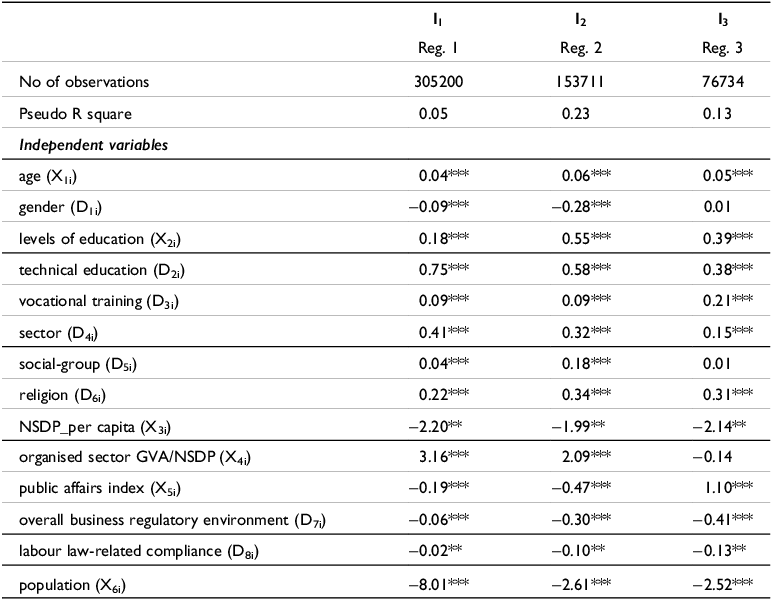
Note: *, ** and *** imply significance at 1, 5 and 10% levels, respectively.
So, the above regression results confirm our propositions 1 and 4 (mentioned in the earlier section) but reject propositions 2 and 3 with few exceptions. The increase in macroeconomic activities, a better business regulatory environment, and conducive labour law regulations have a significant negative impact on the quality of employment. However, propositions 2 and 3 are partly rejected: the growth in FS activities has no significant impact on the quality of employment in the FS but influences positively on employment quality in general (for both I1 and I2). Besides, a better standard of governance negatively influences the quality of employment in general but has a significant positive impact on employment quality in the FS.
Discussion on the above findings
The above findings indicate that despite consistently high economic growth and good governance in India, the quality of employment is not only poor but is either deteriorating or not improving over time. Intrinsically, the levels/scores of the quality of employment (as per the composite indices, including both formal and informal sectors) for the majority of workers are low. Most importantly, the shares of workers at the lowest levels/scores of indices (for I1 and I2) have increased, while they have either decreased or remained stagnant at the higher levels. Although the condition of FS workers seems to have improved after 2022, the share of these workers is less than half.
Next, the theoretical framework suggests that a high rate of economic growth, expansion of the FS, liberalised and efficiency-oriented governance, business-friendly environment, and flexible labour laws fail to improve employment quality. The expansion of the FS (induced by good governance, better business regulatory environment, conducive labour law regulations, and overall good economic growth) increases the growth of the modern informal sector (i.e. relatively capital-intensive sector), but the growth of the remaining large segment of the informal sector (both farm and non-farm) might be obstructed, mainly due to resource drain. Most importantly, the growth process in the modern sector leads to a distressed condition (the real income of farmers diminishes) in the agriculture sector. So, a huge section of the distressed labour force from this agriculture sector is pushed to the petty informal sector as other sectors (i.e. formal and modern informal sectors) are relatively capital intensive. The petty informal sector, due to resource constraints as well as low productivity, would be able to generate only poor-quality employment.
Furthermore, the confirmatory analysis also delineates similar results to that of the theoretical framework. In India, most of the macro-level factors, such as an increase in macroeconomic activities, the extent of quality governance, better business regulatory environment, and labour law-related compliance, have a significant negative impact on the quality of employment. These results indicate that with an increase in the volume of macroeconomic activities, there is a proliferation of informality, resulting in low employment quality. In addition, aspects such as good governance, better business regulatory environment, and labour law-related compliance influencing negatively to employment quality could be due to the bias of government policies towards large corporations at the expense of the medium and small industries and especially the workers. Government policies, perhaps, are favouring the big corporate houses, presumably to enhance capitalistic economic growth. Capitalists driven by accumulation motive use capital-intensive technologies and are in favour of labour flexibility. Consequently, this policy orientation reduces demand for labour, adversely affects the overall work environment, and also weakens the collective voice of the workers, leading to a lack of overall quality of employment. In this context, we could note that India’s rank moved up from 130th in 2014 to 63rd in 2020 in the World Bank’s Ease of Doing Business Index,Footnote 14 indicating a business-friendly environment.Footnote 15 However, this business-friendly environment, as argued just above, may have significantly curtailed the rights of labour in general.
By and large, the findings indicate that the very pattern of growth and so-called good governance initiatives are not helping to generate quality employment. Indeed, they are perhaps leading to deterioration of employment quality. Generating more and better quality employment opportunities is the primary benchmark of any progress, yet seemingly still inadequate in India. The projection of India as a country of economic progress and social progress (so-called good governance) is dubious. Perhaps, the outcome of the Indian Lok Sabha election 2024 (the ruling party’s significant drop in seats) could be an indication that the pattern of economic growth and model of governance are not people-centric.
In lieu of a conclusion: Summary findings and some policy options
The main concern of the article has been to understand how far good economic growth and so-called good governance initiatives are helping to improve the quality of employment in India. In this context, this paper analyses the quality of employment in India for the working-age group, using key dimensions as proposed by ILO. Most importantly, this study examines the probable determinants that could explain the specific trends (the absence, stagnation, and deterioration) of the quality of employment.
Our analysis suggests that the quality of employment in India within the working-age group is poor and deteriorating/stagnant over time. In addition, both the theoretical framework and the confirmatory tests suggest that the macro-level aspects, such as ‘economic progress’, ‘good governance’, ‘labour law compliance’, and ‘better business regulatory environment’, appear not to contribute in any substantial way to the quality of employment.
On the whole, our study indicates that the capitalistic economic growth based on the neoliberal dictum of liberalisation-privatisation-globalisation is not sufficient for improvement in the quality of employment for the vast mass of people. Indeed, the pattern of capitalistic growth puts a drag on the quality of employment.
From our analysis above, we have found that the existence and expansion of informality is one of the fundamental reasons for the lack of quality employment in India. This indicates that the spread of informality needs to be checked to reduce the deficit in decent work. Formalisation of informal employment in the FS is crucial to improve employment quality. To do so, support from the government is essential, as the market cannot take care of this problem on its own. The linkages between the formal and informal sectors should be improved such that the technology and knowledge spillovers may result in inclusive growth.
Going beyond such government intervention and formal-informal sector linkages, cluster-based industrialisation for small enterprises and petty traders (involving millions of small and micro enterprises) may add to the quality of employment through synergistic effects, economies of scale, and enhanced bargaining power in input and output markets, as well as, through improved productivity, knowledge, and skills for these micro-units. In addition, for those who are unemployed, employment generation programmes such as the Mahatma Gandhi National Rural Employment Guarantee SchemeFootnote 16 should be focussed in both rural and urban areas. However, for all these, massive support from the State and civil society is necessary; and if the State fails to deliver, the role of political movement then becomes important.
Acknowledgement
Earlier versions of this paper were presented at IIM Calcutta Kolkata, IPEA and ISLE. Comments from discussants are gratefully acknowledged. The authors would also like to thank the members of the editorial board ELRR and the anonymous reviewers for their valuable comments and suggestions. However, the usual disclaimer applies.
Funding statement
This research received no specific grant from any funding agency in public, commercial, or not-for-profit sectors.
Competing interests
None.
Anamika Moktan is working as an Assistant Professor of Economics at Visva-Bharati (University), Santiniketan, India. Her research interests include Development Economics, employment quality, inequality, and gender issues.
Saumya Chakrabarti is a Professor of Economics at Visva-Bharati (University), Santiniketan, India. His research interests include Development Economics, labour issues with special focus on informal sector, and macroeconomics of developing countries. He has published in journals like Cambridge Journal of Economics, Review of Radical Political Economics, Economic and Labour Relations Review, Economic and Political Weekly, Indian Journal of Agricultural Economics, and Indian Journal of Labour Economics among others; and has written books published by Prentice Hall and Oxford University Press.
Appendix
Dimensions of decent work, proposed by International Labour Organization (ILO)
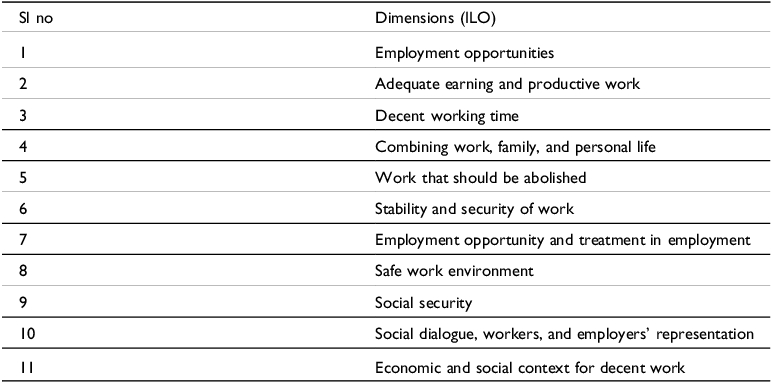
Source: ILO 2012, Table A, 16–17.
Mean and standard deviation values of the quantitative variables
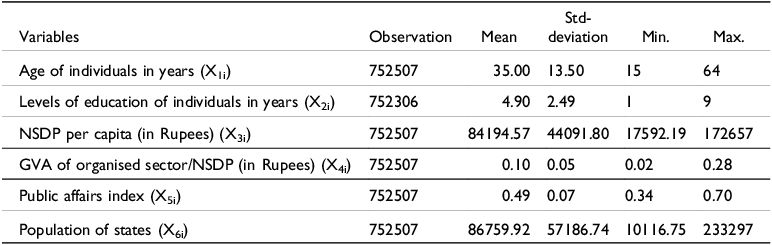
Source: Calculated based on NSSO report, ASI report, RBI website, population census and Public Affairs Centre report
Note: NSDP: Net state Domestic Product; GVA: Gross value added (manufacturing and service sector)


