


Highlights
-
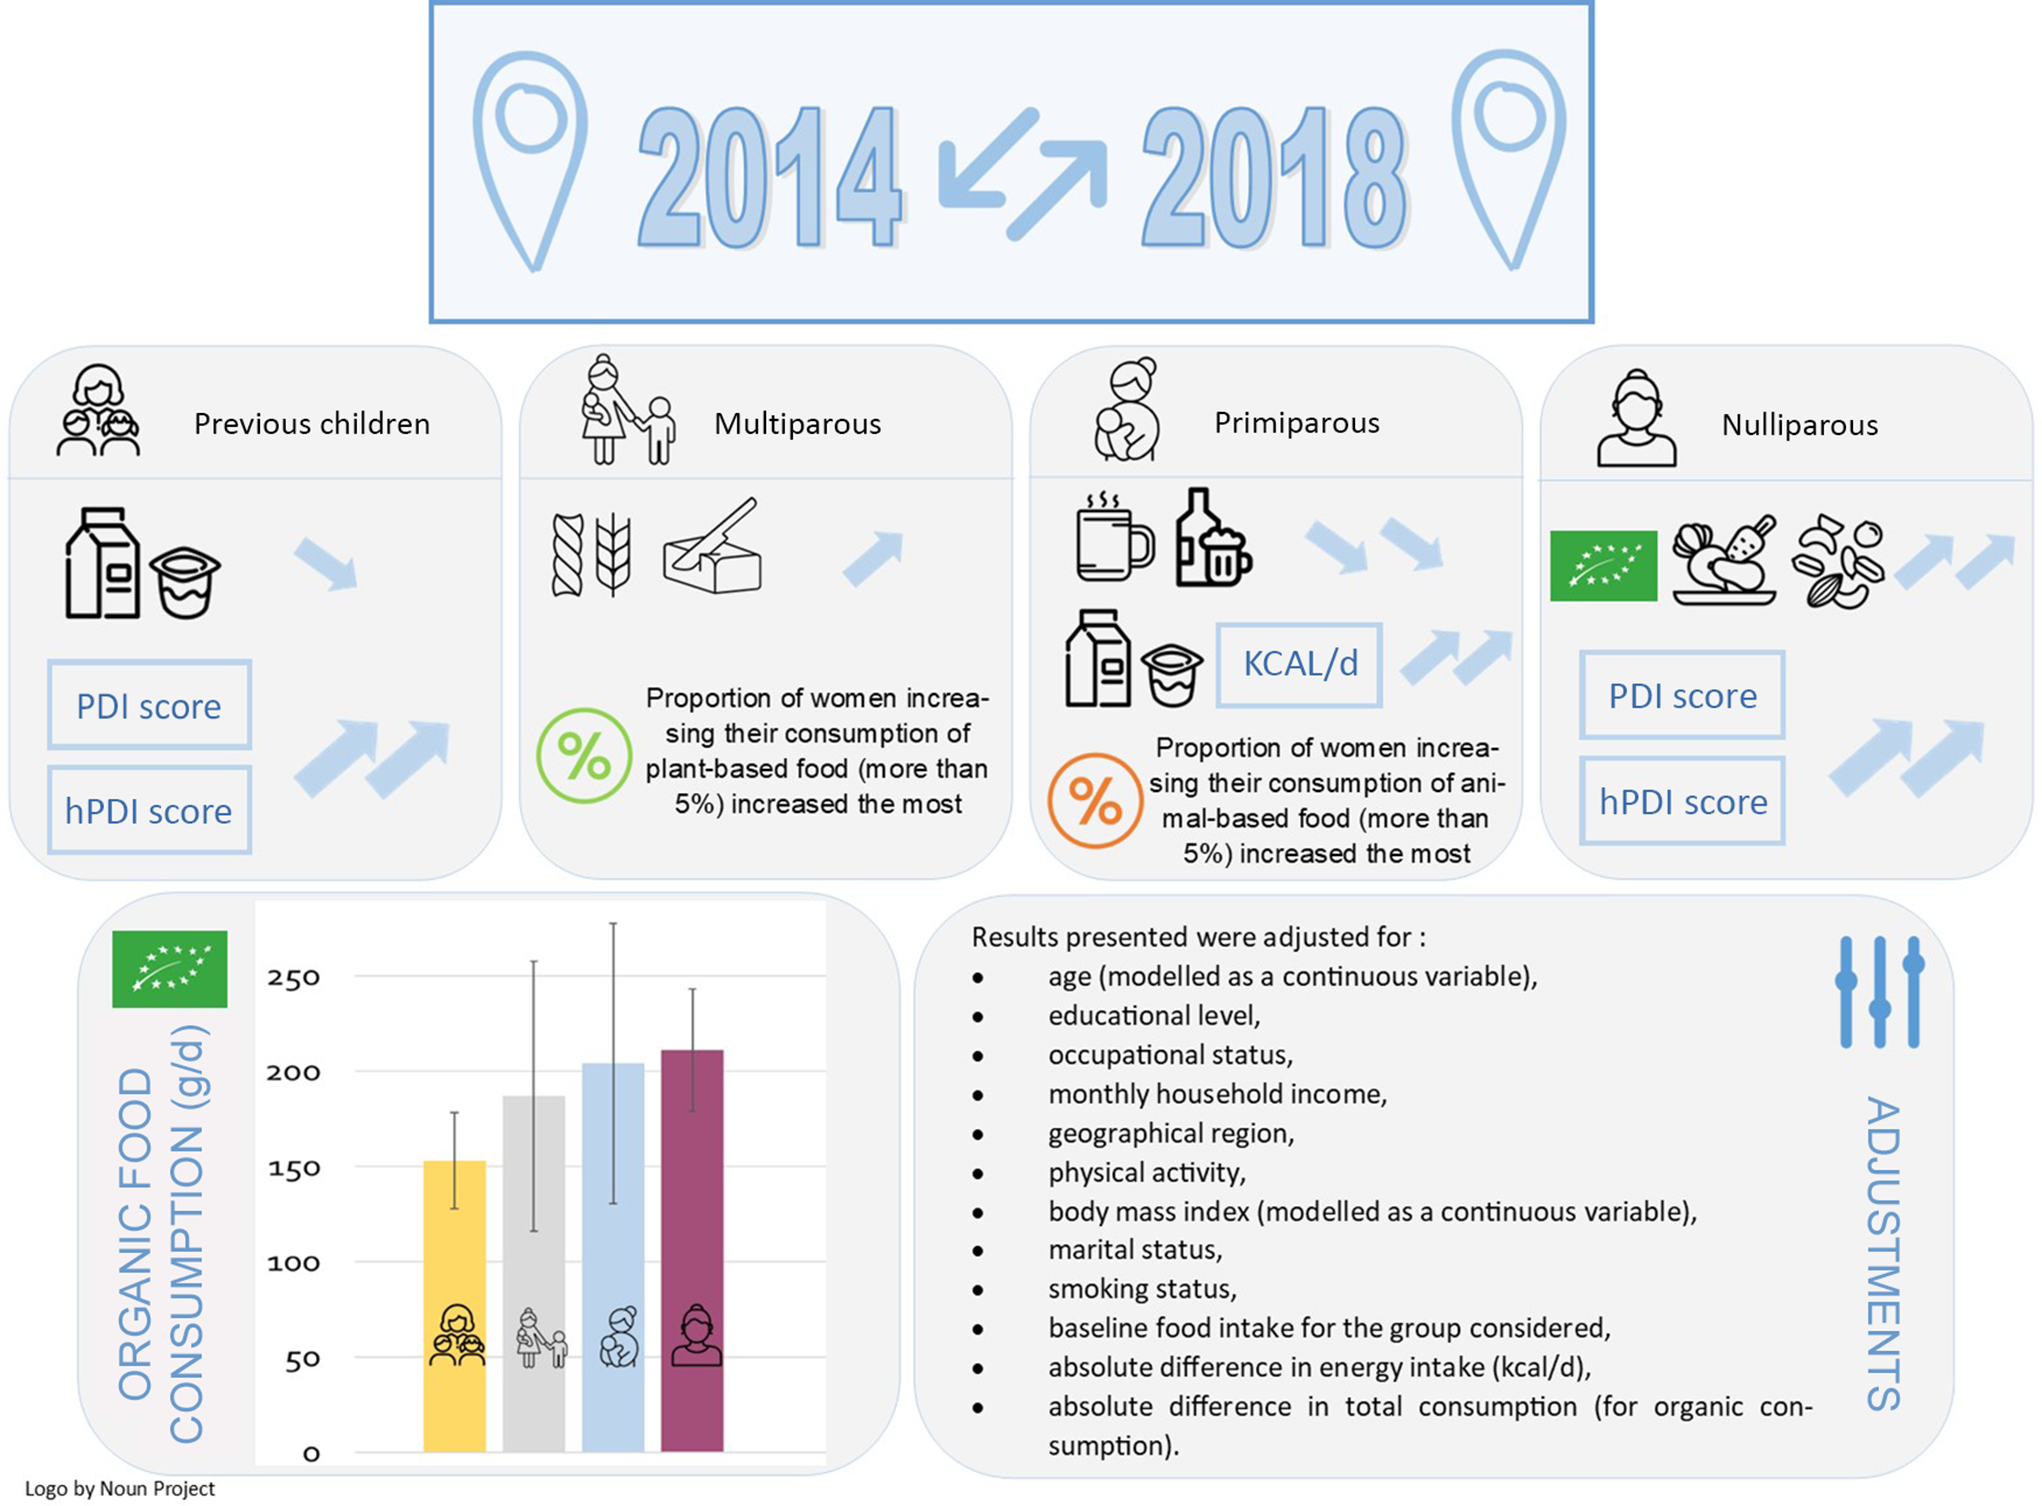
After many adjustments (socio-demographic, anthropometric and lifestyle), dietary changes during the 2014–2018 period were different depending on women parity status (‘previous children’, ‘multiparous’, ‘primiparous’, and ‘nulliparous’). In all studied groups, food changes tended to be overall healthier, but with varying degrees.
-
The ‘nulliparous’ women had the most sustainable consumption in 2014 (if we consider nutritional aspects, organic consumption and plant-based diet), and they were also the ones who changed the most towards more sustainability between 2014 and 2018 (increase of organic compared with ‘previous children’, PDI and hPDI (plant-based dietary index and healthy plant-based dietary index) compared with ‘primiparous’ women.
-
‘Primiparous’ women significantly increased their energy intake and their consumption of dairy products, and they significantly decreased their consumption of alcohol, coffee and tea. While the other women groups of parity status decreased, their consumption of dairy products and increased their consumption of alcohol, coffee and tea.
The birth of a child is a radical event in a woman’s life and may cause changes in her eating behaviour(Reference Moura and Aschemann-Witzel1,Reference Versele, Stok and Aerenhouts2) . There are various reasons explaining changes in women dietary behaviours with the birth of a child. Due to this emphasis of the link between maternal diet during pregnancy and the health of their child(Reference Gardner, Croker and Barr3), the mother can take advantage of this life event for developing new healthy eating habits during pregnancy(Reference Forbes, Graham and Berglund4) and maybe adopt them over the long term. As food can be a factor of social identity(Reference Copelton5), motivations may come from the external context, such as social pressure ‘to be a good mother’ and will modify their diet to conform to societal norms(Reference Copelton5). During pregnancy and after the child’s birth, mothers may adapt or reconsider their own diet because they become responsible for and make decisions of feeding their child(Reference Moura and Aschemann-Witzel1). More physiological factors may also influence their short-term food choices, such as nausea, cravings and food aversion(Reference Forbes, Graham and Berglund4), even if their long-term effects are understudied. In addition, stress and anxiety may continue or intensify during the postpartum and affect the mother’s diet(Reference Trude, Black and Surkan6). This emotional situation would be strongly related to the women parity(Reference Martínez-Galiano, Hernández-Martínez and Rodríguez-Almagro7).
In addition, as in the general population, the Programme National Nutrition Santé recommends increasing the consumption of organic food(8). Some pregnant women will particularly increase their consumption of organic food products(Reference Torjusen, Lieblein and Næs9) due to two main reasons. On the one hand, for health protection as a growing body of studies suggest that eating organic food during pregnancy could be beneficial for the health of pregnant women and their children(Reference Torjusen, Lieblein and Næs9–Reference Brantsæter, Torjusen and Meltzer11). On the other hand, to preserve the environment, having a child can contribute to an awareness of the need to ensure a sustainable environment for future generations. We hypothesise that women having their first child will have healthier diets containing more organic food than other groups of women. Furthermore, it is possible to suggest that they would for the same reasons tend towards more sustainable diets such as diets consisting of more plant foods and less animal foods, more fibre, more legumes and more organic foods(Reference Aleksandrowicz, Green and Joy12–Reference Gomiero15).
As in the general population, socio-demographic factors may also influence mothers’ diet. For example, women in vulnerable situation, including unemployed women, would have a less healthy diet during pregnancy than more privileged women(Reference Fernández-Gómez, Luque-Vara and Moya-Fernández16,Reference Kadawathagedara, Ahluwalia and Dufourg17) . Parity could play a role during the postpartum period, between primiparous and multiparous women, primiparous women having more feelings of sadness, more problems with breast-feeding, more anxiety more depressive symptoms(Reference Martínez-Galiano, Hernández-Martínez and Rodríguez-Almagro7). This could influence food consumption(Reference Fernández-Gómez, Luque-Vara and Moya-Fernández16).
To our knowledge, no previous study has examined changes in maternal diet after childbirth over the long term. The main objective of this study was therefore to identify and characterise overall dietary changes over a 4-year period, expressed as overall diet quality and organic food consumption of nulliparous, primiparous, multiparous and women with children before the study period. In addition, another aim was to identify if the level of education is a moderator between the birth of a child and the eating behaviour.
Materials and methods
The NutriNet-Santé cohort
The NutriNet-Santé cohort, launched in 2009, is a French study that aims to investigate the relationship between nutrition and health, as well as their determinants. Participants included in the cohort are volunteers and adults (over 18 years old). A specific web platform is used to collect the data. Participants must complete five questionnaires at inclusion, inquiring diet, health status, anthropometrics, socio-demographics and lifestyles and then for optimal follow-up they fill in these questionnaires again once or twice a year. Additional questionnaires are regularly proposed to collect data on specific topics such as Organic-Food Frequency Questionnaire (Org-FFQ), psychological features, food purchasing habits, environmental exposure, digestive disorders etc. All questionnaires are self-administered and completed online. Both the National Commission for Information Technology and Freedom and the INSERM Ethical Evaluation Committee have approved this work under the numbers 908 450 and 909 216 and 0000388FWA00005831. The study conforms to the guidelines of the Declaration of Helsinki and is registered with ClinicalTrials.gov (NCT03335644). Detailed data from the NutriNet-Santé cohort have been published elsewhere(Reference Hercberg, Castetbon and Czernichow18).
Data collection
Age (modelled as a continuous variable), educational level (less than high school diploma, undergraduate, postgraduate), and other self-administered individual characteristics including occupational status (unemployed, never employed, self-employed/farmer/employee/manual worker, intermediate professions and managerial staff/intellectual profession) and monthly household income per household unit (less than 1200€, between 1200 and 1800€, between 1800 and 2700€, between 1800 and 2700€, and more than 2700€) based on the monthly household income and the household composition were considered in this study.
Additional lifestyle variables, such as physical activity (low, moderate, high, missing data) measured by the International Physical Activity Questionnaires(Reference Hallal and Victora19) and smoking status (non-smoker, former smoker, smoker), were also assessed. Living area (via postcode) was reported and grouped as: rural, urban <20 000 inhabitants, urban between 20 000 and 200 000 inhabitants and over 200 000 inhabitants. Marital status was considered as: couple (civil union, cohabiting, married) or single (single, divorced or separated, widowed).
The socio-demographic, anthropometric and lifestyle variables in the different models were collected at the baseline of this specific study, i.e. data from 2014.
Dietary data
The Organic-FFQ (Org-FFQ) was completed twice, first between June and December 2014 and then in 2018. Each time, the questionnaire estimated the frequency of 264 organic and conventional foods and beverages over the previous year, for more information described elsewhere(Reference Baudry, Méjean and Allès20). This questionnaire is based on a previously validated questionnaire that does not distinguish the production origin of foods and beverages(Reference Kesse-Guyot, Castetbon and Touvier21). Using the published NutriNet-Santé food composition table, individual nutritional consumption was calculated(22). Participants were asked to complete the following options for each item: daily, weekly, monthly or yearly. Quantities were estimated using different methods, including photos of different portion sizes (seven options were available), use of portion units (one yoghurt, a slice of ham, an egg, etc.) or normalised quantities (a teaspoon, a glass, etc.). In addition, the proportion consumed as organic food was asked for each food or beverage (except those not available as organic such as water) by answering whether it was consumed never, rarely, half the time, often or always. The frequency modalities were then translated into 0, 25, 50, 75 and 100 %(Reference Baudry, Méjean and Allès20).
Recent research suggests that responses to food choice and behaviour questionnaires can be influenced by our desire to look our best(Reference Cerri, Thøgersen and Testa23). Which is why in September 2014, data on social desirability bias were collected using a validated questionnaire that included thirty-six personality items (subjective well-being, self-esteem, affectivity, etc.) with the objective of quantifying self-dupery and heterodupery (lack of self-knowledge v. control of self-image). A seven-level scale was defined for each item, ranging from ‘completely false’ to ‘completely true’ (range of 2–10)(Reference Jocelyne, Franck and Kop24). The internal validity of these two components was calculated via Cronbach’s alpha, which is 0·8 for heterodupery and 0·85 for self-dupery. A higher score reflects a greater desirability bias.
Dietary indexes
All 2014 scores were developed using 2014 Org-FFQ consumption and the same for 2018. Two nutritional quality scores were calculated. The first, the ‘Programme National Nutrition Santé Guidelines Score 2’ (PNNS-GS2), is a score that ranges from –∞ to 14·25, and it assesses adherence to French food-based dietary recommendations (online Supplemental Material 1). Detailed information about this score are available elsewhere(Reference Chaltiel, Adjibade and Deschamps25,Reference Kesse-Guyot, Chaltiel and Fezeu26) . The second, the Diet Quality Index based on the Probability of Adequate Nutrient Intake (PANDiet score), measures the individual nutritional adequacy for twenty-eight nutrients compared with the nutritional reference values defined by the Agency for Food, Environmental, and Occupational Health and Safety’s nutritional recommendations. The PANDiet score, which ranges from 0 to 100, is the average of two subscores: moderation and adequacy (online Supplemental Material 2). More information can be found elsewhere(Reference de Gavelle, Huneau and Mariotti27,Reference Verger, Mariotti and Holmes28) .
Other existing scores have also been calculated to measure the proportion of plant foods consumed in the diet. The plant-based diet index (PDI) score is composed of plant food groups receiving ascending points (from 1 to 5, with 5 corresponding to the highest plant food consumption). In this score, animal food groups were scoring in reverse order. The points are calculated from the quintile values extracted from the sample completing the Org-FFQ in 2014. Derived from the PDI score are the hPDI (healthy plant-based diet index) and unhealthy plant-based diet index scores, which distinguish between healthy and unhealthy plant-based foods (online Supplemental Table 1). These three scores range from 12 to 60. More information can be found elsewhere(Reference Satija, Bhupathiraju and Rimm29).
Finally, a final score, the comprehensive diet quality index (cDQI) was computed, which is the sum of the plant-based diet quality index and the animal-based diet quality index (aDQI), which ranges from 0 to 85. Both are calculated using either literature-based thresholds or consumption quintiles values of participants who completed the first Org-FFQ. The purpose of this score is to discriminate between healthy and unhealthy plant and animal foods (online Supplemental Table 2). More information could be found elsewhere(Reference Keaver, Ruan and Chen30).
Selection of participants
After excluding under- and over-reporters (participants who had an energy intake to energy requirement ratio below or above the cut-offs of 0·35 and 1·93 were excluded)(Reference Baudry, Méjean and Allès20), people living outside mainland France and missing covariate data, 18 108 participants completed both the Org-FFQ14 and Org-FFQ18 questionnaires. Then, women over 50 years of age and men were excluded, resulting in a total sample of 4194 women of childbearing age (online Supplemental Fig. 1).
Women were classified into four groups (online Supplemental Fig. 2):
-
Previous children: women who already had at least one child before the completion of the Org-FFQ14 or who were pregnant when they completed the Org-FFQ14, with no additional child born between Org-FFQ14 and Org-FFQ18 (n 2269).
-
Multiparous: women who gave birth before (or pregnant during) completing the Org-FFQ14 who had had at least other children between the two questionnaires (n 237).
-
Primiparous: women who had had a first child between the two questionnaires (without being pregnant during the Org-FF18) (n 231).
-
Nulliparous: women without any child before Org-FFQ18 (but could be pregnant during Org-FFQ18) (n 1457). Women without children were kept in the study sample because they allow for comparison with women who have had children.
Women who reported a pregnancy but did not report a new child in the following months were not considered as mothers with a new child.
Statistical analysis
Twenty-two food sub-groups were created based on the 264 items: whole-grain products; vegetables; fruit; nuts, seeds, legumes; vegetable oils; coffee, tea; fruit juices; refined grains; potatoes; sugar-sweetened beverages; sweets and desserts; fish, seafood; dairy products; poultry; processed meat; meat; eggs; other fat; other fatty, salty, and sweet products; dairy and meat substitutes; alcoholic beverages and other non-alcoholic beverages. Classification of food groups as healthy and unhealthy animal and plant-based foods for the comprehensive diet quality index score is presented in online Supplemental Table 3.
ANCOVA models were performed to study the associations between women parity status and daily food group or daily indexes. To better focus on the role of the birth of a child on diet, various models were conducted. Several models with different adjustments were developed. The aim was to reflect as accurately as possible the impact of having a child in a specific period, while minimising societal effects. Model Uadj was unadjusted. Model Adj was adjusted for baseline (2014) age (modelled as a continuous variable), educational level, occupational status, monthly household income, geographical region, physical activity, BMI (modelled as a continuous variable), marital status, smoking status, baseline food intake for the group considered and absolute difference in total energy intake (kcal/d). Model Dsb was model Adj with an additional adjustment for social desirability bias. Of note, social desirability bias data were available for 3980 women (95 % of the sample). For the categorical variables, the modalities are presented in the data collection section. In addition, additional sensitivity analyses were performed with the Adj model by removing pregnant women at Org-FFQ14 (n 4084).
For models related to the evolution of organic food consumption over time, an additional adjustment was performed. To consider the difference in organic consumption, it was important to adjust for the difference in overall consumption (conventional and organic) to be more proximate to the proportion of organic food in the total diet. The models were therefore called Adj bis and Dsb bis, respectively.
To consider the adjusted organic consumption quintile differences in the same way as the Adj bis model, we calculated the predicted values. The quintiles allow for a description of the distribution of women according to their parity status in terms of their change in organic consumption.
The predicted values of the main food group intakes in 2014 and 2018 at the two time points adjusted for age, educational level, occupational status, monthly household income, geographical region, physical activity, BMIbody mass index, marital status, smoking status and energy intake 2014 or 2018 (kcal/d) were also used to calculate the proportion of women increasing their intake by more than 5 %.
Using χ 2 tests, the four groups of women (‘Previous children’, ‘Multiparous’, ‘Primiparous’ and ‘Nulliparous’) were compared in terms of socio-demographic, lifestyle and anthropometric characteristics. ANOVA or ANCOVA tests with Tukey adjustment for multiple testing were used to examine differences in dietary consumption, nutritional scores and organic consumption (and consumption in 2014) among the four groups. The residual method was used to adjust for energy intake for dietary indexes (PDI, hPDI, unhealthy plant-based diet index, PANDiet, plant to total protein ratio and PNNS-GS2)(Reference Willett and Stampfer31). The quintiles of differences in organic consumption (previously adjusted) according to women’s group were compared using a χ 2 test. The proportion of women increasing their adjusted consumption by more than 5 % according to main food groups, and parity status was also compared using a χ 2 test.
In a sensitivity analysis, stratification on educational level was performed and assessed whether there were differences over time in energy intake and PNNS-GS2 score by educational level. These additional analyses were tested by ANCOVA with Tukey adjustment. Similar analysis was conducted to test the difference in organic consumption between women who did or not mention ‘the birth of a child’ as a reason for consuming organic food (exclusively among primiparous and multiparous women).
Results
Baseline characteristics
Baseline socio-demographic, anthropometric and lifestyle data are presented in Table 1. ‘Primiparous’ women were the youngest and had the largest proportion of graduated women (together with multiparous women) and with the highest income. The ‘multiparous’ group includes the largest proportion of women with low levels of physical activity and women in couples. ‘Previous children’ women were the oldest and had more frequently ‘less and high school diploma’. The larger proportion of women who had never been employed (with students included in this category), with high physical activity was found in the ‘nulliparous’ group (Table 1).
Baseline socio-demographic, lifestyle and anthropometric characteristics by women parity group (NutriNet-Santé study, n 4194, 2014)
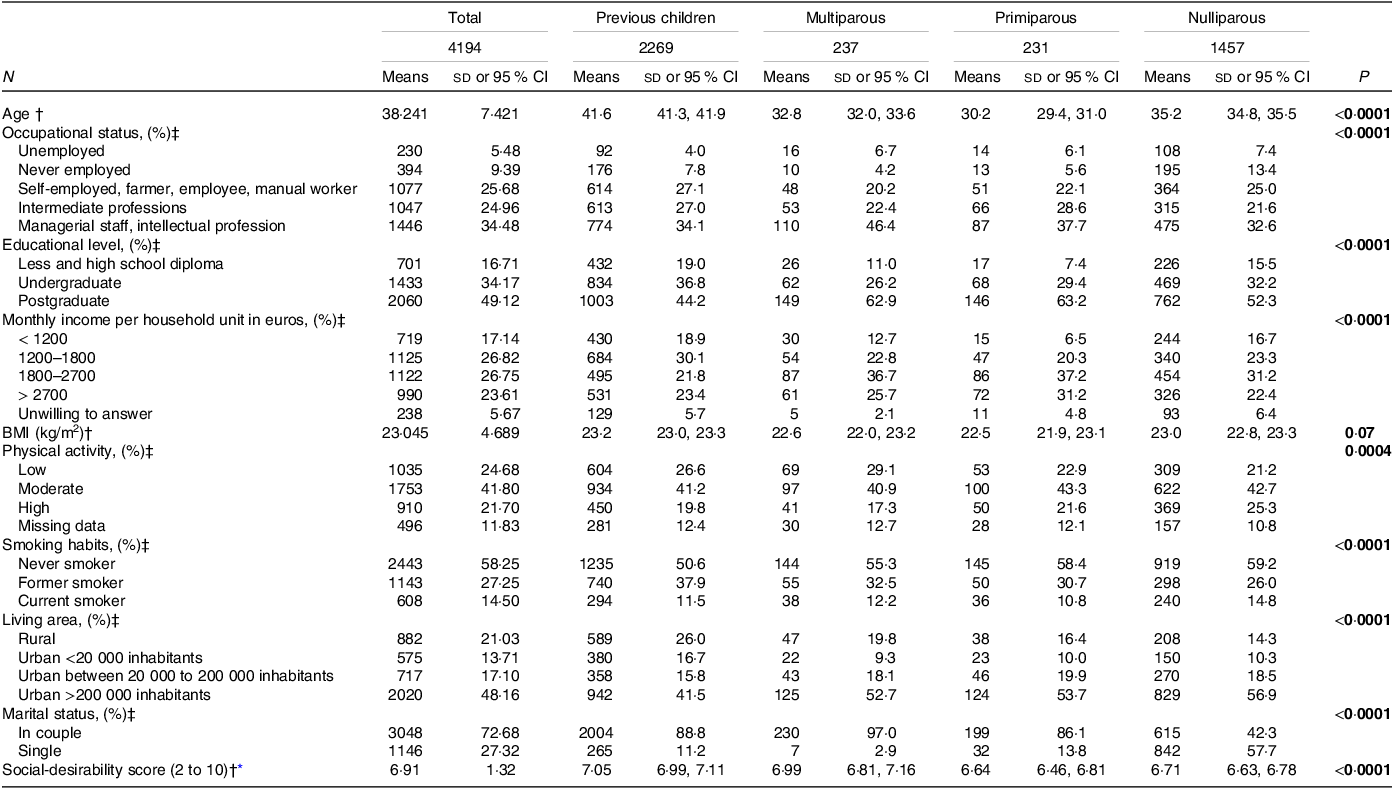
* n 3980 (respectively n 2161; n 219; n 224; n 1376). The higher the score, the greater the desirability bias.
† Values are means (sd or 95 % CI). P values were based on ANOVA test with Turkey adjustment for multiple testing.
‡ Values presented are frequency (percentages). P values were based on χ 2 test.
Results for 2014 food consumption are available in online Supplemental Table 4 and nutritional and plant-based scores (PDI score, hPDI score, comprehensive diet quality index score, plant-based diet quality index score, PNNS-GS2 score, PANDiet score and plant to total protein ratio) in online Supplemental Table 5.
Change in food consumption
Among the twenty-two food groups considered, women parity status was associated with the 2014–2018 change in consumption of seven food groups: vegetables, nuts/seeds/legumes, coffee/tea, refined grains, dairy products, other fat and alcoholic beverages (Table 2). Considering the model Adj, ‘Nulliparous’ women increased their consumption of vegetables, while ‘primiparous’ women decreased it, and increased their consumption of nuts, seeds, and legumes more than ‘primiparous’ and ‘multiparous’ women. They decreased their consumption of refined grains more than ‘primiparous’ and ‘multiparous’ women. With the same model, ‘Primiparous’ women decreased their coffee, tea, and alcohol consumption compared with other women groups who increased their consumption. They increased their dairy product consumption more than ‘nulliparous’ and ‘previous children’ women (Table 2). There were no significant differences in the consumption of whole-grain products, fruit, vegetable oil, fruit juices, potatoes, sugar-sweetened beverages, sweets and desserts, fish, seafood, poultry, processed meat, meat, eggs, other fatty, salty, and sweet products, dairy and meat substitutes and other non-alcoholic beverages (Table 2). Food consumptions were not different after removing from the sample, the women who were pregnant when the Org-FFQ14 was completed (online Supplemental Table 6).
Absolute differences over time (2018 v. 2014) in daily food group consumption by women parity group (NutriNet-Santé study, n 4194)†

* n 3980 (respectively n 2161; n 219; n 224; n 1376).
† Values are means (95 % CI).
‡ Butter, mayonnaise and cream.
§ Snacks, chips, salted biscuits, dried fruits, dressing, sauces, milky-desserts and mixed dishes.
|| Soya, soya milk plant-based cream.
¶ Chocolate or chicory with milk, chicory, water, infusion, kombucha and non-alcoholic beer.
Means annotated with a different letters (a,b,c) are significantly different means.
ANOVA (model Uadj) and ANCOVA (model Adj and Dsb) with Tukey’s post-hoc tests were used for testing differences between groups.
Model Uadj was unadjusted.
Model Adj was adjusted for age (modelled as a continuous variable), educational level, occupational status, monthly household income, geographical region, physical activity, body mass index (modelled as a continuous variable), marital status, smoking status and baseline food intake for the group considered and absolute difference in energy intake (kcal/d).
Model Dsb was model Adj further adjusted for social-desirability bias.
Change in dietary quality scores
Over the 2014–2018 period, all women groups had their dietary quality scores increased, as reflected by nutritional and plant-based scores, except for PANDiet and the ratio of plant protein to total protein (Table 3). However, limited discrepancies according to the women parity group were observed in these temporal changes. ‘Primiparous’ women increased their energy intake the most compared with other women groups. They also increased their PDI and hPDI scores less than ‘previous children’ and ‘nulliparous’.
Absolute differences over time (2018 v. 2014) in daily indexes by women parity group (NutriNet-Santé study, n 4194)†
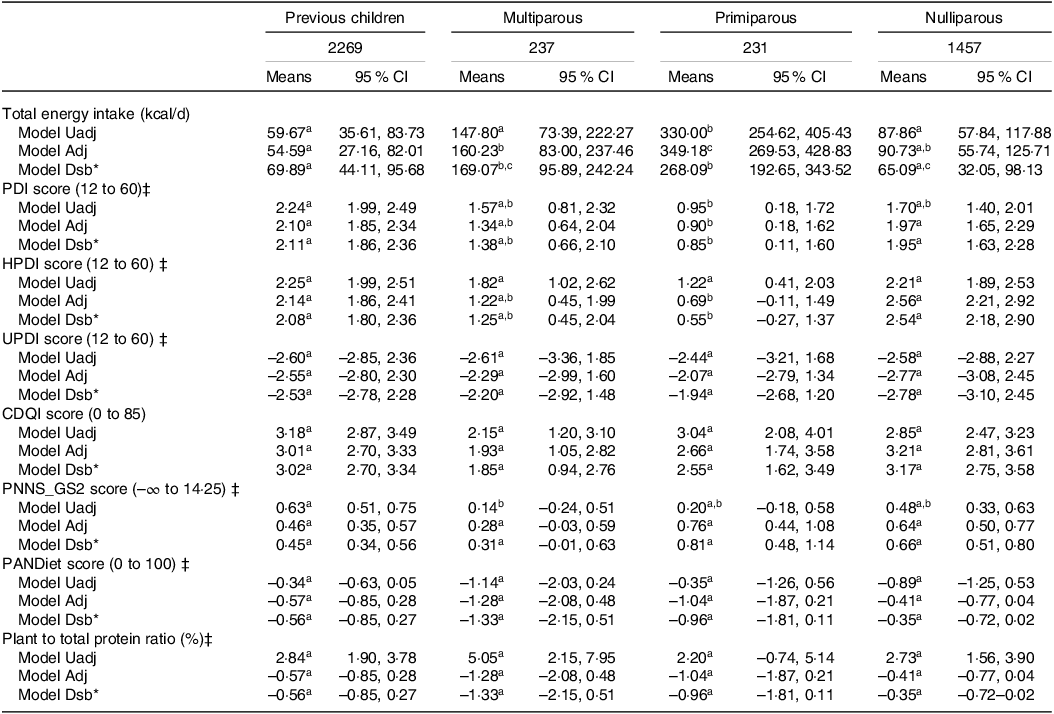
cDQI, comprehensive diet quality index; hPDI, healthy plant-based diet index; PANDiet, diet quality index based on the probability of adequate nutrient intake; PDI, plant-based diet index; PNNS-GS2, Programme National Nutrition Santé-Guideline Score 2; uPDI, unhealthy plant-based diet index.
* n 3980 (respectively n 2161; n 219; n 224; n 1376).
† Values are means (95 % CI).
‡ Values are adjusted with the residual method for energy intake.
Means annotated with a different letters (a,b,c) are significantly different means.
ANOVA (model Uadj) and ANCOVA (model Adj and Dsb) with Tukey’s post hoc tests were used for testing differences between groups.
Model Uadj was unadjusted.
Model Adj was adjusted for age (modelled as a continuous variable), educational level, occupational status, monthly household income, geographical region, physical activity, body mass index (modelled as a continuous variable), marital status, smoking status and baseline food intake for the group considered and absolute difference in energy intake (kcal/d).
Model Adj bis was adjusted for age (modelled as a continuous variable), educational level, occupational status, monthly household income, geographical region, physical activity, BMI (modelled as a continuous variable), marital status, smoking status, baseline food intake for the group considered, absolute difference in energy intake (kcal/d) and absolute difference in total consumption (conventional + organic).
Model Dsb was model Adj further adjusted for social-desirability bias.
Model Dsb bis was model Adj bis further adjusted for social-desirability bias.
The proportions of women who increased their consumption of the plant and animal and healthy and unhealthy food groups by more than 5 % according to their parity status are shown in online Supplemental Fig. 3.
Change in organic food consumption
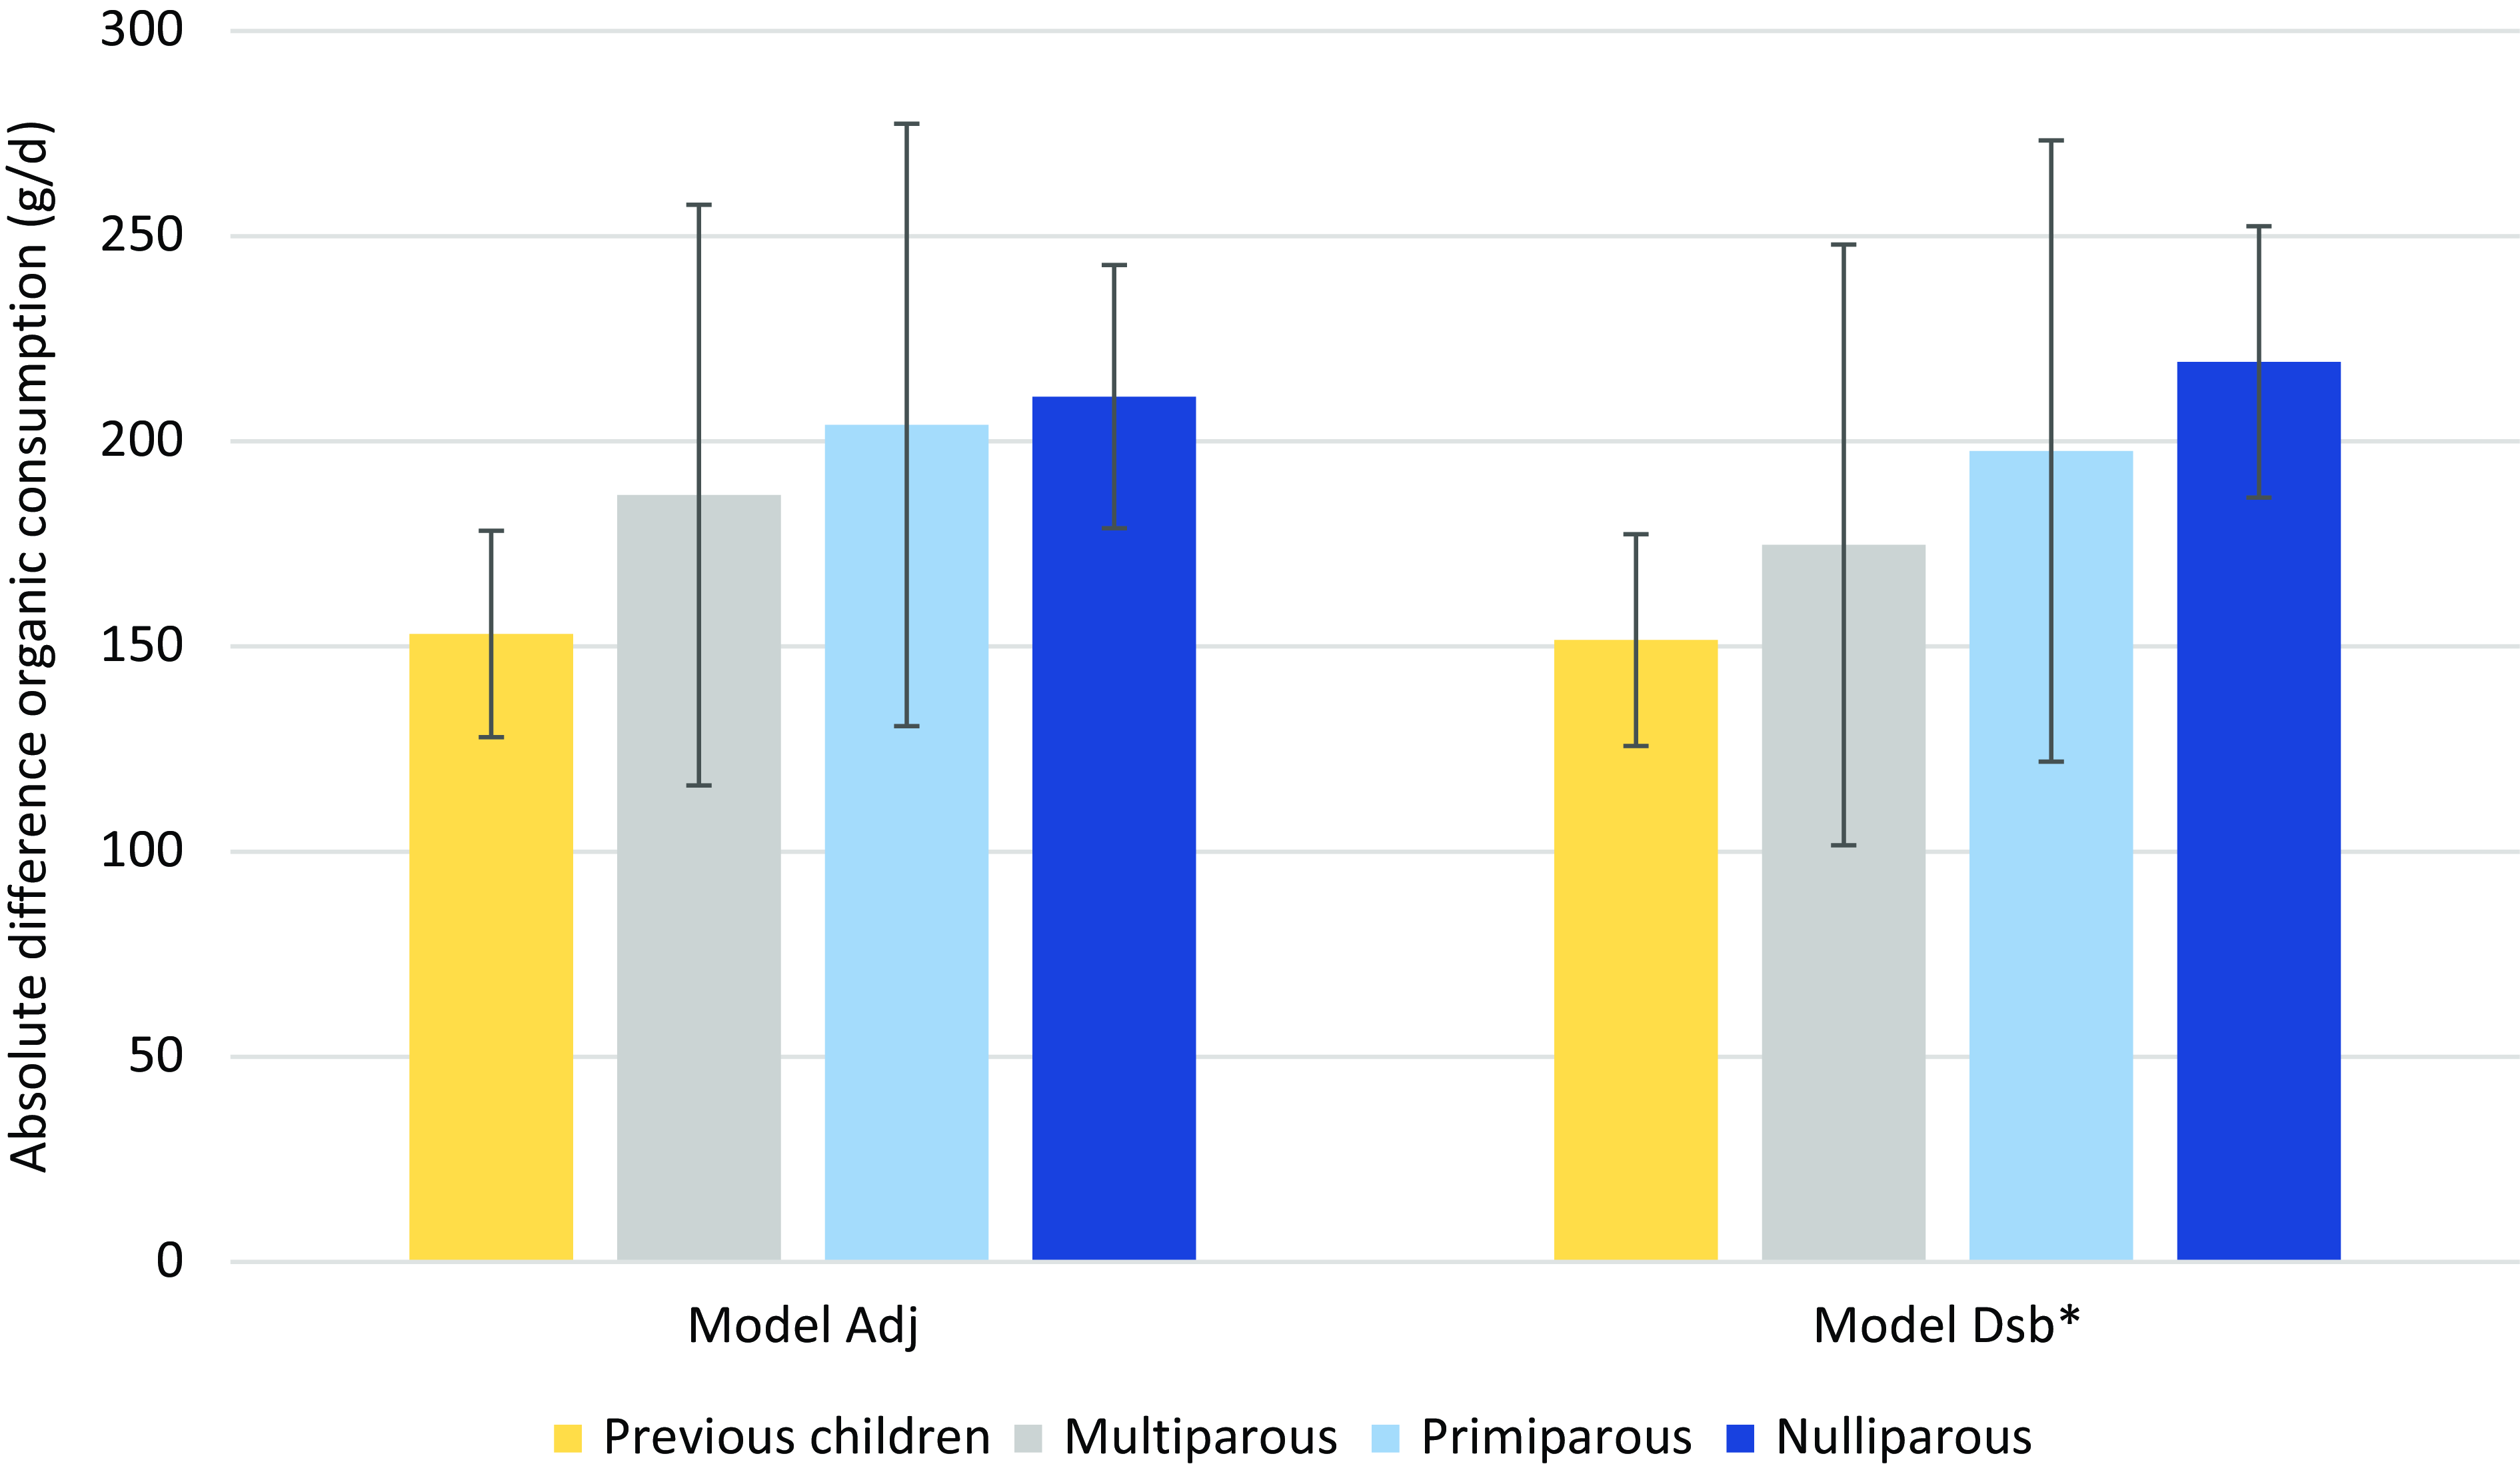
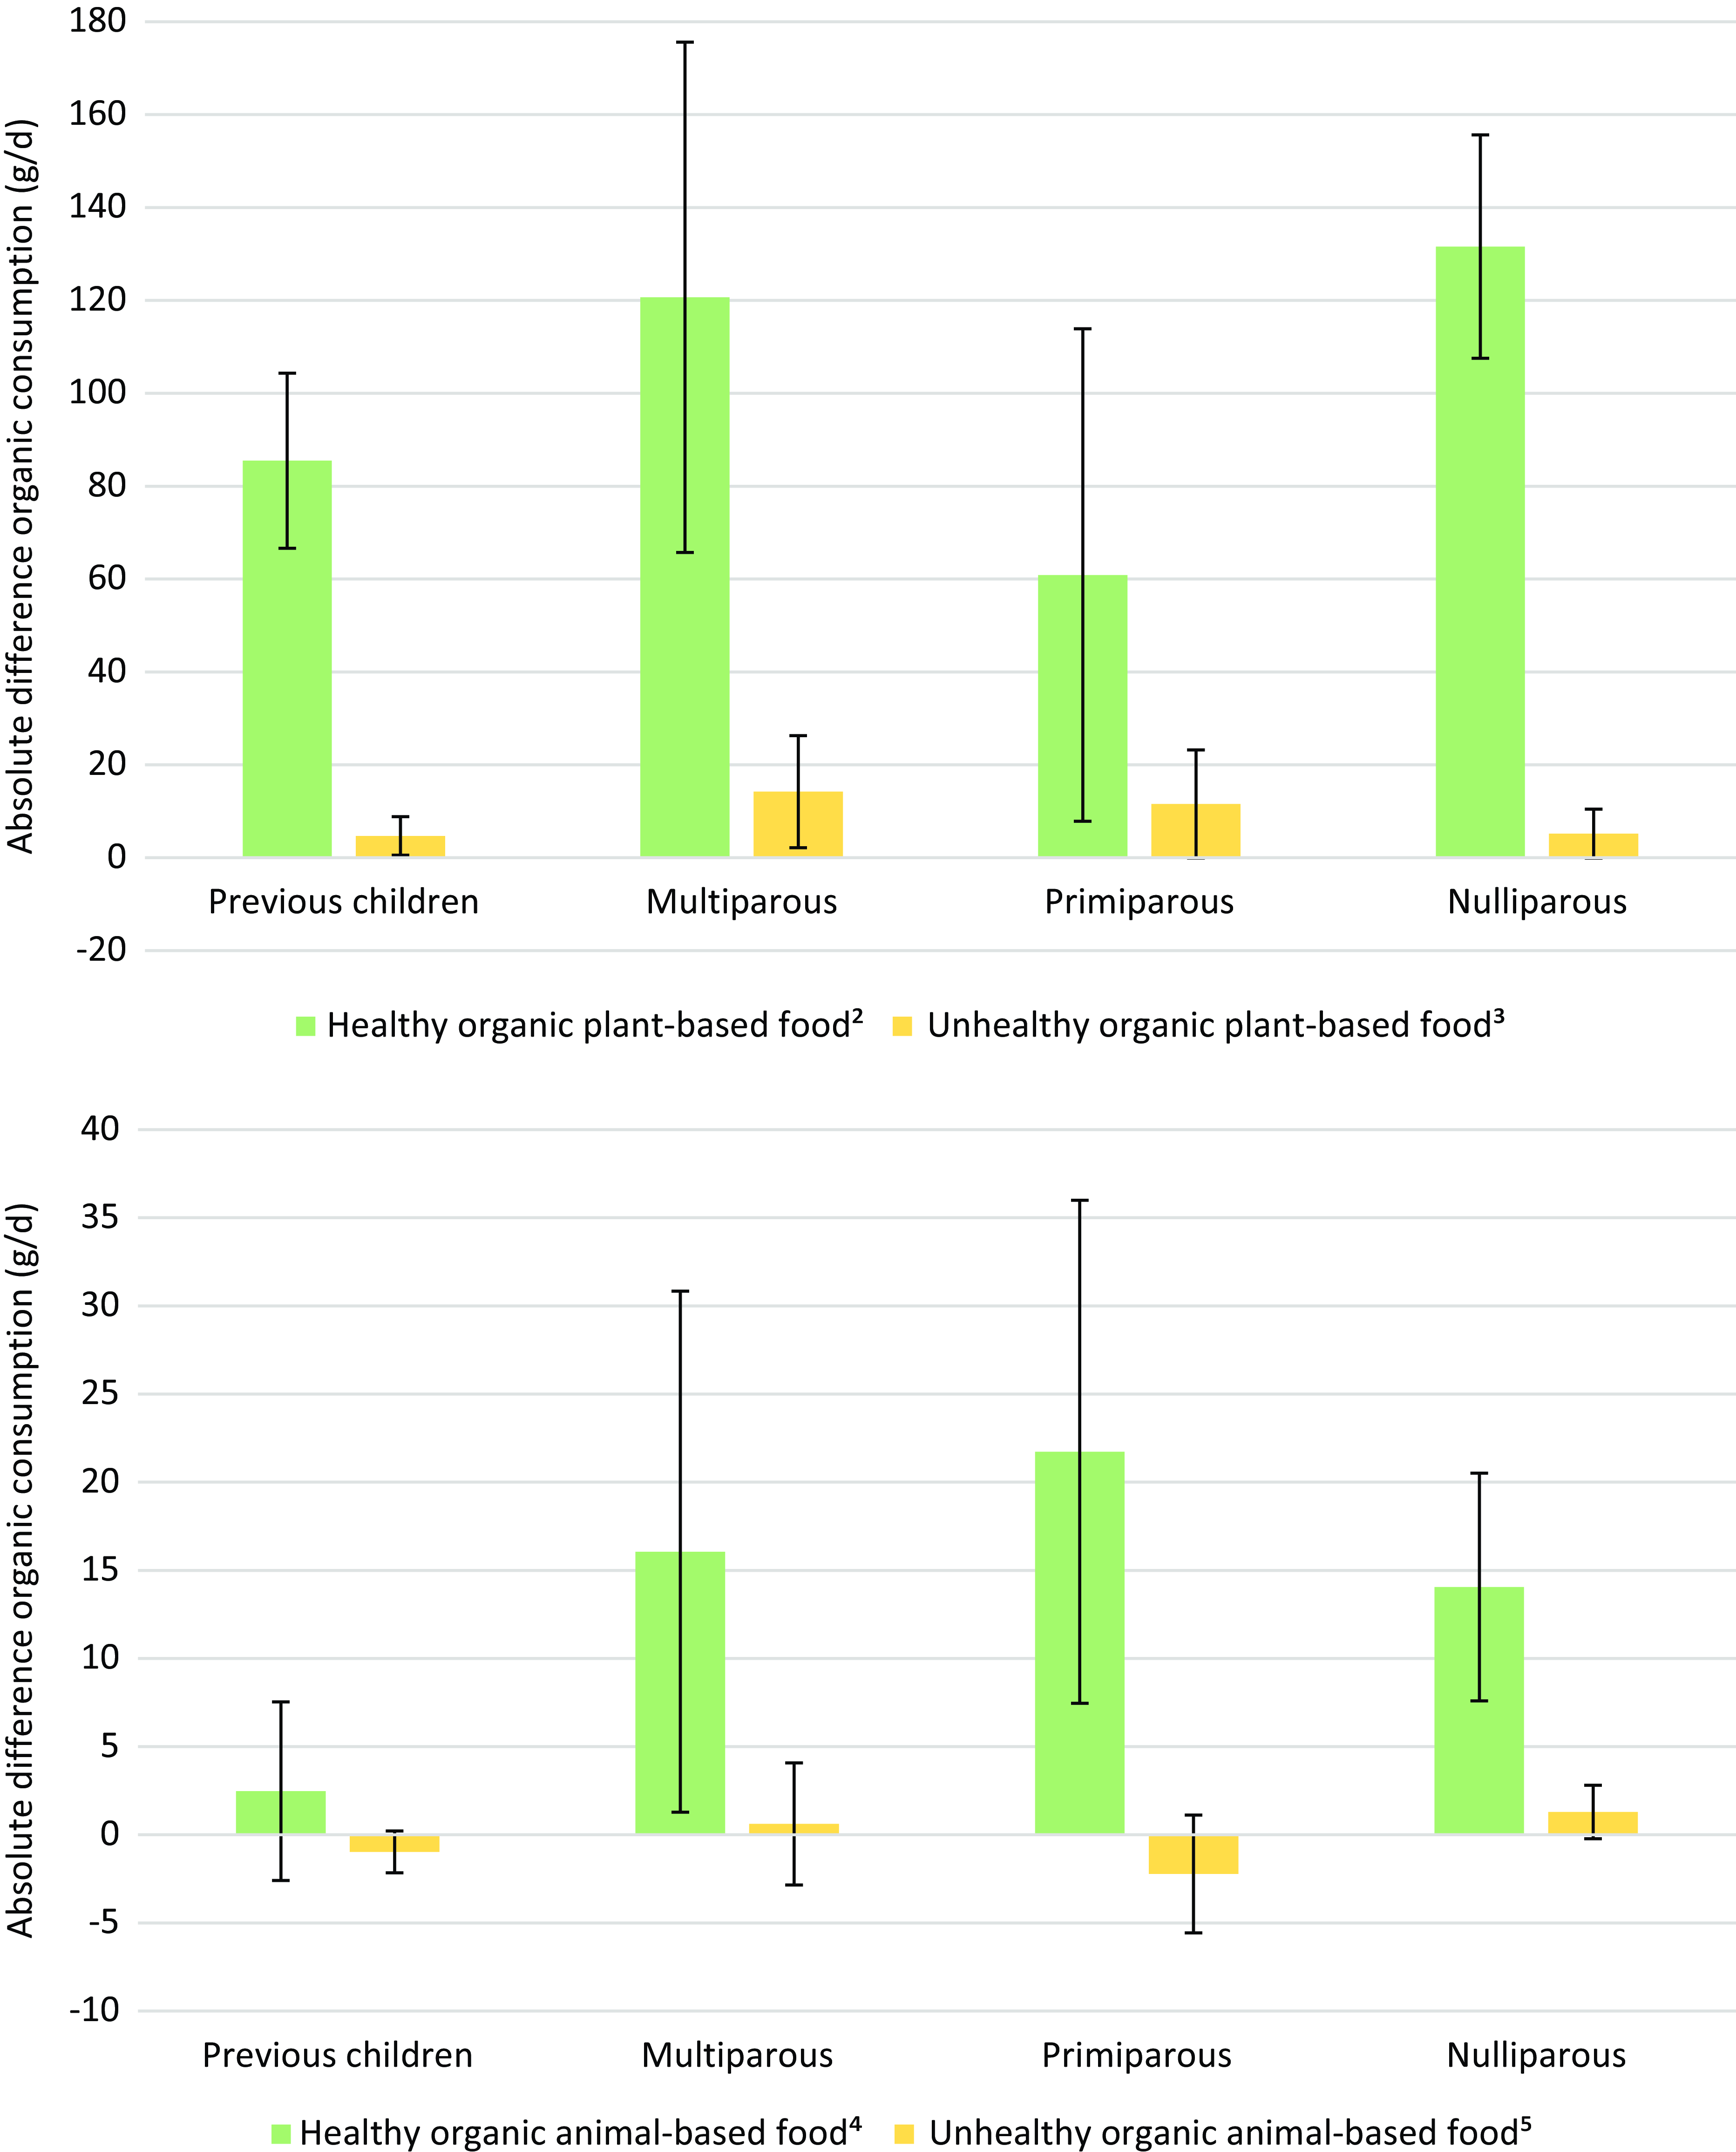
Overall, all the studied groups of women increased their organic food consumption over time, but ‘Nulliparous’ women increased their total organic intake more than ‘previous children’ women (211 g/d v. 153 g/d) (Fig. 1 and online Supplemental Table 7). The consideration of the desirability bias affected organic consumption for women with children (decreased compared with the model without adjustment for desirability bias) but also for ‘nulliparous’ women but in the other direction (increased compared with the model without adjustment for desirability bias). Nevertheless, the added desirability bias did not change the trends (Fig. 1). In addition, the mean differences in consumption of ‘healthy’ organic plant-based and animal-based foods were significantly higher for ‘nulliparous’ women compared with ‘previous children’ women, and there was no significant difference for changes in consumption of ‘unhealthy’ organic plant-based and animal-based foods (Fig. 2). Nevertheless, when considering frequency, the proportion of women in Q5 of organic consumption change (women who increased their organic consumption by more than 360 g/d between 2014 and 2018) was highest among ‘primiparous’ women. The proportion of women in Q1 (women who decreased their organic intake between 2014 and 2018) was the highest among ‘previous children’ (online Supplemental Fig. 4).
Difference in organic consumption over time (2018 v. 2014) by women parity group (NutriNet-Santé study, n 4194)1. 1Values are means (95 % CI). ANCOVA with Tukey’s post -hoc test was used for testing differences between groups. Model Adj was adjusted for age (modelled as a continuous variable), educational level, occupational status, monthly household income, geographical region, physical activity, BMI (modelled as a continuous variable), marital status, smoking status, baseline organic food intake, absolute difference in energy intake (kcal/d) and absolute difference in total consumption (conventional + organic). Model Dsb was model Adj + social-desirability bias. *n 3980 (respectively n 2161; n 219; n 224; n 1376).
Absolute differences over time (2018 v. 2014) daily organic plant-based and animal-based food group consumption by women parity group (NutriNet-Santé study, n 4194)1. 1Values are means (95 % CI). ANCOVA with Tukey’s post hoc test was used for testing differences between groups. Difference in organic consumption was adjusted for age (modelled as a continuous variable), educational level, occupational status, monthly household income, geographical region, physical activity, BMI (modelled as a continuous variable), marital status, smoking status, absolute difference in energy intake (kcal/d), baseline food intake for the group considered and absolute difference in total consumption for the group considered (conventional + organic). 2 Wholegrain products, vegetables, fruit, nuts, legumes, vegetable oils, coffee, tea. 3 Fruit juices, refined grains, potatoes, sugar-sweetened beverages, sweets and desserts. 4 Fish, seafood, dairy and poultry. 5 Processed meats, red meats and egg.
Between 2014 and 2018, ‘primiparous’ women significantly increased their consumption of total organic and healthy organic animal-based food, while ‘multiparous’ women did not significantly change their consumption (online Supplementary Fig. 5).
Among women giving birth to a child in the period 2014–2018, we examined whether this birth could be considered as a motive to consume organic foods (online Supplemental Fig. 6). Women who mentioned the birth of their child as a motive had a stronger increase in the consumption of organic products and organic plant products than women who did not mentioned the birth of their child as a motive to consume organic foods.
Analyses by level of education
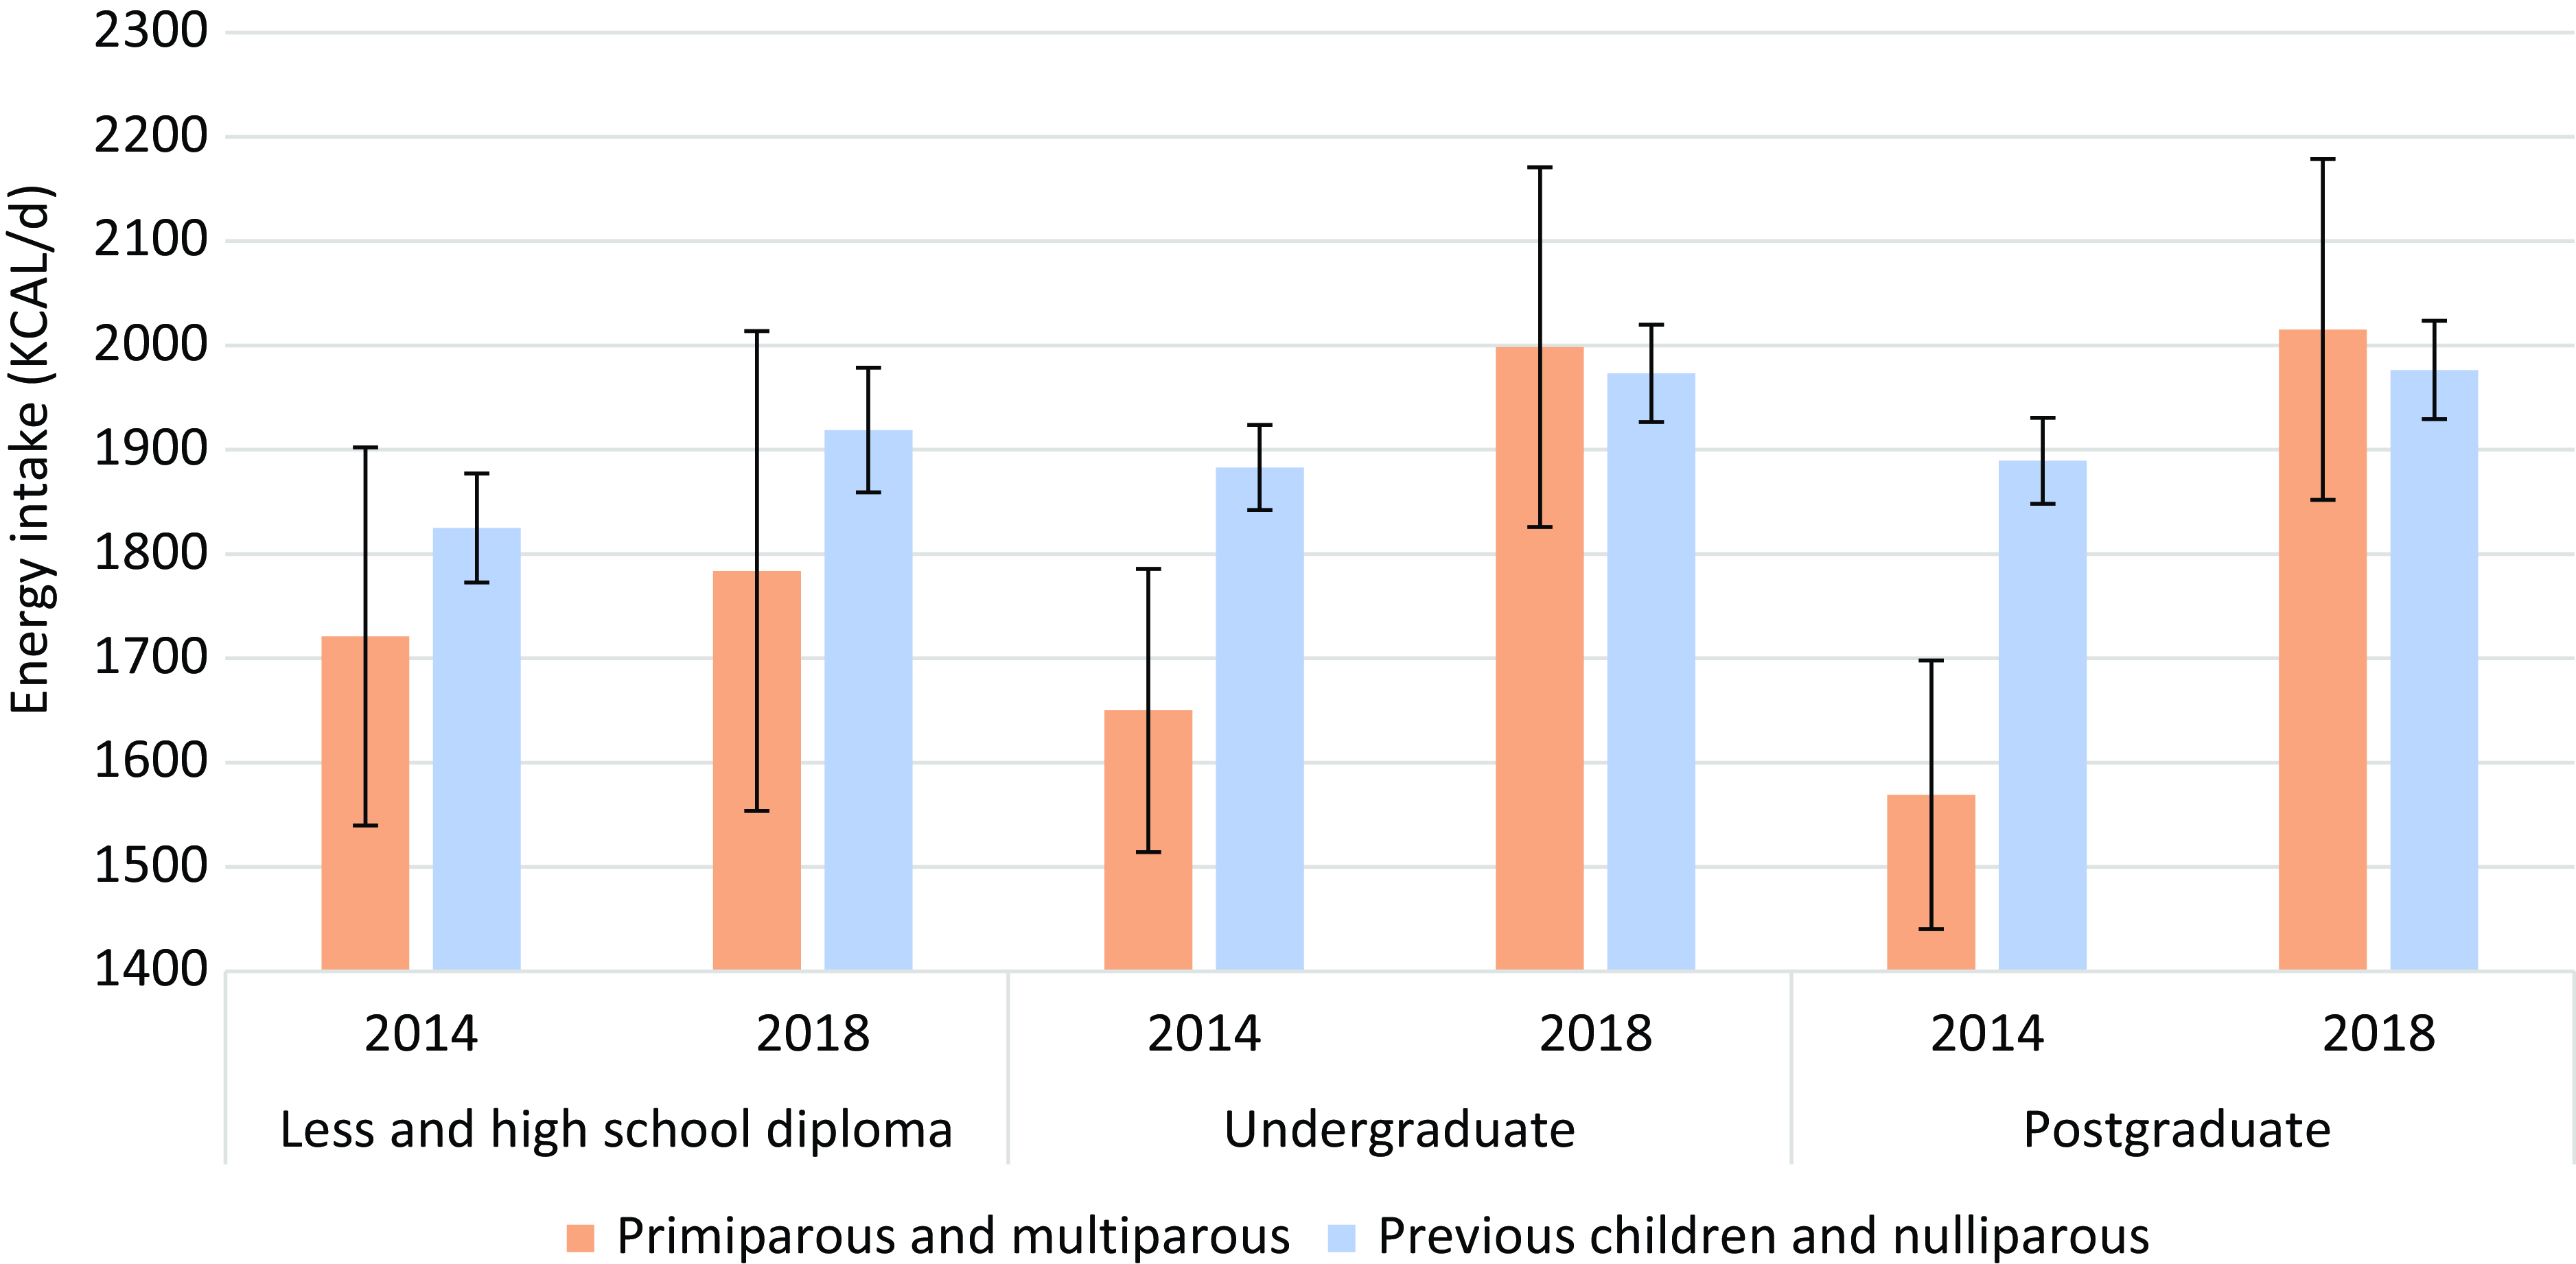
Findings of sensitivity analyses stratified by educational level are presented in Figs. 3 and 4. Women with higher level of education (under and postgraduate) who had a child between 2014 and 2018 increased their total energy intake over the studied period while those with a lower level (≤high school diploma) did not change their total energy intake. They also had a lower energy intake at baseline than those who did not have a child between 2014 and 2018. Among women with a lower level of education there was no difference in energy intake between the two time points and between women with and without children between the two time points (Fig. 3). For both under and postgraduate women, those who did not have a child significantly increased their PNNS-GS2 score between 2014 and 2018, whereas there was no significant difference for women who had a child between 2014 and 2018. Women who were undergraduate and had a child between 2014 and 2018 had a higher PNNS-GS2 score in 2014 than women who had not a child between 2014 and 2018. Among women who had a child between 2014 and 2018, women with a lower level of education had a significantly lower PNNS-GS2 score than other groups of women according to parity status in 2014, whereas in 2018 there was no significant difference (Fig. 4).
Mean (2014 and 2018) in total energy intake (Kcal/d) stratified by educational level by women parity group (NutriNet-Santé study, n 4,194)1. 1Values are means (95 % CI). ANCOVA with Tukey’s post hoc test was used for testing differences between educational level. Difference in total energy intake was adjusted for age (modelled as a continuous variable), occupational status, monthly household income, geographical region, physical activity, body mass index (modelled as a continuous variable), marital status and smoking status.
PNNS-GS2 score at baseline (2014) and at follow-up (2018) stratified by educational level by women parity group (NutriNet-Santé study, n 4,194)1. 1Values are means (95 % CI). ANCOVA with Tukey’s post hoc test was used for testing differences between groups at the same point. PNNS-GS2 score was adjusted for age (modelled as a continuous variable), occupational status, monthly household income, geographical region, physical activity, BMI (modelled as a continuous variable), marital status, smoking status. PNNS-GS2, Programme National Nutrition Santé-Guideline Score 2 (–∞ to 14.25).

Discussion
In the present study, we aimed to compare possible dietary shifts over a 4-year period for different parity women status: women who had children before 2014, women who had a new child between 2014 and 2018, first-time mothers between 2014 and 2018 or women without children. This is the first study examining dietary changes over a 4-year period according to women parity status (at baseline and after birth of a child during the follow-up). Overall, all studied women groups have shifted their food consumption towards a healthier and more sustainable diet, but to varying extents. Women ‘Nulliparous’ without any child up to the end of the follow-up had the most sustainable consumption in 2014 and made the most sustainable dietary changes between 2014 and 2018 (most important increase in organic products, vegetables and nuts, seeds and legumes). Women ‘Primiparous’ giving birth to their first child during the follow-up dramatically changed their consumption of dairy products, alcohol, coffee and tea, as well as their energy intake. In addition, these women were more likely to increase their consumption of animal products than other women groups.
Given the limited literature on dietary changes related to the birth of a new child, we discuss our findings considering the studies on dietary changes during pregnancy and postpartum in comparison. Many factors may play a role in eating behavioural changes associated with pregnancy and postpartum, including psychological determinants (health awareness, food regulation, anticipation, etc.), situational determinants (effort and practice, time spent), biological determinants (cravings, preferences, taste, fatigue, hunger and satiety, etc.), environmental determinants (availability of food) and social determinants (professional, partner, sensitivity to other opinions, social pressure and influence of the child)(Reference Versele, Stok and Aerenhouts2). To our knowledge, one study examined dietary changes from pregnancy to 1-year postpartum and did not highlight any difference during this period (except for breast-feeding women)(Reference Sotres-Alvarez, Herring and Siega-Riz32). However, they did not consider dietary changes that could occur before or in early pregnancy. A qualitative study showed that the arrival of a child or the presence of a child in the household can lead to healthier choices than before(Reference Lund and Jensen33). Conversely, another study indicated that the presence of other children in the household could lead to a deterioration in diet during pregnancy(Reference Kadawathagedara, Ahluwalia and Dufourg17).
Dietary changes according to parity status
Dietary changes (moderate, adapted and towards varied and good quality food) during pregnancy are necessary for the proper development of the baby(Reference Moore and Davies34,Reference Kind, Moore and Davies35) , so dietary behaviours usually change to follow dietary recommendations, for example: stopping alcoholic beverages, decreasing caffeinated drinks and increasing dairy products(Reference Forbes, Graham and Berglund4,Reference Skreden, Bere and Sagedal36–Reference Pinto, Barros and dos Santos Silva40) . In line with this, in our study, women giving birth to their first child would have kept their pregnancy eating habits as they showed significant changes similar to the literature related to the arrival of a child. With the arrival of a first child in the household, parents and especially mothers can reconsider their own diet(Reference Moura and Aschemann-Witzel1).
Regarding alcohol consumption, we observed a strong decrease in women giving birth to their first child. These results are consistent with the literature documenting that the proportion of postpartum women consuming alcohol is lower than before pregnancy (but higher than during pregnancy)(Reference Wennberg, Isaksson and Sandström41). With regard to consumption of tea and coffee, similar results were observed in accordance with previous works(Reference Chen, Bell and Browne37). However, contrary to our results, one study showed that caffeine consumption decreased during pregnancy and then increased after birth while we observed a decrease during the studied period(Reference Wennberg, Isaksson and Sandström41).
Concerning fruit and vegetables, we did not observe an increase in consumption among primiparous women and even an opposite trend was observed. The increase in plant-based food intake by more than 5 % was more frequent in the group of primiparous women. However, in line with this work, the number of portions of fruit and vegetables decreased in women from the beginning of pregnancy to the 6th month of the child, another study indicates that women generally decreased their consumption of fruit and vegetables after pregnancy(Reference Wennberg, Isaksson and Sandström41,Reference Nasuti, Blanchard and Naylor42) . In addition, it has been reported that in UK, more than 70 % of postpartum women did not reach the recommended five portions of fruit and vegetables a day(Reference Stevens, Kelaiditi and Myrissa43). About the increased consumption of animal products, it was more frequent in the ‘primiparous’ group compared with the other groups in our study. There was also a significant increase in dairy products among primiparous women, in accordance to the literature(Reference Wennberg, Isaksson and Sandström41,Reference Nasuti, Blanchard and Naylor42) . For example, one study showed that the percentage of women consuming dairy products, during post-partum, was higher for fist-time women, then for second-time women, followed by women without children(Reference Nasuti, Blanchard and Naylor42).
It is well -documented that mothers dramatically adapt their routine to the demands of the child(Reference Moura and Aschemann-Witzel1,Reference Myrissa, Stevens and Kelaiditi44) . Indeed, a qualitative study showed that a few months after the birth of their child, women experiencing stress around parenting no longer spend time cooking and therefore eat more sweet products and ready-made meals(Reference Moura and Aschemann-Witzel1). The main quoted reason is lack of sleep(Reference Moura and Aschemann-Witzel1,Reference Myrissa, Stevens and Kelaiditi44) . In France, when children begin to share family meals, the family’s eating habits evolve thanks to a greater desire and time to cook and thus towards a diet that is more favourable to health(Reference Moura and Aschemann-Witzel1). Meanwhile, one of the consequences of this unhealthy diet may be an increase in energy intake. Indeed, our results indicated a significant increase in energy intake in ‘primiparous’ women and, to a lesser degree, in ‘multiparous’ women. Interestingly, one study reported that women who had a child for the first time increased their energy intake, while the women without children or with a second child decreased their energy intake over time(Reference Nasuti, Blanchard and Naylor42). In addition, women’s eating behaviours during pregnancy play a role in postpartum weight loss(Reference Bijlholt, Van Uytsel and Ameye45).
Regarding overall diet quality or plant-based scores, we did not find any significant differences between ‘previous children’ women group and ‘primiparous’ or ‘multiparous’ women.
The literature on the quality of women’s diets in relation to the presence of children is scarce. We found a Australian study in the scientific literature that showed that the dietary reference index was higher in postpartum women (0–1 year) than in women who had had children (+1 year)(Reference Martin, Joham and Mishra46). This study is not completely comparable to the present one because we do not specifically consider the postpartum period.
Dietary changes according to education level
In the present study, differences were found according to women’s level of education and parity status. Besides, without studies with similar objectives, we compare our results to a period close to ours, i.e. during pregnancy. In that context, three other studies have analysed the nutritional quality of pregnant women according to socio-demographic data Suárez-Martínez et al. showed significant difference in the alternative healthy eating index in pregnant women according to their education degree(Reference Suárez-Martínez, Yagüe-Guirao and Santaella-Pascual47). In addition, a Spanish study including pregnant, breast-feeding and non-breast-feeding and non-pregnant women showed that educational level and income played a role in adherence to the Healthy Food Pyramid(Reference Gila-Díaz, Witte Castro and Herranz Carrillo48). Women with higher educational level adhered to healthy diets, and so did those with an income between €1000 and €4000 compared with those with an income of less than €1000(Reference Gila-Díaz, Witte Castro and Herranz Carrillo48). Another study also indicated that pregnant women had better adherence to the Mediterranean diet score and in particular women with a higher socio-economic status(Reference Havaš Auguštin, Šarac and Lovrić49).
One hypothesis that could explain the differences in energy intake among women who had a child between 2014 and 2018 according to educational level would be that women with a higher educational level were in dietary restriction in 2014 (due to their considerably lower energy intake) and that at the childbirth, the restriction fades away.
Our analyses revealed that there were also differences in the PNNS-GS2 score according to the education and the arrival of a child between 2014 and 2018. This seems somehow in line with the literature, showing that during post-partum women with healthier dietary choices were the most educated women(Reference Sotres-Alvarez, Herring and Siega-Riz32,Reference Stevens, Kelaiditi and Myrissa43) .
Organic consumption
To the best of our knowledge, we have not found any literature data comparing organic food consumption of women according parity status. This study with the NutriNet-Santé cohort is therefore pioneering. Nevertheless, we found a few studies on the consumption of organic food at this period of life (pregnancy and childbirth), but the data remain very sparse. In a study, the authors suggested that the arrival of a child can lead to an increase in organic consumption in the household(Reference Lund and Jensen33). In our study, we did not observe a significant difference between women who had recently a child and others. However, while women who increased the most their organic consumption were most represented among ‘primiparous’ women. We can hypothesise that women with children do not increase their organic consumption more than women without children for budget reasons. In fact, one of the negative points of consuming healthy food and organic products is that they can be more expensive. Furthermore, the present study shows that the women who were most motivated to increase their consumption of organic products at the birth of their child did actually increase their consumption. The change would occur but only in a part of the population. This question needs to be studied in depth in a new study.
As it is also the case in the general population(Reference Kesse-Guyot, Chaltiel and Fezeu26,Reference Baudry, Pointereau and Seconda50) , pregnant women who consume the most organic food are those who make the best food choices(Reference Torjusen, Lieblein and Næs9,Reference Simões-Wüst, Moltó-Puigmartí and van Dongen51) . In addition to having less impact on the environment(Reference Gomiero15), eating organic food during pregnancy may reduce the risk of illnesses during pregnancy (e.g. pre-esclampsia)(Reference Torjusen, Brantsaeter and Haugen52) or for the child(Reference Brantsæter, Torjusen and Meltzer11). Indeed, one study reported that pregnant women consuming organic food had significantly lower levels of pyrethroids in their urine than women consuming conventional food(Reference Curl, Porter and Penwell53). In addition, exposure to pesticides (organophosphates) during the first months of life could lead to dysfunction at term(Reference Eskenazi, Kogut and Huen54). However, health data (both for the child and the mother) are sparse, and studies are needed to better identify the role of dietary change on health.
Public policies implications
Dietary guidelines for pregnant women seem to be more and more widely adopted and communicated by medical staff. During this period, eating habits change and energy intakes are higher during pregnancy and even breast-feeding. Returning to or starting a healthy diet seems complicated during this period (lack of time and lack of desire). In fact, the mother’s diet is a subject that is rarely discussed when following up the newborn. It would be interesting to take the opportunity of all post-natal consultations (gynaecologist, midwife, pediatrician, etc.) to encourage the mother’s awareness of her own diet, which does not seem to be the most appropriate according to our results. Baby-feeding awareness is currently being promoted, but it would be important at the same time to inform the mother, and even the accompanying partner, and give them the keys to a healthy, sustainable diet (discussion, brochure, recipes, etc.). Moreover, this period seems to be particularly propitious for raising awareness, as it is a medically supervised time, but also a time of changing habits, which could lead to changes in eating habits too.
Strengths and limitations
Some limitations should be acknowledged. In the NutriNet-Santé cohort, the population is not representative of the French population because the study is based on volunteers, so it includes more educated, older people with better health choices(Reference Andreeva, Salanave and Castetbon55) but the relatively large sample allows to have an access to a wide diversity of behaviours and to conduct adjusted and stratified analyses. Thanks to the completion of validated and repeated questionnaires, we were able to collect data on dietary intakes of women during the period preceding and following the birth of a child. In addition, the FFQ was self-administered, and therefore, consumption may be overestimated(Reference Cade, Thompson and Burley56), but as we were studying individual differences in consumption with the same questionnaire and all women were concerned, this point may not be major. Furthermore, the use of an additional adjustment: desirability bias (using a validated questionnaire) did not indicate a substantial change in the results. As this questionnaire was for the previous year, a memory bias may have occurred and misestimation of consumption is possible. However, the validation of this questionnaire allows to answer the limited mentioned below(Reference Kesse-Guyot, Castetbon and Touvier21). Moreover, the Org-FFQ was completed on the previous year’s consumption, which could lead women who had a child in 2017 to complete their food consumption during pregnancy. However, additional analyses, excluding women with children born 1 year before the completion of the Org-FFQ18 (n 3964), were carried out and did not substantially affect the results (data not shown). As this study is a sub-study of the NutriNet-Santé cohort, specific questions and questionnaires were not specifically designed. In addition, data concerning the mother’s gestational conditions (diabetes, hypertension, etc.) were not collected and may interfere with dietary changes as the nutritional recommendations are specific to them.
Nevertheless, classification errors may had occurred despite all our efforts of data management because when classifying women into four groups, some women who declared a pregnancy and did not confirm subsequently the arrival of a child were not considered as women who had a child between the two questionnaires and were interpreted as miscarriage or stillbirth. The larger number of questionnaires available in NutriNet-Santé allows us to be as precise as possible. Given that NutriNet-Santé is a general population cohort and that the average age of the cohort is relatively high(Reference Andreeva, Salanave and Castetbon55), our sample of study was reduced as well as the number of women who had a child in the period, which may have reduced the power of our statistical tests and led to non-significant results. Similarly, for women with ‘less and high school diploma’ who were less well represented.
This study is the first to compare changes in women’s dietary behaviour according to birth of child and to consider two food production methods (organic and conventional). It includes a detailed analysis of diet, in food groups, overall profiles and innovative aspects such as organic. It uses validated scores such as the PANDiet. It considers important confounding factors including social desirability bias. Moreover, this study used an innovative approach to make possible to further promote prevention during this key period. Of note, numerous factors could influence the healthiness of women’s diets during pregnancy or after the birth of the child, such as physical activity, income(Reference Wesołowska, Jankowska and Trafalska57), smoking status and high age at childbirth(Reference Martin, Joham and Mishra46,Reference Wesołowska, Jankowska and Trafalska57) . All these factors, which are not exclusive to these specific women, but are well-documented in the general population,(Reference Darmon and Drewnowski58,Reference Brunin, Pointereau and Allès59) have been accounted for in the present analysis.
It would be interesting to follow- up these women according to their parity status in the future to explore if these changes in eating behaviours were persistent.
Conclusion
During the study, it was observed that women’s diets changed depending on whether they had children. Childless women tended to adopt a more sustainable diet, while women who gave birth during the study period increased their energy intake and consumption of dairy products but decreased their consumption of alcohol and caffeine. These changes were also influenced by the women’s social status. Although these changes may have long-term effects on the individual and household level, it is important to take advantage of this opportunity to help women achieve sustainable diets for themselves and future generations. Health professionals can improve the mother’s nutritional knowledge regarding dietary changes and promote healthy plant-based foods during pregnancy to ensure healthy eating habits for the mother and child.
Acknowledgements
The authors warmly thank all the volunteers of the NutriNet-Santé cohort. We also thank Younes Esseddik and Selim Aloui (IT managers), Thi Hong Van Duong, Régis Gatibelza, Aladi Timera and Jagatjit Mohinder (computer scientists), Fabien Szabo de Edelenyi, PhD (data management supervisor), Julien Allègre, Nathalie Arnault, Laurent Bourhis, Nicolas Dechamps (data-managers/biostatisticians), Paola Yvroud, MD (physician) and Cédric Agaesse (dietician manager), Rebecca Lutchia, Alexandre De Sa (dieticians), Nathalie Druesne-Pecollo (operational coordinator) and Maria Gomes and Mirette Foham (participant support) for their technical contribution to the NutriNet-Santé study. No conflict of interest is declared for any of the authors.
The present study is part of the InfaDiet (Infant diet and the child’s health and development) project, funded by an ANR grant (InfaDiet project, grant no : ANR-19-CE36–0008).
In addition, the study is part of the BioNutriNet project, which was supported by the French National Research Agency (Agence Nationale de la Recherche) in the context of the 2013 Programme de Recherche Systèmes Alimentaires Durables (ANR-13-ALID-0001). The NutriNet-Santé cohort study is funded by the following public institutions: Ministère de la Santé, Santé Publique France, Institut National de la Santé et de la Recherche Médicale, Institut National de la Recherche Agronomique (INRAE), Conservatoire National des Arts et Métiers (CNAM) and Sorbonne Paris Nord University. The funders had no role in study design, data collection and analysis, decision to publish, or preparation of the manuscript. Joséphine Brunin is supported by a doctoral scholarship from INRAE and the French Environment and Energy Management Agency (ADEME).
The authors contributed as explained in the section: J. Br. performed the statistical analysis and drafted the manuscript. B. L. G., J. Ba., E. K. G. and J. Br. contributed and validated the design and protocol of this study. E. K. G. supervised the research project and contributed to the drafting of the manuscript. J. Ba., B. A., M. G., M. T., S. H., D. L., B. L. G., E. K. G. contributed to the interpretation of the data and reviewed each version of the manuscript for important intellectual content. M. T. and S. H. were implicated in the design and protocol of the NutriNet-Santé cohort. All authors read and approved the final manuscript. J. Br. had full access to all study data, J. Br. assumes responsibility for the integrity of the data and the exactitude of the data analysis.
The authors declare that they have no competing interests.
Researchers at public institutions can submit a project collaboration request that includes information about their institution and a brief description of the project to: collaboration@etude-nutrinet-sante.fr. All requests are reviewed by the steering committee of the NutriNet-Santé study. In case of approval, a signed data access agreement will be requested and additional authorisations from the competent administrative authorities may be needed regarding human subjects’ data protection. In accordance with existing regulations, no personally-identifiable data will be made available.
The NutriNet-Santé study is conducted according to the Declaration of Helsinki guidelines and was approved by the Institutional Review Board of the French Institute for Health and Medical Research (IRB Inserm n°0000388FWA00005831) and the ‘Commission Nationale de l’Informatique et des Libertés’ (CNIL n°908 450/n°909 216). The study protocol is recorded at Clinicaltrials.gov under the number: NCT03335644. All subjects provided informed consent.
Supplementary material
For supplementary material/s referred to in this article, please visit https://doi.org/10.1017/S000711452400117X


