





Introduction
Urban horticulture has gained tremendous momentum in recent decades, leading to improved efforts to optimize the sustainability of the industry. One topic of interest is the development of food-waste-based hydroponic fertilizers (FWBHF) as an alternative to the existing industry standard synthetic fertilizers (Wang, Deaker and Van Ogtrop, Reference Wang, Deaker and Van Ogtrop2025). Synthetic fertilizers generally rely on energy intensive and nonrenewable sources of nutrients such as industrial ammonia production and phosphate rock mining. In addition to the environmental degradation these methods cause, increasing scarcity of minerals and cost of energy inhibits the economic viability of future urban horticulture industries (Cordell and White, Reference Cordell and White2011; Liu, Elgowainy and Wang, Reference Liu, Elgowainy and Wang2020). As such, the reutilization of food-waste as an FWBHF attempts to address concerns surrounding nutrient leakage as well as a sustainable future for urban horticulture.
Studies into FWBHF development explore the potential of utilizing organic waste sourced from farms, industry, and consumers (Wang, Deaker and Van Ogtrop, Reference Wang, Deaker and Van Ogtrop2025). Existing literature provides a patchwork of results, which utilize a variety of primary feedstocks, inoculations, additives, hydroponic system types, substrates, methods of processing, and so forth (Wang, Deaker and Van Ogtrop, Reference Wang, Deaker and Van Ogtrop2025). The output of these studies generally includes yield outcomes relative to a synthetic control solution. However, select studies also include additional analysis such as microbial load measurements (Kano et al., Reference Kano, Kitazawa, Suzuki, Widiastuti, Odani, Zhou, Chinta, Eguchi, Shinohara and Sato2021), yield quality (Bergstrand, Asp and Hultberg, Reference Bergstrand, Asp and Hultberg2020), and nutrient analysis of the FWBHF (Wang, Deaker and Van Ogtrop, Reference Wang, Deaker and Van Ogtrop2025). From the outputs, it was identified that yield performance was best predicted by the similarity of nutritional contents between FWBHFs and their respective synthetic control solution. Kechasov et al. (Reference Kechasov, Verheul, Paponov, Panosyan and Paponov2021) found that mineral replication of a pig-manure and household-waste-based FWBHF was unable to meet the yield efficacy of the treatment—suggesting a biological mechanism, such as beneficial microorganisms, may have enhanced the efficacy of the solution.
Another identified trend was the tendency for consumer level waste to have a greater variability in feedstock relative to ‘Farm’ and ‘Industry’ level producers. Unlike in farm or industrial settings, large volumes of homogeneous inputs are not available at consumer levels. This introduces another confounding factor in the production of consistent, replicable hydroponic solutions. These changes are further amplified when considering how socioeconomic, cultural, and geographical factors influence the type of food waste an urban population generates. Hence, the primary challenge of FWBHF development is the transformation of variable nonhomogeneous feedstocks into effective hydroponic solutions capable of supporting crop growth.
A wide range of novel methods has been identified across the existing literature. While the primary factor in a successful FWBHF is its efficacy in emulating the yield outcomes of a synthetic solution, consideration must also be given toward the efficacy of the processing method. Considerations for the energy efficiency, time of processing, effective volume, and replicability must all be evaluated when selecting a method. Yusuf et al. (Reference Yusuf, Laude, Alfiana, Syakur and Ramli2021) utilized steaming and boiling; however, this may require more energy relative to methods that utilize bioconversion, such as digestion or vermiculture. The latter methods exploit self-propagating microbes and invertebrates to break down organic matter into plant-available form. This enables scalability for widespread applications without exponentially increasing energy costs (Arancon and Solarte, Reference Arancon and Solarte2019).
The three described trends (i) nutrient similarity, (ii) variability of inputs, and (iii) variety of novel processing methods, have created a need for a quantitative research project which aims to begin the documentation of plant-nutritional outcomes from novel processing methods. This article identifies and compares trends between, and within, major food groups, such as vegetative matter, carbohydrates, and proteins. The selected methodologies include the fermentation of individual food groups, as well as two controls—a conventional synthetic hydroponic solution, and household-waste-based vermiliquer. In addition, this article also measures the impact that aeration plays in the final nutrient composition of both fermentation and vermiculture treatments. It is hypothesized that aeration will improve the availability of nutrient species, such as nitrate, which rely on aerobic microbiological activity (Sparks, Singh and Siebecker, Reference Sparks, Singh and Siebecker2022). The goal of this research is to begin developing a database of expected outcomes for protein-rich, carbohydrate-rich, and fiber-rich food groups. The applications of this study aims to assist future research when seeking food-waste-based nutrient supplements for specific minerals, better understand the behavior of inorganic nutrient composition of specific food groups when exposed to novel treatments, and to publish the range of mineral deficiencies found in FWBHFs.
Materials and methods
Treatment preparation
The control solution in this study utilizes a two-part hoaglands variation ‘Aqua Vega AB solution’ (Canna), dosed at the recommended value into tap water (Sydney, Australia), which contains a host of trace elements to ensure preservation of water drinking quality.
The study was conducted in a darkened fume hood over 90 days using a completely randomized design with two different treatments applied to five different foods. The tested foods were chicken, beef, bread, pasta, and assorted vegetables. Then, 500 g of each treatment was conventionally prepared, without the addition of salts or seasoning. The chicken breast and scotch fillet were cooked in a convection oven at 180 °C for 25 minutes. The pasta was boiled at 105 °C for 11 minutes. By weight, the salad consisted of carrot (11%), seedless green capsicum (22%), truss tomato (4%), Pink Lady apple (18%), navel orange (18%), oak leaf lettuce (21%), and Lebanese cucumber (10%).
Individual foods were then blended into a fine paste and placed in jars of 1.25 L of deionized (DI) water. Each individual food was replicated four times. The two treatment groups included an aerobic and anaerobic trial. Air temperature was kept at 24 °C. Additionally, eight bio-balls (AquaOne) were provided to increase colonizable surface area for bacterial growth by providing increased surface area. Aerobic trials utilized air pumps with a flow rate of 60 L/hr. Anaerobic trials were fitted with one-way air valves to facilitate gas release. The digestates were left in a covered fume hood for 90 days.
Fresh vermiliquer was collected from a single worm farm which was fed, by volume, eggshell (25%), coffee grounds (15%), green vegetable waste (30%), carbohydrates (including rice and pasta) (10%), garden waste (10%), and fruit peels (10%). The solution was left to sit outdoors in 20 L buckets, in full sunlight, with loose fitting lids for a 90-day period. Prior to analysis, the vermiliquer was treated either aerobically or anaerobically. Aerobic treatment consisted of 72 hours of aeration at a rate of 60 L/hr. Anaerobic treatments were sealed and left undisturbed for 72 hours in the dark.
Sample analysis
Treatments were filtered (Whatman No. 4) before being placed in cold storage at 4 °C. Aliquots were analyzed for pH, EC, and essential plant nutrients. pH and EC were measured using a handheld reader (HI9813-61, HANNA). A flow injection analyzer was used to take total nitrogen, nitrates, and ammonia readings. Preparation of the samples included only a 20-fold dilution.
The remaining elements (P, K, S, Ca, Mg, Zn, Cu, Mn, Fe, Pb, and Cd) were all measured using an ICP-MS. Samples were prepared with an acid digestion of 0.125 ml of HNO3 and 0.375 ml of HCl to 0.5 ml of the solution. They were heated to 60 °C in a water bath for 2 hours to ensure total digestion. Samples were frozen immediately after and thawed immediately prior to 10-fold dilution for ICP-MS analysis.
Data analysis
Data analysis was carried out using RStudio (2024.04.2 Build 764). Normality for measured parameters (pH, EC, nutrient analysis) was assessed using the Shapiro–Wilks test, Q–Q plots and histograms; all response variables were determined to be normal. Equal variance between treatments was tested with Levene’s test, and data were analyzed with ANOVA. A Dunnett’s test was performed to quantify the difference between each treatment and the control mean. In addition, nutrient concentration comparisons are mathematically diluted/concentrated into a standardized form using the equation:
$ Adjusted\ nutrient\ conc.=\left(\frac{Raw\; EC}{1.6}\right) \ast Raw\ nutrient\ conc. $
 This standardized form uses an EC of 1.6 dS/m as a baseline due to its ubiquitous tolerance by hydroponic crop species. This is required as EC variation impacts the rate of nutrient availability to crop species and is further explored in ‘Results and Discussion’ section. Plots were visualized using the ‘ggplot’ package.
Results and discussion
Indicators and roles of pH
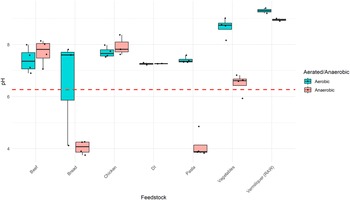
Depending on the intended crop, conventional hydroponic solutions tend between a pH of 5 and 7 (Velazquez-Gonzalez et al., Reference Velazquez-Gonzalez, Garcia-Garcia, Ventura-Zapata, Barceinas-Sanchez and Sosa-Savedra2022). A pH within these bounds optimizes plant nutrient availability while precipitating potentially toxic elements, such as aluminum (Sparks, Singh and Siebecker, Reference Sparks, Singh and Siebecker2022). In our experiment, the control in this trial contained an average pH of ~5.3. Majority of treatment solutions exceeded the upper bounds for an ‘ideal’ pH range (Fig. 1). The exceptions were for the anaerobic carbohydrate-rich treatments, bread and pasta. Both treatments averaged a pH of 4.5—acidic enough to begin the solubilization of aluminum, a phytotoxic element (Sparks, Singh and Siebecker, Reference Sparks, Singh and Siebecker2022). Aeration treatments caused significant levels of variance in vegetable, pasta, vermiliquer, and bread treatments, while the protein-rich beef and chicken treatments were statistically similar (p < 0.05). This difference may be caused by the specialization of similar microbial communities required to break down dense, protein-rich waste compared to the variety of microbial communities competing for readily available carbohydrate energy (Burcham et al., Reference Burcham, Belk, McGivern, Bouslimani, Ghadermazi, Martino, Shenhav, Zhang, Shi, Emmons, Deel, Xu, Nieciecki, Zhu, Shaffer, Panitchpakdi, Weldon, Cantrell and Ben-Hur2024). Similarly, the vermiliquer benefits from an established community of invertebrates and microorganisms to transform varied food waste into a relatively homogeneous solution (Loera-Muro et al., Reference Loera-Muro, Troyo-Dieguez, Murillo-Amador, Barraza, Caamal-Chan, Lucero-Vega and Nieto-Garibay2021).
pH across undiluted food groups after 90 days of aerobic/anaerobic fermentation. DI = Deionized water. Horizontal line represents the mean pH of the control solution.

Figure 1. Long description
The x-axis lists feedstocks from left to right as Beef, Bread, Chicken, D I, Pasta, Vegetables, and Vermiliquer (R A W). The y-axis measures pH from 4 to 9. For each feedstock, two boxplots are shown: blue for aerobic and pink for anaerobic fermentation. Beef shows both conditions with pH near 8. Bread has aerobic pH centered around 7 with a wide range, while anaerobic is much lower, near 4. Chicken shows both conditions near pH 8. D I (deionized water) is tightly clustered near pH 7 for both. Pasta is also near pH 7. Vegetables show aerobic pH near 8 and anaerobic near 6. Vermiliquer (R A W) is near pH 8 for both. A red dashed horizontal line at pH 6 marks the control mean. The legend at the right identifies blue as Aerobic and pink as Anaerobic.
While pH is primarily determined by the presence of H+, the overall cation/anion ratio can influence the proportion of acidic cations (such as Al and Fe), over a period of time (Sparks, Singh and Siebecker, Reference Sparks, Singh and Siebecker2022). This is caused by nutrient uptake mechanisms in plants by either absorbing an inverse proton or hydroxyl, or by exchanging a proton or hydroxyl for the required cation or anion. This is relevant as the availability of certain species, such as nitrogen, appear in both anionic (NO3−) and cationic forms (NH4+). Studies in soil systems have observed both alkalization and acidification in rhizosphere pH as a result of the uptake of each nutrient, respectively (Custos, Moyne and Sterckeman, Reference Custos, Moyne and Sterckeman2020). However, in hydroponic systems, this is largely understudied. It is unknown if changes in rhizospheric pH impact the rest of the hydroponic solution supply.
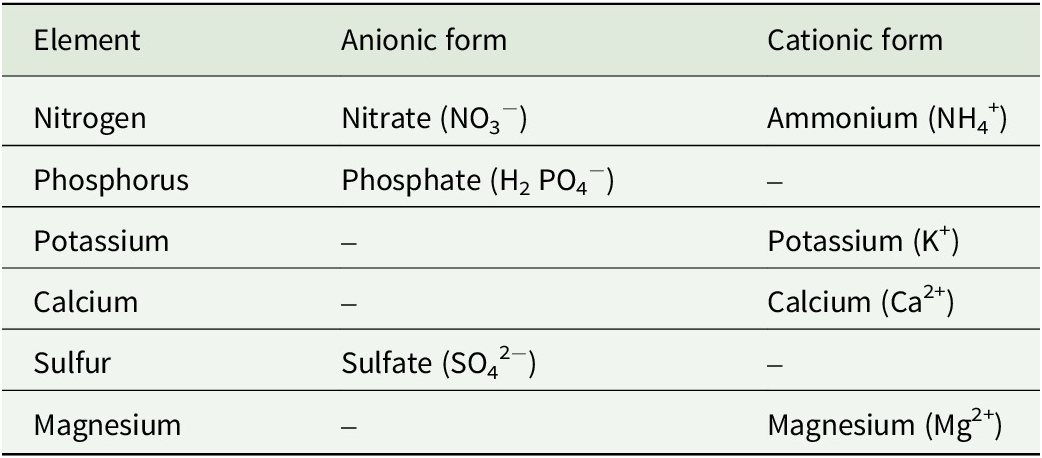
This behavior of having both anionic and cationic availability is unique to nitrogen. Most crop species share similar molecular preferences, with macronutrients having either cationic or anionic uptake pathways (Table 1). As a result, future iterations of experimental hydroponic solutions should consider how ionic availability of plant-preferred nutrients can impact pH in a solution.
Ionic preference of plant-available macronutrients (Sparks, Singh and Siebecker, Reference Sparks, Singh and Siebecker2022)
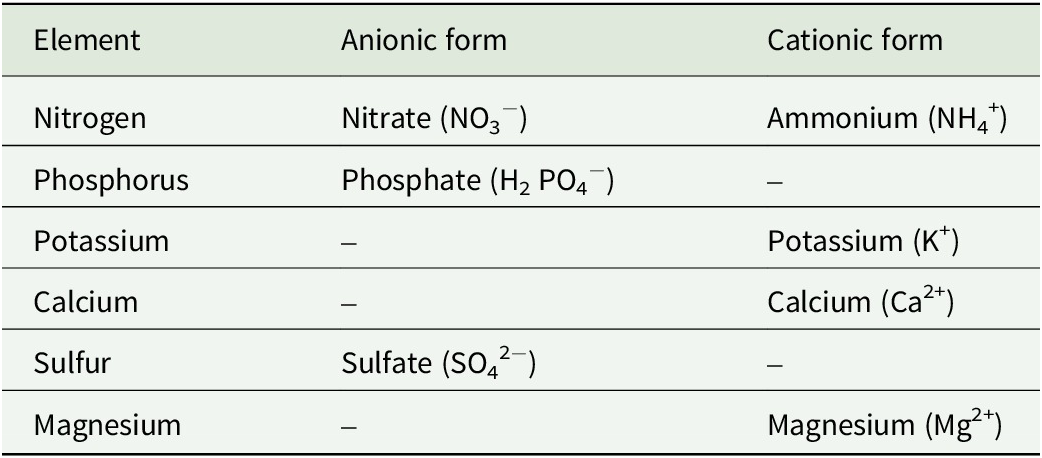
Table 1. Long description
The table has three columns: Element, Anionic form, and Cationic form. From top to bottom, the rows are as follows. Nitrogen: anionic form is nitrate, N O sub 3 super minus; cationic form is ammonium, N H sub 4 super plus. Phosphorus: anionic form is phosphate, H sub 2 P O sub 4 super minus; cationic form is not present. Potassium: anionic form is not present; cationic form is potassium, K super plus. Calcium: anionic form is not present; cationic form is calcium, C a super 2 plus. Sulfur: anionic form is sulfate, S O sub 4 super 2 minus; cationic form is not present. Magnesium: anionic form is not present; cationic form is magnesium, M g super 2 plus.
Adjustments to pH are possible without altering macronutrient ratios through the addition of chemical pH buffers. Hydroponic pH buffers generally favor citrates and carbonates due to affordability, nonphytotoxic properties, and compatibility with other macronutrients, thereby avoiding precipitation or toxic outcomes (Zhang et al., Reference Zhang, Wang, Zhong, Ji and He2024).
EC, salinity, and sodium
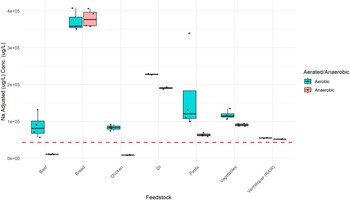
While not an essential nutrient for C3 plant species, sodium (Na+) is the final cation alongside potassium (K+), calcium (Ca2+), and magnesium (Mg2+) which contribute to salinity in a solution (Brownell, Reference Brownell and Woolhouse1980; Donald, Sparks and Siebecker, Reference Donald, Sparks, Siebecker and Valentino2024). These cations are essential for plant function and are dosed to a salinity EC of ~1.6 dS/m (Fig. 2). Multiple studies have found that the optimal EC range changes depending on crop species, but usually includes a range from 1.2 to 2.4 EC (Wortman, Reference Wortman2015; Dunn and Singh, Reference Dunn and Singh2016; Shareef, Rehman and Ahmad, Reference Shareef, Rehman and Ahmad2024). This range is optimal for plant absorption by optimizing osmotic potential, while maintaining a nutrient-dense solution. In scenarios with excess salinity, plants can suffer from ion toxicity and osmotic stress, while the solution may see symptoms of precipitation between nutrients, such as potassium and calcium salts, inhibiting nutrient availability (Sparks, Singh and Siebecker, Reference Sparks, Singh and Siebecker2022). From a producer perspective, excess salinity will lead to reduced yields or total yield failure. Hence, a successful FWBHF should have an adequate supply of all plant nutrients in relation to its EC level (Fig. 3).
Sodium content in treatment solution after diluting to EC of 1.6 dS/m. DI = Deionized water. Horizontal line represents mean control sodium content.
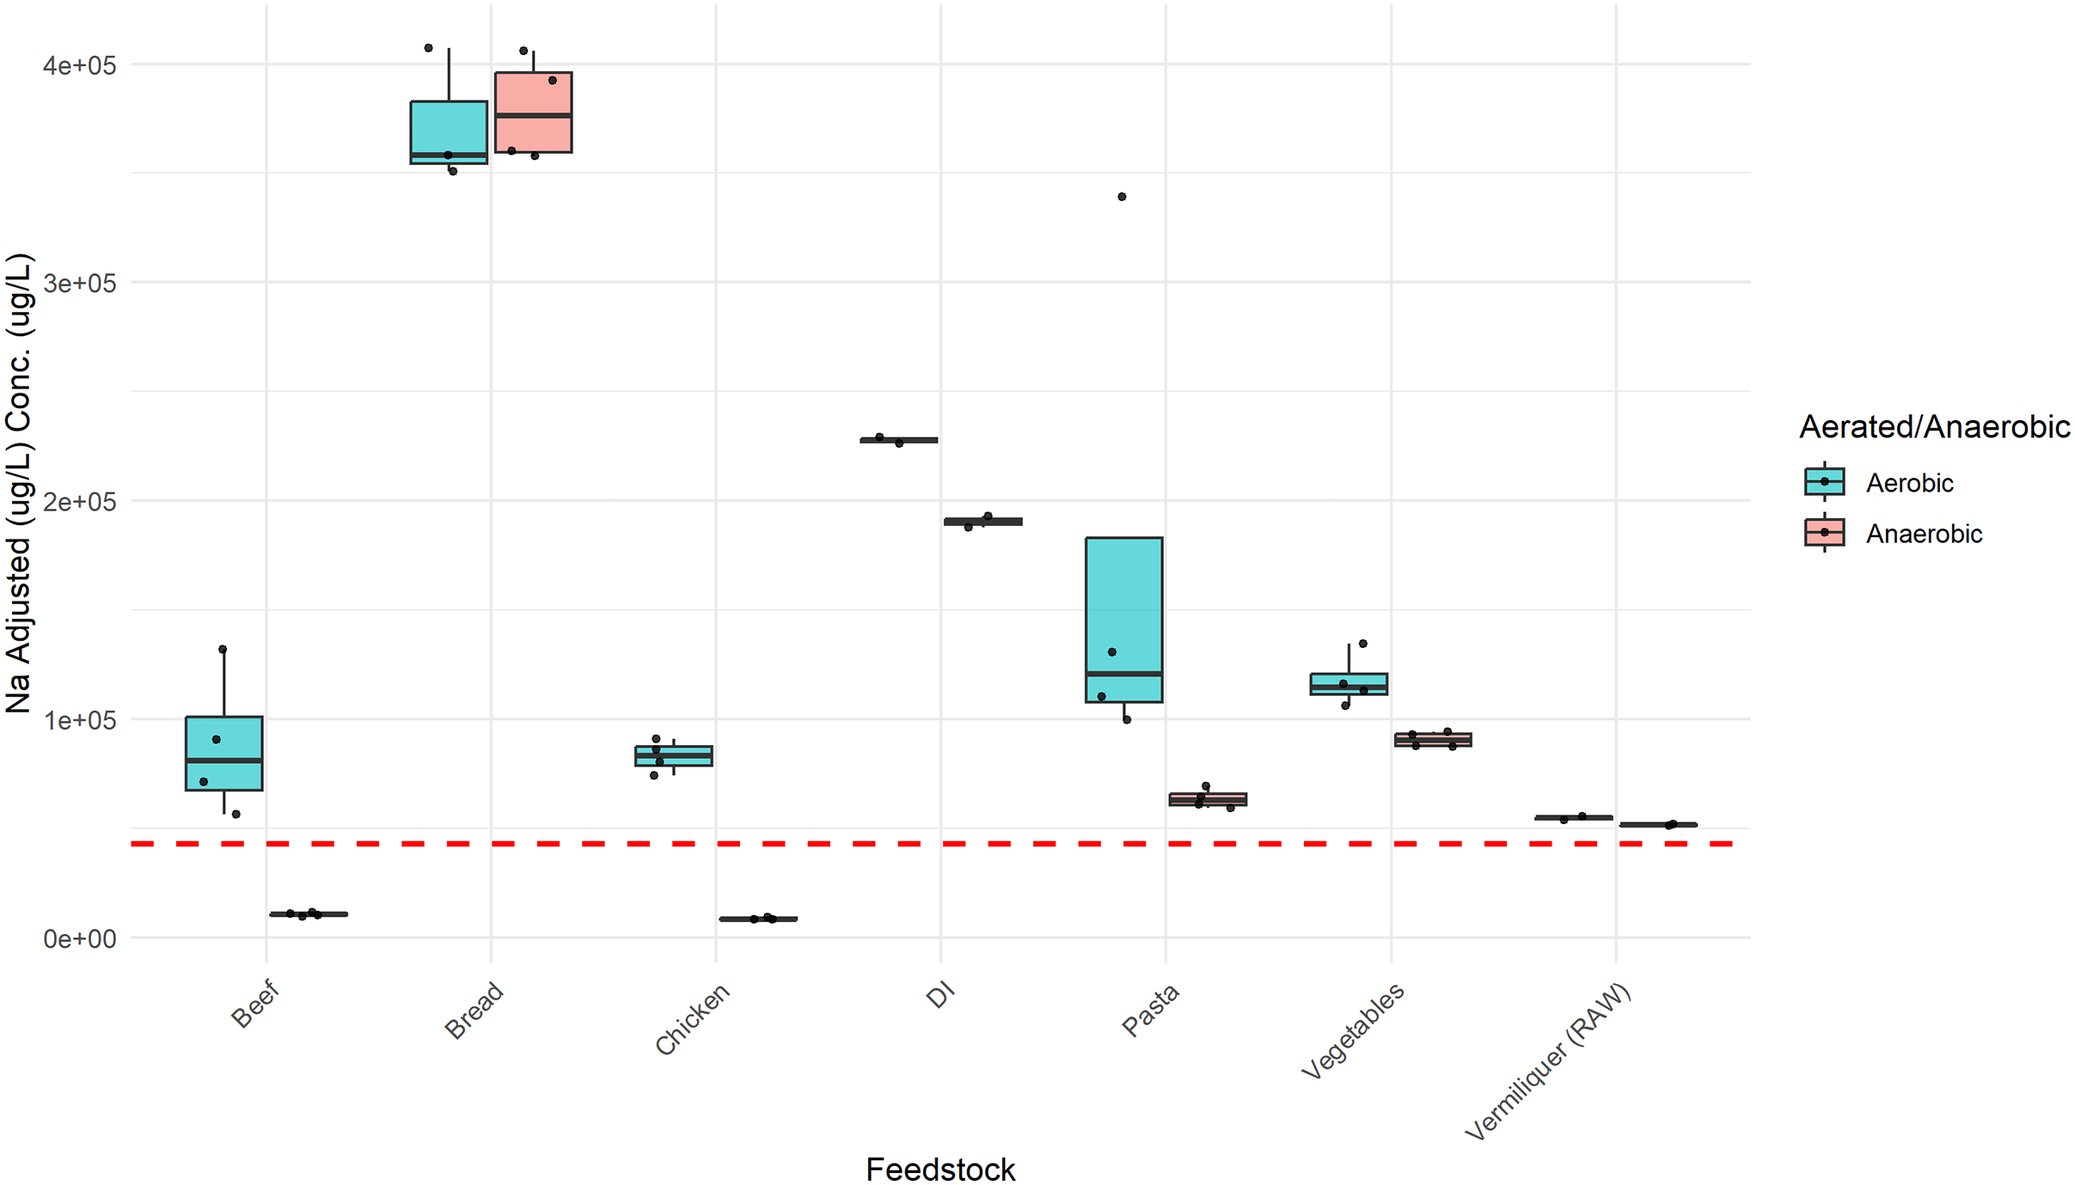
Figure 2. Long description
The boxplot displays sodium adjusted concentration in micrograms per liter on the y axis and feedstock types on the x axis, ordered left to right as Beef, Bread, Chicken, D I, Pasta, Vegetables, and Vermiliquer (R A W). Each feedstock has two boxplots, blue for aerobic and pink for anaerobic treatments, except D I and Vermiliquer (R A W), which only show one. Bread shows the highest sodium concentrations for both treatments, around three hundred thousand to four hundred thousand micrograms per liter. D I and Pasta also show elevated sodium, with D I near two hundred thousand and Pasta showing a wide range under aerobic treatment. Beef, Chicken, Vegetables, and Vermiliquer (R A W) have lower sodium concentrations, mostly below one hundred thousand. The red dashed horizontal line marks the mean control sodium content, positioned below most boxplots except for Vegetables and Vermiliquer (R A W), which are near or below this line. Individual data points are plotted over each box. The legend at the right identifies blue as aerobic and pink as anaerobic.
EC (dS/m) across undiluted food groups after 90 days of aerobic/anaerobic fermentation. DI = Deionized water.
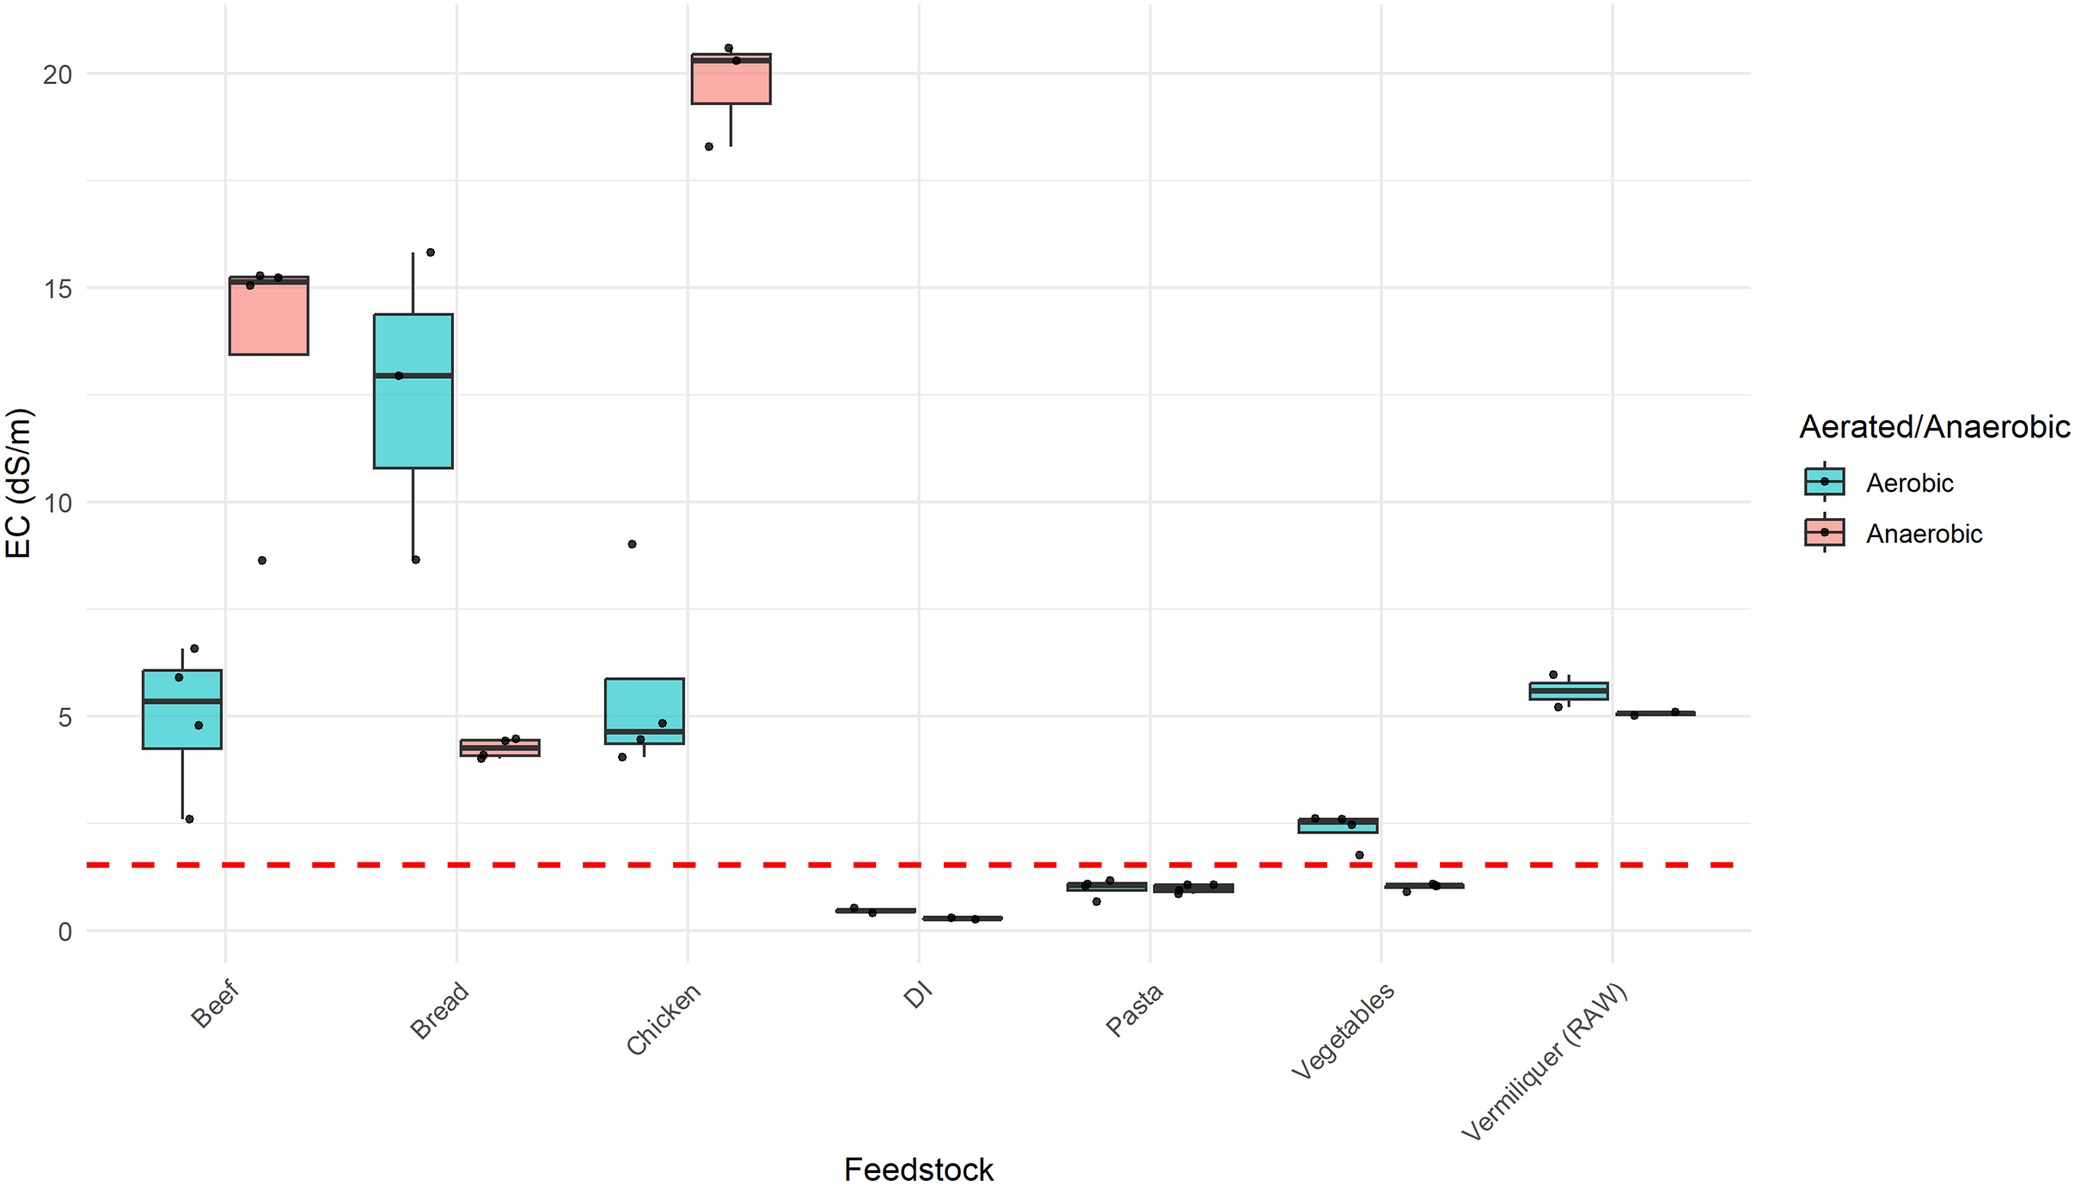
Figure 3. Long description
The x axis lists feedstocks from left to right as Beef, Bread, Chicken, D I, Pasta, Vegetables, and Vermitiquer (R A W). The y axis measures E C in d S per m from zero to above twenty. Each feedstock group contains two box plots: blue for aerobic and pink for anaerobic fermentation. Beef, Bread, and Chicken show the highest E C values, with anaerobic chicken peaking above twenty, aerobic bread and beef around fifteen, and lower values for the rest. D I, Pasta, and Vegetables have E C values near zero. Vermitiquer (R A W) is slightly above five for both conditions. A red dashed horizontal line marks a reference value near two d S per m. The legend at the right identifies blue as aerobic and pink as anaerobic.
The sodium content across treatments tends to be similar to or significantly greater than that of the control. The vegetable, pasta, and bread treatments all show significantly greater sodium levels relative to the control. This excess sodium is nonessential in C3 plant species, and thus occupies potential room for other salt species which are essential for plant growth. This sort of salinity has been a major obstacle in the development of FWBHFs. The source of sodium tends to be from table salt (NaCl), which is a common ingredient in both industrial (bread and pasta), consumer, and retail food processes. Practical and cost-effective methods of removing sodium from treatment solutions are limited, with options such as osmotic sieves, being prohibitively expensive for crop-production uses (Han, Wang and Wang, Reference Han, Wang and Wang2022).
Essential plant macronutrient and micronutrient
While pH plays a critical role in the availability of plant nutrients, the molecular presence of plant essential macronutrient and micronutrient is foundational for a viable hydroponic solution. Current understanding of nutrient requirements for hydroponic crops is largely dependent on crop species requirements. No existing scientific evidence suggests there is a universally optimal composition of minerals. This can be attributed to different nutrient requirements for crop species, system types, and growing conditions. The following analysis studies the concentrations, functions, and synthesis of each element across treatments. In addition, the impacts of aerated/anaerobic fermentation will be examined and discussed.
Macronutrient analysis
Plant macronutrients include nitrogen, phosphorus, potassium, calcium, sulfur, and magnesium. Of the six essential plant macronutrients, no treatment was similar to either nitrogen or calcium within one confidence interval. Conversely, most treatments exceeded nutrient requirements for phosphorus, potassium, sulfur, and magnesium. Insufficient levels of macronutrients stunt the development of crops, while excessive levels lead to elemental toxicity. The availability of each macronutrient is also provided as a table in Appendix A.
Nitrogen
Nitrogen is usually the macronutrient required in the greatest abundance of vegetative crop species. The element is essential in the production of amino acids, chlorophyll, and in the regulation and uptake of nutrients and water. Nitrogen deficiency can be observed as chlorosis, stunted vegetative growth, and, in extreme cases, plant death (Sparks, Singh and Siebecker, Reference Sparks, Singh and Siebecker2022).
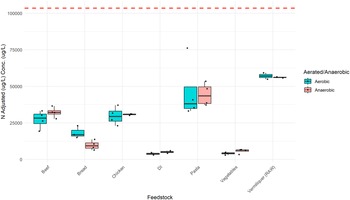
Nitrogen content in all treatment solutions did not meet the control level (Fig. 4). Vermiliquer was the treatment with the highest total nitrogen content, with both aerobic and anaerobic treatments having ~50% of the nitrogen content found in the control. No other treatment was considered significantly similar to these two treatments. The impacts of aeration on nitrogen content only significantly impacted the bread treatment, which increased as a result. This is potentially due to aeration improving oxygen availability for nitrifying species. It is unknown why the other carbohydrate group (pasta) did not share this behavior—although it may be attributed to differences in processing and original wheat species.
Nitrogen content in aerobic/anaerobic food groups and vermiliquer after dilution to EC of 1.6 dS/m. DI = Deionized water. Horizontal line represents mean control nitrogen content.
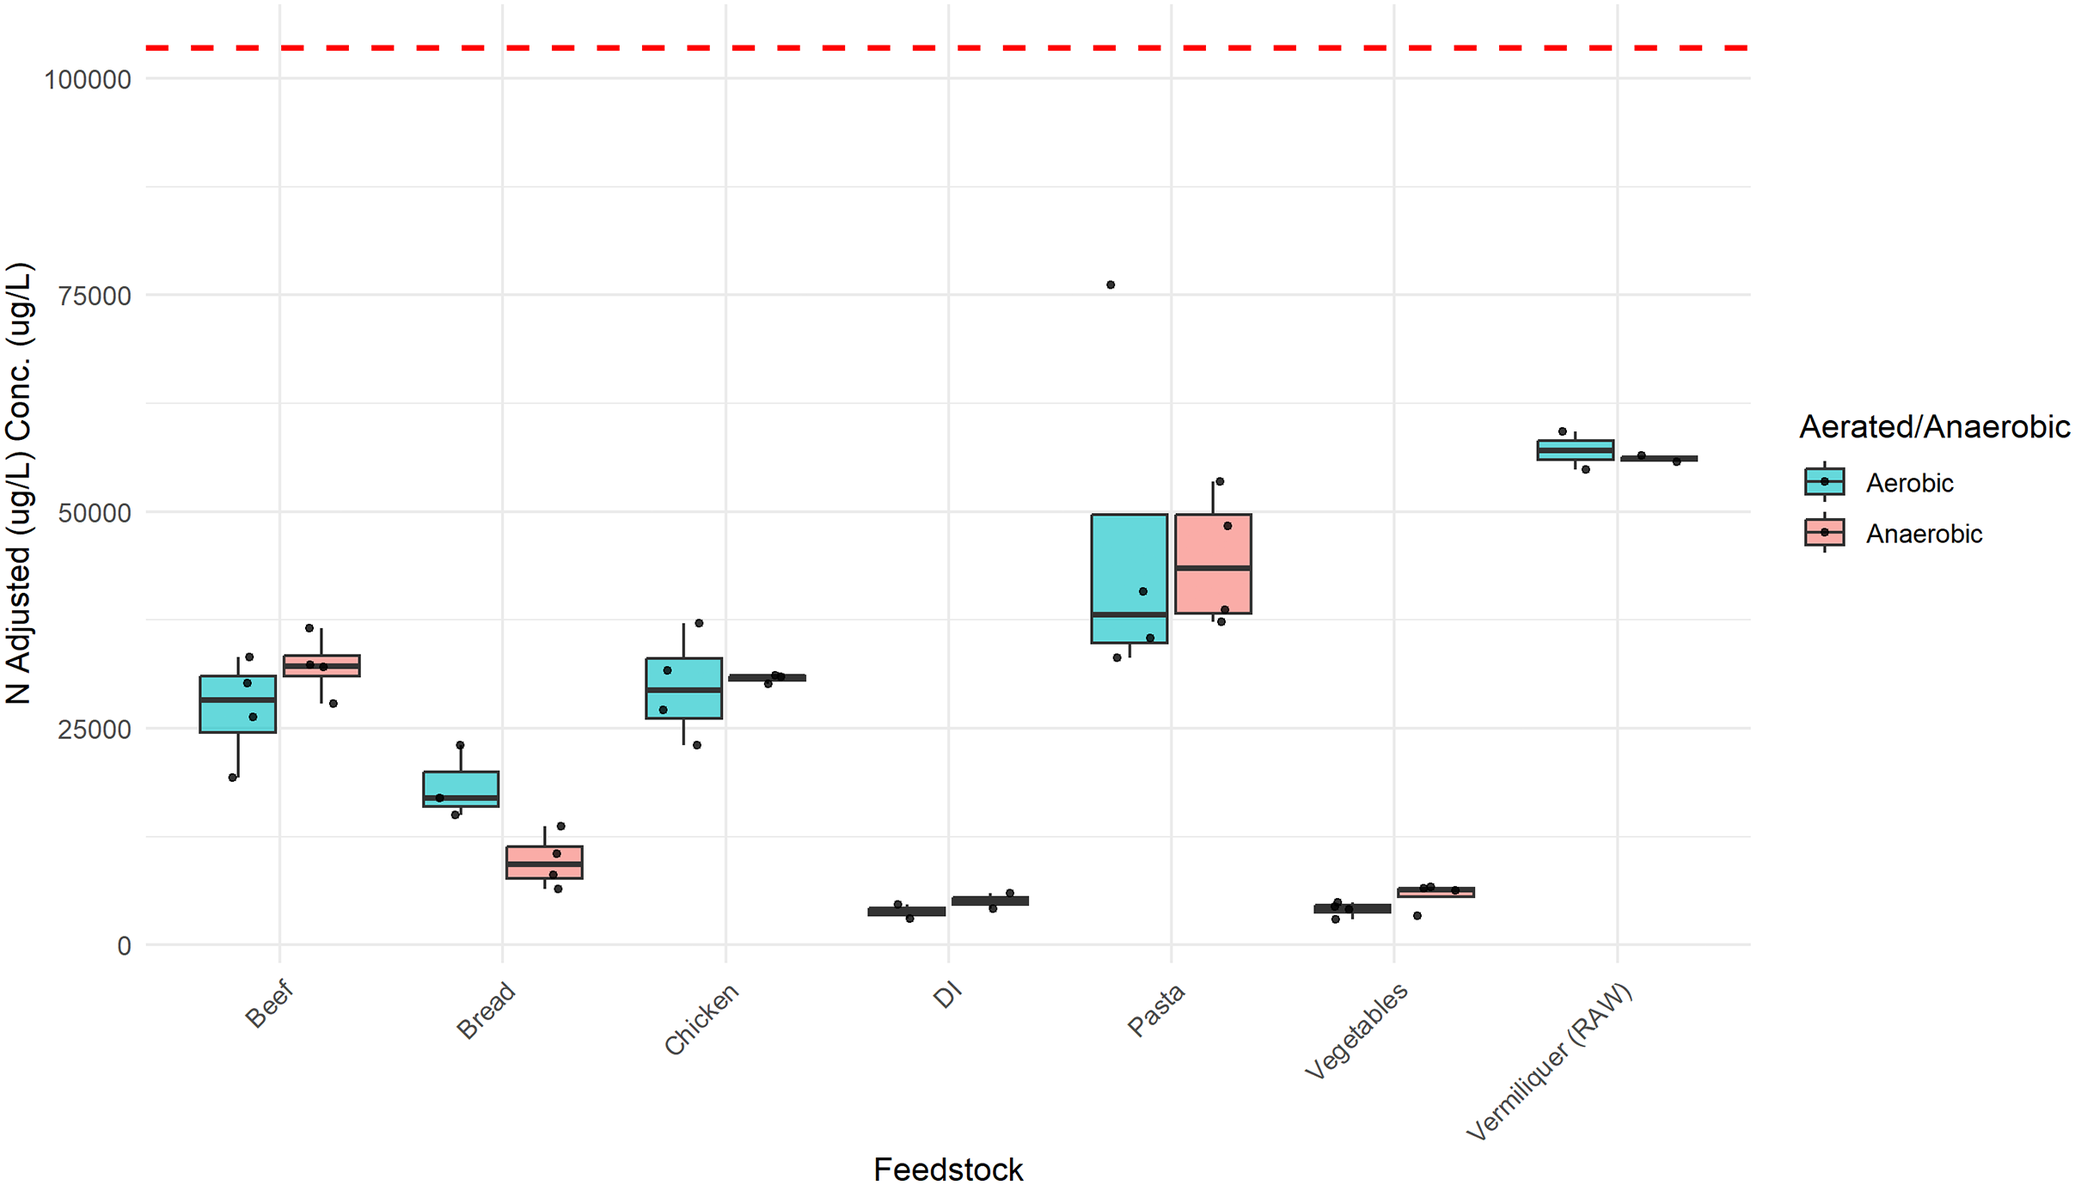
Figure 4. Long description
The chart displays boxplots for nitrogen adjusted concentration in micrograms per liter on the y axis, ranging from 0 to 100000, for seven feedstocks on the x axis: Beef, Bread, Chicken, D I, Pasta, Vegetables, and Vermiliquer (R A W). For each feedstock, two boxplots are shown: blue for aerobic and pink for anaerobic treatments. Beef shows similar median nitrogen for both treatments, Bread and Chicken have lower values, D I and Vegetables are near zero, Pasta has higher spread, and Vermiliquer (R A W) shows the highest concentrations. A red dashed horizontal line at the top marks the mean control nitrogen content. The legend at the right identifies aerobic and anaerobic colors.
While plant uptake of ammonium (NH4+) is possible, there is a preference for nitrates (NO3−) depending on species. Common hydroponic species, such as lettuce, strawberry, and tomatoes tend to suffer negative yield outcomes when the ratio of NH4+:NO3− exceeds 75:25 (Demšar, Osvald and Vodnik, Reference Demšar, Osvald and Vodnik2004; Tabatabaei, Yusefi and Hajiloo, Reference Tabatabaei, Yusefi and Hajiloo2008; Nawarathna et al., Reference Nawarathna, Dandeniya, Dharmakeerthi and Weerasinghe2021). At this ratio, ammonium toxicity begins to inhibit the uptake of cations K+, Mg2+, and Ca2+, which inhibit normal plant development. In addition, recent studies have also identified upregulation of stress-related enzymes that can further hinder development (Esteban et al., Reference Esteban, Ariz, Cruz and Moran2016). As such, it is essential that candidate FWBHFs have NH4+:NO3− ratios which provide chemical stability and remain nontoxic to crop species. Chemical stability aims to minimize fluctuation in pH as a result of NH4+ and NO3− uptake and conversion. In hydroponic systems, it has been suggested that an optimal ratio of NH4+:NO3− is 25:75, as it has been observed to self-regulate pH by offsetting acidification caused by nitrate uptake through the exchange of H+ ions during ammonia cation uptake (Dickson and Fisher, Reference Dickson and Fisher2019). However, a true optimal ratio is subject to case-by-case conditions, as factors such as nitrogen concentration, crop species and growth stage, pH levels, and growing medium can influence nitrogen uptake in crop species (Chen et al., Reference Chen, Li, Li, Li, Zhu, Zhong, Zhang and Li2024). The control solution contained a NH4+:NO3− ratio of approximately 15:85, which only the vermiliquer treatment group was able to surpass (Fig. 5). The vegetable treatment group had a positive ratio, with more than 50% of available nutrients being in NO3− form. Unexpectedly, the vegetable, bread, and pasta treatments contradicted the hypothesized impacts of aeration. The predicted impact of aeration was that there would be a greater increase in nitrification processes. This is due to the presence of oxygen supplying aerobic species such as sp. Rhizobioales and sp. Nitrobacter with oxygen for the conversion of NH4+ to NO3− (Delgado, Casella and Bedmar, Reference Delgado, Casella, Bedmar, Bothe, Ferguson and Newton2007; Nicholls and Ferguson, Reference Nicholls, Ferguson, Nicholls and Ferguson2013; Hu et al., Reference Hu, Lu, Qin, Zhou, Tan, Wu and Zhao2023). A potential explanation for this reversal may be due to the availability of accessible carbohydrates in the carbohydrate, and vegetable treatments. Ammonium oxidizers have demonstrated the ability to assimilate organic carbon while oxidizing NH4+ to NO2− for energy production; however, current literature does not suggest this provides any significant growth advantage (Prosser, Reference Prosser, Bothe, Ferguson and Newton2007). Other explanations include excessive acidity and heat inhibiting nitrification to occur (Hu et al., Reference Hu, Lu, Qin, Zhou, Tan, Wu and Zhao2023). The absence of an elevated NH4+ in vermiliquer treatments suggests that either isolated fermentation or the absence of macropod bioturbation/processing may also impact the process of nitrification and nitrate retention.
Distribution of nitrogen species (nitrate and ammonia) across treatments. The dotted line represents the ideal 25:75 ratio of NH4+:NO3− (Dickson and Fisher, Reference Dickson and Fisher2019).

Figure 5. Long description
The x axis lists treatments from left to right: Beef Aerobic, Beef Anaerobic, Bread Aerobic, Bread Anaerobic, Chicken Aerobic, Chicken Anaerobic, Pasta Aerobic, Vegetables Aerobic, Vegetables Anaerobic, Vermiliquer (R A W) Aerobic, Vermiliquer (R A W) Anaerobic. The y axis is labeled N O 3 all over N H 4 percent, ranging from zero to one. Each bar is divided into two colored segments: mean underscore N H 4 in red and mean underscore N O 3 in blue. For Beef Aerobic and Bread Anaerobic, the blue segment (mean underscore N O 3) is about one quarter of the bar, while the red segment (mean underscore N H 4) fills the rest. For all other treatments except Vegetables Aerobic, the red segment dominates, with blue nearly absent. Vegetables Aerobic shows a larger blue segment, nearly half the bar. The last three treatments (Vegetables Anaerobic, Vermiliquer R A W Aerobic, Vermiliquer R A W Anaerobic) are entirely blue, indicating only mean underscore N O 3 is present. A dotted horizontal line at zero point seven five marks the ideal N H 4 to N O 3 ratio. The legend at the right identifies red as mean underscore N H 4 and blue as mean underscore N O 3.
The rest of the treatment groups are consistent with the hypothesis that aerobic environments promote nitrification processes. The beef treatment saw a significant improvement in NO3− content as a result of aeration (p < 0.05), while the increase in chicken was not considered significant. Conversely, carbohydrate groups (bread and pasta) both showed elevated concentrations of nitrates in anaerobic treatments—this may be due to excessive fermentation times causing denitrification. Vegetable treatments saw a significantly lower NH4+:NO3− ratio compared to other fermentation treatments. This is most likely due to the composition of raw vegetable products being composed of primarily nitrates, as opposed to proteins found in carbohydrates and proteins which deaminate into ammonia species (Knez et al., Reference Knez, Kadac-Czapska, Dmochowska-Ślęzak and Grembecka2022; Păucean et al., Reference Păucean, Șerban, Chiș, Mureșan, Pușcaș, Man, Pop, Socaci, Igual, Ranga, Alexa, Berbecea and Pop2024). This highlights the importance of feedstock as an underlying determinant in the composition of a hydroponic solution. Like the only vegetable treatment, the vermiliquer treatment is mostly composed of vegetative waste, and the improved NO3− ratio is reflected by this.
A pilot trial found that a 48-hour aeration of vermiliquer did not significantly change the levels of total organic nitrogen, nitrates, or ammonium to a significant level. It may be possible that the conversion from ammonium to nitrates occurs prior to leachate extraction, or that prolonged storage may enable the anaerobic nitrification to occur. Additional studies into the nitrate/ammonium balance of freshly harvested vermiliquer may be beneficial to understand this interaction.
Phosphorus
Phosphorus is essential for normal plant growth, forming genetic material as well as energy carrier ATP, and reductase NADP, which facilitates nutrient transport, photosynthesis, and formation of genes (Khan et al., Reference Khan, Siddique, Shabala, Zhou and Zhao2023). Limited phosphorus limits the utilization of photosynthesized carbohydrates. This bottleneck results in dark green coloration in foliage, as well as a reduction in vegetative and fruit quality and quantity (Khan et al., Reference Khan, Siddique, Shabala, Zhou and Zhao2023). Phosphorus content varied across treatments, generally trends saw aerobic treatments having greater concentrations relative to anaerobic treatments (Fig. 6). All treatments except for vermiliquer had at least one aerobic or anaerobic form statistically similar to or greater than the control (p < 0.05). Notably, vermiliquer is the only treatment without significant difference when aerated.
Phosphorus content in aerobic/anaerobic food groups and vermiliquer after dilution to EC of 1.6 dS/m. DI = Deionized water. Horizontal line represents mean control phosphorus content.

Figure 6. Long description
The x axis lists feedstocks from left to right: Beef, Bread, Chicken, D I, Pasta, Vegetables, Vermiliquer (R A W). The y axis shows phosphorus adjusted concentration in micrograms per liter, ranging from zero to two hundred thousand. Each feedstock has paired box plots: blue for aerobic, pink for anaerobic. Beef, Chicken, and Pasta aerobic groups show the highest phosphorus concentrations, with Beef aerobic peaking near two hundred thousand micrograms per liter. Anaerobic groups generally have lower phosphorus, except for Pasta, where anaerobic is higher than aerobic. Bread and Vegetables aerobic groups are lower than their anaerobic counterparts. D I and Vermiliquer (R A W) have the lowest phosphorus concentrations in both conditions. The red dashed line, spanning horizontally, marks the mean control phosphorus content. The legend at the right identifies blue as aerobic and pink as anaerobic.
Both aerobic protein treatments were abundant in phosphorus. This is likely due to the greater availability of phosphorus in protein-based material, due to its role in muscle synthesis and energy creation as creatine phosphate (Kohlmeier, Reference Kohlmeier and Kohlmeier2015). Aeration of the treatment likely enabled aerobic microbial species such as Pseudomonas putida to solubilize phosphorus in the plant-available form H2PO4− (Singh et al., Reference Singh, Bisht, Ansari and Chauhan2024).
Conversely, there is a reduction in available phosphorus after aeration in bread and vegetable treatments. This is most likely due to the greater availability of phosphorus in protein-based treatments, as well as the tendency for phosphorus to be found primarily as phytate in the bran of wheat grain (Shabnam, Tarek and Iqbal, Reference Shabnam, Tarek and Iqbal2018). The inclusion of bran in wholemeal bread may assist in the fortification of available phosphorus in the bread treatment. The differences within carbohydrate food groups can be hypothesized as either differences in utilized wheat varieties (durum for pasta and white for bread) or as differences in postharvest processing prior to final sale.
Generally, phosphorus is more available in slightly acidic conditions (pH 6.0–7.0), where a larger range of phosphorus-rich minerals, such as calcium phosphate, solubilize into inorganic form for plant uptake (Sparks, Singh and Siebecker, Reference Sparks, Singh and Siebecker2022). Majority of treatments show a slight tendency toward alkalinity, and as such, there is potential for acidic amendment for the remediation of phosphorus deficiency. This may not be necessary for protein-rich food waste that has been aerobically fermented, nor would it be necessary for anaerobically fermented carbohydrates and vegetables. The vermiliquer treatment would benefit the most from this remediation, due to high alkalinity (pH = 9) and low phosphorus availability. Conversely, the application of this method to other food groups—such as carbohydrates, may not be as effective due to their already acidic pH (pH = 4–6).
The high levels of phosphorus alone make either the fermentation or vermiliquer FWBHF treatments potentially viable for commercial application. This is due to predicted shortages in phosphorus fertilizers within the next century. This scarcity is attributed to the over-extraction of available phosphate rock—the primary source of phosphate fertilizers (Jupp et al., Reference Jupp, Beijer, Narain, Schipper and Slootweg2021). As a result, methods to recapture and reutilize phosphorus should be explored further, especially for hydroponic systems, which heavily rely on mineral sources of the element.
Potassium
Unlike nitrogen and phosphorus, potassium is not a molecular component in any plant structures. This can make it difficult to directly associate potassium with a specific metabolic function within plants. However, the importance of the mineral should not be understated, potassium facilitates enzyme regulation, stomatal behavior, gas exchange, and an assortment of other osmotic functions throughout the roots, shoots, and fruit (Sardans and Peñuelas, Reference Sardans and Peñuelas2021). The capacity to efficiently regulate osmotic behavior in the root system is particularly useful in FWBHF systems, which can suffer from excessive sodium levels (Fig. 2). Excess sodium can limit plant nutrient availability by interfering with nutrient exchange in the root system. Soil-based trials have shown that both potassium (K+) and calcium (Ca2+) improve sodium exclusion mechanisms in tomato and olive plants (Capula-Rodríguez et al., Reference Capula-Rodríguez, Valdez-Aguilar, Cartmill, Cartmill and Alia-Tejacal2016; Larbi et al., Reference Larbi, Kchaou, Gaaliche, Gargouri, Boulal and Morales2020).
Potassium availability across treatments generally favored aerobic environments, with all but one treatment having no significant difference because of aeration (Fig. 7). This adheres to current understanding of microbial K fixation. Microbe groups such as bacterial Bacillus sp. and Pseudomonas spp., as well as fungal Aspergillus sp. rely on available oxygen to complete metabolic solubilization of K+. In the bread treatment, it is possible that the elevated EC (Fig. 2) relative to other treatments may have inhibited the development of K-fixing populations. Another potential theory may be that high availability of carbohydrates creates microbial populations that outcompete K-fixing microbes, although there is no existing literature that quantifies either hypothesis. Future studies should include microbial analysis to confirm the presence of K-fixing microbes, and clearly discern whether aeration triggers a biological or chemical change in K+ availability.
Potassium content in aerobic/anaerobic food groups and vermiliquer after dilution to EC of 1.6 dS/m. DI = Deionized water. Horizontal line represents mean control potassium content.

Figure 7. Long description
The box plot displays potassium adjusted concentration in micrograms per liter on the y axis and feedstock types on the x axis, including beef, bread, chicken, D I, pasta, vegetables, and vermiliquer (raw). For each feedstock, two box plots are shown: aerobic (blue) and anaerobic (pink). Aerobic samples consistently show higher potassium concentrations than anaerobic, with beef, chicken, pasta, and vegetables having the highest aerobic values, all above the red dashed line representing mean control potassium content. Anaerobic samples remain near or below the control line. Bread and D I have low potassium in both conditions. Outliers are present in several groups. The legend at the right identifies the color coding for aerobic and anaerobic samples.
Once K+ solubilization occurs, however, treatments show that there is an abundance of the element. Although potassium toxicity is largely asymptomatic, evidence suggest that when potassium exceeds an optimal dosage, significant reductions in both root and shoot development occur (Xu et al., Reference Xu, Du, Wang, Sha, Chen, Tian, Zhu, Ge and Jiang2020). Research into optimal potassium levels in hydroponic systems is largely unexplored, and would likely vary across different crop species, nutritional compositions, and system types.
Calcium
Calcium plays a role in structuring plant cells, facilitating nutrient transport between cell membranes, and signaling. Due to its major role in signaling, Ca2+ must utilize the xylem for transport, as such the primary driver of calcium uptake and distribution is transpiration (Thor, Reference Thor2019). In hydroponic systems, the risk of insufficient transpiration is unlikely due to the artificially managed light, humidity, temperature, and aqueous nutrient solution. The presence of Ca2+ may be particularly useful in FWBHF solutions, as the element (alongside K+) demonstrates the capacity to improve salt tolerance when in higher concentrations (Hadi and Karimi, Reference Hadi and Karimi2012). It should be noted that while Ca2+ can improve intracellular salt tolerance, there is little evidence to suggest that it can significantly alter the osmotic deficits caused by a highly saline nutrient solution (Reid and Smith, Reference Reid and Smith2000).
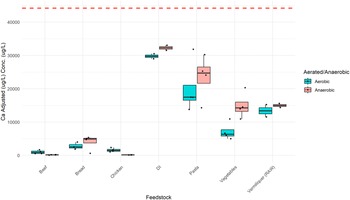
Calcium was the other element besides nitrogen that was identified as deficient across all treatment solutions (Fig. 8). This may be caused by excessive acidity or alkalinity causing precipitation into carbonates and other salts (Sparks, Singh and Siebecker, Reference Sparks, Singh and Siebecker2022). The treatment with the highest calcium content (other than DI water) was pasta. Another potential cause may be caused by the lack of calcium-rich feedstocks such as bones, eggshells, and dairy products. In either case, these deficiencies can be amended by either adjusting pH to an acceptable range (pH 6.0–7.5), or by supplementing the solution with more calcium, thereby ameliorating detrimental effects of the sodium (Shabala et al., Reference Shabala, Demidchik, Shabala, Cuin, Smith, Miller, Davies and Newman2006).
Calcium content in aerobic/anaerobic food groups and vermiliquer after dilution to EC of 1.6 dS/m. DI = Deionized water. Horizontal line represents mean control calcium content.

Figure 8. Long description
The boxplot displays calcium adjusted concentration in micrograms per liter on the y-axis and feedstock types on the x-axis, ordered left to right as Beef, Bread, Chicken, D I, Pasta, Vegetables, and Vermiliquer (R A W). Each feedstock has paired boxplots for Aerobic (blue) and Anaerobic (red) conditions. Beef, Bread, and Chicken show low calcium concentrations, with Bread slightly higher in Anaerobic. D I and Pasta have the highest concentrations, with D I showing similar values for both conditions around 30,000 micrograms per liter, and Pasta showing higher values for Anaerobic. Vegetables and Vermiliquer (R A W) have moderate concentrations, with Anaerobic generally higher. A horizontal dashed red line at the top marks the mean control calcium content. The legend at the right identifies Aerobic and Anaerobic color codes.
Another potential explanation for calcium deficiency is the uptake caused by aerobic microbial species such as soil-based Pseudomonas sp. and Bacillus sp., which utilize the element in signaling, metabolic, and reproductive processes (Kolodkin-Gal, Parsek and Patrauchan, Reference Kolodkin-Gal, Parsek and Patrauchan2023). This is supported by the significantly greater (although still deficient) levels of calcium in anaerobic treatments in carbohydrate, vegetable, and vermiliquer treatments. Notably, the DI treatment showed the highest level of calcium. This may be due to the trace calcium carbonates found in Sydney’s drinking water (National Health and Medical Research Council (NHMRC), 2024). The absence of excessive nutrients in the DI treatment may have limited the development of populations that utilize calcium. Unsurprisingly, both protein groups had the lowest levels of calcium, which is expected due to the low inherent calcium level in lean meat (Mortensen et al., Reference Mortensen, Fuerniss, Legako, Thompson and Woerner2024). Efforts should be made into the exploration of the biological and chemical relationship of calcium in FWBHF development, including if supplementation of the mineral improves nutrient availability in final FWBHF treatments.
Sulfur
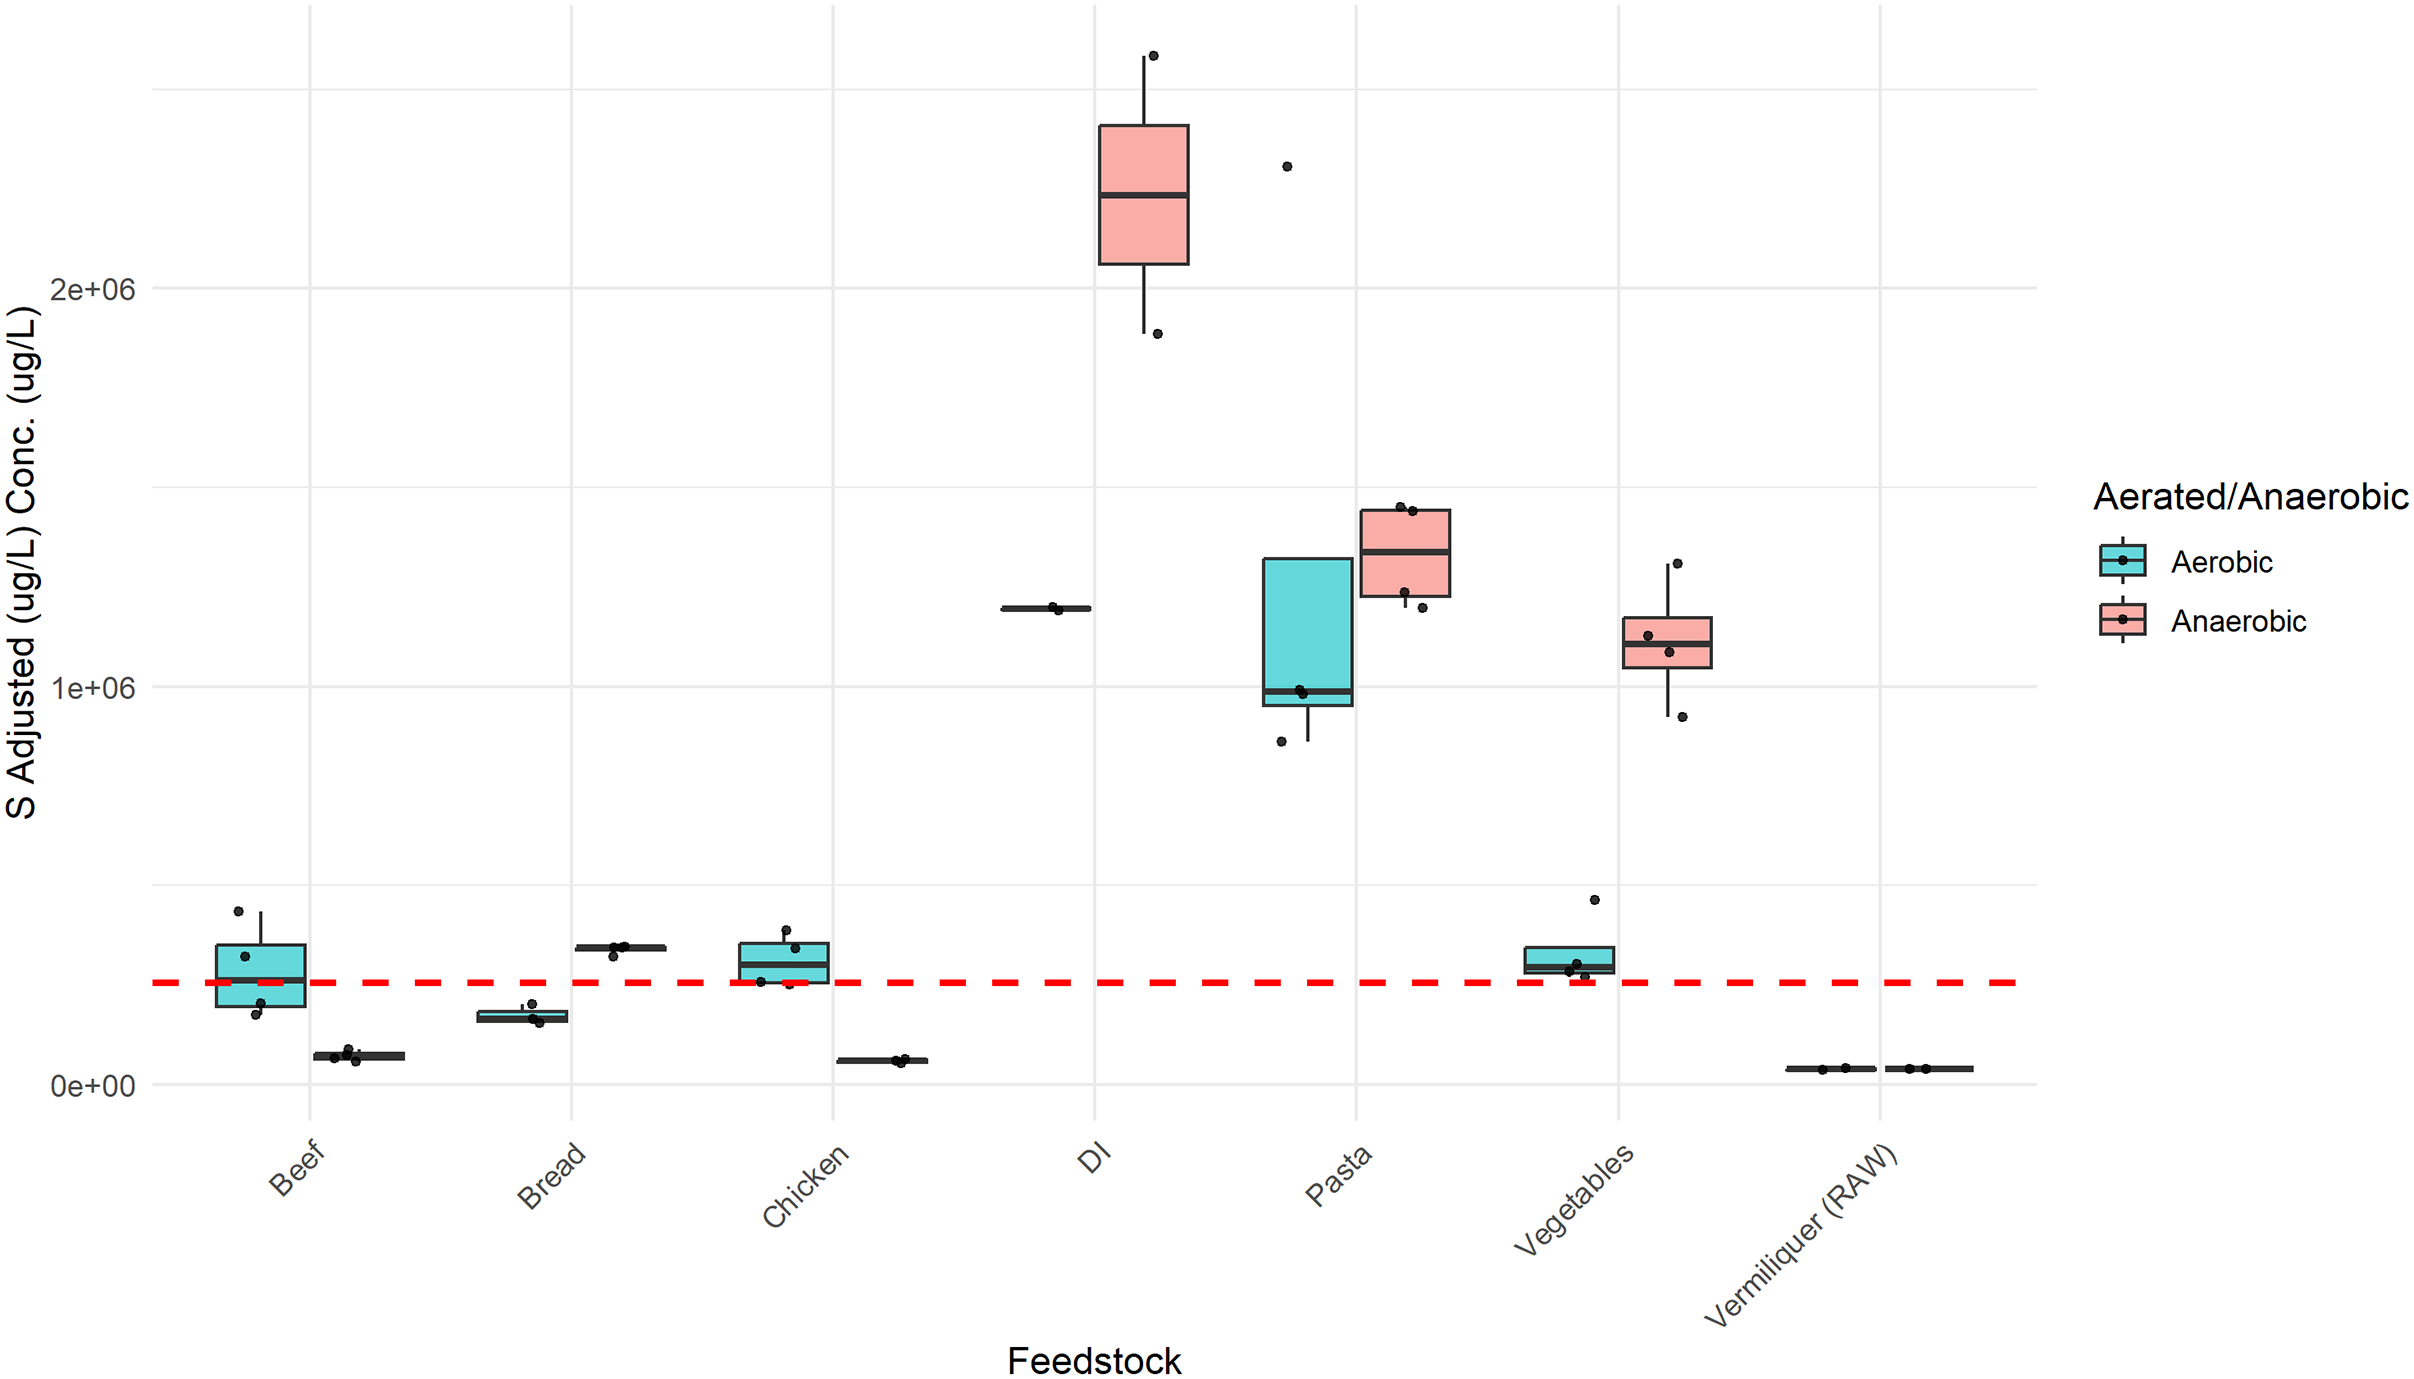
The primary purpose of sulfur is as a constituent of essential amino acids for protein synthesis. Sulfur is mainly absorbed as sulfate (SO4) (Narayan et al., Reference Narayan, Kumar, Yadav, Dua and Johri2023). The distribution of sulfur in treatments varies greatly (Fig. 9). Protein treatment groups tended to have adequate amounts in aerated conditions but were significantly lower than the control in anaerobic conditions (p < 0.05). Conversely, carbohydrate and vegetable treatments shared higher levels of sulfur in anaerobic conditions. Notably, the carbohydrate group can be observed to have a large disparity in overall sulfur concentration (p < 0.05).
Sulfur content in aerobic/anaerobic food groups and vermiliquer after dilution to EC of 1.6 dS/m. DI = Deionized water. Horizontal line represents mean control sulfur content.

Figure 9. Long description
The boxplot displays sulfur adjusted concentration in micrograms per liter on the y axis and feedstock types on the x axis, ordered left to right as Beef, Bread, Chicken, D I, Pasta, Vegetables, and Vermiliquer (R A W). Each feedstock has two boxplots: blue for aerobic and pink for anaerobic conditions. The highest sulfur concentrations are observed for D I and Pasta, with D I showing a notably higher median and wider spread under anaerobic conditions. Pasta also shows elevated sulfur, with aerobic and anaerobic values both above the control mean. Beef, Bread, Chicken, Vegetables, and Vermiliquer (R A W) have much lower sulfur concentrations, clustering near the baseline. A red dashed horizontal line represents the mean control sulfur content across all feedstocks. The legend at the right identifies the color coding for aerobic and anaerobic conditions.
A possible explanation for such an abundance of sulfur may be attributed to anaerobic treatments limited capacity for desulfurization, which relies on excess H+ ions and aeration (Izadi et al., Reference Izadi, Assarian, Altaee and Mahinroosta2023). In addition, bacterial biomass may also represent a significant proportion of sulfur (Heinze et al., Reference Heinze, Hemkemeyer, Schwalb, Khan, Joergensen and Wichern2021). As such, it is possible that treatments which facilitate perennial bacterial populations (anaerobic and carbohydrate rich) result in greater overall sulfur levels. While sulfur toxicity in plants is rare, the effects of excess sulfur in soil systems are well documented. In soil systems, excess sulfates cause acidification, which can cause the precipitation of key nutrients such as Ca2+ and increase the risk of Al and Fe toxicity. Whether this effect is replicated in hydroponic systems is not well studied (Narayan et al., Reference Narayan, Kumar, Yadav, Dua and Johri2023).
Another consideration of sulfur is that excess amounts can form odorous compounds (Hoffmann et al., Reference Hoffmann, Gryglewicz, Hoffmann, Gryglewicz, Okereke and Skut2009). All treatments, other than vermiliquer, expressed a highly repugnant olfactory experience. The impact of elevated sulfur on the strength of this odor was not quantified. While this does not directly affect plant development, this should be a consideration for future research, as application of FWBHFs should not come at the detriment of human health.
Magnesium
The function of magnesium is largely found in chlorophyll pigments and enzymatic reactions throughout a plant. In the case of deficiency, a plant will show stunted root growth, interveinal chlorosis of mature leaves, and a reduction in total biomass (Ishfaq et al., Reference Ishfaq, Wang, Yan, Wang, Wu, Li and Li2022). Protein-based treatments tended to have a lower level of magnesium relative to the control (Fig. 10). While pasta and vegetable treatments were sufficient regardless of aeration, aerobic treatment on bread caused a significant reduction in magnesium compared to anaerobic treatment. The availability of magnesium in soil systems is limited by acidity, with a soil solution of pH < 6 causing a sharp drop of availability. This is not observed in the FWBHF treatments. Both anaerobic bread and pasta treatments had observed pH of ~4.5. In both cases, magnesium was significantly superior in anaerobic bread, and statistically similar in anaerobic pasta treatments. More studies into the solubility and availability of magnesium in aqueous solutions are required to understand the mechanisms behind its plant availability.
Magnesium content in aerobic/anaerobic food groups and vermiliquer after dilution to EC of 1.6 dS/m. DI = Deionized water. Horizontal line represents mean control magnesium content.

Figure 10. Long description
The chart is a single-panel boxplot with feedstock types on the x-axis labeled as Beef, Bread, Chicken, D I, Pasta, Vegetables, and Vermiliquer (R A W). The y-axis is labeled M g Adjusted open parenthesis micrograms per liter close parenthesis Concentration. For each feedstock, two boxplots are shown: blue for Aerobic and pink for Anaerobic, as indicated by the legend in the upper right. A dashed red horizontal line marks the mean control magnesium content across all feedstocks. Aerobic pasta shows the highest magnesium concentration, with a median near 100000 micrograms per liter and a wide range. Anaerobic bread and vegetables have higher medians than their aerobic counterparts. D I and Vermiliquer (R A W) samples cluster near the control mean. Beef and chicken have lower magnesium concentrations under both conditions. Outliers are present in several groups, especially aerobic pasta. The legend clarifies color coding for Aerated and Anaerobic conditions.
Deficiency of this element is exacerbated by acidic conditions, with a sharp drop of availability below pH 6.0 (Ishfaq et al., Reference Ishfaq, Wang, Yan, Wang, Wu, Li and Li2022).
Micronutrient and heavy metal analysis
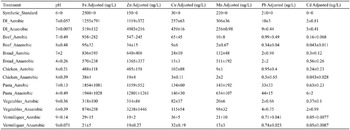
Micronutrients are essential for plant growth but are required in smaller amounts relative to macronutrients. Analyses of four micronutrients, zinc, copper, manganese, and iron, were performed using ICPMS. In addition, analyses of heavy metals, including lead and cadmium, were also performed, as excessive heavy metals can lead to detrimental effects in human health. A complete table of available micronutrient and heavy metal content is provided in Appendix B.
Zinc
All treatments have similar or significantly greater levels of zinc compared to the control (Fig. 11). Notably, pasta, bread, and vegetable treatments show a concentration of zinc high enough to cause zinc toxicity in crop species. The threshold for zinc toxicity varies by plant, but generally irrigation water is recommended to have a maximum zinc concentration of 2000 ug/L (Noulas, Tziouvalekas and Karyotis, Reference Noulas, Tziouvalekas and Karyotis2018) before symptoms of toxicity begin to impact yield. At the current concentration of each treatment (EC = 1.6 dS/m), the anaerobic pasta and vegetable treatments are at risk of yield reduction in crop species. Symptoms of toxicity can be ameliorated by raising solution pH above 6.0, which remains an acceptable threshold for the majority of hydroponic species. This partially explains why anaerobic carbohydrate and vegetable groups have such high concentrations of the element, as they all share a relatively low pH compared to their aerobic counterparts (Noulas, Tziouvalekas and Karyotis, Reference Noulas, Tziouvalekas and Karyotis2018). The protein groups show increased zinc concentrations in aerobic treatment compared to anaerobic treatments. Again, this may be caused by slight differences in pH causing heavy metal precipitates to form.
Zinc content in aerobic/anaerobic food groups and vermiliquer after dilution to EC of 1.6 dS/m. DI = Deionized water. Horizontal line represents mean control zinc content.

Figure 11. Long description
The chart displays boxplots for zinc adjusted concentration in micrograms per liter on the y axis, ranging from 0 to 15000, and feedstock types on the x axis: beef, bread, chicken, D I, pasta, vegetables, and vermiliquer (R A W). For each feedstock, two boxplots are shown: blue for aerobic and pink for anaerobic conditions. A red dashed horizontal line marks the mean control zinc content across all feedstocks. Anaerobic pasta and vegetables show the highest zinc concentrations, with anaerobic pasta reaching above 12000 micrograms per liter and vegetables above 5000 micrograms per liter. Other feedstocks, including beef, bread, chicken, D I, and vermiliquer (R A W), have much lower zinc concentrations, with most values clustering below 2000 micrograms per liter. The legend at the right identifies the color coding for aerobic and anaerobic conditions. Outliers are marked as individual points above or below the boxplots.
Copper
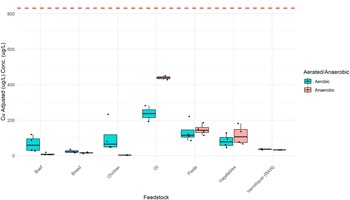
Copper has the unique trait of being both essential and toxic for plant and human development (Kumar et al., Reference Kumar, Pandita, Singh Sidhu, Sharma, Khanna, Kaur, Bali and Setia2021). Like zinc, copper is a metal cation (Cu+/Cu2+) and is most available under acidic conditions. All treatments have significantly lower copper contents relative to the control (Fig. 12). Protein groups share similar behavior, with aerated treatments yielding a higher, more varied copper content relative to anaerobic counterparts. Notably, pasta and vegetable treatments showed a similar reaction to aeration, while bread and vermiliquer both showed little variation and were statistically similar. This may be due to the insolubility of copper in fully aqueous solutions or due to the absence of copper in feedstocks.
Copper content in aerobic/anaerobic food groups and vermiliquer after dilution to EC of 1.6 dS/m. DI = Deionized water. Horizontal line represents mean control copper content.

Figure 12. Long description
The x axis lists feedstocks from left to right as Beef, Bread, Chicken, D I, Pasta, Vegetables, and Vermiliquer (R A W). The y axis shows copper adjusted concentration in micrograms per liter from zero to 800. Each feedstock group contains two box plots: blue for aerobic and pink for anaerobic conditions. Aerobic beef, chicken, D I, pasta, and vegetables show higher copper concentrations than their anaerobic counterparts, except for pasta and vegetables where anaerobic values are higher. D I has the highest copper concentration, around 400 micrograms per liter for both conditions. Vermiliquer (R A W) shows the lowest copper concentrations. A dashed red horizontal line at the top marks the mean control copper content. Outliers are indicated as black dots. The legend on the right identifies aerobic and anaerobic colors.
Manganese
Manganese is an essential cofactor in photosynthesis, catalyzing the process of splitting water in photosystem 2 reactions. Anaerobic bread and pasta treatments were significantly greater than control solution (Fig. 13). Their aerobic counterparts were the second closest to meeting significant similarity to the control. This is likely due to the manganese content found in wheat seed, an essential nutrient in ensuring germination and early growth in plants (Marcar and Graham, Reference Marcar and Graham1986). In FWBHF application, the inclusion of grain-based inputs may be useful in fortification of manganese. In plant-available form, the cationic Mn2+ shares a similar uptake path to calcium (Ca2+), and is most readily available in slightly acidic solutions (Alejandro et al., Reference Alejandro, Höller, Meier and Peiter2020).
Manganese content in aerobic/anaerobic food groups and vermiliquer after dilution to EC of 1.6 dS/m. DI = Deionized water. Horizontal line represents mean control manganese content.

Figure 13. Long description
The chart displays boxplots for manganese adjusted concentration in micrograms per liter on the y-axis, ranging from 0 to above 600. The x-axis lists feedstocks from left to right: Beef, Bread, Chicken, D I, Pasta, Vegetables, and Vermiliquer (R A W). For each feedstock, two boxplots are shown: aerobic (cyan, left) and anaerobic (pink, right). Bread and pasta under anaerobic conditions show the highest manganese concentrations, both exceeding 600 micrograms per liter. Aerobic bread and pasta have lower concentrations, with aerobic pasta showing a wider spread. D I water shows moderate manganese levels for aerobic, lower for anaerobic. Beef, chicken, vegetables, and vermiliquer have low manganese concentrations in both conditions. A red dashed horizontal line at approximately 220 micrograms per liter marks the mean control manganese content. The legend at the right identifies the color coding for aerobic and anaerobic conditions.
Iron
Iron is essential for electron transport in both photosynthesis and respiration in plants (Fig. 14). Across feedstocks, all had at least one aerated/anaerobic treatment which was considered significantly similar or greater than the control. Iron is primarily absorbed in cationic Fe2+ and Fe3+, and solubilizes readily in the presence of oxygen (Ning et al., Reference Ning, Lin, Huang, Mao, Gao and Wang2023). The outlier to this hypothesis is in the vegetable treatment; the mechanisms of this behavior are unknown. For other treatments, excess iron can cause yield reduction through disruptions of metabolic and photosynthetic processes (Ning et al., Reference Ning, Lin, Huang, Mao, Gao and Wang2023).
Iron content in aerobic/anaerobic food groups and vermiliquer after dilution to EC of 1.6 dS/m. DI = Deionized water. Horizontal line represents mean control iron content.

Figure 14. Long description
The boxplot displays seven feedstock categories along the x axis: Beef, Bread, Chicken, D I, Pasta, Vegetables, and Vermiliquer (R A W). For each category, two adjacent boxplots are shown: aerobic (cyan, left) and anaerobic (pink, right). The y axis shows iron adjusted concentration in micrograms per liter, ranging from 0 to 3000. A horizontal red dashed line marks the mean control iron content. Beef, Bread, D I, and Pasta show higher iron concentrations, especially under aerobic conditions, with Pasta having the widest range and highest values. Anaerobic samples generally have lower or similar concentrations except for Pasta, where both conditions are high. Chicken, Vegetables, and Vermiliquer (R A W) have low iron concentrations in both conditions. Outliers are marked as black dots. The legend at the right identifies aerobic and anaerobic box colors.
Heavy metals (lead and cadmium)
Heavy metal contamination in agricultural fertilizers can adversely impact both plant and human health (Figs. 15 and 16). As plants absorb heavy metals from soil solutions, these metals are transported to vegetative material, roots, and carbohydrate sinks in crops—causing bioaccumulation when consumed by humans. The level of tolerance for heavy metals is a well-studied field, with guidelines establishing a wide array of conditions to assist in determining acceptable limits. In Australia, fertilizer regulations are mandated by state governments. In New South Wales, the maximum accepted levels of cadmium and lead are 10,000 ug/kg, and 100,000 ug/kg, respectively, in nonphosphatic fertilizers (<2% phosphorus) (New South Wales Government, 2017). No treatment here exceeds this threshold. This is congruent with existing knowledge of heavy metal contamination in conventional hydroponic systems. Unlike in soil systems, conventional hydroponic systems are infrequently contaminated with heavy metals, largely due to the precise formulation of their synthetic solutions. However, the risk of heavy metal contamination increases when utilizing FWBHFs. Trace heavy metals from food products, such as in the pasta, bread, and chicken are solubilized during fermentation for plant uptake (Ghanati, Zayeri and Hosseini, Reference Ghanati, Zayeri and Hosseini2019; Aljohani, Reference Aljohani2023). In addition, plants grown in hydroponic systems have greater phytoremediation properties compared to soil systems—meaning they absorb heavy metal pollutants at a greater rate than soil-based counterparts. While this benefits the capacity for hydroponic systems to remove heavy metals from contaminated bodies, it increases the potential risk for heavy metal toxicity in both plant and human subjects (Sumalan et al., Reference Sumalan, Nescu, Berbecea, Sumalan, Crisan, Negrea and Ciulca2023). As such, considerations and checks for heavy metal toxicity should not be disregarded in future studies in this area.
Lead content in aerobic/anaerobic food groups and vermiliquer after dilution to EC of 1.6 dS/m. DI = Deionized water. Horizontal line represents mean control lead content.

Figure 15. Long description
The x axis lists feedstocks from left to right as Beef, Bread, Chicken, D I, Pasta, Vegetables, and Vermiliquer (R A W). The y axis is labeled P b Adjusted micrograms per liter Concentration. Each feedstock has paired box plots for Aerobic (blue) and Anaerobic (red) conditions, except for Vermiliquer (R A W) which has only one. A red dashed horizontal line marks the mean control lead content near 5 micrograms per liter. For Beef, Bread, Chicken, Vegetables, and Vermiliquer (R A W), both aerobic and anaerobic lead concentrations are clustered near or below the control mean. D I shows slightly elevated values around 15 micrograms per liter for both conditions. Pasta displays the highest lead concentrations, with aerobic values ranging from about 15 to 40 micrograms per liter and anaerobic values from about 40 to 70 micrograms per liter, both well above the control mean. The legend at the right identifies blue as Aerobic and red as Anaerobic.
Cadmium content in aerobic/anaerobic food groups and vermiliquer after dilution to EC of 1.6 dS/m. DI = Deionized water. Horizontal line represents mean control cadmium content.

Figure 16. Long description
The boxplot displays cadmium adjusted concentration in micrograms per liter on the y axis and feedstock types on the x axis, listed from left to right as Beef, Bread, Chicken, D I, Pasta, Vegetables, and Vermiliquer (R A W). For each feedstock, two boxplots are shown: blue for aerobic and pink for anaerobic conditions. The legend at the right identifies these colors. Most feedstocks show low cadmium concentrations under both conditions, except for D I, Pasta, and Vegetables, where anaerobic samples have notably higher concentrations. D I anaerobic has a median near 6 micrograms per liter, Pasta anaerobic has a wide range up to about 8 micrograms per liter, and Vegetables anaerobic has a median just above 2 micrograms per liter. Aerobic samples for these feedstocks are lower, with D I aerobic around 2 micrograms per liter and others near or below the red dashed line. The red dashed line, spanning horizontally at approximately 1.5 micrograms per liter, represents the mean control cadmium content. Individual data points are plotted as black dots within each boxplot.
Conclusion
This study suggests that individual food groups are not capable of forming an ‘all-in-one’ solution and suggests future studies to introduce composite FWBHF solutions using the same techniques and comparing results with these findings. It does find similarities within food groups of similar composition. Protein-rich food groups shared similar reactions in mineral synthesis when exposed to aerobic and anaerobic fermentation treatments. Conversely, carbohydrate-based treatments occasionally differed in reaction to treatments. This may be due to postprocessing methods altering composition of nutrients through baking, moisturizing, supplementing with other ingredients, or even the fortification of foods with human essential nutrients. All fermentation treatments shared the same odorous trait, which may be difficult to overlook in commercial or retail application.
While the composite vermiliquer treatment was deficient in nitrogen, calcium, copper, and manganese nutrient groups, it was odorless and demonstrated a capacity for nitrification. In addition, it contained adequate potassium, sulfur, magnesium, zinc, and iron. Current applications of this treatment may be as supplements to existing synthetic fertilizers, or as a standalone fertilizer when used in conjunction with nutrient supplements.
Future directions should include identification of potential microbial fixers of nutrients. Identification and cultivation of microbes capable of partaking in the breakdown of organic material into inorganic nutrients may be the key to optimizing nutrient cycling in FWBHF development. The extension of cultivating communities during FWBHF production is to maintain similar communities in active growth systems. Exploring the potential of creating a stable microbiome in operational hydroponic systems provides potential to explore continual supplementation of organic nutrients during growth stages and to minimize chemical and physical methods of pest and disease control.
This article has identified that current iterations of FWBHF development methods are incapable of meeting the nutrient levels of synthetic solutions. The primary challenge appears to be excessive salinity limiting available nutrients. High salinity environments place stress on plant nutrient uptake, and thus solutions must be dosed at levels that may not provide optimal nutrition to plants. Developments in the isolation, precipitation, or removal of excess salts should be explored going forward in FWBHF development. Using FWBHF to achieve optimal yields will likely require the use of synthesized solutions, although efforts to explore the effects of substitution should be made. A partial replacement of synthetic solutions still works toward the goal of improving nutrient cycling in our food production systems and bringing urban horticulture into the growing field of sustainable agriculture.
Acknowledgments
The authors would like to thank Nicholas Proschgo and Bernadeth Antonio for assistance in ICP-MS analysis. The authors would also like to thank Feike Djikstra, Milal Bagheri Shervan, and Shiva Bakhshandeh for assistance in FIA analysis.
Author contribution
O.W. and F.V. conceptualized the study. O.W. performed the investigation, collected data, and performed the formal analysis. O.W. wrote the original draft, and both O.W. and F.V. contributed to the review and editing of the final manuscript.
Funding statement
This work was funded by the Sir Henry Loxton Scholarship for Postgraduate research in Agriculture.
Competing interests
The authors declare that no competing interests exist.
Appendix
Table of available macronutrients, sodium, and pH across treatment groups.

Appendix A. Long description
The table header lists available macronutrients, sodium, and pH as columns. Each row beneath the header represents a different treatment group, with specific values for each nutrient, sodium, and pH. Data are organized so that for each treatment group, the corresponding macronutrient concentrations, sodium content, and pH values are aligned horizontally. No graphical elements or color coding are present; all information is presented as text and numbers within the table grid.
Table of available micronutrients and heavy metals across treatment groups.
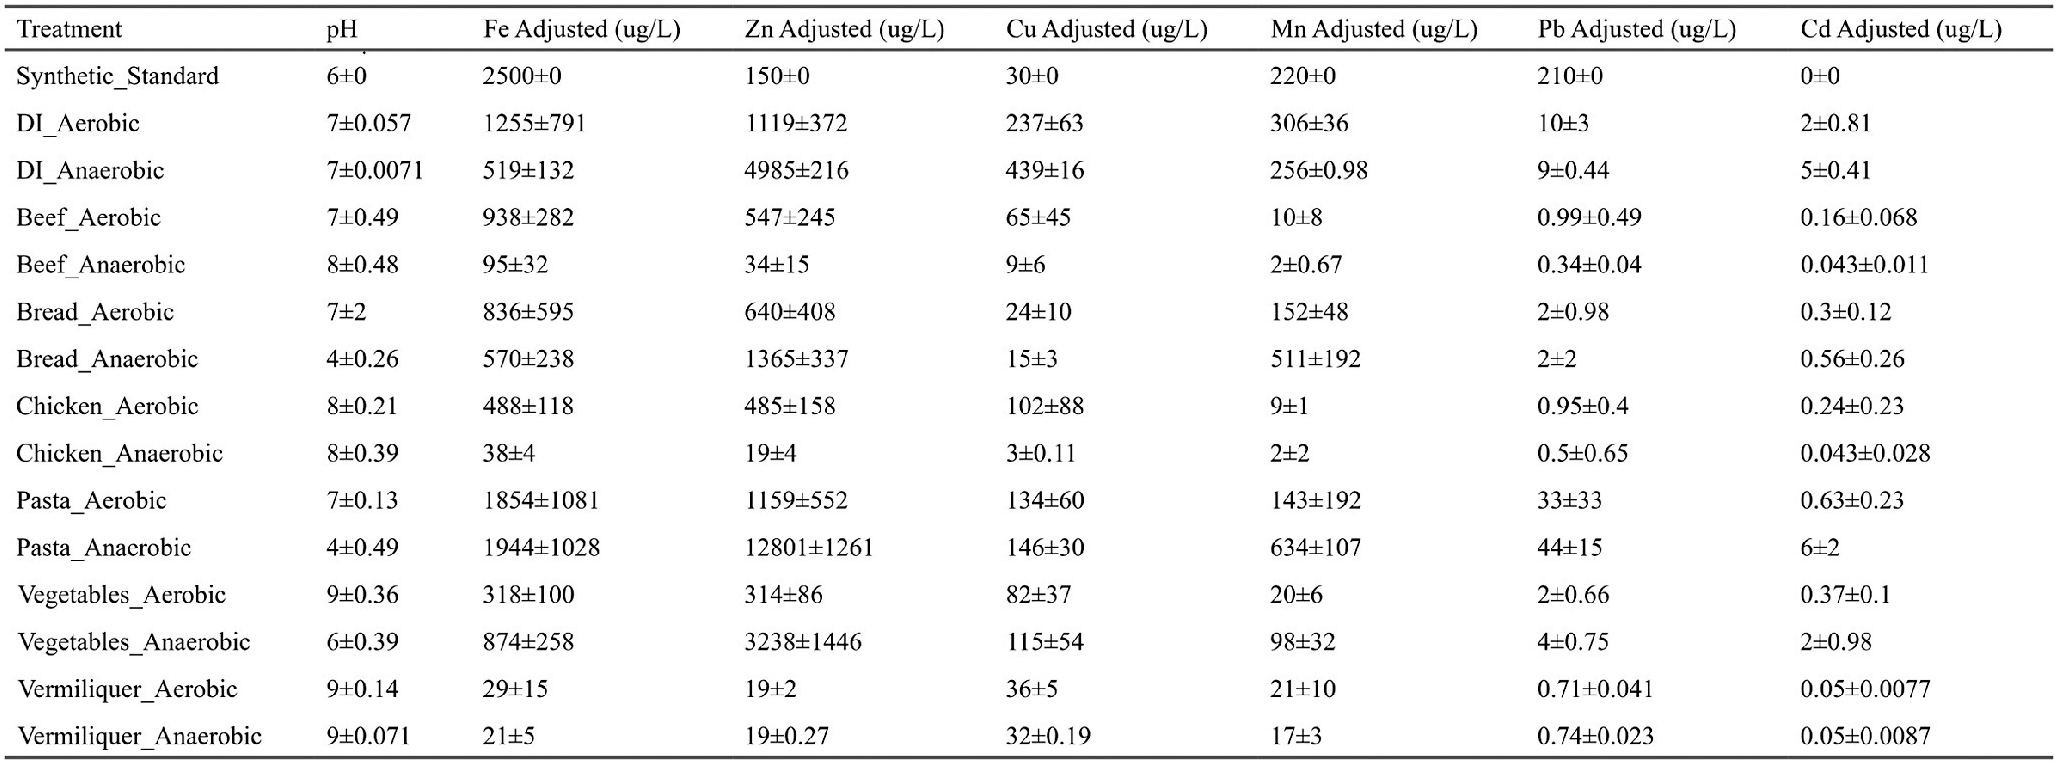
Appendix B. Long description
The table header lists treatment groups horizontally from left to right. The first column vertically lists micronutrients and heavy metals, including elements such as iron, zinc, copper, manganese, lead, and cadmium. Each cell at the intersection of a row and column contains the measured concentration for that element within the corresponding treatment group, reported in consistent units. Values vary by treatment, with some groups showing elevated levels of specific metals. No color coding or graphical embellishments are present; all data are presented as numerical values. The table structure allows for direct comparison of each element’s concentration across all treatment groups.








 Open access

