


Introduction
Personal data have become inputs to algorithms that produce public goods in many different domains. For instance, personal data help predict diseases and their outbreak (Ginsberg et al., Reference Ginsberg, Mohebbi, Patel, Brammer, Smolinski and Brilliant2009; Obermeyer & Emanuel, Reference Obermeyer and Emanuel2016), which has also triggered the use of tracing apps to mitigate the spread of COVID-19. Personal data can help build algorithms that route traffic more efficiently (Lv et al., Reference Lv, Duan, Kang, Li and Wang2014; Cramton et al., Reference Cramton, Geddes and Ockenfels2019). Moreover, on open online learning platforms – the setting studied in this article – personal data serve as inputs to algorithms that improve learning experiences (Yu et al., Reference Yu, Miao, Leung and White2017; Fauvel et al., Reference Fauvel, Yu, Miao, Cui, Song, Zhang, Li and Leung2018) not only for the contributing user but also for the entire user community. Irrespective of the domain, these examples have something in common: personal data contribute to a public good, be it the ‘absence of disease’ (Fisman & Laupland, Reference Fisman and Laupland2009), uncongested traffic flow, or free online education. In these public good contexts, people share personal data on a voluntary basis to public goods, that is, they ‘donate’ data.Footnote 1 Public good providers explicitly use this term themselves. For instance, to create open-source speech-recognition software, Mozilla's Common Voice project asks to ‘donate your voice.’ Similarly, the online platform openhumans.org asks for donations of personal data to conduct scientific research.Footnote 2, Footnote 3
Due to non-rivalry and non-excludability in consumption, contributions of personal data to a public good are as likely to be underprovided as other types of contributions such as money or effort, which have been extensively studied [see, e.g., Frey & Meier (Reference Frey and Meier2004), Shang & Croson (Reference Shang and Croson2009), Krupka & Croson (Reference Krupka and Croson2015), or Chaudhuri (Reference Chaudhuri2011) for a review]. Yet, tackling the underprovision of personal data to public goods may differ for two reasons: personal data are individual-specific and they are potentially privacy-sensitive. First, individual-specific means that not only the total amount of donations matters but also who and how many different people donate personal data. Imagine algorithms to route a city center's traffic were missing data on pedestrians (Green, Reference Green2019). With these biased input data, we would expect streets to become unsafe. If only a small share of a population truthfully participated in a contact tracing app, then the app may not be very effective in containing the spread of a disease (Nature Editorial, 2020). Likewise in online education, where currently about 80% of MOOC participants fail to reach their intended learning goal (Kizilcec et al., Reference Kizilcec, Reich, Yeomans, Dann, Brunskill, Lopez, Turkay, Williams and Tingley2020), it is unclear how to best use personal data to build algorithms that support the learning goals of all participants if only 48% of all users share information about themselves – as it is the case at baseline in our setting.Footnote 4 Hence, public good production that uses personal data as inputs to train algorithms requires not only a large but also a diverse and representative database. Otherwise, the quality of the public good may suffer. While other types of individual-specific contributions to public goods have already been studied, for example, knowledge (Zhang & Zhu, Reference Zhang and Zhu2011; Chen et al., Reference Chen, Farzan, Kraut, YeckehZaare and Zhang2020) and feedback (Bolton et al., Reference Bolton, Katok and Ockenfels2004; Ling et al., Reference Ling, Beenen, Ludford, Wang, Chang, Li, Cosley, Frankowski, Terveen, Rashid, Resnick and Kraut2005; Chen et al., Reference Chen, Maxwell Harper, Konstan and Li2010; Cabral & Li, Reference Cabral and (Ivy) Li2015; Bolton et al., Reference Bolton, Mans and Ockenfels2020), personal data as contributions have so far been neglected. We study whether insights on how to boost other types of contributions transfer to personal data.
Second, personal data contributions may work differently than other individual-specific contributions because compared to providing feedback or knowledge, they come with an additional concern: privacy costs.Footnote 5 These may exacerbate the underprovision of personal data donations to public goods. As Goldfarb and Tucker's (Reference Goldfarb and Tucker2012) document, there are certain demographic groups, for example, elderly and women, that are less likely to share personal information. This heterogeneity in privacy concerns challenges the public goods production that takes personal data as inputs. If the elderly are more concerned to share their location, traffic flows cannot be optimized, and contact tracing apps will not be able to serve this at-risk group. Similarly, if users who do not belong to the median user group are less inclined to share information, for example, female users in tech-related online learning, these platforms are more likely to continue to cater to optimize the learning experience for the male median user.
In this article, we study how to increase both the quantity and quality, that is, the diversity of personal data contributions to a public good in light of the public benefits and private privacy costs of sharing such information. More precisely, we conduct a randomized natural field experiment (Harrison & List, Reference Harrison and List2004) on one of Germany's largest massive open online course (MOOC) platforms, openHPI. This nonprofit online education platform provides a public good partly using personal data as inputs: free online education that can be tailored to individual-specific needs. Our intervention aims at increasing the quantity (both at the extensive and intensive margins) and the diversity of personal data available to the MOOC platform – our exemplary public good provider – such that the platform can supply the best fitting services to all learners.
Our experiment compares one control group to two treatment groups. The control group receives a pop-up message which prompts users to complete their profile and hence draws their attention to their profiles. The treatment conditions go beyond this pure attention effect. In the first treatment (Public Benefit), the pop-up message additionally makes the public benefit of sharing personal data on the platform more salient (Chetty et al., Reference Chetty, Looney and Kroft2009; Bordalo et al., Reference Bordalo, Gennaioli and Shleifer2013), thereby emphasizing that providing information has positive effects beyond private benefits. Resembling Andreoni (Reference Andreoni2007) and Zhang and Zhu (Reference Zhang and Zhu2011) raises the perceived number of beneficiaries that benefit from contributing personal data, which may trigger more contributions. In the second treatment (Public Benefit + Privacy), the pop-up message additionally highlights data protection standards, thereby reducing potentially overestimated privacy costs. We measure the completeness of user profiles before and after the pop-up intervention. This experimental design allows us to investigate whether classical interventions, which mitigate the underprovision of public good contributions, increase the amount of personal data donated and whether it is necessary to additionally account for their privacy-sensitive nature. Furthermore, by comparing profile content, the experimental design also allows to study how the treatment affects the diversity of the contribution base.
Overall, our treatments increase personal data contributions at the intensive and extensive margins, and make the database more diverse. At baseline, 48% of users have an entry in their profile and the average user completes 2.6 (out of 11) profile categories. Making public benefits more salient significantly boosts profile completeness by 5.3% compared to the control group. If combined with an emphasis on privacy protection, this effect increases further, but not significantly further, to 6.4%. These effects are sizableFootnote 6 given that we observe a higher intention to update one's profile in the control group, where after seeing the pop-up more users click on the link to their profile than in the treatment groups. While we find no clear evidence for treatment effects on the overall extensive margin, that is, whether users have at least one profile entry, we do observe an increase by 12% on the extensive margin when examining the four most privacy-sensitive categories. Furthermore, the type of users who contribute their personal data changes significantly, especially in the Public Benefit + Privacy treatment. For instance, after the intervention, user characteristics shift in terms of job experience, job position, education, and gender, generating a more diverse database. We particularly observe such shifts in the distribution of user characteristics for the more sensitive personal information. These results imply that internalizing public benefits increases personal data contributions to public goods and that accounting for the privacy-sensitive nature of personal data tends to make mitigating underprovision more effective, especially when it comes to more sensitive and diverse personal data contributions.
Our article relates and contributes to the literature on mitigating the underprovision of public goods in two ways. First, we gauge whether using insights on how to increase individual-specific contributions to public goods apply to personal data as contributions as well. Previous research studies feedback giving and knowledge sharing as forms of individual-specific contributions to public goods. Results by Cabral and Li (Reference Cabral and (Ivy) Li2015) suggest that the underprovision of feedback cannot successfully be tackled with monetary incentives. In contrast, behaviorally motivated interventions appear more successful in mitigating underprovision. For instance, reputation systems and social comparisons can increase feedback provision (Bolton et al., Reference Bolton, Katok and Ockenfels2004; Chen et al., Reference Chen, Maxwell Harper, Konstan and Li2010).Footnote 7 Yet, as results by Ling et al. (Reference Ling, Beenen, Ludford, Wang, Chang, Li, Cosley, Frankowski, Terveen, Rashid, Resnick and Kraut2005) show the exact wording is important for actually achieving positive effects.Footnote 8 For knowledge as an individual-specific contribution to a public good, studies on Wikipedia show that a combination of private and public benefits (Chen et al., Reference Chen, Farzan, Kraut, YeckehZaare and Zhang2020) as well as a large number of beneficiaries (Zhang & Zhu, Reference Zhang and Zhu2011) determine contributions to the public information good.Footnote 9 Building on these insights, we implement behaviorally informed interventions in a field experiment, which aim at increasing personal data sharing, a new form of an individual-specific contribution to a public good. In particular, we increase the salience of the public benefit when contributing personal information to a public education good and can show that this increases contributions.
Second, we contribute to research in the domain of privacy by investigating the effect that privacy sensitivity of personal data has on data provision. Research in this domain has so far focused on pricing or sharing personal data under varying data protection standards in other than public benefit-enhancing settings.Footnote 10 While in our setting personal data are not sold for profit but serve the common good, this literature strand provides guidance for our experimental design. For one thing, it suggests that contextual cues affect the sharing of personal information. For example, there are differences in personal data sharing based on which heading a personal data survey has, whether privacy rating icons are displayed, or at which position the privacy-protecting items are listed (John et al., Reference John, Acquisti and Loewenstein2011; Tsai et al., Reference Tsai, Egelman, Cranor and Acquisti2011; Chang et al., Reference Chang, Krupka, Adar and Acquisti2016; Athey et al., Reference Athey, Catalini and Tucker2017). For another, it shows that salience rather than the actual comprehensiveness of privacy protection appears important when individuals decide about sharing personal information (Tucker, Reference Tucker2014; Athey et al., Reference Athey, Catalini and Tucker2017; Marreiros et al., Reference Marreiros, Tonin, Vlassopoulos and Schraefel2017).Footnote 11 Furthermore, data sharing has privacy costs, which may increase when disclosure is incentivized (Ackfeld & Güth, Reference Ackfeld and Güth2019). Therefore, our experiment not only makes the public benefit more salient but also data protection. Our results highlight that personal data contributions to a public good increase the most relative to baseline when privacy concerns are accounted for, particularly for sensitive information and from heterogeneous contributors.
The remainder of this article is structured as follows. The ‘Experimental setup’ section describes the data and the experimental design. Our empirical strategy is outlined in the ‘Empirical strategy’ section. The ‘Results’ section presents the experimental results, and the ‘Conclusion’ section concludes.
Experimental setup
Online platform environment
We conduct our field experiment on one of the biggest German MOOC platforms with more than 200,000 users, openHPI, which offers free online courses covering topics in computer science as well as information and communication technology for beginners and experts either in English or German. We implement our experiment in four courses offered between September 2019 and February 2020, namely ‘Network virtualization – from simple to cloud,’ ‘Introduction to successful remote teamwork,’ ‘The technology that has changed the world – 50 years of internet,’ and ‘Data engineering and data science.’Footnote 12 While slightly different in structure, all courses have the same enrollment procedures and consist of video lectures and individual or group assignments. Moreover, all courses use the same interface and have the same requirements to earn certificates.Footnote 13
Our intervention targets the user profile. To enroll in a course, one must register as a user on the openHPI platform providing a valid email address for communication and a (real) name that will be printed on course certificates. During registration, a user profile is automatically created and can be updated by users at any time. Besides these required fields, users can voluntarily provide the following information in their profiles which are not visible to other users: date of birth, company affiliation, career status, highest educational degree, professional experience, professional position, city, gender, country, main motivation for taking courses on the platform, and regular computer usage.Footnote 14 The last two profile categories were introduced just shortly prior to our intervention, and all other categories had been part of the profile at the time of registry of all users.Footnote 15 We use the new profile categories to rationalize the appearance of our intervention's pop-up message in courses.Footnote 16
Hypotheses and experimental design
In order to test what fosters personal data contributions to a digital public good, we investigate two factors. First, we test a rather classical remedy to underprovision. We follow results by Andreoni (Reference Andreoni2007) and Zhang & Zhu (Reference Zhang and Zhu2011) in the domains of monetary and knowledge contributions to public goods, who show that contributions to public goods increase with the number of beneficiaries. Following this insight, making public benefits of personal data contributions salient (Chetty et al., Reference Chetty, Looney and Kroft2009; Bordalo et al., Reference Bordalo, Gennaioli and Shleifer2013) by raising the perception of the number of beneficiaries on the online learning platform should have a positive effect on contributions. To test whether this insight transfers to the domain of personal data contributions, we formulate the following hypothesis:
Hypothesis 1: Emphasizing the Public Benefit of contribution increases personal data contributions relative to a Control message.
For the second hypothesis, we take into account that personal data by its very nature may be privacy-sensitive. These privacy concerns may attenuate the positive effect of highlighting the number of beneficiaries. If this is true, we expect personal data contributions to rise more strongly if greater salience of public benefit is combined with making privacy protection salient. This may reduce potentially overestimated privacy costs of data sharing.
Hypothesis 2: Additionally emphasizing data protection standards further increases personal data contributions relative to just highlighting the Public Benefit.
Users who actively engage with the MOOC material after the first week of the course are randomly assigned to a control group and two treatment groups. Randomization is implemented based on the standard round-robin algorithm to perform circular assignments ensuring equal group sizes.Footnote 17 Thereby, no stratification is applied. If a user is enrolled in more than one course, we only count her in the chronologically first course. However, it does not matter whether the user was already enrolled in other courses on the platform that are not part of the experiment. Table 1 shows the different treatment texts, Supplementary Figure A.1 displays a screenshot of the most comprehensive pop-up, and Figure 1 graphically represents the timeline of the experiment.
Wording for control and treatment groups.
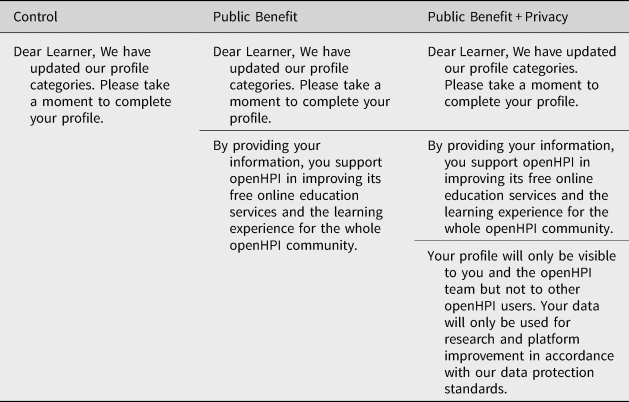
Notes: The words ‘data protection’ in Public Benefit + Privacy contain a link to the privacy protection guidelines of the platform. All treatments include a link to the user profile at the end. Supplementary Figure A.1 provides a screenshot of the pop-up.
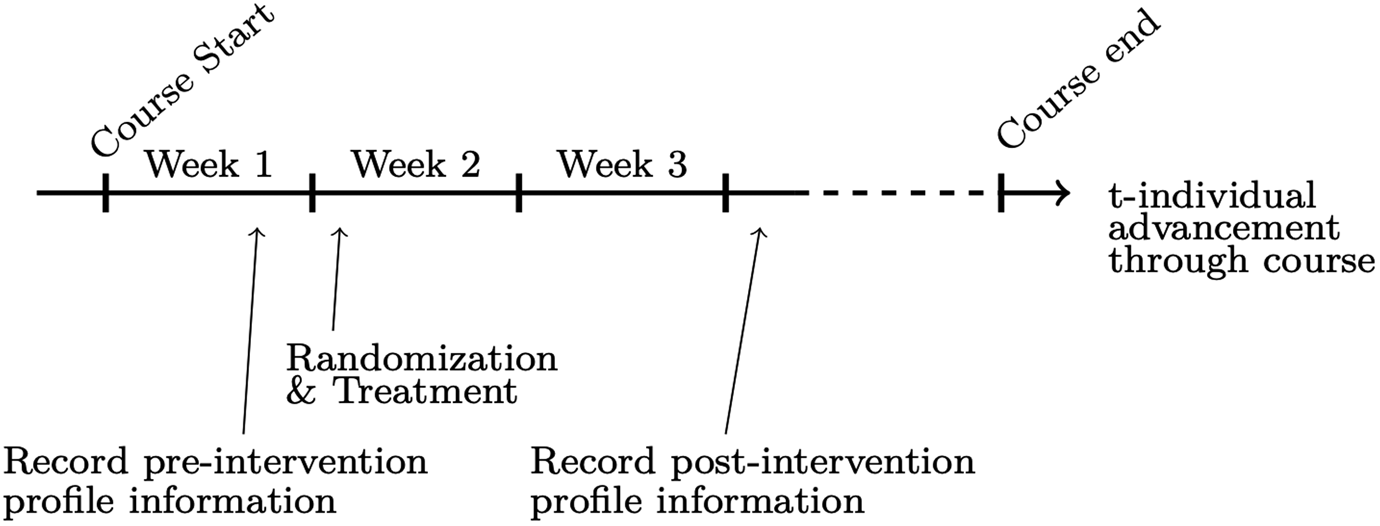
Timeline of the experiment.
Our sample includes all users who are active in the second course week; hence, by design, we exclude users from our sample and intervention that do not make it that far.Footnote 18 Two aspects guided this decision. First, the first week is already full of information; hence, participants could miss our intervention or important course-related information.Footnote 19 Second, platform improvement based on extended user information is meant to target users with a genuine interest in courses. By focusing on participants who are still active in the second week, we exclude only marginally interested participants.
For the pre-intervention baseline, we record profile completeness 2 days before the intervention (Days 5–6 of the course). More precisely, we measure whether users have any profile entries and if so, how many profile entries. We compare this with the profile completeness 21–22 days after course start, that is, 14–15 days after our intervention. This gives course participants 2 weeks to edit their profiles in response to the intervention. Collecting post-intervention data after 2 weeks allows us to also include those users in our sample, who lagged behind at the beginning of the course but caught up in between.Footnote 20
The pop-up messages in the two treatments and the Control group all contain the following text and a link to the user's profile: ‘Dear Learner, We have updated our profile categories. Please take a moment to complete your profile.’ The Control group pop-up ensures that we can isolate a pure reminder effect of the pop-up message from effects due to the salience of public benefits and overestimated privacy costs which are the focus of this article. In the Public Benefit treatment, the standard text is extended by a note on the public benefit that providing personal information can have for the whole user community. It reads: ‘By providing your information, you support openHPI in improving its free online education services and the learning experience for the whole openHPI community.’
In the Public Benefit + Privacy treatment, a remark is added to this statement emphasizing privacy protection standards, particularly who has access to the shared information: ‘Your profile will only be visible to you and the openHPI team but not to other openHPI users. Your data will only be used for research and platform improvement in accordance with our data protection standards.’ The reference to data protection includes a link to the data protection webpage.Footnote 21
Descriptive statistics at baseline
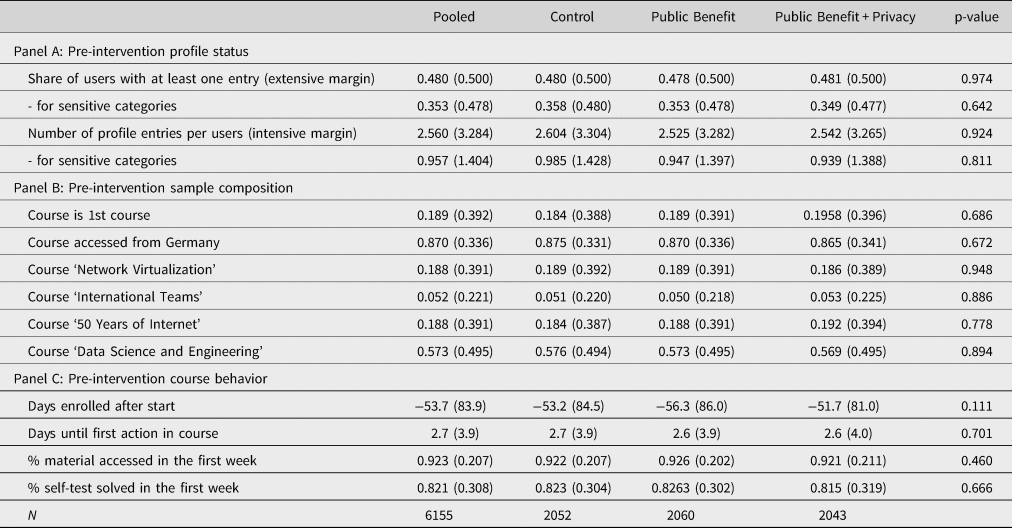
This section reports descriptive statistics of our baseline pre-intervention sample and additionally allows to check whether randomization into treatments was successful. First, we document the pre-intervention outcomes for all treatment groups in Panel A of Table 2. 48.0% of users have at least one entry in their profile before the intervention, and the average profile includes 2.6 completed entries out of 11. There are four categories that treatment-blind raters categorized as disproportionately sensitive: one's company name, the highest educational degree, professional experience, and the current job position.Footnote 22 For these categories, we observe much lower baseline values; 35.3% for the extensive and 0.9 for the intensive margin. Before the intervention, most profile categories have a missing rate of at least 60.4% (Supplementary Table A.4). For the two newly introduced categories ‘main motivation’ and ‘regular computer use,’ the missing share is much higher, that is, 94.9% and 94.7%, respectively. χ 2-tests do not detect any statistically significant differences across the treatment groups in terms of the share of missing values pre-intervention (all p ≥ 0.128).Footnote 23
Pre-intervention course activity and characteristics overall and by treatment.
Notes: Mean values reported with standard deviations in parentheses. Participants enrolled in more than one intervention course only enter the sample once with their chronologically first course. p-values stem from χ 2– tests of independence of frequencies between treatments.
Second, we report the pre-intervention sample composition in Panel B of Table 2. For 18.9% of users in our sample, the course is the first course they take on the platform. 87.0% access the course from a browser located in Germany. This high share is not surprising given that three out of four courses in our sample are taught in German. 57.3% of users participate in the course ‘Data Engineering & Data Science,’ 18.8% in ‘50 Years of Internet,’ and 19.2% in ‘Network Virtualization.’ Only 5.2% of users participate in the English-speaking course ‘International Teams.’
Third, Panel C of Table 2 describes users’ pre-intervention course behavior and related course information, and confirms that users across treatments are similar in these domains. On average, users enroll 53.7 days prior to course start and begin working on the material 2.7 days after the course start. Since our sample only includes users who are still active in the second course week, we observe a high level of first-week activity: users access 92.3% of the material and complete 82.1% of all self-tests in the first course week.
In sum, for all pre-intervention characteristics, we find no statistically or economically significant differences between treatments. All p-values from χ 2-tests for equal distribution over all treatments exceed the 10% significance level. Thus, randomization into treatment was successful. Furthermore, with more than two thousand observations in each treatment group, we have enough power to identify a 10% effect size at the extensive margin and a 5% effect size at the intensive margin.
Empirical strategy
We estimate the effects of our treatment dummies on post-intervention information disclosure, controlling for the initial disclosure level:

for individual i with T ′ being a vector of treatment dummies, T 1 = Benefit and T2 = Public Benefit + Privacy. We include a matrix (X) of control variables to increase the precision of our estimates. y it−1 are the pretreatment outcomes.
As main dependent variables y it, we focus on (1) the extensive margin, that is, whether at least one profile category is filled after the treatment intervention, (2) the intensive margin, that is, how many profile categories are filled, and (3) whether users click on the link to their profile. Clicking on the profile link in the pop-up corresponds to an intention to provide personal data in our experiment. Because there is no baseline for clicking on the link, Equation (1) simplifies to

As secondary outcomes, we look at sensitive categories separately. Furthermore, we study the type of profile changes. Do users only add to their profile? Or, do they also delete and update entries? Updating categories may be relevant if, for example, IT proficiency or work experience has increased since the last revision of the profile.
As controls X, we include several context-related variables into our regressions.Footnote 24 First, we add course fixed-effects. These dummies do not only capture differences between courses but also different durations between the respective course start date and the publishing of the new profiles categories. Second, we use the enrollment date and the first show-up after course start to control for self-organization skills and the level of course commitment. The latter enters our estimation equation as a dummy variable indicating whether the person accessed the course at least as early as the median user. Third, we include a dummy variable for whether it is the first course the user takes on the platform. This accounts for experience with and potential trust toward the platform. Fourth, we control for different reactions between different cultures, for example, with respect to privacy concerns (Bellman et al., Reference Bellman, Johnson, Kobrin and Lohse2004; IBM, 2018) by including a dummy variable for course access from Germany, an information that the browser provides.
Results
Main results
In this section, we investigate treatment effects on our three main outcomes of interest: (1) the extensive margin, that is, the share of users that have at least one profile entry after the intervention, (2) the intensive margin, that is, the mean number of profile entries users have after the intervention, and (3) the intention of data sharing, that is, whether users click on the link to their profile in the pop-up.
At the extensive margin, we do not find statistically significant differences between the treatment groups and the control group despite point estimates being twice as large for the Public Benefit + Privacy than for the Public Benefit treatment group (Table 3, columns 1 and 2; p = 0.615 for the Public Benefit and p = 0.250 for Public Benefit + Privacy treatment). Nevertheless, the confidence intervals include effect sizes that are of economic significance. For the Public Benefit and the Public Benefit + Privacy treatment, the 95% confidence intervals can only rule out effect sizes beyond (−5.2%; 8.8%) and (−2.7%; 11.3%) relative to the Control group, respectively.Footnote 25 This suggests that our treatment effects are not clear zero effects, but rather imprecisely estimated because we lack statistical power for identifying effects at the extensive margin that are smaller than 10%.Footnote 26 Thus, at the extensive margin, there is no robust statistical evidence for our hypotheses; the point estimates merely suggest that highlighting public benefits and privacy protection leads to more disclosure than just calling attention to the profile as in the Control group.
OLS regression results of main outcomes on treatment.
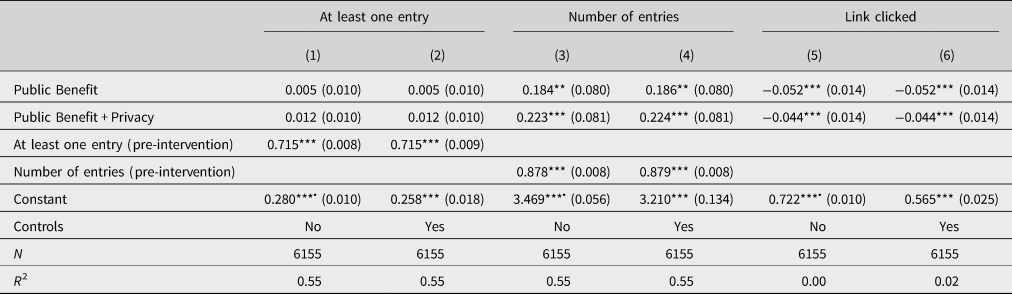
Notes: Robust standard errors are given in parentheses. Estimations for columns 1–4 as specified in Equation (1) and for columns 5 and 6 as in Equation (2). Controls include dummies for the courses ‘International Teams,’ ‘50 Years of Internet,’ and ‘Data Science & Engineering,’ whether the course is the first course on the platform, whether the course is accessed from Germany, and whether it is accessed earlier than the median access, as well as the day of enrollment relative to the course start. ‘Entries pre’ in columns 3 and 4 are demeaned. This way the constant can be interpreted as the mean effect observed in the Control group. We highlight these coefficients with a • symbol.
*p < 0.10, **p < 0.05, ***p < 0.01.
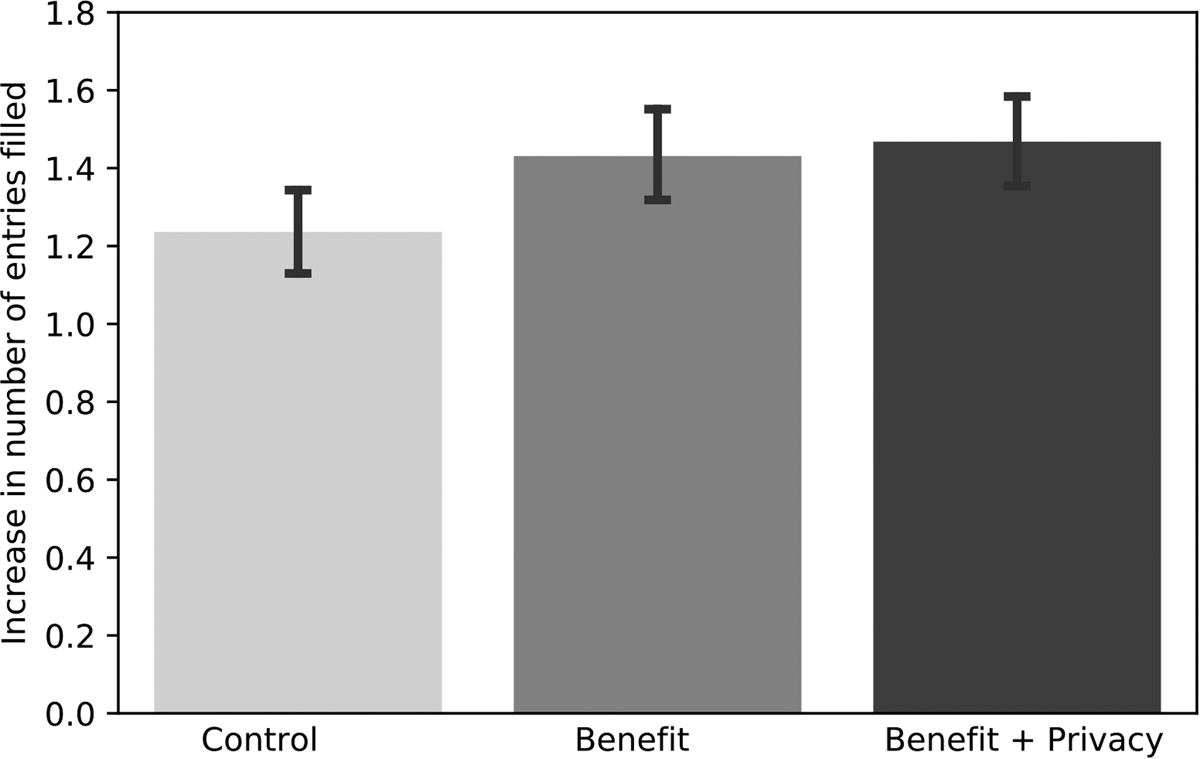
At the intensive margin, we detect a substantial and statistically significant increase in the amount of profile entries. As Figure 2 shows, this increase differs significantly between the control and treatment groups. In line with our hypotheses, the increases in profile entries in Public Benefit and Public Benefit + Privacy are statistically significantly larger than in the Control group (p = 0.017 and p = 0.005, t-test).Footnote 27 The largest increase takes place in the Benefit + Privacy treatment group, in which the mean of completed profile entries rises from 2.5 to 4.0. Controlling for pre-intervention profile completeness in an OLS regression (Table 3, columns 3 and 4 including further controls), we obtain positive point estimates for both the Public Benefit and Public Benefit + Privacy treatment indicators which are significant at the 5% and 1% level, respectively. Precisely, users in Public Benefit contribute on average 0.18 additional profile entries independent of their pre-intervention profile status compared to Control group users. In Public Benefit + Privacy, users even provide 0.22 additional entries. In other words, every fifth treated user in Public Benefit and Public Benefit + Privacy fills out one more empty profile category than the Control group participants do after seeing the pop-up message. The effect sizes amount to 5.3% and 6.4%, respectively.Footnote 28 While the two treatment coefficients are not statistically different from each other (p = 0.653), the larger increase in Public Benefit + Privacy suggests that emphasizing privacy protection along with the public benefit may render more personal data contributions. In short, we find evidence for Hypothesis 1 that the salience of public benefits can encourage users to disclose more personal data than when user are just reminded of their profile. Albeit lacking statistical significance, the point estimates also provide suggestive directional evidence for Hypothesis 2. This underlines that positive effects of highlighting the public benefits may be attenuated if privacy concerns are not taken into account.Footnote 29
Intensive margin: increase in number profile entries by treatment. Notes: The figure displays the post-intervention increase in the number of profile entries completed. The error bars indicate the 95% confidence intervals.
Our third main outcome is the intention to update the profile. We approximate intention with the share of clicks on the link to the profile in the intervention pop-up. Surprisingly, significantly more users click on the link in the Control group than in the Public Benefit and Public Benefit + Privacy treatments as Figure 3 displays (p < 0.001 and p = 0.002, rank sum test). Concretely, 72.2% of Control group users click on the link, while 67.0% and 67.7% do so in Public Benefit and Public Benefit + Privacy, respectively. The same picture prevails if investigating treatment effects in an OLS regression framework (without and with control variables in columns 5 and 6 of Table 3), with treatment effects corresponding to decreases of 7.2% and 6.1%, respectively, in Public Benefit and Public Benefit + Privacy relative to the baseline. While the higher share of users clicking on the link in the Control group is surprising at first glance, it is well in line with convex effort cost of text reading time (Augenblick et al., Reference Augenblick, Niederle and Sprenger2015). The Control group text is the shortest, so users may be more likely to read it to the end and are thus more likely to reach the button with the profile link. In light of this potentially offsetting effect, the treatment effects on the intensive margin regarding actual profile filling appear even more sizeable. Particularly, while the treated groups have lower click rates, they are more likely to follow through with their intention to update their profiles and hence to contribute personal data than users in the Control group.
Intention to share data: participants who click on profile link. Notes: The figure displays the share of users who click on the link to their profile which was included in the pop-up. The error bars indicate the 95% confidence intervals.

At the extensive margin, the different prompt messages do not affect users’ willingness to share information significantly due to imprecise estimates, but the point estimates suggest effects may go in the hypothesized directions. Finally, users in the Public Benefit and Public Benefit + Privacy treatments follow through with their intention to provide data more often, even though they have lower profile click rates than the Control group.
Overall, our main results show that especially at the intensive margin, the type of pop-up message matters. Relative to the number of post-intervention entries in the Control group, the Public Benefit treatment and the Public Benefit + Privacy treatment increase available user information significantly, in line with our hypotheses.Footnote 30 While exact benchmarking is difficult due to differences in outcomes, context, and exact experimental design, we argue our effect sizes are meaningful given the intervention, albeit at the lower end of the spectrum found in the literature. For instance, they are about half the effect sizes found when raising donations for a public radio station and explicitly mentioning high donations of others (Shang & Croson, Reference Shang and Croson2009). When it comes to data inputs, Athey et al. (Reference Athey, Catalini and Tucker2017) report an increase of about 50% in disclosure of friends’ email addresses when college students are incentivized with free pizza. Yet, with 5% their baseline is much lower than ours with 23.6%. In a related survey experiment, Marreiros et al. (Reference Marreiros, Tonin, Vlassopoulos and Schraefel2017) find that privacy salience interventions decrease disclosure of name and email address by 20–30% when participants are informed that the study is about online privacy.
Further outcomes: types of changes
There may be different types of profile changes masked by the main outcomes. For one thing, users may react differently to treatments depending on how privacy-sensitive they perceive the profile categories. Therefore, we study treatment effects both on the intensive and extensive margins with regard to sharing of sensitive and insensitive personal information, respectively. For another, the intervention may induce changes in different directions. Hence, we analyze the effect on profile extensions, profile reductions, and updates of profile entries separately.
First, not all personal data are equally sensitive. Therefore, treatment-blind raters assessed the profile categories by their privacy sensitivity as sensitive and insensitive categories.Footnote 31 On the extensive margin, that is, with respect to having any sensitive entry in the profile, we observe a significant increase of 2.3 percentage points in the treatment groups relative to the control group. This means that users in the Public Benefit and Public Benefit + Privacy treatment groups are 12% more likely to have at least one sensitive entry than users in the Control group (Table 4). For insensitive entries, there is no such difference. This means that the Control message performs similarly well in motivating users to provide insensitive profile information as the Public Benefit and Public Benefit + Privacy messages. In contrast, the messages in the Public Benefit and Public Benefit + Privacy treatments induce more users to contribute sensitive information than in the Control group. Hence, while overall there was no effect at the extensive margin, increasing the salience of the public benefit of contributing data does have a positive effect as hypothesized for sensitive information.
OLS regression results disaggregated by the sensitivity of entry.
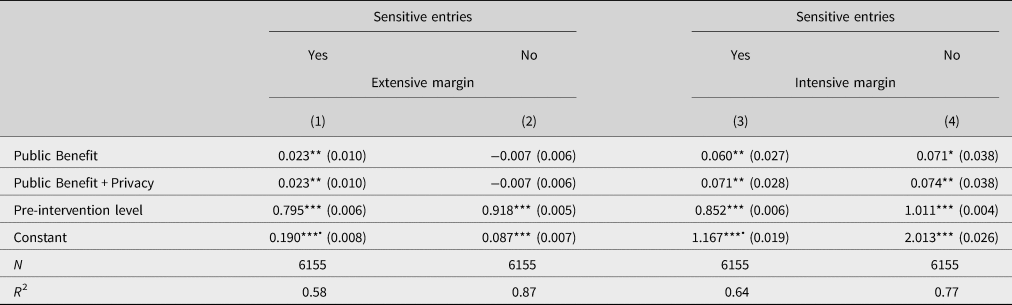
Notes: The table reports OLS regression results on the extensive (columns 1 and 2) and the intensive margin (columns 3 and 4). Robust standard errors are given in parentheses. The ‘Pre-intervention level’ corresponds to ‘Entries pre’ for the intensive margin, that is, the number of completed entries classified, and to ‘At least one entry’ for the extensive margin. All ‘Entries pre’ are transformed to a mean of zero. This way the constant can be interpreted as the effect observed in the Control group. We highlight these coefficients with a • symbol. Supplementary Table A.1 confirms all results including control variables.
*p < 0.10, **p < 0.05, ***p < 0.01.
We also find significant increases at the intensive margin, both for insensitive and sensitive profile categories in the Public Benefit and Public Benefit + Privacy treatments compared to Control (columns 3 and 4 of Table 4). While point estimates for Public Benefit and Public Benefit + Privacy look similar (p = 0.682 and p = 0.937, respectively), the effect sizes for sensitive and insensitive entries differ in magnitude because of different baseline levels. In particular, there are 5.1% and 6.1% more sensitive entries in Public Benefit and Public Benefit + Privacy than for the mean user in Control after the intervention. The treatments effects for insensitive categories amount to 3.5% and 3.7%.Footnote 32 This suggests that making the public benefit, especially if combined with reference to privacy protection, more salient increases the willingness to share especially sensitive personal information at the intensive margin. Overall, we find strong evidence for Hypothesis 1, that enlarging the perceived circle of beneficiaries increases contribution levels both on the extensive and intensive margins for sensitive profile categories.
Second, our results are driven by profile extensions. As Table 5 shows, the intervention triggered mostly profile extensions (column 1) but nearly no deletions (column 2) or updates (column 3). This is reassuring because our Public Benefit + Privacy could have also increased the awareness of a privacy risk and led users to delete their existing entries. Yet, the treatment indicators in the regression on deletions in column 2 are close to zero and insignificant, and the constant – capturing the change in the control group – is small in magnitude. This means that our intervention does not reduce the available data stock. In contrast, the point estimates in column 1 look very similar to those on the intensive margin in the main analysis (Table 3, column 3). Hence, the interventions only triggered changes in inline with the directions of Hypotheses 1 and 2 (see the ‘Hypotheses and experimental design’ section) and did not have any unintended consequences.
OLS regression results for type of changes by treatment.
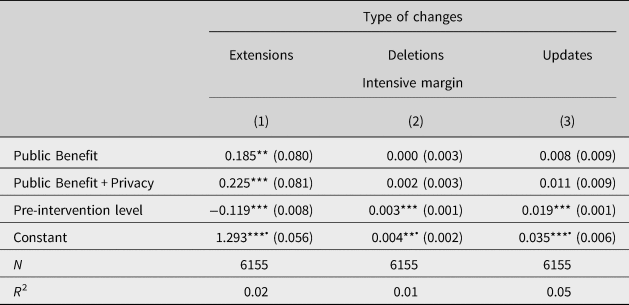
Notes: The table reports OLS regression results on the intensive margin disaggregating by types of changes. Robust standard errors are given in parentheses. The ‘Pre-intervention level’ corresponds to ‘Entries pre’ for the intensive margin, that is, the number of completed entries, and to ‘At least one entry’ for the extensive margin. The constant can be interpreted as the effect observed in the Control group. We highlight these coefficients with a • symbol.
*p < 0.10, **p < 0.05, ***p < 0.01. Supplementary Table A.1 confirms this result including control variables.
Shifts in the distribution of personal characteristics
As we highlight throughout, personal data differ from monetary contributions because they are individual-specific. Hence, depending on who contributes, the diversity in the data stock may differ. Therefore, in this section, we evaluate whether our intervention on the online education platform not only creates a larger but also a more diverse data stock thereby elevating potentially selective reporting of characteristics. For this, we check whether the post-intervention user characteristics are more diverse than those prior to the intervention. Therefore, we now study the distribution of user characteristics before and after the intervention.
For all profile categories, the distributions of pre- and post-intervention personal data content differ.Footnote 33 We quantify these distributional shifts via marginal effects from multinominal logit regressions. We exploit the panel structure of our data and introduce an individual dummy variable indicator for the post-intervention period. This indicator captures the shift in the distribution of personal characteristics before and after the intervention. The results are reported in Table 6 for each treatment group separately; marginal effects for the pooled sample can be found in Supplementary Table A.5 along with graphs depicting the shifts in reported characteristics from before to after the intervention (Figure A.3).
Post-intervention shifts in reported characteristics (by treatment).
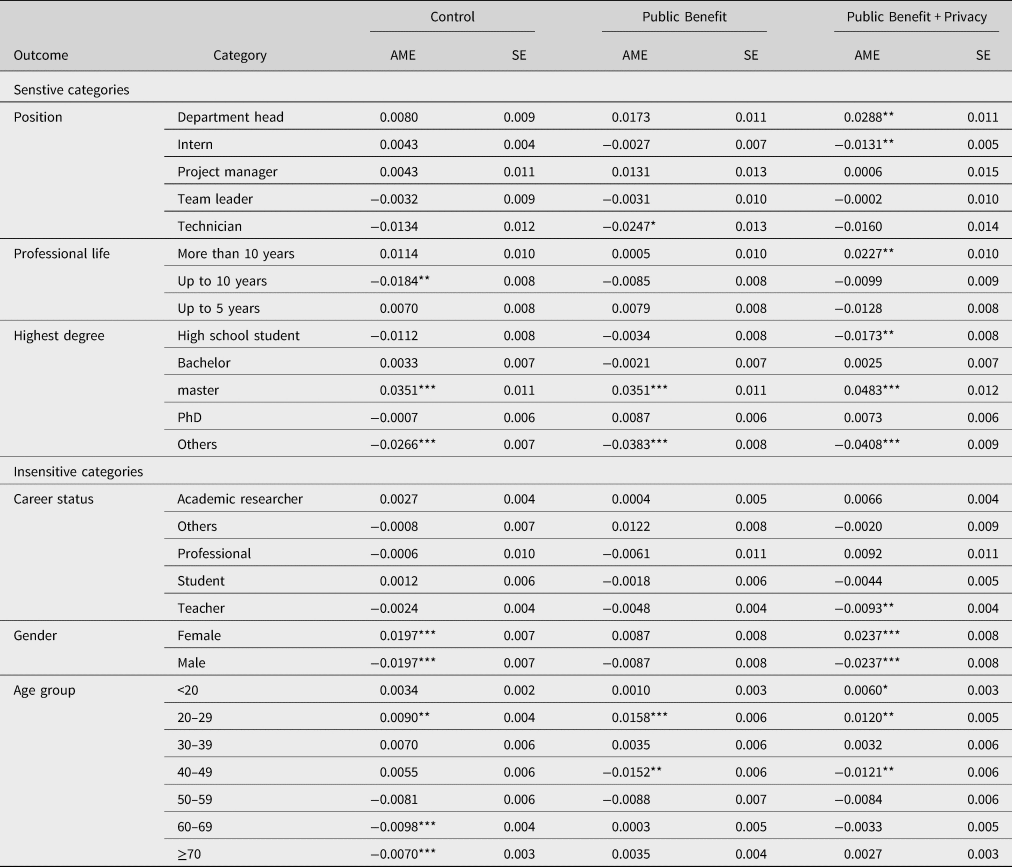
Notes: The table reports average marginal effects from multinominal logit regressions for each profile category on an indicator for the post-intervention period. We combined the more traditional degrees ‘Magister’ and ‘Diplom’ with ‘Master’ because they belong to the same International Standard Classification of Education level. Standard errors are clustered on the user level.
*p < 0.10, **p < 0.05, ***p < 0.01.
For work-related characteristics, we see more senior users disclosing information, particularly in the Public Benefit + Privacy treatment. For example, for job position, we see a 2.9 percentage point increase in users indicating that they are department heads in the Public Benefit + Privacy treatment and shifts away from interns and technicians in this treatment. Moreover, the post-intervention distribution includes more users indicating more than 10 years of work experience rather than between 5 and 10 years compared to the pre-intervention distribution. After the intervention, there tend to be relatively fewer users who report teaching as their profession but more researchers, professionals, or other careers. This effect is again driven by significant distributional shifts in the Public Benefit + Privacy treatment.
Focusing on demographics, we observe shifts that point to a more diverse user group than the pre-intervention data suggest. We find a disproportionately strong increase in users reporting a Master-level degree as their highest educational degree. This post-intervention increase is significant in all treatments but particularly pronounced in Public Benefit + Privacy with 4.8 percentage points. The shift goes along with a significant decrease in users reporting a ‘other’ as an educational degree in all treatments, and additionally with significant decreases in users indicating being in high school in the Public Benefit + Privacy treatment. Moreover, after the intervention, a higher share of users indicates being female. With an increase of 2.4 percentage points, the shift is most pronounced in the Public Benefit + Privacy treatment. Furthermore, we observe more younger users in our sample. Both the shares of users younger than 20 years and that of users in their twenties increase significantly after the intervention, mostly at the expense of users between 40 and 49 years.
For the new profile categories, which elicit motivation for taking courses on the platform and computer proficiency, we see large overall increases in the available information because very few participants had provided this information prior to the intervention. While we find significant shifts in the content for both new categories, we refrain from interpreting these shifts due to the limited number of entries before the intervention. Rather, it is worth noting that most users report a professional motivation (66%) and high or intermediate level of expertise in computer usage (50% and 45%).
Overall, this analysis results in three observations for shifts in the post-intervention distribution of user characteristics: First, shifts are in the same direction for all three groups. Second, they are most pronounced in the Public Benefit + Privacy treatment group. Third, most shifts in the distribution affect sensitive profile categories. This means that the Public Benefit + Privacy treatment not only increases the amount of data available the most, but is also most effective in generating more diverse personal information donations. Thus, adding an emphasis on privacy-protecting may result in a more adequate estimate of the overall user population. Knowing about this diverse user population, the public good provider may better tailor its services to fit the needs of all users. In the context of online education, this means, for instance, course communication could use gender-specific pronouns, performance dashboards and on-boarding of first-time users could be adapted depending on users’ motivation.
Conclusion
In this article, we study how to increase personal data donations to a public good. In a digitized world, such data increasingly serve as inputs to public goods, but – as other types of public good contributions – are likely to be underprovided. However, personal data as contributions face two additional challenges. First, in contrast to money and effort, personal data are individual-specific because each person has different individual characteristics. Therefore, it matters that a diverse range of individuals contribute and not only that a large total amount of contributions is raised. Second, in contrast to other individual-specific contributions like feedback or knowledge, personal data are also privacy-sensitive, which may further bias who contributes. Not respecting these particularities of personal data may lead to biased inputs into algorithms. Hence, it is welfare-enhancing to have a large and representative database as inputs such that the public good provider can accommodate all of its users’ needs.
So far it is not clear whether behavioral interventions that have proven effective for other types of contributions to public goods (Frey & Meier, Reference Frey and Meier2004; Ling et al., Reference Ling, Beenen, Ludford, Wang, Chang, Li, Cosley, Frankowski, Terveen, Rashid, Resnick and Kraut2005; Andreoni, Reference Andreoni2007; Shang & Croson, Reference Shang and Croson2009; Chen et al., Reference Chen, Maxwell Harper, Konstan and Li2010, Reference Chen, Farzan, Kraut, YeckehZaare and Zhang2020; Krupka & Croson, Reference Krupka and Croson2015) translate to personal data. In a field experiment on one of Germany's largest online education platforms, we show that a classical remedy in the sphere of public goods funding – emphasis on a large circle of beneficiaries (Andreoni, Reference Andreoni2007; Zhang & Zhu, Reference Zhang and Zhu2011) – also significantly increases users’ willingness to contribute personal data. Furthermore, we find that the effects of such interventions can be even more pronounced if privacy concerns are additionally accounted for.
Specifically, we find that emphasizing the public benefit of contributing significantly increases personal data contributions. This effect appears more pronounced if privacy protection is made salient in addition to the pure public benefit, potentially by reducing perceived privacy costs. On the extensive margin, our estimates across all profile categories are imprecisely estimated. However, for more privacy-sensitive categories, we observe significantly more treated users completing at least one entry than control group users. This means making the beneficiary circle and the actual privacy costs salient tends to trigger more disclosure of sensitive information. Furthermore, we find that the distribution of user characteristics after the intervention differs significantly from the pre-intervention distribution. This seems to be especially the case for sensitive characteristics when highlighting both public benefits and privacy protection. Hence, the Public Benefit + Privacy treatment not only enlarges but also diversifies the database the most.
While our study unravels new findings on how to increase personal data contributions to a public good, which we argue can be of interest to a more general setting, there are also limitations. First, we study a specific context, that is, online education courses focusing on information technology topics. Hence, our sample consisting of people interested in such topics may differ from the general public and the privacy concerns in our sample may not be representative. On the one hand, online course participants may be more knowledgeable about the usefulness of personal data than the general public, for example, how personal data coupled with data science methods can generate business insights. This means that our sample may be more concerned about privacy than the general public and may have already made very deliberate choices. If we find positive reactions to the salience of privacy protection even in this sample, effects for the general public may be even larger. On the other hand, participants in online courses related to information technology may be less concerned about privacy, for example, because they feel IT-savvy, in which case our sample would have been more nudgeable than the general public. While we are not aware of any study comparing privacy concerns of IT-interested people to the general public, according to a survey by Martin et al. (Reference Martin, Rice and Martin2016), IT professionals care about securing online privacy. Further research may test our privacy salience interventions with a sample that has a less pronounced interest in IT topics.
Second, the opportunity to increase personal data sharing by hinting to privacy protection hinges on the ability of a platform or institution to trustworthily signal privacy protection (Tang et al., Reference Tang, Hu and Smith2008; Castro & Bettencourt, Reference Castro and Bettencourt2017; Frik & Mittone, Reference Frik and Mittone2019). Without credible data protection in place, the salience of privacy may not increase sharing or may even backfire. Since we study personal data sharing in the context of public goods, we navigate in a context where privacy standards and compliance can be assumed to be very high. This does not only hold for our nonprofit online education platform but also for other public goods, for example, governmental COVID-19 tracing apps or other state-supported services. Our results may be less applicable to settings in which profit-oriented firms try to signal privacy in order to increase their own benefit or to nonprofit organizations which cannot guarantee privacy protection.
Granted these limitations, we see three general takeaways from our results. First, they suggest that the size of beneficiaries positively influences the provision of personal data to a public good similarly to what has been shown in more classical public goods settings (Ledyard, Reference Ledyard, Kagel and Roth1995; Goeree et al., Reference Goeree, Holt and Laury2002; Ling et al., Reference Ling, Beenen, Ludford, Wang, Chang, Li, Cosley, Frankowski, Terveen, Rashid, Resnick and Kraut2005; Andreoni, Reference Andreoni2007; Zhang & Zhu Reference Zhang and Zhu2011; Diederich et al., Reference Diederich, Goeschl and Waichman2016; Wang & Zudenkova, Reference Wang and Zudenkova2016; Chen et al., Reference Chen, Farzan, Kraut, YeckehZaare and Zhang2020). This means that in the context of a public good that uses personal data as inputs, a simple and inexpensive pop-up message making the public benefit of personal information provision salient can be very effective. This extends prior evidence by Chen et al. (Reference Chen, Farzan, Kraut, YeckehZaare and Zhang2020) to personal data as a new type of contribution.
Second, our results imply that the privacy sensitivity of personal data needs to be taken into account when tackling the underprovision of public goods most effectively. In the treatment, in which we do not only make the public benefit more salient but also the high personal data protection standards, we consistently find the strongest effects compared to the control group. This finding is in contrast to laboratory findings by Marreiros et al. (Reference Marreiros, Tonin, Vlassopoulos and Schraefel2017) but in line with evidence from illusory privacy protection on Facebook (Tucker, Reference Tucker2014) and evidence by Benndorf et al. (Reference Benndorf, Kübler and Normann2015) and Ackfeld and Güth (Reference Ackfeld and Güth2019) that privacy concerns influence personal data sharing in competitive settings. This means that emphasizing privacy protection seems to indeed positively influence personal data sharing for the greater good.
Third, we conclude that reference to public benefits, especially in combination with privacy protection, not only increases available information but also attracts information from a more diverse set of public good contributors. The more diverse and representative this information is, the better the quality of a public good can be. In the online education context we study, a broader database means higher quality inputs to algorithms that help make the learning platform adapt to learners. For example, such algorithms can tailor the educational experience to the individual's learning goals or it can target services such as planning prompts to learners for whom they actually can increase certification rates (Andor et al., Reference Andor, Fels, Renz and Rzepka2018). Yet, the usefulness of a broad database goes beyond the online education context. More personal data contributions capturing more diversity can be welfare-enhancing because they allow to train unbiased algorithms and offer public services that fit all users’ needs. For instance, the recent COVID-19 pandemic shows that tracing apps can only live up to expectations when many participate truthfully in personal data sharing. Furthermore, a broad database on socio-demographic characteristics – like the profile data we study – can help explain the results of abstract machine learning algorithms and uncover potential inherent biases. Hence, a broader database can contribute to fair and interpretable machine learning in the online education context (Conati et al., Reference Conati, Porayska-Pomsta and Mavrikis2018; Kizilcec & Lee, Reference Kizilcec, Lee, Holmes and Porayska-Pomstaforthcoming) and beyond.
Supplementary material
To view supplementary material for this article, please visit https://doi.org/10.1017/bpp.2021.39.
Acknowledgements
We thank the Hasso Plattner Institute, especially Jan Renz and Christian Willems, for their cooperation. Ackfeld acknowledges funding by the Joachim Herz Foundation via an Add-On Fellowship for Interdisciplinary Economics and by the European Research Council (ERC) under the European Union's Horizon 2020 research and innovation program (grant agreement No. 741409 – EEC). This project was preregistered at the AEA RCT registry, reference number AEARCTR-0004604, and received ethics approval by the WiSo Ethics Review Board at the University of Cologne, reference number 19023VA. We thank Lisa Bruttel, Marco Caliendo, Matthias Heinz, Lukas Kiessling, Christoph Meinel, Axel Ockenfels, Christoph Schottmüller, Stefan Tübbicke, and participants of Potsdam Research Seminar for Economics for helpful comments. We are also thankful for research assistance by Peter Achmus. All views are the authors’ own.


 Open access