


An increase in overweight and obesity among the Mexican population was described by Rivera et al.( Reference Rivera, Barquera and Campirano 1 ). The National Health and Nutrition Survey carried out in 2006 (ENSANUT-2006) documented that >70 % of females and 67 % of males aged >20 years were overweight or obese (≥25·0 kg/m2)( Reference Rojas, Aguilar-Salinas and Jiménez-Corona 2 , Reference Olaiz, Rivera and Shamah 3 ). Comparing previous National Nutrition Surveys, the prevalence of overweight and obesity increased from 34·8 % in 1988 to 61·0 % in 1999 and to 69·3 % in 2006( Reference Rivera and Sepulveda Amor 4 ). ENSANUT-2006 showed that 36·8 % of the adult Mexican population (42·2 % of females and 30·3 % of males) had metabolic syndrome according to the cut-off points of the National Cholesterol Education Program Adult Treatment Panel III( Reference Rojas, Aguilar-Salinas and Jiménez-Corona 2 ). A concurrent increase in fat intake among the population in all regions of the country was reported as well as an increase in the purchase of refined sugars and carbohydrates( Reference Rivera, Barquera and Campirano 1 ). However, this increase differed among regions and between urban and rural areas; fat, cholesterol and saturated fat intakes were higher in northern Mexico compared with the other regions as well as in urban localities compared with rural locations( Reference Barquera, Campos and Hernández-Barrera 5 ). In addition, nutrient deficiencies still remain among the Mexican population( Reference Rivera and Sepulveda Amor 4 ). The Second Mexican National Nutrition Survey carried out in 1999 reported that the prevalence of Fe deficiency assessed by serum transferrin saturation among non-pregnant women aged 12–49 years was 40·5 % and that 20 % of the same population presented anaemia( Reference Rivera and Sepulveda Amor 4 ). Moreover, overlap of excess and deficiency in food intake exists. A prevalence of 6·2 % has previously been reported for maternal central adiposity along with childhood stunting in Mexico( Reference Barquera, Peterson and Must 6 ). This phenomenon reflects a process of nutritional transition with a polarization in different geographic areas and the coexistence of malnutrition in the country.
The relationship between dietary quality and health outcomes has been well documented in populations from 6 months to 99 years of age( Reference Lifshitz 7 – Reference Rizzo, Sabaté and Jaceldo-Siegl 9 ). Food-based dietary guidelines have been developed to promote healthier eating patterns among the population( 10 ). Nutrient requirements and dietary recommendations as well as food guidelines are also useful approaches to assess dietary quality( Reference Waijers, Feskens and Ocké 11 , Reference Fransen and Ocké 12 ). Dietary indices based on nutrients( Reference Krebs-Smith and Clark 13 ), foods( Reference Kennedy, Pedro and Seghieri 14 ) and nutrients and foods( Reference Kennedy, Ohls and Carlson 15 ) have been developed to evaluate dietary quality. Dietary quality can be assessed by compliance to dietary guidelines such as those established by the WHO for the prevention of chronic diseases( 16 , Reference Mazzocchi, Brasili and Sandri 17 ). Dietary quality indices have been used to evaluate and compare dietary quality at national( Reference Kennedy, Ohls and Carlson 15 ) and international levels( Reference Mazzocchi, Brasili and Sandri 17 ). Furthermore, dietary diversity and dietary variety have been used to reflect dietary quality because these measures are positively related to nutrient adequacy( Reference Foote, Murphy and Wilkens 18 , Reference Ruel 19 ). Sociodemographic characteristics are also related to food consumption and probably to dietary quality as well( Reference Adda, Chandola and Michael 20 ).
The alarming increase in excess weight among the adult Mexican population with its risk of CVD coexisting with micronutrient deficiencies evidences that diverse aspects of the Mexican diet have been modified during the last 20–30 years. Accordingly, an adequate dietary quality evaluation should focus on several dietary characteristics, not only on energy or micronutrient density( Reference Wirt and Collins 21 ). Such an evaluation would identify a health-related lack or surplus of food and nutrients. Those findings may be incorporated into current dietary guidelines. A shift from nutrient deficiency towards dietary excess has been observed.
Countries undergoing the nutrition transition present problems of dietary deficiency and excess; thus, it is not useful to examine only a single factor related to disease aetiology, but instead multiple risk factors that are sensitive to under- and overnutrition. In addition, dietary quality indices are a useful tool to quantify the risk of some health outcomes, biomarkers of diseases and risk of chronic diseases. Thus, our objectives in the present study were to observe the dietary quality of Mexican adults using indices sensitive to under- or overnutrition and to compare our results according to region, socio-economic status and BMI categories using three different indices: (i) a cardioprotective index (CPI); (ii) a micronutrient adequacy index (MAI); and (iii) a dietary diversity index (DDI).
Materials and methods
Participants and study design
For the present study we used information from ENSANUT-2006( Reference Olaiz, Rivera and Shamah 3 ), a survey that was conducted from October 2005 to May 2006 in 48 304 households from the thirty-two states of Mexico. ENSANUT-2006 is a cross-sectional study with a multistage, probabilistic sample design. The survey is nationally representative because it includes all states within the country as well as urban and rural areas. The objective of the survey was to characterize the health and nutritional status of the Mexican population in all age groups. Methodological details of the survey may be found in a previous publication( Reference Olaiz, Rivera and Shamah 3 ). The analysis of the current paper includes information on a probabilistic sub-sample of one-third of the adult population (19–59 years old) in which dietary information was collected (n 16 426). This sub-sample is also representative for the country, for urban and rural strata and at the state level.
Informed consent was obtained from participating adults. The survey protocol was approved by the Ethics, Biosecurity and Research Committees of the National Institute of Public Health (NIPH), Mexico, the institute responsible for the survey.
Data collection
Dietary information
Dietary intake data were obtained using a 7 d semiquantitative FFQ. The FFQ includes 101 different foods and beverages classified into fourteen different groups. For each food, intake according to number of days in the week, times each day, portion size and number of portions consumed was queried during the 7 d prior to the interview( Reference Rodríguez-Ramírez, Mundo-Rosas and Jiménez-Aguilar 22 ). Nutrient intakes were computed using a food composition compilation developed by the NIPH( Reference Safdie, Barquera and Porcayo 23 ). Individuals with abnormal nutrient intake values were excluded from this analysis (n 543). A detailed description of dietary data collection can be found elsewhere( Reference Rodríguez-Ramírez, Mundo-Rosas and Jiménez-Aguilar 22 ).
Nutritional status
Weight and height were measured by Lohman techniques( Reference Lohman, Roche and Martorell 24 ). Field personnel were trained using the methodology proposed by Habicht( Reference Habicht 25 ). Body weight was measured using a Tanita weight scale with a precision of 100 g that was calibrated daily. Height was measured using a stadiometer (Dynatop) with a precision of 1 mm. BMI (kg/m2) was computed using weight and height measurements. We evaluated nutritional status using BMI cut-off points defined by WHO as follows: BMI ≤24·9 kg/m2 as normal, BMI = 25·0–29·9 kg/m2 as overweight and BMI ≥30·0 kg/m2 as obese( 26 ).
Sociodemographic characteristics
Region. The country was divided into four regions: (i) North (Baja California Norte and Sur, Coahuila, Chihuahua, Durango, Nuevo León, Sonora and Tamaulipas); (ii) Central (Aguascalientes, Colima, Estado de México, Guanajuato, Jalisco, Michoacán, Morelos, Nayarit, Querétaro, San Luis Potosí, Sinaloa and Zacatecas); (iii) metropolitan area of Mexico City; and (iv) South (Campeche, Chiapas, Guerrero, Hidalgo, Oaxaca, Puebla, Quintana Roo, Tabasco, Tlaxcala, Veracruz and Yucatán).
Residence area. A community with <2500 inhabitants was considered rural; otherwise it was classified as urban.
Socio-economic status. Information on household characteristics and possession of goods was used to construct an indicator of socio-economic status (SES) derived by the first component obtained through principal components analysis, which explained 46 % of the variance. This indicator was validated in the previous Mexican Nutrition Survey( Reference Resano-Pérez, Méndez-Ramírez and Shamah-Levy 27 ). The resulting standardized factor was divided into tertiles to categorize SES into low, middle and high groups.
Dietary quality indices
To evaluate dietary quality from the standpoint of compliance with dietary recommendations for the adult Mexican population, we used three indices of dietary quality which may point to the following health-related dietary dimensions: (i) potential for being cardioprotective, (ii) compliance with relevant micronutrients and (iii) diversity. For such analysis we developed pertinent dietary indices as follows.
Cardioprotective index
The CPI is based on seven WHO dietary guidelines for the prevention of CVD( 16 ). This index was used to evaluate the intake of a diet related to CVD. The CPI considers a recommended intake of protein ≥10 % of total energy (%TE), total fat ≤30 %TE, SFA ≤10 %TE, PUFA <10 %TE, cholesterol <300 mg/d, fibre ≥20 g/d, and a fruit and vegetable intake ≥400 g/d. For the construction of the index, 1 point was given if the individual complied with one of these dietary recommendations and 0 points otherwise. The maximum possible number of points was 7 and the minimum number was 0; the higher the CPI, the better the dietary quality from the standpoint of its cardioprotective effect.
Micronutrient adequacy index
This index was based on the Estimated Average Requirements from the US Institute of Medicine( 28 – 30 ). The index considers three minerals and three vitamins (Ca, Fe, Zn, folate, vitamin A and vitamin C) which were deficient in the population in the previous National Nutrition Survey 1999( Reference Rivera and Sepulveda Amor 4 ). The MAI evaluated a recommended adequacy intake of Ca ≥1000 mg/d; Fe ≥6·0 mg/d for males and ≥8·1 mg/d for females; Zn ≥9·4 mg/d for males and ≥6·8 mg/d for females; folate ≥320 μg/d; vitamin A (retinol equivalents) ≥625 μg/d for males and ≥500 μg/d for females; and vitamin C ≥75 mg/d for males and ≥60 mg/d for females. If the intake of the inidividual was at 100 % or above for one of these nutrients, 1 point was given (for a maximum of 6 points and a minimum of 0 points). However, if the micronutrient intake was below the recommendation, no points were given. A higher MAI indicates a better dietary quality from the standpoint of its micronutrient adequacy.
Dietary diversity index
Food group classification. We classified the 101 foods included in the FFQ into thirty different food groups (Table 1). Food groups were created according to their micronutrient content and to the cultural aspects of the Mexican diet.
Food groups used for dietary diversity

Dietary diversity. Dietary diversity was based on consumption of the thirty different food groups of ≥10 g/d in the 7 d prior to the interview as recorded in the FFQ. Dietary diversity refers to the number of different food groups consumed, as reported in the FFQ used in the survey( Reference Ruel 19 ). Dietary diversity was divided into quintiles to construct the DDI. Individuals consuming seven different food groups or less scored 1 (DDI-1), those consuming eight to ten different food groups scored 2 (DDI-2), consumption of eleven or twelve different food groups scored 3 (DDI-3), consumption of thirteen to fifteen different food groups scored 4 (DDI-4) and, finally, individuals consuming sixteen different food groups or more scored 5 (DDI-5). The maximum score for the DDI was 5 points and the minimum was 1 point.
Statistical analysis
Dietary quality indices are presented by geographic region, area of residence, SES tertile and nutritional status. Descriptive statistics included means with their standard errors adjusted by age and sex, as well as the proportions adjusted by age and sex of the studied population who complied with dietary recommendations of each index.
Adjusted means for the three dietary indices as well as differences between population subgroups were calculated through linear regression models. We used Bonferroni P adjustment for multiple comparisons when analysing differences within categories of each independent variable. Adjusted proportions of the population who complied with components of the dietary quality indices were calculated through logistic regression models and differences between regions, residence area, SES and BMI were analysed through the χ 2 test. Individuals with missing information (anthropometric or SES characteristics) were excluded from the analysis. Pearson's correlation coefficient was used to test the association between the diet quality indices; P < 0·05 was considered statistically significant, except when multiple comparisons were used.
The statistical software package Stata version 12 was used for statistical analyses. The SVY module in Stata was used to adjust analyses for the study design.
Results
Study sample characteristics
We analysed data for 16 494 adults aged between 19 and 59 years old. We excluded 205 pregnant or lactating women and 543 individuals with missing dietary information or implausible dietary intake data (because they presented intakes and adequacy percentages more than 5 sd above the mean (n 164) or energy intake <25 % of the mean (n 379)). We also excluded individuals without socio-economic (n 55) or anthropometric (n 16) information. The final sample size for analyses was 15 675 adults, representing 47 313 935 adults at the national level. We did not observe statistical differences for age and sex variables between the final study sample and the exclusion sample.
There were more females than males in the studied sample (59·8 % v. 40·2 %, respectively); 24·5 % of the sample was 19–29 years old, 33·8 % was 30–39 years old, 25·7 % was 40–49 years old and 16·1 % of the sample was 50–59 years old (data not shown). Table 2 summarizes sociodemographic and anthropometric characteristics of the studied population.
General characteristics of the populationFootnote *: Mexican adults aged 19–59 years, 2006 National Health and Nutrition Survey (ENSANUT-2006)
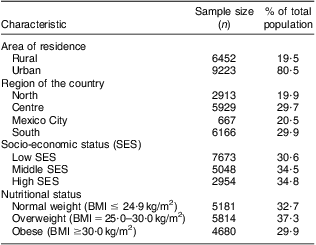
* Total sample size: 15 675; weighted cases: 47 313 935 Mexican adults.
Dietary quality indices
Calculated indices are presented in Table 3. Results showed that the CPI was significantly higher among rural participants than urban participants (4·5 (se 0·09) v. 4·3 (se 0·09); P < 0·05). Participants living in southern Mexico presented a significantly higher CPI (4·7 (se 0·06)) compared with participants in the other three regions (P < 0·05). The CPI significantly and progressively decreased (P < 0·05) from low SES (4·5 (se 0·08)) to middle SES (4·3 (se 0·08)) to high SES (4·2 (se 0·09)).
Mean dietary quality index scores of the populationFootnote * according to area of residence, geographic region and socio-economic status: Mexican adults aged 19–59 years, 2006 National Health and Nutrition Survey (ENSANUT-2006)
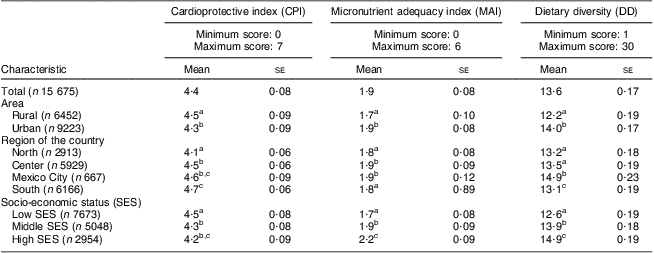
Values are means (with their standard errors) adjusted by age and sex through linear regression models.
* Total sample size: 15 675, weighted cases: 47 313 935 Mexican adults.
a,b,c Mean values within categories of each independent variable within a column with unlike superscript letters were significantly different using Bonferroni adjustment (P < 0·05 for area, P < 0·012 for region, P < 0·016 for SES.
Urban participants reported a significantly higher MAI compared with their rural counterparts (1·9 (se 0·08) v. 1·7 (se 0·10); P <0·05). Participants from central Mexico (1·9 (se 0·09)) and metropolitan Mexico City (1·9 (se 0·12)) reported a significantly higher MAI (P < 0·05) than those from northern Mexico (1·8 (se 0·08)) or southern Mexico (1·8 (se 0·89)). The MAI significantly and progressively increased (P < 0·05) with SES from the low SES (1·7 (se 0·08)) to the middle (1·9 (se 0·09)) and the high SES tertile (2·2 (se 0·09)).
Urban participants reported a significantly higher DDI than participants living in rural areas (14·0 (se 0·17) v. 12·2 (se 0·19); P < 0·05). Those living in Mexico City reported a more diversified diet (14·9 (se 0·23)) than those living in the other three regions (P < 0·05). The DDI significantly (P < 0·05) and progressively increased from the low (12·6 (se 0·19)) to the middle (13·9 (se 0·18)) and the high (14·9 (se 0·19)) SES category.
Daily compliance to components of the CPI is described in Fig. 1. Almost all components of the CPI were significantly better in rural than in urban participants, except for the recommended fruit and vegetable intake, which was significantly higher in urban than in rural adults (35·6 % v. 25·5 %; P < 0·05). The proportion of participants who attained the recommended intake was significantly better in rural areas than in urban ones with regard to total fat (81·2 % v. 65·1 %; P < 0·05), SFA (82·9 % v. 72·4 %; P < 0·05), cholesterol (81·9 % v. 75·6 %; P < 0·05) and fibre (59·5 % v. 50·7 %; P < 0·05).
Daily compliance with components of the cardioprotective index (CPI) according to area of residence ( , rural, n 6452;
  , urban, n 9223), geographic region (
 , North, n 2913;
  , Centre, n 5929;
  , Mexico City, n 667;
  , South, n 6166), socio-economic status (SES) tertile (
 , low SES, n 7673;
  , middle SES, n 5048;
  , high SES, n 2954) and nutritional status (
 , normal weight, n 5181;
  , overweight, n 5814;
  , obese, n 4680) among Mexican adults aged 19–59 years, 2006 National Health and Nutrition Survey (ENSANUT-2006). Values are proportions adjusted by age and sex through logistic regression models. a,b,cAdjusted proportions within categories of each independent variable with unlike superscript letters were significantly different (P < 0·05). WHO dietary guidelines for the prevention of CVD(
16
) are indicated below each plot (%TE, percentage of total energy; TC, total cholesterol; F&V, fruit and vegetables)
, obese, n 4680) among Mexican adults aged 19–59 years, 2006 National Health and Nutrition Survey (ENSANUT-2006). Values are proportions adjusted by age and sex through logistic regression models. a,b,cAdjusted proportions within categories of each independent variable with unlike superscript letters were significantly different (P < 0·05). WHO dietary guidelines for the prevention of CVD(
16
) are indicated below each plot (%TE, percentage of total energy; TC, total cholesterol; F&V, fruit and vegetables)
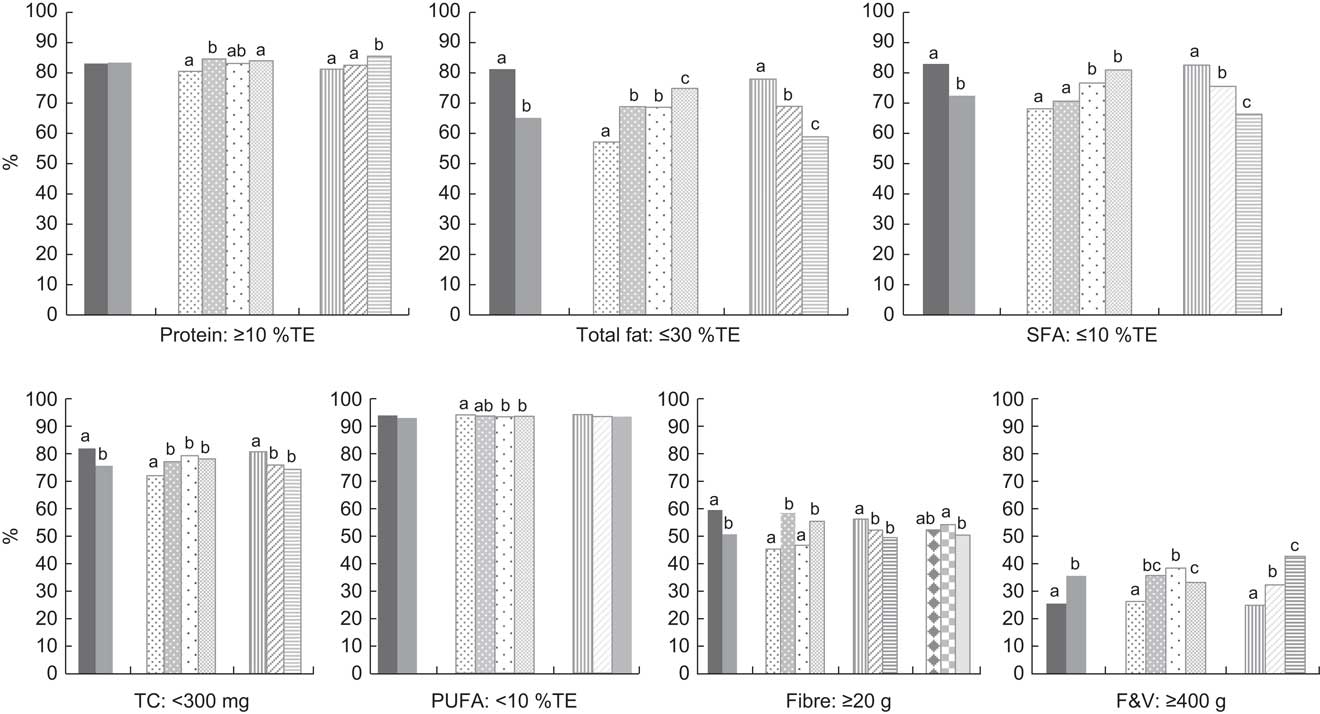
Protein (80·5 %), total fat (57·1 %), SFA (68·1 %), as well as the recommended intakes for cholesterol (72·0 %) and fruits and vegetables (26·3 %), demonstrated significantly lower compliance of participants living in northern Mexico compared with those living in the other regions of the country (P < 0·05). Participants from northern Mexico complied significantly better with the recommended intake of PUFA (93·8 %) than those from other regions of the country. The proportion of participants who complied with the recommended intake of fruits and vegetables significantly and progressively decreased from the high to the middle to the low SES category (42·7 %, 32·3 % and 24·9 %, respectively; P < 0·05). The same was observed with dietary intake of protein (85·5 %, 82·5 % and 81·2 %; P < 0·05). The proportion of participants who complied with the recommended intake of total fat (58·8 %, 68·9 % and 77·9 %), fibre (49·5 %, 52·2 % and 56·2 %) and SFA (66·3 %, 75·4 % and 82·5 %), as well as the recommended intake for cholesterol (74·3 %, 75·9 % and 80·7 %), significantly and progressively increased from the high to the middle to the low SES category (P < 0·05). There was no significant difference between the proportion of participants who complied with the cardioprotective indicators according to nutritional status except for the recommended intake of fibre, which was significantly higher among overweight compared with obese participants (54·2 % v. 50·4 %; P < 0·05).
Daily compliance to components of the MAI is summarized in Fig. 2. The proportion of participants living in urban areas, as compared with those living in rural areas, meeting the recommended intake of various micronutrients was significantly higher for: Zn (46·2 % v. 38·6 %; P < 0·05), folate (23·3 % v. 19·5 %; P < 0·05), vitamin A (13·0 % v. 8·1 %; P < 0·05) and vitamin C (19·9 v. 14·8 %; P < 0·05). There was a significantly (P < 0·05) lower proportion of participants living in the North as compared with other regions of the country who complied with the recommended intake of Ca. The proportion of participants who complied with the recommended folate intake was significantly lower for those living in the South (19·1 %; P < 0·05) as compared with the North (25·9 %), central Mexico (24·8 %) and Mexico City (20·9 %). The proportion of participants living in Mexico City who complied with the recommended intake of vitamin C (23·5 %) was significantly higher (P < 0·05) than the proportions of compliers living in other regions of the country. A significantly higher proportion of participants in the high SES category complied with the recommended intake of Ca (38·5 %) than participants from the middle (31·2 %) or low SES (31·4 %) category (P < 0·05). The proportion of participants who attained the recommended intake of Zn (38·0 %, 43·2 % and 52·1 %), vitamin A (7·6 %, 10·9 % and 17·1 %), Fe (74·7 %, 75·5 % and 78·8 %), folate (19·7 %, 23·7 % and 23·9 %) and vitamin C (13·9 %, 19·3 % and 23 %) significantly and progressively increased from low to middle to high SES (P < 0·05). A significantly lower proportion of obese participants complied with the recommended intake of Ca (29·4 %) compared with normal-weight (34·8 %) or overweight participants (36·5 %; P < 0·05). There was significantly better compliance with the recommended intakes of vitamin A and vitamin C by those who were obese (13·9 % and 20·9 %, respectively) than by normal-weight or overweight participants (P < 0·05).
Daily compliance with components of the micronutrient adequacy index (MAI) according to area of residence ( , rural, n 6452;
  , urban, n 9223), geographic region (
 , North, n 2913;
  , Centre, n 5929;
  , Mexico City, n 667;
  , South, n 6166), socio-economic status (SES) tertile (
 , low SES, n 7673;
  , middle SES, n 5048;
  , high SES, n 2954) and nutritional status (
 , normal weight, n 5181;
  , overweight, n 5814; inline-graphic xlink:type="simple" mime-subtype="gif" xlink:href="S1368980013002462_inline24"/>, obese, n 4680) among Mexican adults aged 19–59 years, 2006 National Health and Nutrition Survey (ENSANUT-2006). Values are proportions adjusted by age and sex through logistic regression models. a,b,cAdjusted proportions within categories of each independent variable with unlike superscript letters were significantly different (P < 0·05). Recommended micronutrient intakes(
28
–
30
) are indicated below each plot (RE, retinol equivalents)
, overweight, n 5814; inline-graphic xlink:type="simple" mime-subtype="gif" xlink:href="S1368980013002462_inline24"/>, obese, n 4680) among Mexican adults aged 19–59 years, 2006 National Health and Nutrition Survey (ENSANUT-2006). Values are proportions adjusted by age and sex through logistic regression models. a,b,cAdjusted proportions within categories of each independent variable with unlike superscript letters were significantly different (P < 0·05). Recommended micronutrient intakes(
28
–
30
) are indicated below each plot (RE, retinol equivalents)
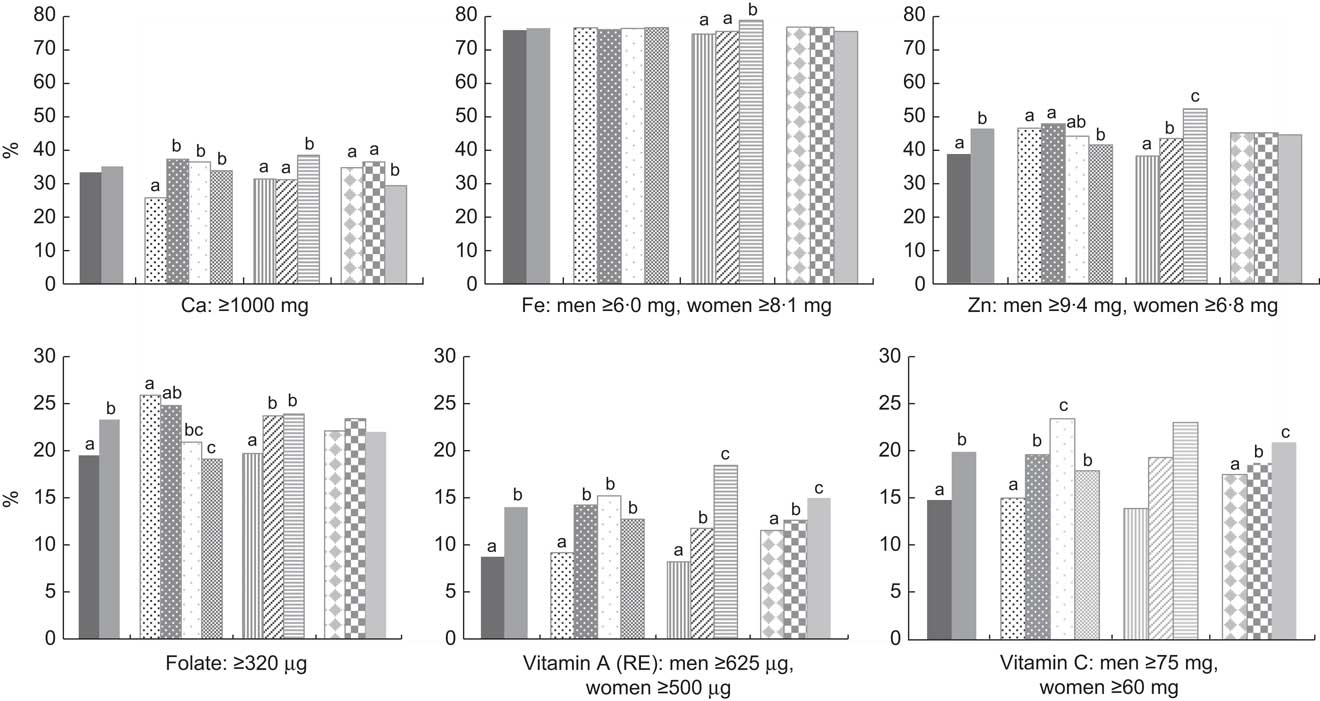
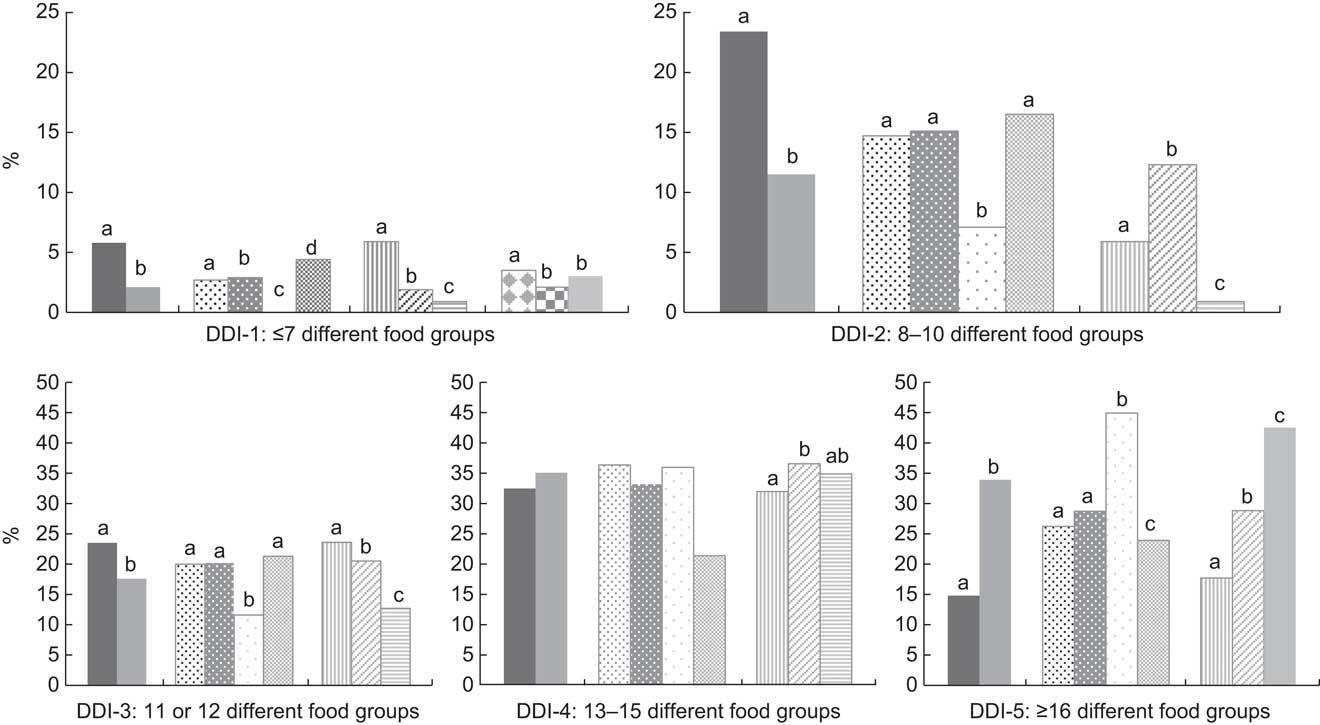
Figure 3 describes the proportion of participants in each quintile of the DDI. The proportion who reported a low DDI was significantly higher in rural than in urban participants (DDI-1: 5·8 % v. 2·1 %, DDI-2: % 23·4 v. 11·5 %, DDI-3: 23·5 % v. 17·6 %; P < 0·05). The proportion of participants who consumed seven different foods groups or fewer (DDI-1) was significantly higher in those living in southern Mexico (4·4 %) compared with the other three regions of the country (P < 0·05). The proportion with a high DDI was significantly higher among those living in Mexico City (DDI-5: 44·9 %) compared with other regions of the country (P < 0·05). The proportion of participants reporting a low DDI was significantly higher in the low SES (DDI-1: 5·9 %, DDI-3: 23·6 %) compared with the other SES categories (P < 0·05). The proportion of participants with a high DDI was significantly higher (P < 0·05) among those of high SES (DDI-5: 42·5 %) compared with those of low SES (DDI-5: 17·7 %) or middle SES (DDI-5: 28·8 %).
Daily dietary diversity based on the consumption of thirty different food groups comprising the dietary diversity index (DDI) according to area of residence ( , rural, n 6452;
  , urban, n 9223), geographic region (
 , North, n 2913;
  , Centre, n 5929;
  , Mexico City, n 667;
  , South, n 6166), socio-economic status (SES) tertile (
 , low SES, n 7673;
  , middle SES, n 5048;
  , high SES, n 2954) and nutritional status (
 , normal weight, n 5181;
  , overweight, n 5814;
  , obese, n 4680) among Mexican adults aged 19–59 years, 2006 National Health and Nutrition Survey (ENSANUT-2006). Values are proportions adjusted by age and sex through logistic regression models. a,b,cAdjusted proportions within categories of each independent variable with unlike superscript letters were significantly different (P < 0·05). The number of food groups consumed for each DDI score (DDI-1 to DDI-5) are are indicated below each plot
Correlation coefficients between the indices were as follows: DDI with MAI (r = 0·435, P < 0·001); DDI with CPI (r = 0·106, P < 0·001); and CPI with MAI (r = 0·258, P < 0·001).
Discussion
In the present study we evaluated three dietary quality indices among the adult Mexican population according to sociodemographic and nutritional characteristics. To the best of our knowledge, ours is the first study evaluating adult dietary quality by adherence to the WHO dietary recommendations in a nationally representative survey of the Mexican population. We identified those nutrients that are deficient or excessive and studied them according to sociodemographic and nutritional characteristics of the Mexican adult population.
Our indices suggest that Mexico actually presents a double burden of malnutrition – excess and deficiency – in some segments of the population and that nutrient policies must be adapted to these nutritional problems.
We observed that participants living in the north of the country complied least with the fruit and vegetable intake recommendation. These findings are in concordance with those of Ramirez et al. (2009) from the same population. These authors reported that persons living in northern Mexico had the lowest intake of fruit and vegetables in the country( Reference Ramírez-Silva, Rivera and Ponce 31 ). In our study we observed that rural inhabitants had the highest compliance with recommendations for the CPI, except for the consumption of fruit and vegetables. It has been documented that the urban diet is more diversified and higher in animal products and vegetables as compared with the rural diet( Reference Delisle 32 ). In the present study, <35 % of Mexican adults consumed the recommended intake of fruit and vegetables. Mexico is one of the countries with the lowest consumption of fruit and vegetables worldwide( Reference Lock, Pomerleau and Causer 33 ).
In our study we observed that participants in the higher SES category barely reached the recommendations for components of the CPI; however, they complied best with the recommended intake of fruit and vegetables, suggesting that their accessibility to fruit and vegetables is better, as other authors have reported( Reference Subar, Heimendinger and Patterson 34 , Reference Ball, Crawford and Mishra 35 ). Our results showed that rural residents, those from southern Mexico and those in the lowest SES tertile consumed a diet with a higher CPI compared with their counterparts: urban residents, those from North, Central and Mexico City, and those from middle and high SES tertiles. Urban residents and participants in the highest SES tertile reported a significantly more diversified and micronutrient-adequate diet than rural residents or participants in the lowest SES tertile. Previous reviews document a strong relationship between dietary diversity and socio-economic characteristics( Reference Hatloy, Hallund and Diarra 36 – Reference Ruel 38 ). Hatloy et al. (2000) documented that socio-economic factors are important determinants for dietary diversity in urban and rural areas( Reference Hatloy, Hallund and Diarra 36 ). It has been reported that dietary diversity increases as income increases( Reference Ruel 38 ). Hoddinott and Yohannes (2002) showed that household dietary diversity increases with household food per capita consumption in Bangladesh, Egypt, Ghana, India, Kenya, Malawi, Mali, Mexico, Mozambique and the Philippines( Reference Hoddinot and Yohannes 37 ).
In the present study we found that participants from northern Mexico had the lowest CPI. This region is the most industrialized in the country and exposure to a diet rich in fat and total sugar is higher. Our results are consistent with those found by Barquera et al. (2009), who reported that individuals from the north of the country and urban settings had higher intakes of total and saturated fat as well as cholesterol( Reference Barquera, Hernández-Barrera and Campos-Nonato 39 ). In our study we showed that rural participants presented a more cardioprotective diet compared with urban participants. It has been documented that urban settings lead to an atherogenic diet among Africans( Reference Sodjinou, Agueh and Fayomi 40 ) and Mexicans( Reference Ponce, Ramirez and Delisle 41 ). A previous study carried out in Mexico reported that urban inhabitants had a higher prevalence of hypercholesterolaemia and hypertriacylglycerolaemia than rural inhabitants( Reference Aguilar-Salinas, Gómez-Pérez and Rull 42 ). The CPI includes nutrients and foods associated with chronic non-communicable diseases (NCD) such as diabetes mellitus and hypertension, which represent the leading cause of mortality. Thus, it is important to take into account CPI components when establishing policies.
The present study also showed that participants from rural areas and of low SES had the lowest compliance with the recommendations of the MAI. It has been proposed that rural settings have a traditional plant-based diet( Reference Solomons 43 ), which is related to a lower risk of developing CVD( Reference Hu 44 ). Even when our urban participants reported a more diversified diet and, as a consequence, higher micronutrient adequacy, they also presented a diet that stimulates the development of CVD. This confirms our previous results among the Mexican population, where a more diversified diet was significantly associated with a more atherogenic diet( Reference Ponce, Ramirez and Delisle 41 ).
We observed that a significantly higher proportion of overweight or obese participants reached the recommended intakes of fibre and vitamins A and C than normal-weight participants. In order to elucidate these results, we compared the intake of these nutrients per 4184 kJ (1000 kcal) and observed that fibre (13·2 v. 13·0 g/4184 kJ; P < 0·05), vitamin A (299·2 v. 275·7 μg/4184 kJ; P < 0·05) and vitamin C (59·8 v. 54·5 mg/4184 kJ; P < 0·05) were significantly higher in overweight and obese than in normal-weight participants (data not shown). Earlier studies have reported that overweight or obese individuals estimate lower intake of energy-dense foods and higher intake of fruit and vegetables; thus, energy intake is under-reported by the overweight or obese( Reference Mendez, Wynter and Wilks 45 , Reference Millen, Tooze and Subar 46 ).
Not all indices offer independent information on the dietary consumption of the population or its risk of developing diseases. As expected, dietary diversity and micronutrient adequacy were positively correlated (r = 0·435, P < 0·001), indicating that a diverse diet is accompanied by an increase, albeit partially, in micronutrient density, which is in concordance with other studies( Reference Kennedy, Pedro and Seghieri 14 , Reference Arsenault, Yakes and Islam 47 , Reference Arimond, Wiesmann and Becquey 48 ). However, the cardioprotective quality of a diet in the adult Mexican population is independent of its nutrient density or diversity. This shows that a Mexican diet may be adequate in one health-related dimension but not in others, and emphasizes the notion that a multidimensional evaluation must be considered when assessing dietary adequacy of a population. The latter has been reported in a previous study( Reference Ponce, Ramirez and Delisle 41 ).
The present study has some limitations. First, the period for data collection does not include nutrient intake from the entire year; however, the period for data collection extended from October 2005 to May 2006 and may have included some of the seasonal availability of fruits and vegetables.
Second, we assessed total Fe consumption without differentiation of haem from non-haem Fe. Bioavailability of non-haem Fe depends on the presence of other dietary components consumed during the same day. We cannot estimate the bioavailability of intake of dietary Fe from our population with the available data. Furthermore, there are no specific dietary recommendations for haem Fe. Thus, total Fe consumption is an ambiguous indicator of Fe intake that may under- or overestimate adequacy of true dietary Fe availability.
Because the study was cross-sectional and observational, causality cannot be determined. However, because of the representative sample of the Mexican population we can identify those recommendations that should be improved in dietary guidelines.
We did not assess Na intake because the FFQ is not an adequate method for its estimation( Reference Sarno 49 ); the same for free sugars. The components n-3 and n-6 fatty acids, trans-fatty acids and free sugars were not included in the CPI due to lack of information on local food composition at the time of data analysis. There is no specific recommendation for MUFA; thus, this was not measured. Therefore we did not include all WHO dietary recommendations for the prevention of CVD. Dietary diversity is defined as the number of different food groups consumed during a reference period( Reference Ruel 19 ). However, our DDS does not allow us to distinguish healthy food groups such as whole grains from unhealthy food groups such as highly energy-dense foods. Therefore, we may be underestimating the at-risk population.
The lack of validation of our indices is also a shortcoming of our study; however, as we previously noted, the objective of our study was to observe the adult Mexican diet from the standpoint of dietary quality. We are aware that the ideal dietary index is that which is developed in relation to nutritional profiles or health indicators. Otherwise, its validity to infer dietary risk or protection is compromised.
However, there is a vast body of literature showing that some dietary characteristics offer unequivocal risk or protection against certain health conditions. Such is the case for salt in relation to hypertension, saturated or trans-fatty acids in relation to heart disease and atherosclerosis, fibre in relation to colon cancer, and Fe in relation to anaemia. These are all significant diseases in Mexico. We analysed the national diet of Mexican adults by applying solid scientific evidence of causation and not with the intention of exploring new dietary characteristics. Based on well-known dietary risk factors or protectors, our intention was to characterize and describe the major features and to elucidate that dietary analysis is a complex multidimensional concept. We are adapting solid research into high-quality guidelines for local use as an efficient way to improve the applicability of evidence-informed dietary recommendations.
The strength of the present study is that we draw inference on the diet of the complete adult Mexican population and can offer insights into its strengths and weaknesses, as well as individualized recommendations with national representation.
Validation of indices is necessary and is our next step; however, components of the indices used have been validated in other studies. For instance, the Healthy Diet Indicator was developed according to WHO guidelines for the prevention of chronic diseases and was shown to be inversely associated with all-cause mortality in males from Finland, Italy and the Netherlands( Reference Huijbregts, Feskens and Rasanen 50 ). The Diet Quality Index Revised developed by Hains et al.( Reference Haines, Siega-Riz and Popkin 51 ) was reported to correlate with plasma biomarkers( Reference Newby, Hu and Rimm 52 ) for micronutrient intake. Dietary variety and diversity were shown to be associated with nutrient adequacy( Reference Bernstein, Tucker and Ryan 53 ), biomarkers( Reference Vyncke, Cruz Fernandez and Fajó-Pascual 54 ) and lower disease risk( Reference Fernandez, Negri and La Vecchia 55 ) .
These indices, with some modifications, have been used previously in Mexicans( Reference Ponce, Ramirez and Delisle 41 ), Haitian immigrants in Canada( Reference Désilets, Rivard and Shatenstein 56 ) and a sample of the African population( Reference Sodjinou, Agueh and Fayomi 40 ), but not in a nationally representative sample.
The components of our indices provided qualitative information related to problems of under- and overnutrition. Our indices allow recognition of both under- and overnutrition and identify groups with poor dietary quality as well as characterize different types of poor dietary quality. These indices also allow characterization of nutritional problems such as micronutrient deficiencies or excess of particularly high-risk food components, both of which are present in populations undergoing nutritional transition. These indices may be used for monitoring dietary quality according to different sociodemographic and nutritional characteristics of the Mexican population. We did not use indices used in other studies such as the Healthy Eating Index( Reference Basiotis, Carlson and Gerrior 57 ) or the Diet Quality Index developed by Patterson et al.( Reference Patterson, Haines and Popkin 58 ) because we consider that they may not be useful for the Mexican population, being designed for populations with different characteristics. Further research may be aimed at validating these indices with nutritional biomarkers or health outcomes. Due to the mixture of dietary characteristics from the diverse populations living in countries undergoing nutritional transition, it may be inappropriate to evaluate only one dietary feature. Our indices allowed measurement of the overall dietary quality, micronutrient density, dietary diversity and cardioprotective effects, avoiding problems of a specific nutrient or foods related to diseases.
However, even though the three dietary indices identified dietary inadequacies, due to the alarming increase in obesity and NCD in Mexico( Reference Rivera, Barquera and Campirano 1 ), we believe that among the three dietary indices reviewed, the CPI from adult diets is the one that may be useful to characterize the diet and to monitor programmed recommendations. Thus, validation of the CPI with nutritional biomarkers or health outcomes is relevant. However, nutritional policies aimed to prevent chronic NCD have been created from the knowledge and evidence of different interventions. For example, the Mexican National Agreement for Dietary Health( 59 ), the WHO( 16 ) and the US Institute of Medicine( 60 ) promote reductions in Na, sugar and fat intakes as a means to improve health and to decrease incidence of chronic diet-related NCD.
Conclusion
Our findings offer evidence that there is not a sufficiently adequate single index to identify all relevant characteristics of a healthy diet (such as micronutrient adequacy, cardioprotective diet or dietary diversity). There are several approaches to evaluate diets, all related to health in a meaningful way. We have offered evidence that it is insufficient to evaluate only one characteristic of the diet: its micronutrient density, diversity, or even its cardioprotective characteristics. We have shown that a diverse and micronutrient-rich diet may not necessarily be a healthy diet because it may also be atherogenic. Likewise, a cardioprotective diet may be poor in micronutrients. We suggest that these three dimensions be considered in dietary evaluation with a special focus on the CPI. Hence, in countries such as Mexico that are undergoing the nutrition transition, dietary guidelines should include recommendations on improving diversity and the micronutrient density of diets. Above all, guidelines should focus on reducing fat, Na and sugars. These nutrients are associated with chronic NCD such as diabetes mellitus and hypertension, which represent the leading cause of mortality. In addition, the energy density of the diet, fibre content, amount of processed foods and other aspects should also be investigated and evaluated to develop healthier recommendations for the population.
Acknowledgements
Sources of funding: Funding for this research was provided by the NIPH. Analysis of the data, interpretation of the findings and preparation of the manuscript were conducted in the NIPH. The NIPH had no role in the design, analysis or writing of this article. Conflicts of interest: The authors declare that they have no competing interests; however, they have had received funds from the food-related industry for projects different from the present analysis. T.G.d.C. participates in the DANONE research grant which evaluates the impact of promoting water consumption by obese young women, but does not receive funding from this project. She is also a part of a scientific group which reviews annual work plans for the Kelloggs’ Nutrition and Health Institute in Mexico, for which she also evaluates research proposals submitted for funding. She received $35 000 Mexican pesos (roughly $US 2700) in 2012 for these annual activities. S.R.-R. participated in the DANONE research grant which evaluates the impact of promoting water consumption by obese young women. S.B. participated in two NIPH water consumption studies sponsored by DANONE and is part of the Hydration for Health Scientific Group. He has received honoraria (under $US 4000) from AstraZeneca, Herbalife and Medix to participate in scientific or medical meetings describing the epidemiology of obesity and NCD in Mexico in the last 4 years. T.S. received funding from Nestlé in 2012 to validate by triplicate a 24 h recall questionnaire in a national sample in Mexico ($US 1 000 000). In 2013, she directed two nutritional status assessment workshops for paediatricians; the payment for each one of them was $US 1000. V.M.-R. and X.P. have not received funding from the food-related industry. Authors’ contributions: T.G.d.C. was the lead author; X.P. was responsible for formulating the research questions and writing the draft; X.P. and S.R.-R carried out the statistical analysis; V.M.-R. S.R.-R., T.S., T.G.d.C. and S.B. worked in close collaboration with the first author analysing the data and interpreting the results; all authors provided critical revision and approved the final manuscript.



