


Introduction
Conduct disorder (CD) is a psychiatric disorder characterized by severe and persistent aggressive and antisocial behavior in children and adolescents (American Psychiatric Association, 2022). The high global prevalence of CD (3%; Ayano et al., Reference Ayano, Abraha, Tsegay and Gizachew2024) means that it is associated with a substantial societal burden (Goulter et al., Reference Goulter, Hur, Jones, Godwin, McMahon, Dodge, Lansford, Lochman, Bates, Pettit and Crowley2023; Rivenbark et al., Reference Rivenbark, Odgers, Caspi, Harrington, Hogan, Houts, Poulton and Moffitt2018; Romeo et al., Reference Romeo, Knapp and Scott2006). This is because CD increases the affected individuals’ risk of future delinquency, substance abuse, and mental illness (Erskine et al., Reference Erskine, Norman, Ferrari, Chan, Copeland, Whiteford and Scott2016; Kim-Cohen et al., Reference Kim-Cohen, Caspi, Moffitt, Harrington, Milne and Poulton2003). The disorder is associated with neurocognitive impairments in emotion processing, decision-making and reinforcement learning (Fairchild et al., Reference Fairchild, Hawes, Frick, Copeland, Odgers, Franke, Freitag and De Brito2019; Kohls et al., Reference Kohls, Baumann, Gundlach, Scharke, Bernhard, Martinelli, Ackermann, Kersten, Prätzlich, Oldenhof, Jansen, van den Boogaard, Smaragdi, Gonzalez-Madruga, Cornwell, Rogers, Pauli, Clanton, Baker and Konrad2020). Meta-analytic evidence has shown differences between youth with CD and healthy controls (HCs) in the structure and function of brain regions implicated in these neurocognitive processes, e.g., the amygdala, insula, orbitofrontal cortex, and anterior cingulate cortex (Alegria et al., Reference Alegria, Radua and Rubia2016; Noordermeer et al., Reference Noordermeer, Luman and Oosterlaan2016; Rogers & De Brito, Reference Rogers and De Brito2016).
To further understand the neurobiological underpinnings of CD, it is important to study the structural connections between these regions, as they function as networks rather than in isolation (Thiebaut de Schotten & Forkel, Reference Thiebaut de Schotten and Forkel2022). Specifically, white matter tracts connect different regions of the brain, supporting neural communication and integration. Diffusion tensor imaging (DTI) is a non-invasive magnetic resonance imaging technique that measures water molecule diffusion, thus providing an indirect representation of white matter microstructure (Catani & Thiebaut De Schotten, Reference Catani and Thiebaut De Schotten2012; Puzzo et al., Reference Puzzo, Seunarine, Sully, Darekar, Clark, Sonuga-Barke and Fairchild2018). Diffusion measures include axial diffusivity (AD), representing diffusion parallel to the tract and indexing axonal integrity, and radial diffusivity (RD), representing diffusion perpendicular to the tract and relating to myelination (Winklewski et al., Reference Winklewski, Sabisz, Naumczyk, Jodzio, Szurowska and Szarmach2018). Mean diffusivity (MD) is a general measure of diffusion in each direction within a voxel, derived from parallel and perpendicular measures. Finally, fractional anisotropy (FA) represents the proportion of AD relative to RD, with higher values indexing more directional (i.e., anisotropic) diffusion of water molecules (Alexander et al., Reference Alexander, Lee, Lazar and Field2007). Higher FA and lower MD values are often interpreted as indicative of greater microstructural “integrity”, resulting from facilitated diffusion parallel to the fiber tract (i.e., AD), restricted diffusion perpendicular to the fiber tract (i.e., RD), or both (Soares et al., Reference Soares, Marques, Alves and Sousa2013; Winklewski et al., Reference Winklewski, Sabisz, Naumczyk, Jodzio, Szurowska and Szarmach2018). See Figure 1 for a graphical representation of these microstructural measures. While high FA and directional diffusion may seem positive (i.e., to facilitate efficient neural communication), there is likely to be an optimal level of diffusion, and there are cases when higher FA may be problematic. For instance, it has been reported that FA values are lower in childhood than in adulthood (Lebel et al., Reference Lebel, Gee, Camicioli, Wieler, Martin and Beaulieu2012), and this likely reflects lower levels of myelination and increased fiber branching which may be beneficial for development and neural plasticity (Feldman et al., Reference Feldman, Yeatman, Lee, Barde and Gaman-Bean2010). Very high FA values (and correspondingly low RD and MD levels) in childhood and adolescence may therefore be a marker of atypical development.
Diffusion tensor imaging (DTI) measures explained. (a) Visualization of DTI measures overlaid on a neuronal fiber, showing parallel (i.e., axial) versus perpendicular (i.e., radial) diffusion along the length of the axon. White matter tracts are made up of bundles of these axonal fibers. (b) Anisotropic/directional diffusion versus isotropic/non-directional diffusion visualized as diffusion ellipsoids, with likely corresponding diffusion measures. Diffusion ellipsoids can be used to display diffusion tensor data, wherein the horizontal axis of the ellipsoid gives the primary diffusion direction (i.e., coinciding with the direction of the axonal fibers) and the shape is determined by the degree of anisotropy. Higher fractional anisotropy and lower mean diffusion values may indicate directional diffusion of water molecules, while lower fractional anisotropy and higher mean diffusion values may indicate non-directional diffusion of water molecules. There are likely to be optimal levels of diffusion as appropriate for different age groups, as discussed in more detail in the main text. Note: lambda 1-3 (λ1, λ2, λ3) refer to eigenvalues which quantify the magnitude of water diffusion along the three principal axes of a voxel. Created in BioRender. Townend, S. (2025) https://BioRender.com/j03kh5d.

To date, DTI research has been inconsistent regarding both the specific white matter pathways implicated in CD and the direction of group effects (Waller et al., Reference Waller, Dotterer, Murray, Maxwell and Hyde2017). Perhaps the most consistent findings are within the corpus callosum (the main tract that connects the brain’s hemispheres) and the uncinate fasciculus (connecting the orbitofrontal cortex to the anterior temporal lobes and amygdala). In both cases, higher FA has been reported in youth with CD relative to controls (Menks et al., Reference Menks, Furger, Lenz, Fehlbaum, Stadler and Raschle2017; Passamonti et al., Reference Passamonti, Fairchild, Fornito, Goodyer, Nimmo-Smith, Hagan, Calder and de Erausquin2012; Sarkar et al., Reference Sarkar, Craig, Catani, Dell’Acqua, Fahy, Deeley and Murphy2013; Zhang, Zhu et al., Reference Zhang, Zhu, Wang, Gao, Shi, Huang, Situ, Yi, Zhu and Yao2014), with further reports of higher AD and lower RD or MD (Puzzo et al., Reference Puzzo, Seunarine, Sully, Darekar, Clark, Sonuga-Barke and Fairchild2018; Rogers et al., Reference Rogers, Gonzalez-Madruga, Kohls, Baker, Clanton, Pauli, Birch, Chowdhury, Kirchner, Andersson, Smaragdi, Puzzo, Baumann, Raschle, Fehlbaum, Menks, Steppan, Stadler, Konrad and Brito2019; Zhang, Gao et al., Reference Zhang, Gao, Shi, Huang, Wang, Situ, Cai, Yi, Zhu and Yao2014). These tracts are implicated in emotion and decision-making processes (Schutter & Harmon-Jones, Reference Schutter and Harmon-Jones2013; Von Der Heide et al., Reference Von Der Heide, Skipper, Klobusicky and Olson2013), aligning with the functional impairments exhibited by CD youth on neurocognitive tasks (Blair et al., Reference Blair, Veroude and Buitelaar2018; Kohls et al., Reference Kohls, Baumann, Gundlach, Scharke, Bernhard, Martinelli, Ackermann, Kersten, Prätzlich, Oldenhof, Jansen, van den Boogaard, Smaragdi, Gonzalez-Madruga, Cornwell, Rogers, Pauli, Clanton, Baker and Konrad2020; Rogers et al., Reference Rogers, Gonzalez-Madruga, Kohls, Baker, Clanton, Pauli, Birch, Chowdhury, Kirchner, Andersson, Smaragdi, Puzzo, Baumann, Raschle, Fehlbaum, Menks, Steppan, Stadler, Konrad and Brito2019). Nevertheless, CD-related alterations are not uniformly observed in these tracts and lower FA has also been reported (Haney-Caron et al., Reference Haney-Caron, Caprihan and Stevens2014; Wang et al., Reference Wang, Horst, Kronenberger, Hummer, Mosier, Kalnin, Dunn and Mathews2012).
In addition to methodological issues such as small sample sizes (Button et al., Reference Button, Ioannidis, Mokrysz, Nosek, Flint, Robinson and Munafo2013) and different analytic approaches (Waller et al., Reference Waller, Dotterer, Murray, Maxwell and Hyde2017), inconsistent results may be due to heterogeneity within CD samples. Specifically, studies have reported that factors such as sex (Rogers et al., Reference Rogers, Gonzalez-Madruga, Kohls, Baker, Clanton, Pauli, Birch, Chowdhury, Kirchner, Andersson, Smaragdi, Puzzo, Baumann, Raschle, Fehlbaum, Menks, Steppan, Stadler, Konrad and Brito2019; Villemonteix et al., Reference Villemonteix, Rogers, Courbet, Gonzalez-Madruga, Kohls, Raschle, Stadler, Konrad, Freitag, Fairchild and De Brito2021), callous-unemotional traits (Pape et al., Reference Pape, Cohn, Caan, van Wingen, van den Brink, Veltman and Popma2015; Puzzo et al., Reference Puzzo, Seunarine, Sully, Darekar, Clark, Sonuga-Barke and Fairchild2018), and psychiatric comorbidities such as ADHD (Wang et al., Reference Wang, Horst, Kronenberger, Hummer, Mosier, Kalnin, Dunn and Mathews2012) may moderate the associations between CD diagnosis and white matter microstructure. However, existing research has largely ignored the potential impact of childhood maltreatment on the neurobiology of CD, despite evidence that maltreatment is a key risk factor for CD (Afifi et al., Reference Afifi, McMillan, Asmundson, Pietrzak and Sareen2011; Baldwin et al., Reference Baldwin, Wang, Karwatowska, Schoeler, Tsaligopoulou, Munafo and Pingault2023; Bernhard et al., Reference Bernhard, Martinelli, Ackermann, Saure and Freitag2018; Braga et al., Reference Braga, Gonçalves, Basto-Pereira and Maia2017; Maniglio, Reference Maniglio2015), and suggestions that maltreated individuals may constitute a distinct subgroup within the broader population of those with psychiatric disorders, with differing clinical and neurobiological presentations (Teicher & Samson, Reference Teicher and Samson2013).
Childhood maltreatment, which includes sexual, physical and emotional abuse or neglect (Teicher et al., Reference Teicher, Gordon and Nemeroff2022), increases the risk of developing psychopathology, with several mechanisms proposed to explain this relationship (Cicchetti & Howes, Reference Cicchetti and Howes1991; Jaffee, Reference Jaffee2017; McCrory & Viding, Reference McCrory and Viding2015; Schulz-Heik et al., Reference Schulz-Heik, Rhee, Silvern, Haberstick, Hopfer, Lessem and Hewitt2010). One theory suggests that the severe stress of maltreatment results in a cascade of neurobiological alterations, which confer latent vulnerability for future psychiatric disorders (McCrory et al., Reference McCrory, De Brito and Viding2010; Teicher et al., Reference Teicher, Gordon and Nemeroff2022). This is supported by evidence that changes in brain structure (including DTI measures) and function are present in both children and adults with maltreatment histories compared to non-maltreated controls (Lim et al., Reference Lim, Howells, Radua and Rubia2020; see Teicher et al., Reference Teicher, Gordon and Nemeroff2022 for a review). Notably, studies that have compared maltreated and non-maltreated individuals with the same psychiatric diagnosis found that some structural alterations were specifically related to maltreatment, rather than to the disorder itself (Chaney et al., Reference Chaney, Carballedo, Amico, Fagan, Skokauskas, Meaney and Frodl2014; Lim et al., Reference Lim, Hart, Howells, Mehta, Simmons, Mirza and Rubia2019; Opel et al., Reference Opel, Redlich, Zwanzger, Grotegerd, Arolt, Heindel, Konrad, Kugel and Dannlowski2014; Poletti et al., Reference Poletti, Vai, Smeraldi, Cavallaro, Colombo and Benedetti2016; Vythilingam et al., Reference Vythilingam, Heim, Newport, Miller, Anderson, Bronen, Brummer, Staib, Vermetten and Charney2002). They also identified differences in brain structure between individuals with the same diagnosis with versus without histories of childhood maltreatment (Asmal et al., Reference Asmal, Kilian, du Plessis, Scheffler, Chiliza, Fouche, Seedat, Dazzan and Emsley2019; Park et al., Reference Park, Lee, Kim, Kwon, Cho, Han, Cheong and Kim2016). These data, along with evidence of differences between these subtypes in clinical severity, comorbidity, and treatment responsiveness, led Teicher and Samson (Reference Teicher and Samson2013) to propose the “ecophenotype hypothesis.” This holds that maltreatment-related disorders may be distinct from non-maltreatment-related forms of the same disorder, consistent with the concept of equifinality (i.e., that different developmental pathways may lead to the same disorder, which contributes to heterogeneity within diagnostic groups; Cicchetti & Rogosch, Reference Cicchetti and Rogosch1996). If the ecophenotype hypothesis is correct, any attempts to identify neurobiological correlates of psychiatric disorders without considering the impact of maltreatment will be challenging and likely to yield inconsistent results (Teicher et al., Reference Teicher, Gordon and Nemeroff2022).
Accordingly, recent studies have begun to consider childhood maltreatment experience as a further source of heterogeneity in CD populations. In the first study to explicitly compare youth with CD with and without maltreatment histories, Gao et al. (Reference Gao, Jiang, Ming, Zhang, Ma, Wu, Dong, Sun, He, Cao, Yuan and Yao2021) found that maltreated CD youth had higher volume than non-maltreated CD youth in the posterior cingulate, putamen, and amygdala, but lower volume in the dorsolateral prefrontal cortex, showing that the two CD subgroups displayed distinct structural alterations in regions involved in threat detection and emotion processing. Staginnus et al. (Reference Staginnus, Cornwell, Toschi, Oosterling, Paradysz, Smaragdi, González-Madruga, Pauli, Rogers, Bernhard, Martinelli, Kohls, Raschle, Konrad, Stadler, Freitag, De Brito and Fairchild2023) extended these results by considering additional brain structural metrics. They observed that maltreated CD youth showed more extensive cortical structure alterations than their non-maltreated counterparts, i.e., case-control differences were present in more regions and across different metrics (e.g., cortical thickness, surface area, and cortical folding). These studies provide initial evidence that the ecophenotype hypothesis may apply to CD.
We aimed to test the ecophenotype hypothesis further, and elucidate prior inconsistencies in DTI studies of CD, by examining whether there are differences in white matter microstructure between CD youth with versus without a history of childhood physical abuse or sexual abuse (CPA/CSA), and between each of these groups and healthy controls without a history of abuse. We first compared diffusion indices between youth with CD (regardless of CPA/CSA history) and controls, to verify previous findings obtained with an overlapping sample (Rogers et al., Reference Rogers, Gonzalez-Madruga, Kohls, Baker, Clanton, Pauli, Birch, Chowdhury, Kirchner, Andersson, Smaragdi, Puzzo, Baumann, Raschle, Fehlbaum, Menks, Steppan, Stadler, Konrad and Brito2019), and identify any differences between an undifferentiated group of youth with CD and healthy controls. We then explicitly tested the ecophenotype hypothesis by dividing the CD group into those with versus without a history of CPA/CSA, and directly comparing these subgroups to each other and to controls. Currently, little is known about abuse- or maltreatment-related alterations in white matter microstructure among CD youth. We therefore employed an exploratory approach to test for white matter microstructural differences across the entire white matter part of the brain using Tract-Based Spatial Statistics (TBSS) (Smith et al., Reference Smith, Johansen-Berg, Jenkinson, Rueckert, Nichols, Miller, Robson, Jones, Klein, Bartsch and Behrens2007). This whole-brain analysis technique allows group comparisons to be performed in an unbiased manner across all white matter pathways simultaneously, rather than focusing on specific white matter tracts (e.g., corpus collosum) within a region-of-interest approach.
Based on existing evidence (Waller et al., Reference Waller, Dotterer, Murray, Maxwell and Hyde2017), we hypothesized that youth with CD (grouped together irrespective of CPA/CSA history) would show higher FA relative to controls in the corpus callosum and uncinate fasciculus. Because higher FA is often a function of higher AD and/or lower RD and can often be accompanied by lower MD (see Figure 1), we likewise hypothesized that we would observe corresponding effects in these measures (i.e., higher AD or lower RD) within the corpus callosum and uncinate fasciculus. Parallel findings from the maltreatment literature suggest that individuals with a history of childhood maltreatment display lower FA in the corpus callosum compared to non-maltreated healthy controls (Lim et al., Reference Lim, Howells, Radua and Rubia2020; Teicher et al., Reference Teicher, Gordon and Nemeroff2022). Although no previous DTI studies have considered the impact of childhood abuse on CD-related alterations in white matter microstructure, we tentatively predicted higher FA within the corpus callosum in the CD subgroup without a history of CPA/CSA compared to controls, and lower FA in the CD subgroup with a history of CPA/CSA relative to controls. As findings for other tracts have been mixed within both CD and maltreated populations when studied separately, no further predictions were made. Finally, the FemNAT-CD study focused on sex differences in CD and recruited a substantial number of girls with the disorder, whereas most previous research in youth with CD has focused on all-male or predominantly male samples (Freitag et al., Reference Freitag, Konrad, Stadler, De Brito, Popma, Herpertz, Herpertz-Dahlmann, Neumann, Kieser, Chiocchetti, Schwenck and Fairchild2018). By using data from this study, we were able to conduct exploratory sex-stratified analyses to assess whether CPA/CSA experiences have similar or distinct effects in girls and boys with CD.
Methods and materials
Participants and measures
One-hundred youth with CD (48.0% female) and 169 HCs (61.5% female) aged 9-18 years were included from the European multi-site FemNAT-CD study (Freitag et al., Reference Freitag, Konrad, Stadler, De Brito, Popma, Herpertz, Herpertz-Dahlmann, Neumann, Kieser, Chiocchetti, Schwenck and Fairchild2018). Data for the current study were collected across four European sites (from Germany, Switzerland, and the United Kingdom), and most participants were of white European ancestry. See Supplementary Table 1 for the number of participants per contributing site. 222 participants (82.5% of the present sample) were included in a previous DTI study of CD youth (Rogers et al., Reference Rogers, Gonzalez-Madruga, Kohls, Baker, Clanton, Pauli, Birch, Chowdhury, Kirchner, Andersson, Smaragdi, Puzzo, Baumann, Raschle, Fehlbaum, Menks, Steppan, Stadler, Konrad and Brito2019), while 111 participants (41.3%) overlapped with a previous surface-based morphometry study investigating the ecophenotype hypothesis (Staginnus et al., Reference Staginnus, Cornwell, Toschi, Oosterling, Paradysz, Smaragdi, González-Madruga, Pauli, Rogers, Bernhard, Martinelli, Kohls, Raschle, Konrad, Stadler, Freitag, De Brito and Fairchild2023). Participants were included based on availability of high-quality DTI data and maltreatment information. Exclusion criteria included IQ<70, and the presence of autism spectrum disorders, psychosis, neurological or genetic disorders or severe head trauma. Cases had DSM-IV-TR diagnoses of CD (or 1-2 current symptoms of CD and a full diagnosis of Oppositional Defiant Disorder [ODD]), while all HCs were free of current Axis I disorders and had no history of externalizing disorders. We also excluded 14 HCs with CPA/CSA histories as this group was considered too small for meaningful statistical analysis. See the Supplement for an inclusion flowchart (Supplementary Figure 1) and ethical approval information.
We assessed for CD and other psychiatric disorders using the Kiddie-Schedule for Affective Disorders and Schizophrenia-Present and Lifetime version (K-SADS-PL) (Kaufman et al., Reference Kaufman, Birmaher, Brent, Rao, Flynn, Moreci, Williamson and Ryan1997), a semi-structured interview measure. Where possible, the child themselves and their parent or caregiver were interviewed separately, and the information was combined across interviews based on clinical judgement. In line with previous research (Staginnus et al., Reference Staginnus, Cornwell, Toschi, Oosterling, Paradysz, Smaragdi, González-Madruga, Pauli, Rogers, Bernhard, Martinelli, Kohls, Raschle, Konrad, Stadler, Freitag, De Brito and Fairchild2023; Yoon et al., Reference Yoon, Howell, Dillard, Shockley McCarthy, Rae Napier and Pei2021), childhood maltreatment was assessed with the Children’s Bad Experiences (CBE) interview, a parent-report measure (Arseneault et al., Reference Arseneault, Cannon, Fisher, Polanczyk, Moffitt and Caspi2011; Dodge et al., Reference Dodge, Bates and Pettit1990). The CBE measures children’s exposure to multiple adverse experiences, though here we focused on CPA/CSA specifically as the other items do not capture maltreatment. CPA/CSA was recorded as absent, probable, or definite. Consistent with previous studies using the CBE (Choi et al., Reference Choi, Wang and Jackson2019; Staginnus et al., Reference Staginnus, Cornwell, Toschi, Oosterling, Paradysz, Smaragdi, González-Madruga, Pauli, Rogers, Bernhard, Martinelli, Kohls, Raschle, Konrad, Stadler, Freitag, De Brito and Fairchild2023), we dichotomized this variable so that participants were classified as either having been exposed to CPA/CSA or not (combining the probable and definite abuse categories). IQ was estimated using the Wechsler Intelligence scales (the WASI, WAIS or WISC) (Wechsler, Reference Wechsler1999, Reference Wechsler2003). Callous-unemotional and psychopathic traits were assessed using the parent/caregiver-report version of the Inventory of Callous-Unemotional traits (ICU) (Essau et al., Reference Essau, Sasagawa and Frick2006) and the self-report Youth Psychopathic traits Inventory (YPI) (Andershed et al., Reference Andershed, Kerr, Stattin, Levander, Blaauw, Sheridan and Haag2002), respectively, and are reported for sample description purposes only. The Supplement provides additional information on phenotypic measures.
DTI data acquisition, pre-processing, and data preparation
Diffusion-weighted imaging data were acquired at four sites using Siemens 3T (Tim-Trio or Prisma) or Philips 3T (Achieva) scanners. A single-shot spin echo planar imaging sequence was used with the following acquisition parameters common across sites: field of view of 256 × 256 × 124 mm, 62 contiguous axial slices (no slice gap), voxel size 2 × 2 × 2 mm. Further site-specific acquisition information can be found in the Supplement (Supplementary Table 2). The images were acquired with diffusion gradients (b-value = 1,500 s/mm2) applied in 64 directions, with two b-value = 0 (s/mm2) volumes with reversed phase encoding (blip-up/blip-down), providing pairs of images with distortions in opposite phase-encode directions for estimating the susceptibility-induced distortions. Diffusion-weighted images were pre-processed with the FMRIB Software Library (FSL) diffusion toolkit (https://fsl.fmrib.ox.ac.uk/fsl/fslwiki) (Jenkinson et al., Reference Jenkinson, Beckmann, Behrens, Woolrich and Smith2012), including TopUp to correct for susceptibility distortions (Andersson et al., Reference Andersson, Skare and Ashburner2003), and Eddy to complete current and motion correction (Andersson & Sotiropoulos, Reference Andersson and Sotiropoulos2016). All scans were visually inspected to assess data quality, with any poor quality scans subsequently excluded (i.e., when persistent head motion/strobing or signal loss were observed in 10% or more of the acquired directions). Visual inspection was carried out by five independent reviewers with training in the quality control of DTI data, with any problematic cases checked by senior authors with extensive MRI experience. A total of 60 scans were excluded following quality control. See the Supplement for further details.
A diffusion tensor model was fit for each voxel in the brain to estimate axial diffusivity (AD), radial diffusivity (RD), mean diffusivity (MD), and fractional anisotropy (FA). While many published studies have focused exclusively on FA, studying each of these four measures provides a more detailed characterization of white matter microstructure. For instance, while FA is highly sensitive to microstructural changes it is not specific to the type of change, and measures of AD or RD can therefore offer further information (Alexander et al., Reference Alexander, Lee, Lazar and Field2007; Winklewski et al., Reference Winklewski, Sabisz, Naumczyk, Jodzio, Szurowska and Szarmach2018). Tract-based spatial statistics (TBSS) was employed to enable voxel-wise whole-brain analysis of white matter, using a non-linear registration to project all participants’ FA maps to the FMRIB 1 mm³ FA template and averaging these together to create an FA “skeleton” of white matter tracts common to all participants. An FA threshold of 0.2 was used to remove non-white matter voxels. Participants’ data were subsequently projected onto the mean FA skeleton to enable group comparisons. This transformation procedure was also applied to the other diffusion parameter maps (i.e., for AD, RD and MD). Further details of quality control steps and image processing are provided in the Supplement.
Statistical analyses
Within FSL, statistical analyses assessed group differences using a whole-brain approach, fitting general linear models to FA, AD, RD, and MD diffusion measures. Case-control differences between a combined CD group (including those with and without CPA/CSA histories, hereafter termed “CD-all”) versus the HC group were assessed first. Then the CD subgroups with (CD/+) versus without CPA/CSA histories (CD/−) were each compared to HCs, as well as with each other. All analyses were adjusted for age (mean-centered), sex, and site. We accounted for site differences by modeling site as exchangeability blocks using FSL’s Permutation Analysis of Linear Models tool, thereby limiting permutations to the site of data collection (Winkler et al., Reference Winkler, Ridgway, Webster, Smith and Nichols2014). See Supplement for further details.
Most research examining white matter microstructure in CD has been conducted in all-male samples (Passamonti et al., Reference Passamonti, Fairchild, Fornito, Goodyer, Nimmo-Smith, Hagan, Calder and de Erausquin2012; Sarkar et al., Reference Sarkar, Craig, Catani, Dell’Acqua, Fahy, Deeley and Murphy2013, Reference Sarkar, Dell’Acqua, Froudist Walsh, Blackwood, Scott, Craig, Deeley, Murphy and Yap2016; Zhang, Zhu et al., Reference Zhang, Zhu, Wang, Gao, Shi, Huang, Situ, Yi, Zhu and Yao2014). However, studies explicitly testing for sex differences showed that sex moderated some of the effects of CD or conduct problems on white matter connectivity (Decety et al., Reference Decety, Yoder and Lahey2015; Rogers et al., Reference Rogers, Gonzalez-Madruga, Kohls, Baker, Clanton, Pauli, Birch, Chowdhury, Kirchner, Andersson, Smaragdi, Puzzo, Baumann, Raschle, Fehlbaum, Menks, Steppan, Stadler, Konrad and Brito2019). To aid comparisons with previous male-only studies in the literature, and due to statistical power considerations (Brookes et al., Reference Brookes, Whitely, Egger, Smith, Mulheran and Peters2004), we split the sample by sex, repeating the analyses in all-male (n = 117) and all-female (n = 152) subsamples separately (see Supplement for discussion of this point). Age and site were controlled across all analyses.
Significant group differences were identified using non-parametric, permutation-based inference (5,000 permutations) threshold-free cluster enhancement (TFCE), and family-wise error (FWE) corrections for multiple comparisons were applied. Cohen’s d was calculated for each significant cluster based on whole-brain effect-size brain maps. The JHU-ICBM-DTI-81 WM (Mori et al., Reference Mori, Oishi, Jiang, Jiang, Li, Akhter, Hua, Faria, Mahmood, Woods, Toga, Pike, Neto, Evans, Zhang, Huang, Miller, van Zijl and Mazziotta2008) and Jülich histological atlases (Eickhoff et al., Reference Eickhoff, Stephan, Mohlberg, Grefkes, Fink, Amunts and Zilles2005) were used to identify the locations of significant group differences.
We also ran sensitivity analyses controlling for IQ, socio-economic status (SES), and attention problems, because CD youth have been found to have lower IQ (Murray & Farrington, Reference Murray and Farrington2010), lower SES (Piotrowska et al., Reference Piotrowska, Stride, Croft and Rowe2015), and higher rates of attention-deficit/hyperactivity disorder (ADHD) comorbidity (Angold et al., Reference Angold, Costello and Erkanli1999) than HCs. We adjusted for attention problems (from the Child Behavior Checklist) rather than ADHD symptoms from the K-SADS-PL because there was very limited variance in the latter variable in the HC group.
Results
Sample characteristics
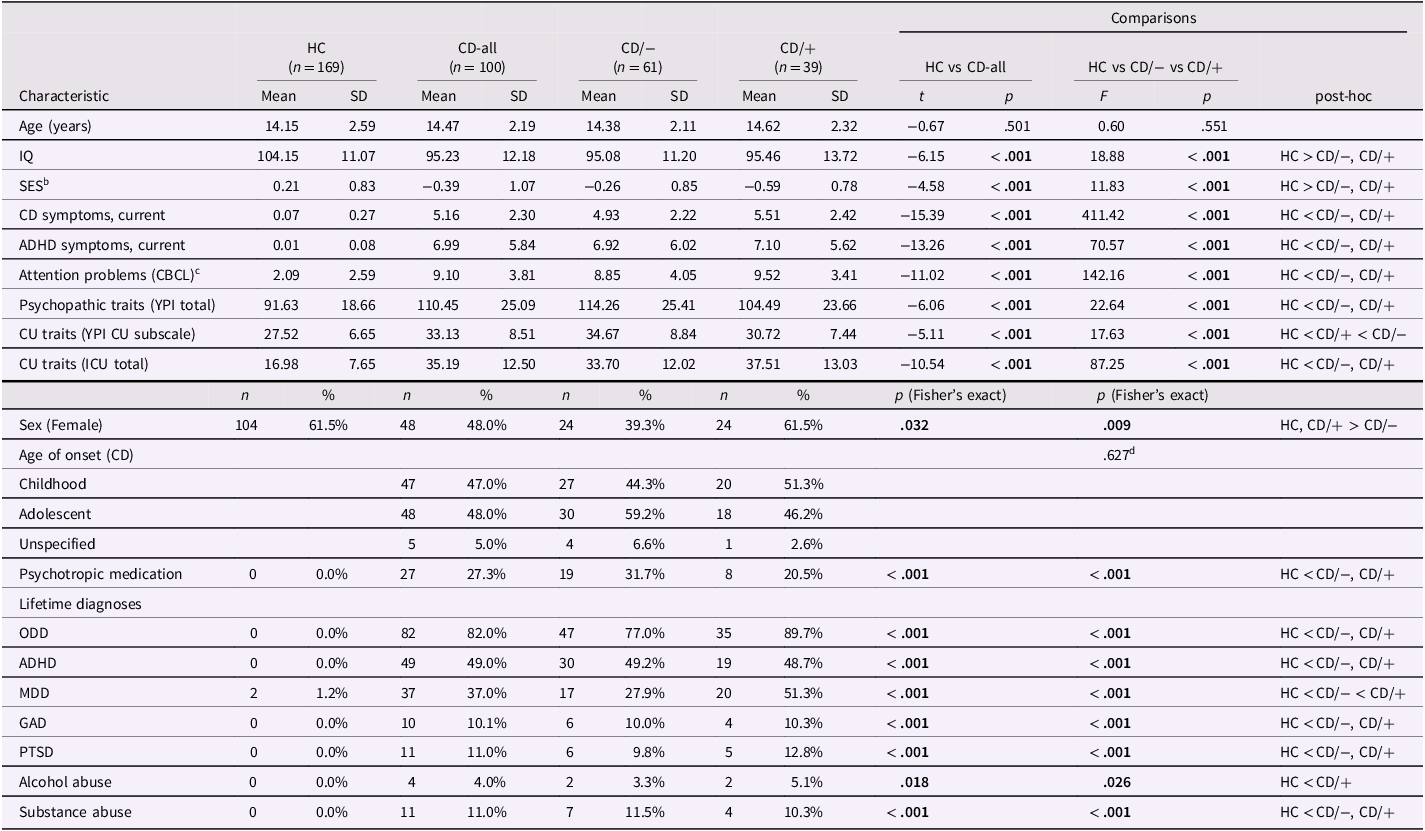
Demographic and clinical sample characteristics are summarized in Table 1, with further details of the post hoc comparisons shown in Supplementary Table 3. The CD-all and HC groups did not significantly differ in age, though the HC group included more female participants and had a higher average IQ. As expected, the CD-all group had significantly more CD and ADHD symptoms, and higher levels of psychopathic and callous-unemotional traits, psychiatric comorbidities, and psychotropic medication use relative to HCs. When the CD-all group were split into those with (CD/+; n = 39) versus without CPA/CSA histories (CD/−; n = 61), a similar pattern of case-control differences was found. Notably, only the CD/− group had a smaller proportion of female participants compared to the HC group. The CD subgroups were generally well-matched in demographic and clinical characteristics, except for higher rates of lifetime major depressive disorder in the CD/+ subgroup and higher self-reported callous-unemotional traits in the CD/− subgroup. Of note, these subgroups did not differ in parent-reported callous-unemotional traits and both subgroups scored higher than the HC group on this measure.
Demographic and clinical characteristics of the samplea

a Post-hoc comparisons were based on Bonferroni-corrected Welch’s t-tests and Fisher’s exact tests. Significant p-values are marked in bold. CD participants were classified as having childhood-onset CD if at least one symptom and functional impairment occurred before the age of 10. Otherwise, participants were classified as having adolescent-onset CD. HC = Healthy Controls; CD = Conduct Disorder; CD/+ and CD/− = Conduct Disorder with and without a history of childhood physical or sexual abuse; n = sample size; SD = standard deviation; IQ = intelligence quotient; CBCL = Child Behavior Checklist; YPI = Youth Psychopathic traits Inventory; CU = callous-unemotional; ICU = Inventory of Callous-Unemotional traits; ODD = Oppositional Defiant Disorder; ADHD = Attention-Deficit/Hyperactivity Disorder; MDD = Major Depressive Disorder; GAD = Generalized Anxiety Disorder; PTSD = Post-Traumatic Stress Disorder. Associated p-values for post-hoc analyses are reported in the Supplement.
b Missing for 30 participants (22 HCs, 5 CD/−, 3 CD/+)
c Missing for 32 participants (18 HCs, 8 CD/−, 6 CD/+)
d Only the CD subgroups are compared here
Diffusion tensor imaging results
CD-all versus HC
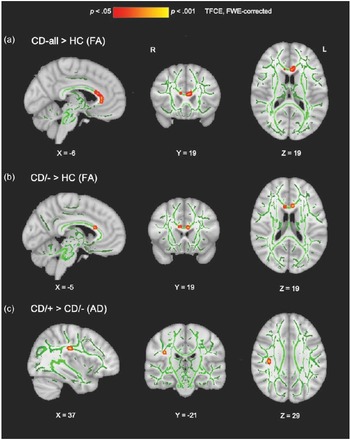
The combined CD group had significantly higher FA in three clusters within the genu and body of the corpus callosum relative to HCs (p-values = .027-.049, Cohen’s ds = 0.44−0.55; Table 2, Figure 2a). Contrary to our predictions, no corresponding differences in AD (ps > .252) or RD (ps > .086) were observed between the combined CD and control groups.
Group differences in white matter microstructure when controlling for age, sex and site. All significant voxels (shown in red-yellow) are thresholded at p < .05, with TFCE and FWE-correction for multiple comparisons across the entire white matter skeleton. Findings are overlaid onto the mean fractional anisotropy skeleton (green) in Montreal Neurological Institute (MNI) space. For viewing purposes only, the statistical findings were thickened. (a) Voxels within the corpus callosum genu and body where fractional anisotropy (FA) was significantly higher among the CD group compared to controls. (b) Voxels within the corpus callosum genu and body where FA was significantly higher among the CD/− subgroup relative to controls. (c) Voxels within the superior longitudinal fasciculus where axial diffusivity (AD) was significantly higher among the CD/+ subgroup compared to the CD/− subgroup. CD = conduct disorder; HC = healthy controls; CD/− = conduct disorder without a history of childhood physical or sexual abuse; CD/+ = conduct disorder with a history of childhood physical or sexual abuse; TFCE = threshold-free cluster enhancement; FWE = familywise error; R = right hemisphere; L = left hemisphere.

Significant group differences in the main analysesa
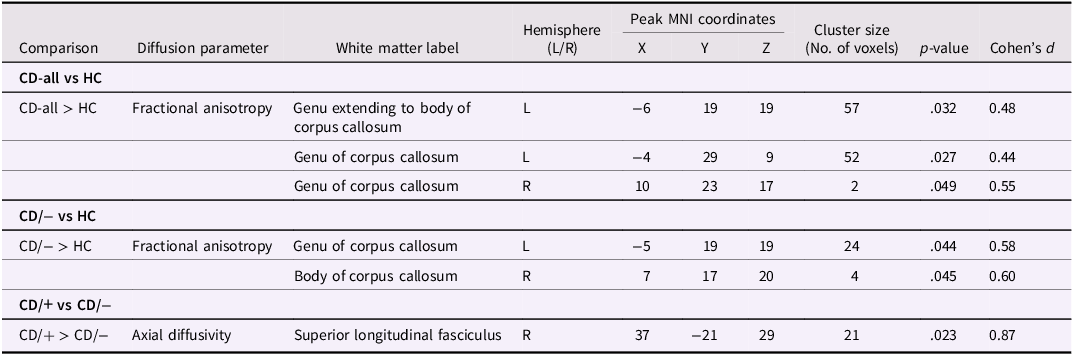
a All analyses controlled for age (mean centered), sex and site. P-values are based on Threshold-free cluster enhancement, significant at p < .05, family wise error-corrected. Cohen’s d values were calculated using whole-brain vertex-wise effect size brain maps. MNI = Montreal Neurological Institute. HC = Healthy Controls; CD = Conduct Disorder; CD/+ and CD/− = Conduct Disorder with and without a history of childhood physical or sexual abuse.
CD/− versus HC
Relative to HCs, the CD/− subgroup without a history of CPA/CSA showed higher FA in two clusters in the corpus callosum genu and body (p-values = .044−.045, ds = 0.58−0.60; Table 2, Figure 2b) which overlapped with those identified in the CD-all group comparisons.
CD/+ versus HC
There were no significant differences between the CD/+ subgroup with a history of CPA/CSA and HCs in the corpus callosum or in any other tract for any diffusion measure (all ps ≥ .114).
CD/+ versus CD/−
Compared to the CD/− subgroup, CD/+ youth had increased AD in the right superior longitudinal fasciculus (p = .023, d = 0.87; Table 2, Figure 2c).
Sex-stratified analyses
To further explore our results, and in light of evidence suggesting that white matter alterations in CD youth may differ by sex, we repeated the analyses in all-male and all-female subsamples. In the all-male subsample, the CD-all group displayed higher FA (p = .039, d = 0.71; Figure 3a, Supplementary Table 4) and lower RD (p-values = .038−.048, ds = 0.57−0.60; Figure 3b, Supplementary Table 4) within the corpus callosum genu and body relative to HCs.
Group differences in white matter microstructure when controlling for age and site in sex-stratified analyses with an all-male subsample. All significant voxels (shown in red-yellow) are thresholded at p < .05, with threshold-free cluster enhancement (TFCE) and familywise error (FWE)-correction for multiple comparisons across the entire white matter skeleton. Findings are overlaid onto the mean fractional anisotropy skeleton (green) in Montreal Neurological Institute (MNI) space. For viewing purposes only, the statistical findings were thickened. (a) Voxels within the corpus callosum genu and body where fractional anisotropy (FA) was significantly higher among the male CD group compared to HCs. (b) Voxels within the corpus callosum where radial diffusivity (RD) was significantly lower among the male CD group compared to HCs. (c) Voxels within the corpus callosum where FA was significantly higher among the male CD/− group compared to HCs. (d) Voxels within the corpus callosum where RD was significantly lower among the male CD/− group compared to HCs. CD = conduct disorder; HC = healthy controls; CD/− = conduct disorder without a history of childhood physical or sexual abuse; R = right hemisphere; L = left hemisphere.

Within the all-female sample, the CD-all group showed reduced RD (p-values = .036−0.39, ds = 0.69; Figure 4a, Supplementary Table 5) and MD (p-values = .045−.047, ds = 0.72−0.79; Figure 4b, Supplementary Table 5) within the fornix compared to HCs. Taken together, these findings suggest that the corpus callosum alterations found among the CD-all group in the mixed-sex analyses were primarily driven by males.
Group differences in white matter microstructure when controlling for age and site in sex-stratified analyses with an all-female subsample. All significant voxels (shown in red-yellow) are thresholded at p < .05, with threshold-free cluster enhancement (TFCE) and familywise error (FWE)-correction for multiple comparisons across the entire white matter skeleton. Findings are overlaid onto the mean fractional anisotropy skeleton (green) in Montreal Neurological Institute (MNI) space. For viewing purposes only, the statistical findings were thickened. (a) Voxels within the fornix where radial diffusivity (RD) was significantly lower among the female CD group compared to HCs. (b) Voxels within the fornix where mean diffusivity (MD) was significantly lower among the female CD group compared to HCs. (c) voxels within the posterior and superior corona radiata where fractional anisotropy (FA) was significantly lower among the female CD/− group compared to HCs. CD = conduct disorder; HC = healthy controls; CD/− = conduct disorder without a history of childhood physical or sexual abuse; R = right hemisphere; L = left hemisphere.

Finally, while the male CD/− subgroup exhibited higher FA (p-values = .026−.041, ds = 0.63−0.66; Figure 3c, Supplementary Table 4) and lower RD (p-values = .025−.047, ds = 0.59−0.89; Figure 3d, Supplementary Table 4) in the corpus callosum genu and body than male HCs, the female CD/− subgroup had lower FA in the posterior (p = .036, d = 0.82) and superior corona radiata (p = .035, d = 0.91) relative to female HCs (Figure 4c, Supplementary Table 5). Male and female CD/+ youths did not significantly differ from sex-matched HCs or their CD/− counterparts in these sex-stratified analyses. Again, these findings suggest that the corpus callosum alterations identified in the mixed-sex analyses for the CD/− group were potentially specific to CD males, while females with CD seemed to show white matter alterations in different tracts, and again, any effects were only present in the CD/− subgroup. Notably, the AD differences in the superior longitudinal fasciculus found between CD/+ and CD/− youth in the mixed-sex analyses were no longer observed when stratifying the sample by sex.
Sensitivity analyses
In sensitivity analyses controlling for IQ, all findings remained significant except for the group differences in FA in the corpus callosum, which were rendered non-significant. When adjusting for CBCL attention problems, all FA differences within the corpus callosum were again rendered non-significant, as were the RD differences for the male CD-all group versus HCs, the MD differences in the female CD-all group, and the FA differences in the corona radiata for the female CD/− subgroup; all other findings remained significant. When controlling for SES, the FA differences in the corpus callosum were again rendered non-significant, as were the RD differences in the all-male sample, however all other findings remained significant (see Supplementary Tables 6−8 for associated p-values, and Supplementary Table 9 for an overview of the sensitivity analyses). Of note, the difference between the CD/+ and CD/− subgroups in the right superior longitudinal fasciculus remained significant in each of these sensitivity analyses.
Discussion
This study aimed to test the “ecophenotype hypothesis” by comparing CD youth (irrespective of CPA/CSA history) and healthy controls in white matter microstructure, before directly comparing CD subgroups with versus without a history of CPA/CSA to each other and to controls. Consistent with the ecophenotype hypothesis, we identified differences in axial diffusivity (AD) between CD youth with (CD/+) versus without (CD/−) CPA/CSA histories in the right superior longitudinal fasciculus. The group differences in FA in the corpus callosum, initially identified in the CD−all group relative to controls, appeared to be specific to the CD/− subgroup. Contrary to predictions, the CD subgroup with a history of physical or sexual abuse did not significantly differ from controls in any diffusion measure or white matter tract.
Our finding of higher FA in the corpus callosum among CD youth relative to controls is consistent with prior studies which reported increased directional diffusion (indexed by higher FA or AD, or lower RD or MD) in this tract among youth with CD (Decety et al., Reference Decety, Yoder and Lahey2015; Menks et al., Reference Menks, Furger, Lenz, Fehlbaum, Stadler and Raschle2017; Pape et al., Reference Pape, Cohn, Caan, van Wingen, van den Brink, Veltman and Popma2015; Puzzo et al., Reference Puzzo, Seunarine, Sully, Darekar, Clark, Sonuga-Barke and Fairchild2018; Zhang, Zhu et al., Reference Zhang, Zhu, Wang, Gao, Shi, Huang, Situ, Yi, Zhu and Yao2014), including in an overlapping sample to the one investigated here (Rogers et al., Reference Rogers, Gonzalez-Madruga, Kohls, Baker, Clanton, Pauli, Birch, Chowdhury, Kirchner, Andersson, Smaragdi, Puzzo, Baumann, Raschle, Fehlbaum, Menks, Steppan, Stadler, Konrad and Brito2019). Notably, in the current study this result appeared to be driven by the CD/− group and by males, and was not significant in the sensitivity analyses (see later sections for further discussion of these points). The corpus callosum tract is crucial for interhemispheric communication (Catani & Thiebaut De Schotten, Reference Catani and Thiebaut De Schotten2012), and is generally divided into three functionally-distinct subregions: the genu, body, and splenium (van der Knaap & van der Ham, Reference van der Knaap and van der Ham2011). We observed higher FA in the genu, which connects the prefrontal and orbitofrontal regions, and the anterior portion of the body, which connects the insula and motor, parietal, and temporal areas. Microstructural alterations in these corpus callosum subregions have been related to defining features of CD, including aggression (Schutter & Harmon-Jones, Reference Schutter and Harmon-Jones2013), and deficits in emotion regulation (Raine et al., Reference Raine, Lencz, Taylor, Hellige, Bihrle, Lacasse, Lee, Ishikawa and Colletti2003) and response inhibition (Rogers et al., Reference Rogers, Gonzalez-Madruga, Kohls, Baker, Clanton, Pauli, Birch, Chowdhury, Kirchner, Andersson, Smaragdi, Puzzo, Baumann, Raschle, Fehlbaum, Menks, Steppan, Stadler, Konrad and Brito2019).
When the CD group was divided into two subgroups based on CPA/CSA history to test the ecophenotype hypothesis, these analyses suggested that the corpus callosum alterations observed in the CD-all group were driven by the non-abused CD/− subgroup rather than the CD/+ subgroup. This suggests that corpus callosum alterations are only present or are more pronounced among CD youth without a history of CPA/CSA. While there are no comparable DTI studies among youth samples, this finding aligns with a study of young women with past CD, where alterations in the corpus callosum body and genu were found to be specifically associated with CD after accounting for maltreatment history and comorbidities (Lindner et al., Reference Lindner, Savic, Sitnikov, Budhiraja, Liu, Jokinen, Tiihonen and Hodgins2016). This earlier study reported effects in the opposite direction (i.e., lower AD), which may be due to the all-female sample they included, while our results suggest this difference was primarily driven by males. Alternatively, this discrepancy may be due to the age difference between the samples, as lower FA or AD in the corpus callosum has been consistently reported in adults with antisocial personality disorder (Jiang et al., Reference Jiang, Shi, Liu, Li, Ding, Shen, Shen, Lee, Hu, Wang and Shen2017; Sundram et al., Reference Sundram, Deeley, Sarkar, Daly, Latham, Craig, Raczek, Fahy, Picchioni, Barker and Murphy2012). In healthy development, FA values in the corpus callosum peak between the ages of 21 and 35 (Lebel et al., Reference Lebel, Gee, Camicioli, Wieler, Martin and Beaulieu2012), and the well-replicated finding of elevated FA among youth with CD is thought to reflect a pattern of accelerated maturation followed by accelerated degeneration (Menks et al., Reference Menks, Furger, Lenz, Fehlbaum, Stadler and Raschle2017; Passamonti et al., Reference Passamonti, Fairchild, Fornito, Goodyer, Nimmo-Smith, Hagan, Calder and de Erausquin2012; Sarkar et al., Reference Sarkar, Dell’Acqua, Froudist Walsh, Blackwood, Scott, Craig, Deeley, Murphy and Yap2016). While this hypothesis is also in line with the lower FA values reported among adults with antisocial personality disorder, longitudinal studies are needed to empirically test the theory. Our findings suggest that any study of this kind should stratify the sample according to the absence or presence of a history of maltreatment or abuse, as only the CD subgroup without a history of CPA/CSA may display atypical corpus callosum development.
The CD/+ subgroup did not exhibit white matter microstructure alterations in the corpus callosum compared to controls or CD/− youth, contrary to our predictions that they would have lower FA in this tract. Corpus callosum alterations have previously been reported among individuals with histories of maltreatment (Teicher et al., Reference Teicher, Samson, Anderson and Ohashi2016). However, this research has largely focused on those with post-traumatic stress disorder (PTSD) diagnoses. Reduced FA of the corpus callosum has been consistently reported in this population, regardless of maltreatment experience (Dennis et al., Reference Dennis, Disner, Fani, Salminen, Logue, Clarke, Haswell, Averill, Baugh, Bomyea, Bruce, Cha, Choi, Davenport, Densmore, du Plessis, Forster, Frijling, Gonenc and Morey2021; Ju et al., Reference Ju, Ou, Su, Averill, Liu, Wang, Wang, Zhang, Liu, Li and Abdallah2020). As only one-third of maltreated youth go on to develop PTSD (Widom, Reference Widom1999), studies of other maltreatment-related psychiatric disorders are needed. Additionally, previous neuroimaging studies of maltreatment have often focused on white matter volume rather than microstructure or used region-of-interest rather than whole-brain analysis approaches, which differ in terms of their spatial precision and their ability to detect subtle neurostructural differences (Daniels et al., Reference Daniels, Lamke, Gaebler, Walter and Scheel2013; Lim et al., Reference Lim, Howells, Radua and Rubia2020; Mackes et al., Reference Mackes, Mehta, Beyh, Nkrumah, Golm, Sarkar, Fairchild, Dell’Acqua, Sonuga-Barke and Team2022; Teicher et al., Reference Teicher, Gordon and Nemeroff2022). These methodological differences could further explain this inconsistency. Beyond these considerations, it is possible that the null findings observed here may be due to the small sample size of the CD/+ group (n = 39) impacting our statistical power to detect effects (Button et al., Reference Button, Ioannidis, Mokrysz, Nosek, Flint, Robinson and Munafo2013). Furthermore, more pronounced maltreatment-related alterations in white matter microstructure are often observed in males (De Bellis et al., Reference De Bellis, Keshavan, Clark, Casey, Giedd, Boring, Frustaci and Ryan1999; Teicher et al., Reference Teicher, Gordon and Nemeroff2022), but the CD/+ group only included a small number of males (n = 15). These results therefore require replication in larger samples.
In line with the ecophenotype hypothesis, the CD subgroups with versus without a history of CPA/CSA significantly differed from each other. Specifically, the CD/+ subgroup had higher AD in the right superior longitudinal fasciculus, a tract which is implicated in attention and executive functions (Janelle et al., Reference Janelle, Iorio-Morin, D’amour and Fortin2022; Vestergaard et al., Reference Vestergaard, Madsen, Baaré, Skimminge, Ejersbo, Ramsøy, Gerlach, Åkeson, Paulson and Jernigan2011). Inconsistent findings have been found for this tract in CD (Decety et al., Reference Decety, Yoder and Lahey2015; Haney-Caron et al., Reference Haney-Caron, Caprihan and Stevens2014; Li et al., Reference Li, Mathews, Wang, Dunn and Kronenberger2005), and similarly both higher (Daniels et al., Reference Daniels, Lamke, Gaebler, Walter and Scheel2013; Park et al., Reference Park, Lee, Kim, Kwon, Cho, Han, Cheong and Kim2016) and lower (Benedetti et al., Reference Benedetti, Bollettini, Radaelli, Poletti, Locatelli, Falini, Smeraldi and Colombo2014; Choi et al., Reference Choi, Jeong, Rohan, Polcari and Teicher2009; Govindan et al., Reference Govindan, Behen, Helder, Makki and Chugani2010; Huang et al., Reference Huang, Gundapuneedi and Rao2012) FA values in the superior longitudinal fasciculus have been reported among maltreated samples. Teicher and colleagues (2016) proposed that the role of the superior longitudinal fasciculus in connecting prefrontal and temporal regions may support the modulation of threat responses, suggesting that lower connectivity in this tract could reflect an adaptive modification (i.e., to attenuate the effects of repeated abuse exposure and reduce distress). However, higher connectivity (as found here) could also be adaptive for maltreated youth, as it may enable them to rapidly detect and respond to threats. This aligns with perceptual biases towards early threat detection that have been observed among maltreated youth (Pollak et al., Reference Pollak, Messner, Kistler and Cohn2009; Wade et al., Reference Wade, Wright and Finegold2022), although the role of the superior longitudinal fasciculus in these processes requires further investigation. Overall, despite sharing the same diagnosis, the CD/+ and CD/− subgroups presented with distinct microstructural alterations within the superior longitudinal fasciculus.
The sex-stratified analyses suggested that the corpus callosum alterations found in the CD-all and CD/− groups in the mixed-sex analyses were mainly driven by the presence of males with CD/−. Conversely, females with CD (regardless of CPA/CSA history) displayed lower RD and MD within the fornix, a region which was not found in the mixed-sex analyses. These findings highlight the need for further investigations of white matter alterations in females with CD, as existing research is overwhelmingly based on all-male or predominantly male samples and consequently little is known about the neurobiological mechanisms of this disorder in females (Freitag et al., Reference Freitag, Konrad, Stadler, De Brito, Popma, Herpertz, Herpertz-Dahlmann, Neumann, Kieser, Chiocchetti, Schwenck and Fairchild2018). When split by CPA/CSA history, both the male and female CD/+ subgroups did not differ from controls or their CD/− counterparts. This may suggest that the CD/+ versus CD/− subgroup differences in our mixed-sex sample are not robust, but could equally be due to the reduced sample size in the sex-stratified analyses. In contrast, the CD/− males and females differed from sex-matched controls in distinct ways; while the male CD/− subgroup exhibited higher FA in the corpus callosum, the female CD/− subgroup had lower FA in the posterior and superior corona radiata. These sex-specific alterations could reflect or give rise to sex differences in the clinical presentation of CD (e.g., male-specific alterations in the corpus callosum could relate to physical aggression being more commonly elevated among CD boys; Berkout et al., Reference Berkout, Young and Gross2011). While the results of the sex-stratified analyses should be considered preliminary, they highlight the importance of examining whether sex and abuse or maltreatment interact in future research and in larger samples.
We also note that adjusting for IQ, attention problems, and SES rendered some of the identified group differences non-significant. For instance, FA differences in the corpus callosum were the least robust across the different sensitivity analyses. CD is robustly associated with low IQ (Piotrowska et al., Reference Piotrowska, Stride, Croft and Rowe2015) and low SES (Murray & Farrington, Reference Murray and Farrington2010), and is highly comorbid with ADHD (Angold et al., Reference Angold, Costello and Erkanli1999), and investigating which effects are specific to CD is important. However, unadjusted results may be more representative of clinical reality (Fairchild et al., Reference Fairchild, Toschi, Hagan, Goodyer, Calder and Passamonti2015), as controlling for these factors may also remove effects associated with CD. Additionally, the reduced sample sizes in our sensitivity analyses may have impacted results (because data on these variables were missing for some participants). Notably, the difference between the CD/+ and CD/− subgroups in the superior longitudinal fasciculus was robust to all adjustments, strengthening our conclusions about subgroup or subtype differences and supporting the idea that the ecophenotype hypothesis applies to CD.
Contrary to predictions, we did not observe differences between CD youth and controls in the uncinate fasciculus, which connects the orbitofrontal cortex and the anterior temporal lobe and amygdala (Catani & Thiebaut De Schotten, Reference Catani and Thiebaut De Schotten2012). This may be because previous studies used region-of-interest approaches, which can detect more subtle differences in specific tracts due to increased power (Smith et al., Reference Smith, Jenkinson, Johansen-Berg, Rueckert, Nichols, Mackay, Watkins, Ciccarelli, Cader, Matthews and Behrens2006). Indeed, group differences in the uncinate fasciculus identified using region-of-interest approaches rarely replicate in whole-brain analyses (Menks et al., Reference Menks, Furger, Lenz, Fehlbaum, Stadler and Raschle2017; Rogers et al., Reference Rogers, Gonzalez-Madruga, Kohls, Baker, Clanton, Pauli, Birch, Chowdhury, Kirchner, Andersson, Smaragdi, Puzzo, Baumann, Raschle, Fehlbaum, Menks, Steppan, Stadler, Konrad and Brito2019; Sarkar et al., Reference Sarkar, Dell’Acqua, Froudist Walsh, Blackwood, Scott, Craig, Deeley, Murphy and Yap2016), potentially because the latter involves a stringent correction for multiple comparisons.
Our findings have important implications for our understanding of the etiology and neurobiology of CD. To summarize, CD youth with and without CPA/CSA histories differed from one another in white matter microstructure, and alterations in the corpus callosum observed among the combined CD group relative to controls appeared to be driven by the subgroup without a history of CPA/CSA (especially the CD/− males). This is consistent with the idea that maltreatment-related CD constitutes an ecophenotypic (i.e., environmentally-mediated) variant of CD with distinct neurobiological features (Teicher et al., Reference Teicher, Samson, Anderson and Ohashi2016). An interesting pattern emerges when comparing our findings to those obtained for cortical structure using surface-based morphometry methods. A prior study from our group, based on an overlapping sample, found that the abused CD subgroup exhibited more widespread cortical structure alterations relative to controls (Staginnus et al., Reference Staginnus, Cornwell, Toschi, Oosterling, Paradysz, Smaragdi, González-Madruga, Pauli, Rogers, Bernhard, Martinelli, Kohls, Raschle, Konrad, Stadler, Freitag, De Brito and Fairchild2023). We found the opposite pattern here: white matter alterations relative to controls were exclusively found in the CD/− subgroup, and were not present in the CD/+ subgroup. Youth with CD and a history of CPA/CSA may therefore be characterized by widespread abnormalities in cortical structure, but not in the structural connections between these regions. Taken together, these findings may suggest that one pathway to developing CD could be via maltreatment experiences (such as CPA/CSA) which impact the development of cortical structure, leading to problems that ultimately manifest as CD. The alterations in white matter microstructure observed in the CD/− subgroup may have different origins (for instance, genetic influences) which may constitute an alternative pathway to the same disorder. This hypothesis could be tested in prospective longitudinal studies, and future research could also examine genetic influences on cortical regions and white matter pathways implicated in CD and how these relate to different (eco-)phenotypic profiles within the disorder (e.g., see Pretzsch et al., Reference Pretzsch, Arenella, Lerch, Lombardo, Beckmann, Schaefer, Leyhausen, Gurr, Bletsch, Berg, Seelemeyer, Floris, Oakley, Loth, Bourgeron, Charman, Buitelaar, McAlonan, Murphy and Zwiers2024, for an application of this approach in autism). Our results suggest that attempting to identify neurobiological correlates of CD without considering the potential impact of abuse or maltreatment may lead to conflicting results and replication failures (Teicher et al., Reference Teicher, Gordon and Nemeroff2022) – as has been the case in previous studies of white matter microstructure in CD. More broadly, our findings highlight the importance of considering different developmental pathways to CD (i.e., equifinality) (Cicchetti & Rogosch, Reference Cicchetti and Rogosch1996), and recognizing maltreatment as a potentially meaningful specifier or subtype of CD, as has been proposed by Teicher et al. (Reference Teicher, Gordon and Nemeroff2022) for other psychiatric disorders. Future research is needed to examine whether clinical and neuropsychological differences are also observed between these CD subgroups, which would further support the inclusion of abuse or maltreatment as a diagnostic specifier in future editions of the DSM.
It is worth highlighting two differences in the characteristics of the CD/+ and CD/− subgroups included in the current study. First, while the combined CD group had a fairly even sex distribution, the CD/− subgroup included more males (n = 37) than the CD/+ subgroup (n = 15), resulting in a higher proportion of females in the CD/+ subgroup. Notably, adverse childhood experiences, and particularly sexual abuse, are sometimes reported as more common among females than males (e.g., Mersky et al., 2015; Stoltenborgh et al., Reference Stoltenborgh, Bakermans‐Kranenburg, Alink and van IJzendoorn2015). When stratifying by sex, the difference in AD within the superior longitudinal fasciculus between the CD subgroups was no longer observed, which may suggest that when this difference was observed in the mixed-sex sample it was influenced by the higher proportion of females in the CD/+ subgroup. Nevertheless, we adjusted for sex in all analyses and would therefore argue that this finding is likely due to reduced power in the sex-stratified analyses, and requires replication in larger samples. Secondly, the CD/− subgroup had significantly higher scores on the callous-unemotional traits subscale of the YPI relative to the CD/+ subgroup. Some prior research suggests that CU traits are associated with white matter alterations in CD youth, with Puzzo et al. (Reference Puzzo, Seunarine, Sully, Darekar, Clark, Sonuga-Barke and Fairchild2018) finding that CD youth with high CU traits exhibited higher FA in the corpus callosum and superior longitudinal fasciculus compared to those with lower levels of CU traits. Similarly, in an overlapping sample to the one used in the present study, Rogers et al. (Reference Rogers, Gonzalez-Madruga, Kohls, Baker, Clanton, Pauli, Birch, Chowdhury, Kirchner, Andersson, Smaragdi, Puzzo, Baumann, Raschle, Fehlbaum, Menks, Steppan, Stadler, Konrad and Brito2019) identified CU traits as the strongest predictor of higher AD in the corpus callosum. It is therefore possible that the results observed in the present study may be related to CU traits, rather than CPA/CSA history. However, we note that CU traits were measured with both the self-report YPI and the parent/caregiver-report ICU. The combined CD group showed significantly higher CU traits relative to controls across both measures (as expected), but the pattern was less clear when comparing the CD subgroups, with the CD/− group showing higher YPI scores, and the CD/+ group showing higher ICU scores (though not significantly so). Notably, both CD subgroups had significantly higher CU traits than healthy controls, irrespective of the measure used, and it therefore appears unlikely that the alterations displayed by the CD/− subgroup relative to controls are explained solely by differences in (self-reported) CU traits. Accounting for CU traits as an additional covariate in the analyses was beyond the scope of the present study, but given our findings on the importance of CPA/CSA history, and those of previous studies focusing on CU traits, we recommend that future research with larger samples seek to elucidate these relationships.
This study had several strengths. It is the first to investigate the impact of CPA/CSA on white matter microstructure among youth with CD, which was possible due to the relatively large and clinically well-characterized sample. Our unbiased, whole-brain TBSS analysis was a conservative approach suitable for this exploratory research question and our white matter microstructural findings are therefore corrected for multiple comparisons across the entire white matter segment of the brain. Additionally, we were able to explore effects within each sex, which is rare in the CD literature that still predominantly focuses on males (Freitag et al., Reference Freitag, Konrad, Stadler, De Brito, Popma, Herpertz, Herpertz-Dahlmann, Neumann, Kieser, Chiocchetti, Schwenck and Fairchild2018).
A number of limitations should also be noted. First, while our overall sample size makes this the second largest DTI study of CD to date, the number of CD/+ participants included was relatively small, and our sex-stratified analyses included only 15 CD/+ males. Recent evidence suggests that our analyses may not have been adequately powered to detect subtle effects (Marek et al., Reference Marek, Tervo-Clemmens, Calabro, Montez, Kay, Hatoum, Donohue, Foran, Miller, Hendrickson, Malone, Kandala, Feczko, Miranda-Dominguez, Graham, Earl, Perrone, Cordova, Doyle and Dosenbach2022), and replication in larger samples is therefore required. Relatedly, there were too few HCs with a history of CPA/CSA to allow us to investigate the effects of abuse in general (i.e., present in both HC and CD youth), versus the differences between abused and non-abused CD youth specifically (i.e., the ecophenotype hypothesis). However, these analyses could be difficult to interpret as differences could be related to CPA/CSA exposure or reflect resilience effects in the control group (e.g., see Cornwell et al., Reference Cornwell, Toschi, Hamilton-Giachritsis, Staginnus, Smaragdi, Gonzalez-Madruga, Rogers, Martinelli, Kohls, Raschle, Konrad, Stadler, Freitag, De Brito and Fairchild2023, Reference Cornwell, Toschi, Hamilton-Giachritsis, Staginnus, Smaragdi, Gonzalez-Madruga, Mackes, Rogers, Martinelli, Kohls, Raschle, Konrad, Stadler, De Brito and Fairchild2024). Secondly, we performed many statistical comparisons and while we corrected for the multiplicity of tests within each diffusion measure, we did not correct across the four different diffusion measures (i.e., for all tests across AD, RD, MD, and FA). However, TBSS is a conservative analysis technique, and when used in combination with non-parametric permutations and FWE-correction, this should protect against spurious findings (Decety et al., Reference Decety, Yoder and Lahey2015; Haney-Caron et al., Reference Haney-Caron, Caprihan and Stevens2014; Menks et al., Reference Menks, Furger, Lenz, Fehlbaum, Stadler and Raschle2017; Puzzo et al., Reference Puzzo, Seunarine, Sully, Darekar, Clark, Sonuga-Barke and Fairchild2018; Rogers et al., Reference Rogers, Gonzalez-Madruga, Kohls, Baker, Clanton, Pauli, Birch, Chowdhury, Kirchner, Andersson, Smaragdi, Puzzo, Baumann, Raschle, Fehlbaum, Menks, Steppan, Stadler, Konrad and Brito2019; Wang et al., Reference Wang, Horst, Kronenberger, Hummer, Mosier, Kalnin, Dunn and Mathews2012). Third, diffusion measures can be impacted by other factors (e.g., fiber crossing, tract coherence, etc.) which may be unrelated to white matter “integrity” (Jones et al., Reference Jones, Knösche and Turner2013), so future research using advanced techniques such as spherical deconvolution is needed to confirm our findings (see González-Madruga et al., Reference González-Madruga, Rogers, Toschi, Riccelli, Smaragdi, Puzzo, Clanton, Andersson, Baumann, Kohls, Raschle, Fehlbaum, Menks, Stadler, Konrad, Freitag, De Brito, Sonuga-Barke and Fairchild2020 for an example of such an approach). Fourth, several considerations must be noted in relation to our measure of abuse/maltreatment. The CBE is a retrospective caregiver interview, which may have impacted our grouping strategy if parents or caregivers were unaware that their child had been abused or unwilling to admit this – perhaps because they were concerned about the consequences of disclosing abuse. Additionally, by treating CPA/CSA as a dichotomous variable (present vs. absent), we were unable to explore how the type, timing and severity of abuse influences neurobiological outcomes. Such factors have been shown to relate to brain structure and function in a range of other psychiatric disorders (Cassiers et al., Reference Cassiers, Sabbe, Schmaal, Veltman, Penninx and Van Den Eede2018; McLaughlin & Sheridan, Reference McLaughlin and Sheridan2016; Ohashi et al., Reference Ohashi, Anderson, Khan, Rohan, Bolger, McGreenery and Teicher2022; Teicher et al., Reference Teicher, Gordon and Nemeroff2022), but to date have not been explored in relation to CD. Relatedly, although the CBE explicitly asks about physical and sexual abuse (with separate items asking about each form of abuse), and we have referred to “CPA/CSA” rather than “maltreatment” throughout the paper, the interview also allows for other disclosures which cover a broader range of adverse experiences and types of maltreatment. Some participants in the CD/+ subgroup may therefore have been classified as being positive for childhood maltreatment but may not have been physically or sexually abused. Future research is needed using measures which are more sensitive to a range of types of maltreatment and adversities, especially continuous measures such as the Childhood Trauma Questionnaire which capture variations in severity of abuse and neglect. Finally, the categories of probable and definite maltreatment from the CBE were combined in this study, meaning that in some cases parents may have had concerns that CPA/CSA occurred but did not have concrete evidence that this was the case.
In conclusion, this study provides evidence that the ecophenotype hypothesis applies to white matter microstructural alterations observed in CD youth. Despite sharing similar clinical profiles, CD youth with versus without CPA/CSA histories displayed distinct alterations within the superior longitudinal fasciculus tract, and alterations within the corpus collosum appeared to be specific to the non-abused CD/− subgroup. Interestingly, there were no significant differences in white matter microstructure between the CD/+ youth and healthy controls, which is the opposite pattern to what was observed previously for cortical structure, using an overlapping sample. Sex-stratified analyses suggested that the CD/− males and females showed distinct white matter alterations when compared to sex-matched healthy controls – in different white matter tracts and in opposite directions. These results highlight the importance of considering both abuse/maltreatment history and sex in future neuroimaging studies of CD and other psychiatric disorders. Our study also has implications for the proposal that maltreatment should be included as a specifier for CD and other disorders in future editions of the DSM and ICD. Future research should examine trajectories of white matter development in CD/+ and CD/− youth, consider the impact of type, timing, and severity of maltreatment or abuse, and clarify the functional consequences of microstructural alterations in these white matter tracts, especially the corpus callosum, which has been consistently implicated in CD.
Supplementary material
The supplementary material for this article can be found at https://doi.org/10.1017/S0954579425000367.
Data availability statement
Researchers interested in using FemNAT-CD data should contact the Steering Committee to discuss their proposal. The Chair of the Steering Committee is Prof. Christine Freitag (c.freitag@em.uni-frankfurt.de).
Acknowledgements
We thank Kashish Jayeshkumar Gwalani for her help preprocessing the data and the young people and their families for taking part in the FemNAT-CD study. We also thank the other members of the FemNAT-CD Consortium for their help with data collection.
Preliminary results were presented at the Annual Meeting of the Society of Biological Psychiatry, 2023, and the International Congress of the European Society for Child and Adolescent Psychiatry, 2023.
Funding statement
This study was supported in part by Grant No. ES/P000630/1 for the South West Doctoral Training Partnership awarded to the Universities of Bath, Bristol, Exeter, Plymouth, and West of England from the Economic and Social Research Council (PhD studentships to ST and MS). The FemNAT-CD study was funded by the European Commission’s Seventh Framework Programme FP7/2007-2013 (Grant No. 602407 [coordinated by CMF]).
Competing interests
CS receives royalties for a book on aggression and receives funding from the Swiss National Science Foundation (100014_185408). CMF receives royalties for books on Attention-Deficit/Hyperactivity Disorder, Autism Spectrum Disorder, and Depression, and allowances for lectures on ASD and other mental health issues from public and private health care institutions. She has received consultation honoraria by the Institute for Quality and Efficiency in Health Care (Institut für Qualität und Wirtschaftlichkeit im Gesundheitswesen) for a patient/parent information brochure on Autism Spectrum Disorder (2023) and by the company IGES on a study evaluating staff regulations for standard psychiatric care in Germany (2024). SADB is supported by the Economic and Social Research Council (Grant ref: ES/V003526/1). EW is funded by UK Research and Innovation under the UK government’s Horizon Europe / ERC Frontier Research Guarantee [grant number EP/Y015037/1]. NMR receives funding from the Hochschulmedizin Zurich (HMZ, STRESS), the University of Zurich Research Priority Program “Adaptive Brain Circuits in Development and Learning (URPP AdaBD)” and the Swiss National Science Foundation (105314_207624). AB was funded by the Reiss Foundation Frankfurt am Main (grant no. EER-2101-0002, EER-2201-01). AB and GK are also funded by the Federal Ministry of Education and Research (Bundesministerium für Bildung und Forschung) as part of the German Center for Child and Adolescent Health (DZKJ) under the funding code 01GL2405B. All other authors report no biomedical financial interests or potential conflicts of interest.


 Open access