Protein–energy malnutrition is a global problem. Nearly 150 million children under 5 years of age in the world and 70–80 million in India suffer from protein–energy malnutrition. Protein deficiency is one of the important nutritional insults affecting the normal formation and maturation of the central nervous system. It is well known that a hypoproteic diet leads to low body weight and brain weight(Reference Del Angel-Meza, Ramirez-Cortes and Olver-Cortes1). The wide range of defects induced by protein deficiency on the brain includes reduction in brain weight and size(Reference Chopra and Sharma2), neuronal differentiation(Reference Zamenhof, Van Marthens and Gottlicb3), synaptic potentiation(Reference Austin, Bronzino and Morgane4), nerve myelination(Reference Montana-Rojas, Ferreira and Tenorio5), neurotransmitter production and decreased velocity of impulse conduction(Reference Chopra and Sharma2).
The developing brain is more sensitive to a wide range of adverse environmental factors including protein deficiency(Reference Barnes and Altman6–Reference Shambaugh, Lee and Watanabe8), and therefore protein deficiency during early development generates a different profile of defects compared with protein deficiency during adult life and can lead to permanent and long-lasting effects on the central nervous system. Protein deficiency also affects other brain structures, namely the cerebrum, brainstem and spinal cord; however, certain brain regions such as the cerebellum seem to be more affected than others due to malnutrition that occurs during the developmental stage(Reference Prasad9). Thus, the cerebellum is one of the important brain regions affected by early-life protein deficiency. This may be due to the fact that a large proportion of cerebellar maturation takes place postnatally(Reference Hatten, Alder and Zimmerman10), the relative immaturity of the cerebellum in utero may account for the greater deficit seen in this brain region following perinatal malnutrition(Reference Dobbing11). There are a number of studies on the effects of protein deficiency on cerebellar development. These defects include decreased number of synaptic spines and reduced complexity of dendritic branching in Purkinje cells (PC)(Reference McConnell and Berry12) as well as significant cell loss in different brain regions, with the cerebellum being the most affected(Reference Prasad9), and delay in the maturation of Bergmann glial cells with concomitant retardation in granular cell (GCL) migration(Reference Del Angel-Meza, Ramirez-Cortes and Olver-Cortes1).
Thus, there are a considerable number of previous studies that have reported defects induced by maternal protein deficiency on the developing cerebellum. However, one drawback of all these studies is that there are no data on whether these cerebellar defects are correlated with any deficits at a behavioural level. Therefore, for the first time, the present study reports the behavioural alteration observed following maternal protein deficiency and correlates it with cerebellar pathology.
Materials and methods
Generation of protein-deficient animals
Swiss albino female mice, 6–8 weeks old, were taken from an inbred colony at National Brain Research Centre, Haryana, India. The females were given either a control (CTL) feed (starch (50 %), sucrose (8 %), casein (24·2 %), cellulose (6 %), refined groundnut oil (7 %), mineral mixture (3·5 %), vitamin (1 %), l-cystine (0·3 %)) or a protein-deficient (PD) feed (starch (65·1 %), sucrose (10 %), casein (7·1 %), cellulose (6 %), refined groundnut oil (7 %), mineral mixture (3·5 %), vitamin mixture (1 %), l-cystine (0·3 %)) for the entire experimental duration. In the PD feed, protein content was reduced to 7 % compared with 17 % in the CTL group. Both feeds were purchased in powder form, from the National Institute of Nutrition (Hyderabad, India). The females were maintained either on the PD or CTL diet for 6 weeks. During this period, their body weights as well as their food intake were measured. The females were then kept for mating. The PD diet was continued throughout gestation as well as lactation. The pups (F1) were weaned on postnatal day 21 (P21). After weaning, pups from both groups were maintained on the CTL diet. All animals were maintained under specific pathogen-free conditions according to the National Brain Research Centre guidelines that follow the National Institutes of Health guidelines. All animal experiment protocols were approved by the Internal Animal Ethics Committee (NBRC/IAEC/2003/13).
In vivo bromodeoxyuridine labelling
Cell proliferation in the external granular layer (EGL) was assessed using the bromodeoxyuridine (BrdU) incorporation assay. BrdU, a thymidine analogue, was used to identify the cells in the S phase. The animals were injected with BrdU (100 μg/g body weight; Sigma, St Louis, MO, USA) intraperitoneally on P7 and P14. At 2 h after injection, the animals were killed.
Immunohistochemistry
The animals were perfused with PBS (1 × ; NaCl 8 g, KCl 0·2 g, Na2HPO4.2H2O, KH2PO4; all from Sigma) followed by 4 % paraformaldehyde in 0·1 m-PBS. Brains were fixed in 4 % paraformaldehyde in PBS for 12 h at 4°C, cryoprotected in 30 % sucrose in PBS and, after embedding in Tissue-Tek (Sakura, Tokyo, Japan), cut into 20 μm-thick sagittal sections on a cryostat (Leica, Heidelberg, Germany).
The sections were mounted and dried on gelatin-coated slides. The sections were washed in a wash buffer (0·05 % bovine serum albumin (BSA) in PBS (1 × )). Permeabilisation was done using 5 % BSA, 10 % normal goat serum and 0·5 % Triton X in PBS (1 × ). Blocking was done in 5 % BSA and 10 % normal goat serum for 1 h. The sections were stained for calbindin anti-mouse (Sigma) at dilution 1:2000 with a Texas red-tagged secondary antibody (1:100; Vector, Burlingame, CA, USA) in block solution or glial fibrillary acidic protein (GFAP; Dako, Glostrup, Denmark) at dilution of 1:1000 with an anti-rabbit (1:100) secondary antibody tagged with fluorescein (Vector). The sections were mounted in mounting medium containing 4′,6-diamidino-2-phenylindole (DAPI) (Vector). The S-phase BrdU-labelled cells were visualised using primary anti-mouse (Sigma) and secondary biotinylated anti-mouse antibodies (Vector) by 3,3′ diaminobenzidine (DAB) staining.
Nissl's staining with cresyl violet
Sections were rehydrated by graded ethanol treatment. The sections were dipped in cresyl violet solution (0·1 % thionin) for 3–5 min. Following dehydration in ethanol series, sections were cleared in xylene and mounted in DPX (BDH, Dublin, Republic of Ireland).
Cell counting
Cell counts were made on sagittal sections of the cerebella. Sections (20 μm thick) were cut from the entire cerebellum and cell counts were made on every third section. A total of approximately twenty-four sections from mid-sagittal to lateral cerebella were thus quantified. Within each section, three random fields were chosen in the anterior, central and posterior lobes of the cerebellum. The number of cells positive for a particular marker was counted in each random field. Thus, for each marker (calbindin, GFAP, BrdU and Nissl's), a total of 216 measurements were made for each animal. A mean value was obtained for each animal. There were five animals in each treatment group. The mean values plotted in the graph are the average values across the five animals. The cell counts were made under 20 × magnification and Image J software (National Institutes of Health, Bethesda, MD, USA) was used for counting. Counting was blinded with respect to the age and experimental group of the cerebellar sections.
Western blotting
To quantify calbindin protein levels, cerebellar lysates at P60 were subjected to Western blot analysis. Western blots were quantified using densitometric analysis with Image J software.
The cerebella were dissected and lysed in the lysis buffer (50 mm-Tris–Cl pH 7·5, 150 mm-NaCl, 1 mm-EDTA, 1 mm-ethylene glycol tetra-acetic acid, 50 mm-sodium fluoride, 1 mm-sodium orthovanadate, 1 mm-sodium butyrate, 2 % SDS) and a protease inhibitor cocktail (Roche Diagnostics, Mannheim, Germany).
Protein estimation was performed using bicinchoninic acid reagent (Sigma). An equal amount of samples was resolved on a discontinuous polyacrylamide gel consisting of a 12 % resolving gel and a 4 % stacking gel. Proteins were then transferred to a nitrocellulose membrane (Amersham Biosciences, Uppsala, Sweden). The membranes were incubated in the blocking buffer (3 % BSA in Tris-buffered saline with Tween-20 (TBST; 25 mm-Tris–Cl pH 7·5, 137 mm-NaCl, 2·7 mm-KCl and 0·1 % Tween 20)) for 1 h at room temperature followed by incubation with a glyceraldehyde 3-phosphate dehydrogenase antibody (Santacruz, Santa Cruz, CA, USA)/β-tubulin (Cell Signaling, Danvers, MA, USA)/calbindin (Sigma)/GFAP (Dako). After washing with TBST, the blots were incubated with the secondary antibody tagged with alkaline phosphatase (Vector) for 1 h. The blots were washed again with TBST, and signal was detected on the nitrocellulose membrane using the alkaline phosphatase enzyme assay with nitro blue tetrazolium (Sigma) and 5-bromo-4-chloro-3-indolyl phosphate (Sigma) as substrates. Calbindin and GFAP were normalised using β-tubulin and glyceraldehyde 3-phosphate dehydrogenase, respectively. Densitometric analysis was carried out using Image J software (National Institutes of Health).
Behavioural tests
In order to evaluate abnormalities in motor coordination, if any, two of the established motor tests, namely accelerating rotarod and footprint assays, were performed. Both behavioural protocols were performed at P60. Post-behavioural procedures, animals were killed and their brains were processed for different immunohistochemical analyses for P60 data.
Footprint analysis
Mouse paws were dipped in non-toxic water-based paints (fore-paws in red paint and hind-paws in black paint). Mice were then allowed to walk down an enclosed runway lined with white paper. On three separate days within 1 week, two trials were performed. From the middle portion of each run, five to six steps were measured for (1) hind-stride length and (2) fore-stride length. At least nine steps were measured for each mouse. Mean values were used for statistical analysis.
Rotarod test
The rotarod apparatus (Biocraft Scientific Systems, Agra, India) was used in the acceleration mode, with gradually increasing the speed from 5 to 25 rpm over a period of 5 min. The experimental paradigm involved a 2 d training period and a 3 d acquisition period. Mice were given three trials per d during the training period and two trials per d during the acquisition period. All trials were of 5 min, each with a 10 min inter-trial interval. The time for which the mouse stayed on the increasing speed rod was recorded. The mean values of all animals in a single trial were used for plotting the graphs and for statistical analysis.
Statistics
Brain-weight data were analysed using a paired t test. A repeated-measures ANOVA was used to measure the effect of PD on the number of BrdU-positive cells across the different folia. The Bonferroni post hoc test was used to compare the number of BrdU-positive cells between the CTL and PD groups for each of the lobules. There was no significant interaction of PD and the different folia on the BrdU measure, and data from all folia were pooled. A repeated-measures ANOVA was also used to estimate significance of latency measures across the trials. The Bonferroni post hoc test was used to compare the latency period in seconds across the trials between the CTL and PD groups. The unpaired t test was used to determine the statistical difference in EGL thickness, stride length and protein expression between the PD and CTL groups by Western blot. Calbindin protein levels were normalised to β-tubulin and GFAP levels were normalised to glyceraldehyde 3-phosphate dehydrogenase. For all other measures, a two-way ANOVA with age and treatment as two variables was used with the Bonferroni post hoc test. Data are expressed as mean values with their standard errors. Statistical significance was set at P < 0·05.
Results
F1 pups born to both groups (CTL and PD) did not show any difference in weight (data not shown). Further, the two groups did not differ in the quantity of food they ate. At P60, the two groups showed a difference in brain weight, although no difference was seen in cerebellar weights (Fig. 1(a)).
Maternal protein deficiency reduces a number of granular cells in the external granular layer (EGL) at postnatal day 7 (P7). (a) Effect of maternal protein malnourishment on total brain and cerebellar weights of F1 pups. The X-axis shows different parameters and Y-axis shows mean weight in mg. (b) Number of bromodeoxyuridine (BrdU)-positive cells in the cerebellum at P7. The X-axis shows different cerebellar areas, namely anterior (A), middle (M) and posterior (P), and the Y-axis shows the number of BrdU-positive cells/μm2 in the EGL. Values are means, with their standard errors represented by vertical bars (n 3, for both groups). *** Mean values were significantly different (P < 0·001). CTL (□), control; PD ( ), protein deficient.

Maternal protein deficiency affects number of granular cells at various developmental stages
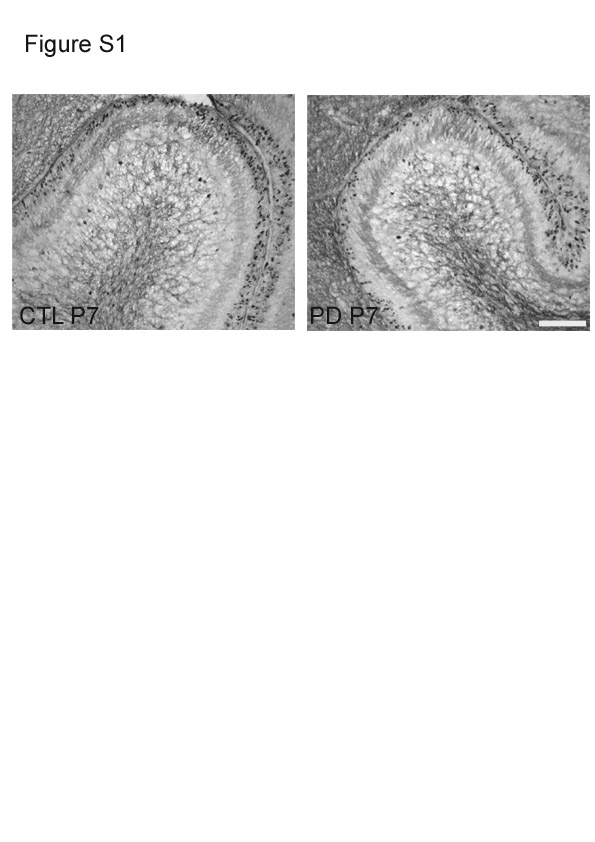
The number of BrdU-positive cells/μm2 in the EGL showed a significant difference (P < 0·001) between the CTL and PD groups at P7 (Fig. 1(b)). There was a significant reduction in the number of BrdU-positive cells in the PD group in all the regions of the cerebellum, anterior, middle and posterior, in both gyri and sulci compared with the CTL group. Fig. S1 of the supplementary material (available online at http://www.journals.cambridge.org/bjn) shows representative images of BrdU-positive cells in the cerebella of the CTL and PD groups at P7. However, by P14, significant differences in the number of BrdU-positive cells were seen only in the middle and posterior gyri regions (Fig. 2(a)).
Maternal protein deficiency reduces the external granular layer (EGL) thickness and the number of bromodeoxyuridine (BrdU)-positive cells in the EGL at postnatal day 14 (P14). (a) Number of BrdU-positive cells in the different cerebellar areas, anterior (A), middle (M) and posterior (P), in both gyri and sulci at P14. Gyri of the M and P lobes in the cerebellum of protein-deficient (PD, ) animals show a significant reduction in BrdU-positive cells when compared with those of the control (CTL, □). (b) Reduced EGL thickness in PD animals at P14. Values are means, with their standard errors represented by vertical bars (n 5, for each group). Mean values were significantly different: *P < 0·05, **P < 0·01.

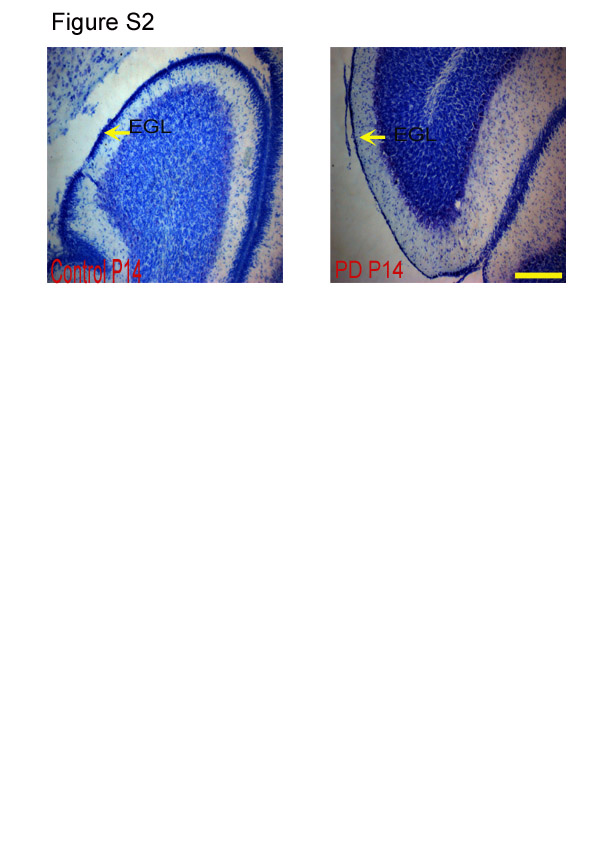
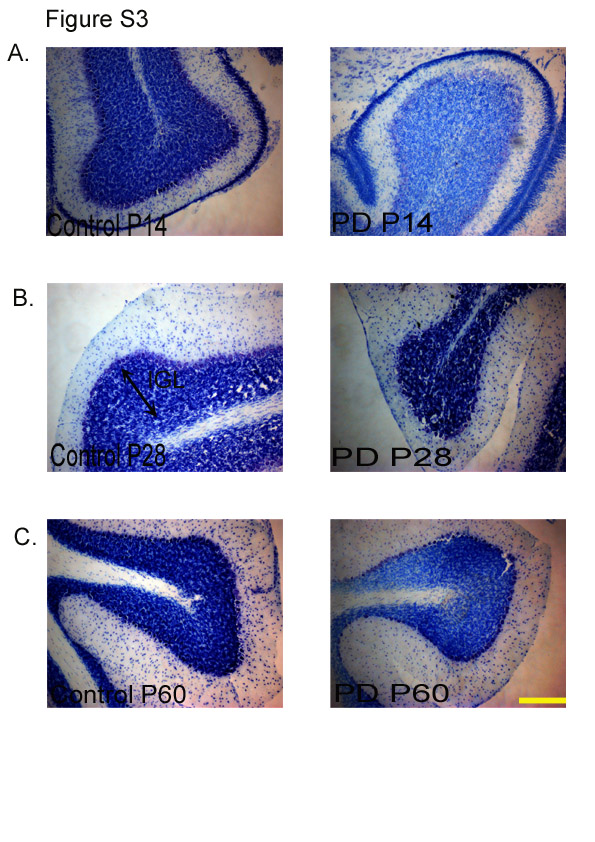
The EGL in PD animals showed a reduction in thickness when compared with the CTL group (P < 0·001; Fig. 2(b); see Fig. S2 of the supplementary material, available online at http://www.journals.cambridge.org/bjn). Deficits in the cell proliferation of the EGL, as measured by BrdU, are expected to have an effect on the internal granular layer (IGL), and therefore the number of Nissl's positive cells in this layer was counted. The region right underneath the Purkinje layer was considered as the IGL(Reference Paxinos and Watson13). It was observed that the number of cells in the IGL was significantly less in the cerebella of the PD group when compared with that of the CTL group examined at all ages (P < 0·001; Fig. 3). Representative images of Nissl's stained cerebellar sections at different developmental stages (P14, P28 and P60) are shown in Fig. S3 of the supplementary material (available online at http://www.journals.cambridge.org/bjn).
Internal granular layer (IGL) shows a reduction in the number of Nissl's positive granular cells (GCL) following protein malnourishment. Number of GCL stained with Nissl's staining in the internal granular layer of the cerebella of control (CTL, □) and protein-deficient (PD, ) animals at different developmental stages (P14, P28 and P60). The X-axis shows the age of animals and the Y-axis shows the number of Nissl's positive GCL/μm2. Values are means, with their standard errors represented by vertical bars (n 5, for each group). *** Mean values were significantly different (P < 0·001). P14, postnatal day 14; P28, postnatal day 28; P60, postnatal day 60.

Maternal protein deficiency reduces the number of calbindin-positive Purkinje cells in F1 pups
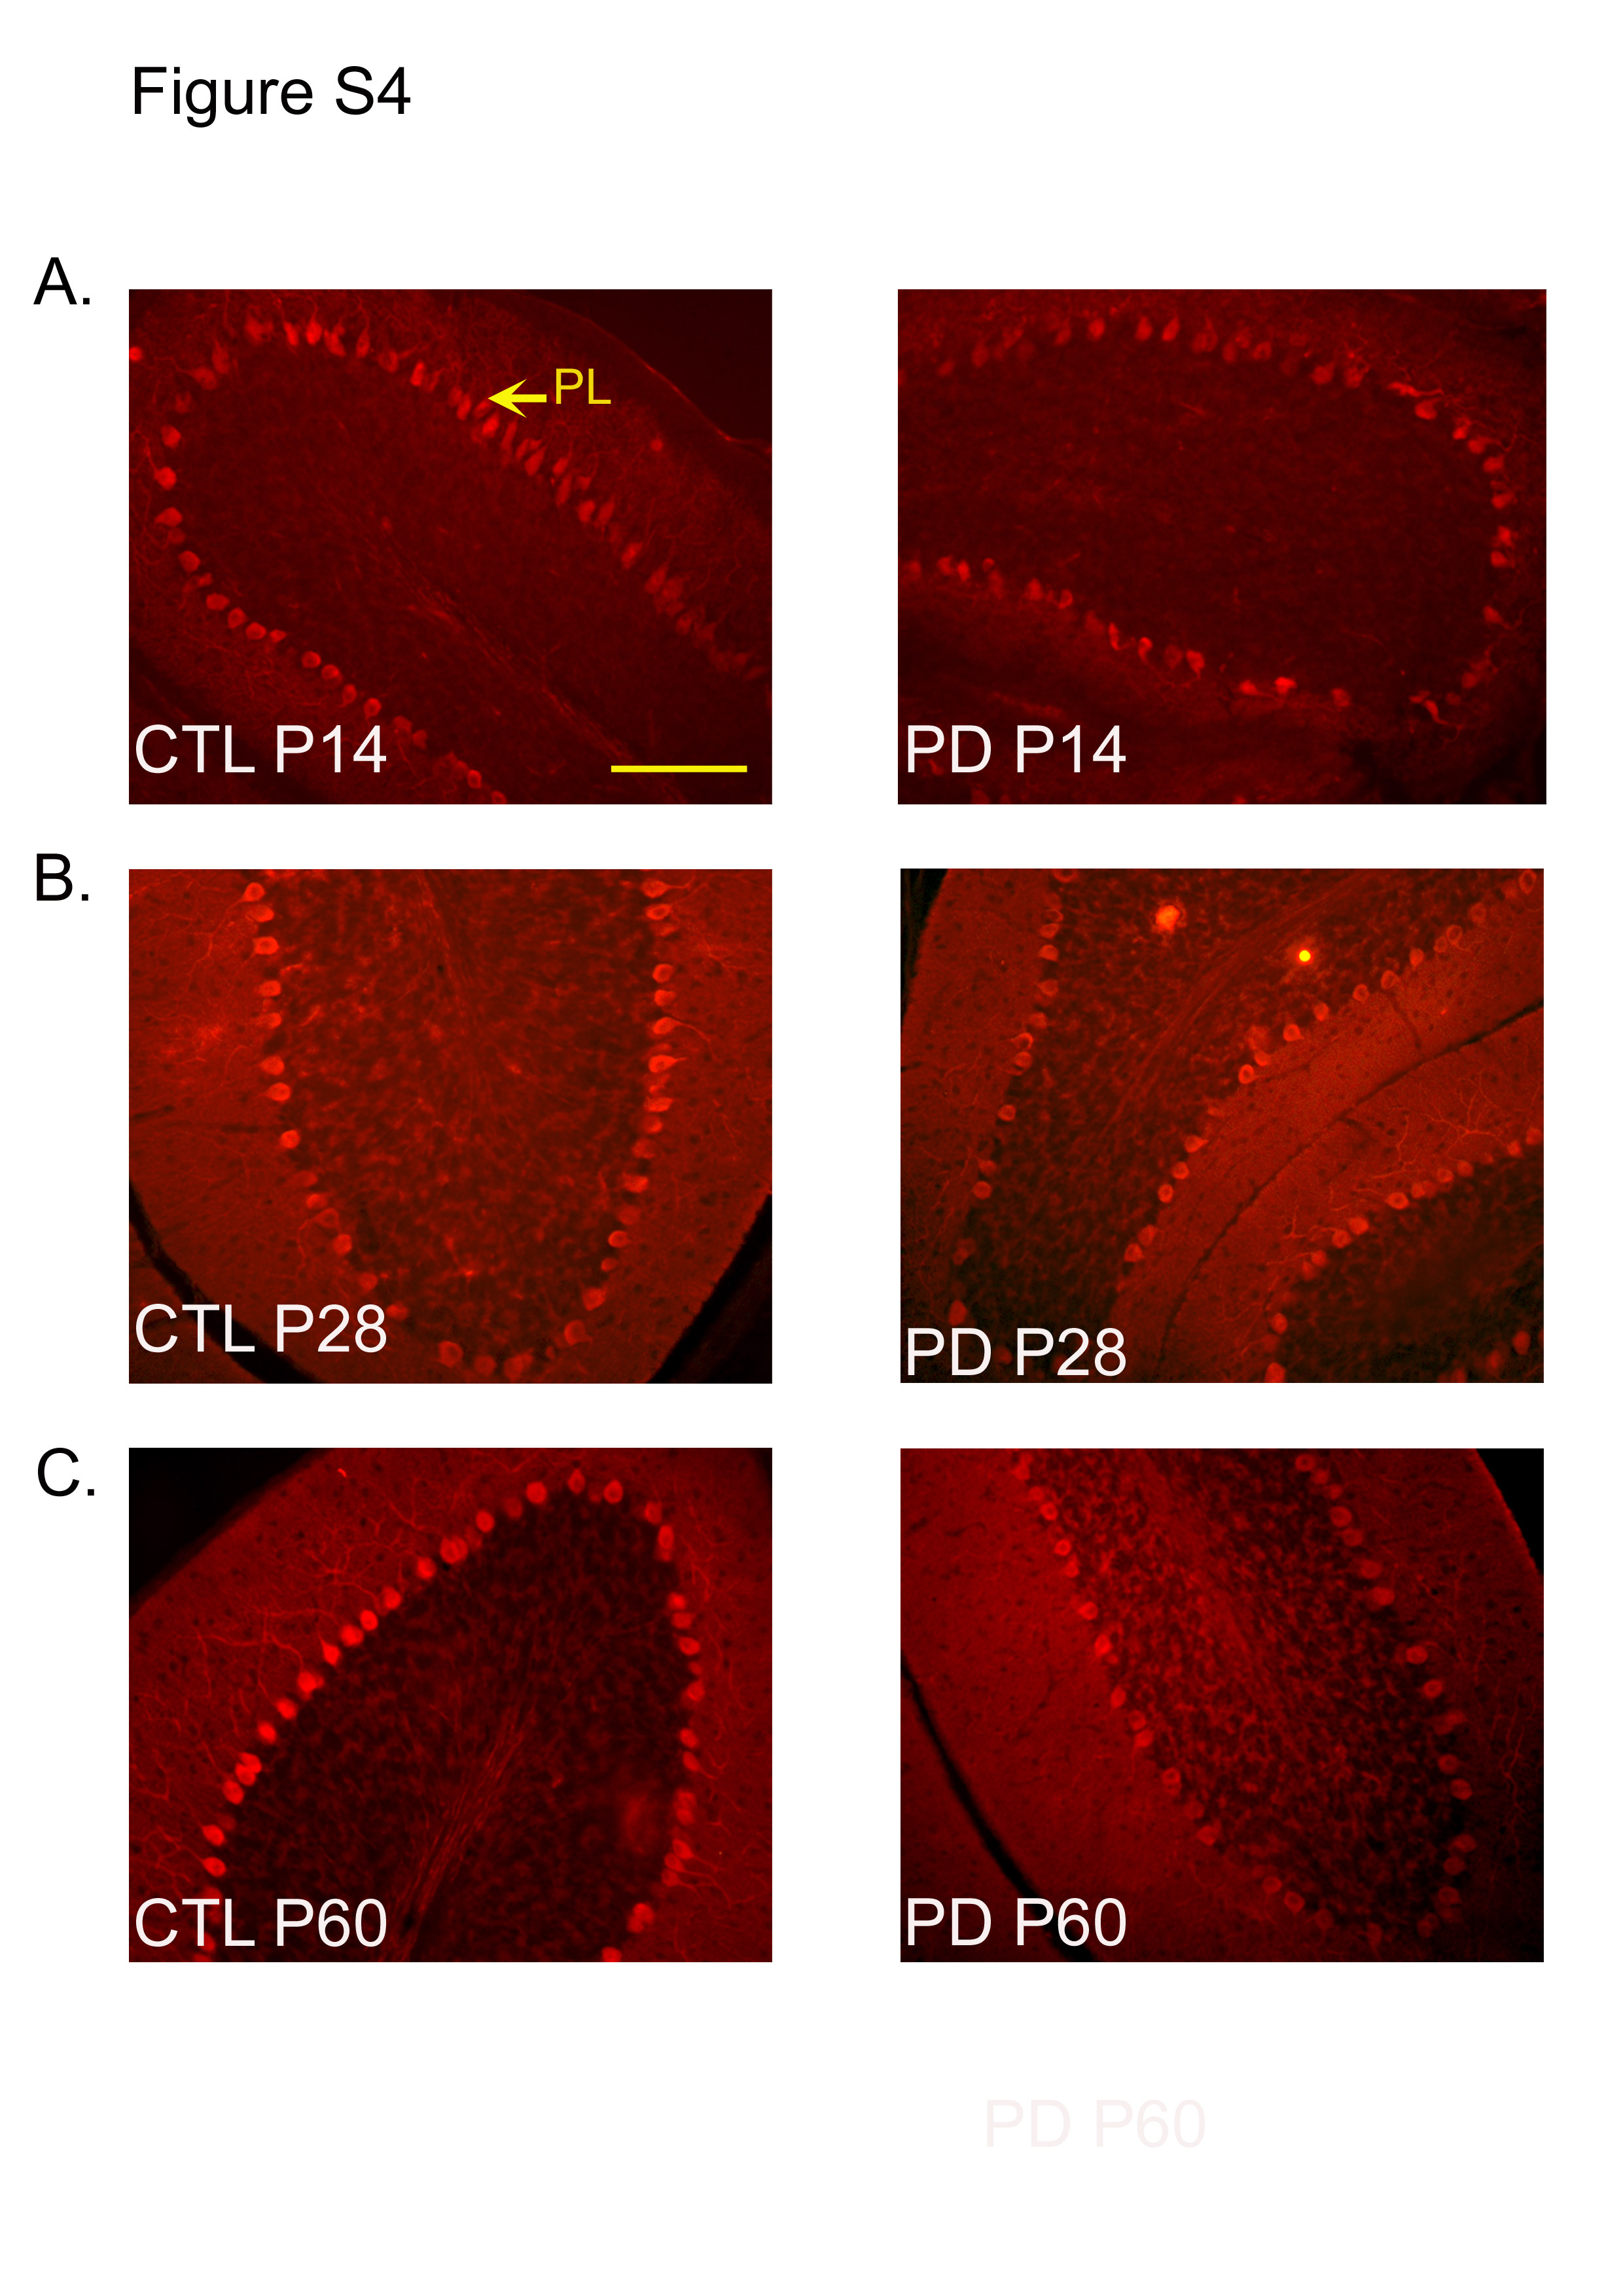
The number of calbindin-positive cells was significantly different between the PD and CTL groups at P14, P28 and P60 (P < 0·001; Fig. 4). Representative images of calbindin-stained sections at each of the ages for the PD and CTL groups are shown in Fig. S4(a)–(c) of the supplementary material (available online at http://www.journals.cambridge.org/bjn). These representative images were taken from the posterior cerebellar lobe.
Maternal protein deficiency (PD, ) reduces the number of calbindin-positive Purkinje cells. Number of calbindin-positive cells in the Purkinje layer of cerebellar folds. The X-axis shows the age and the Y-axis shows the mean number of calbindin-positive cells/μm Purkinje layer. Values are means, with their standard errors represented by vertical bars (n 5, for each group at all ages). *** Mean values were significantly different (P < 0·001). CTL (□), control.

The lobe-wise (i.e. anterior, central and posterior) comparison of the cerebella between the PD and CTL groups was also made. This analysis showed no significant lobe-wise differences (data not shown).
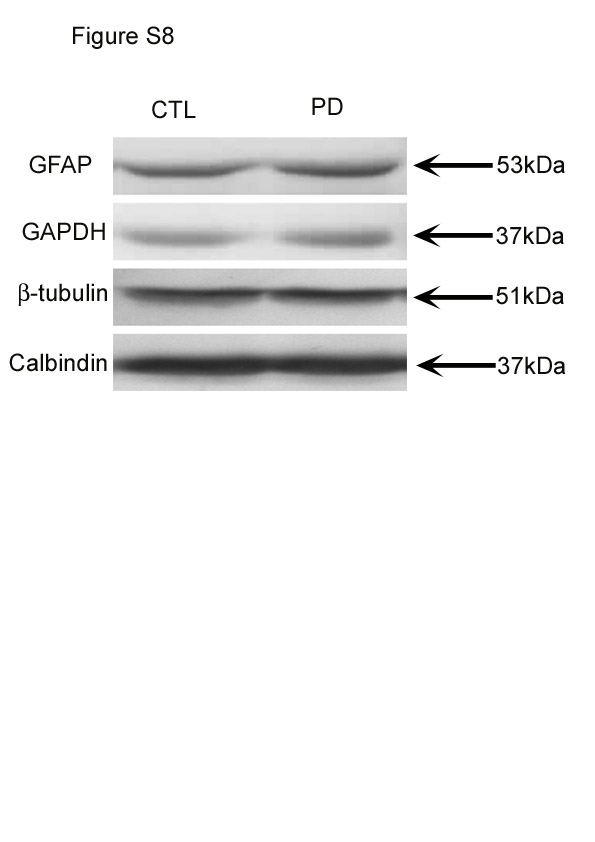
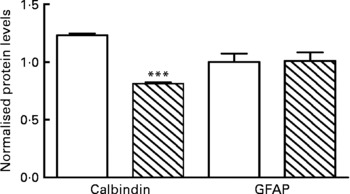
Calbindin protein levels were normalised to those of β-tubulin. Results showed that there was a significant difference in the level of calbindin in PD mice compared with CTL mice (P < 0·001; Fig. 5). Representative Western blots are shown in Fig. S8 of the supplementary material (available online at http://www.journals.cambridge.org/bjn).
Protein deficiency (PD, ) reduces calbindin expression in the cerebella. Graph showing changes in the expression levels of calbindin and glial fibrillary acidic protein (GFAP) as estimated by densitometric analysis. No change in expression level was seen for GFAP in PD mice compared with the control (CTL, □). Calbindin shows a 20 % reduction. Quantification was done using Image J software. *** Mean values were significantly different (P < 0·001).
Maternal protein deficiency does not alter the number of glial fibrillary acidic protein-positive cells at later stages (P28 and P60)
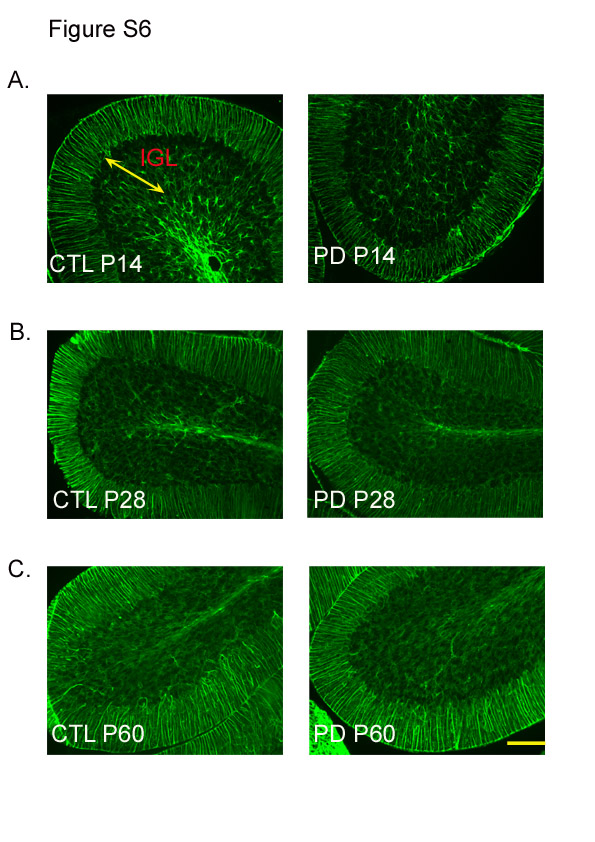
At P14, the cerebella of the PD group showed a significantly less number of Bergmann glial fibres compared with that of the CTL group (P < 0·05). This difference disappeared at P28 and P60 (Table 1; see Fig. S6(a)–(c) of the supplementary material, available online at http://www.journals.cambridge.org/bjn).
(Mean values with their standard errors)
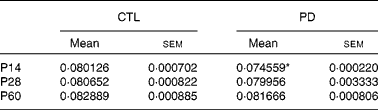
P14, postnatal day 14; P28, postnatal day 28; P60, postnatal day 60.
* Mean value was significantly different from that of the CTL group (P < 0·05).
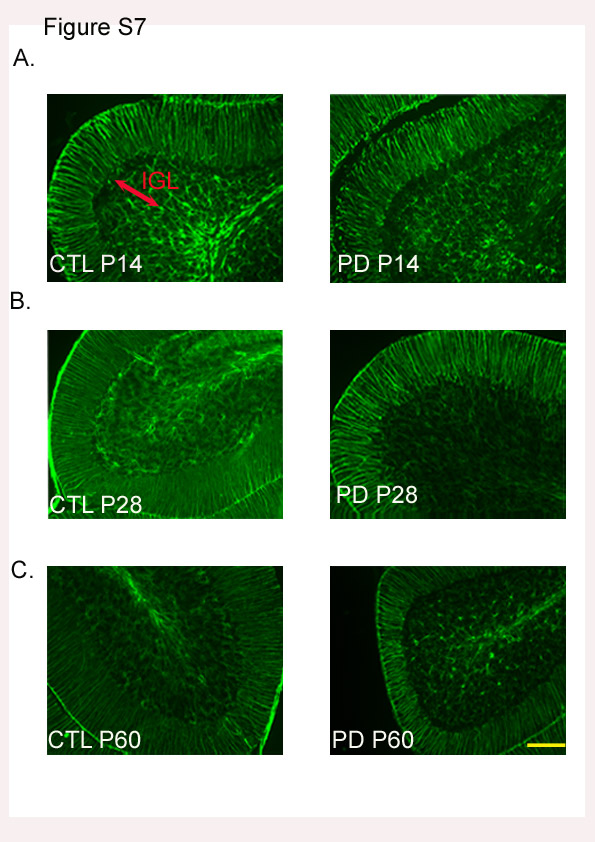
Data on the GFAP-positive population in the IGL showed stage-specific results (Table 2). At P14, the number of GFAP-positive cells in the IGL showed a statistically significant difference in the cerebella of the CTL and PD groups. The cerebella of the PD group showed a reduced number of GFAP-positive cells compared with that of the CTL group (P < 0·01). However, this difference disappeared at higher stages (Table 2). At P28, no significant difference was seen between the CTL and PD groups. At P60, no difference in the values of the number of GFAP-positive cells/μm2 was observed between the CTL and PD groups (Table 2). Fig. S7 of the supplementary material (available online at http://www.journals.cambridge.org/bjn) shows representative images of GFAP-stained cerebellar sections at different developmental stages. The lobe-wise (i.e. anterior, central and posterior) comparison of the cerebella between the two groups revealed no significant difference (data not shown).
(Mean values with their standard errors)
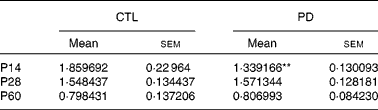
P14, postnatal day 14; P28, postnatal day 28; P60, postnatal day 60.
** Mean value was significantly different from that of the CTL group (P < 0·01).
Western blot results showed that there was no significant difference in the level of GFAP in the cerebella between the PD and CTL groups (P < 0·001; Fig. 5). Representative Western blots are shown in Fig. S8 of the supplementary material (available online at http://www.journals.cambridge.org/bjn).
Maternal protein deficiency does not alter the number of Purkinje cells as assessed by Nissl's stain in the cerebella of F1 pups
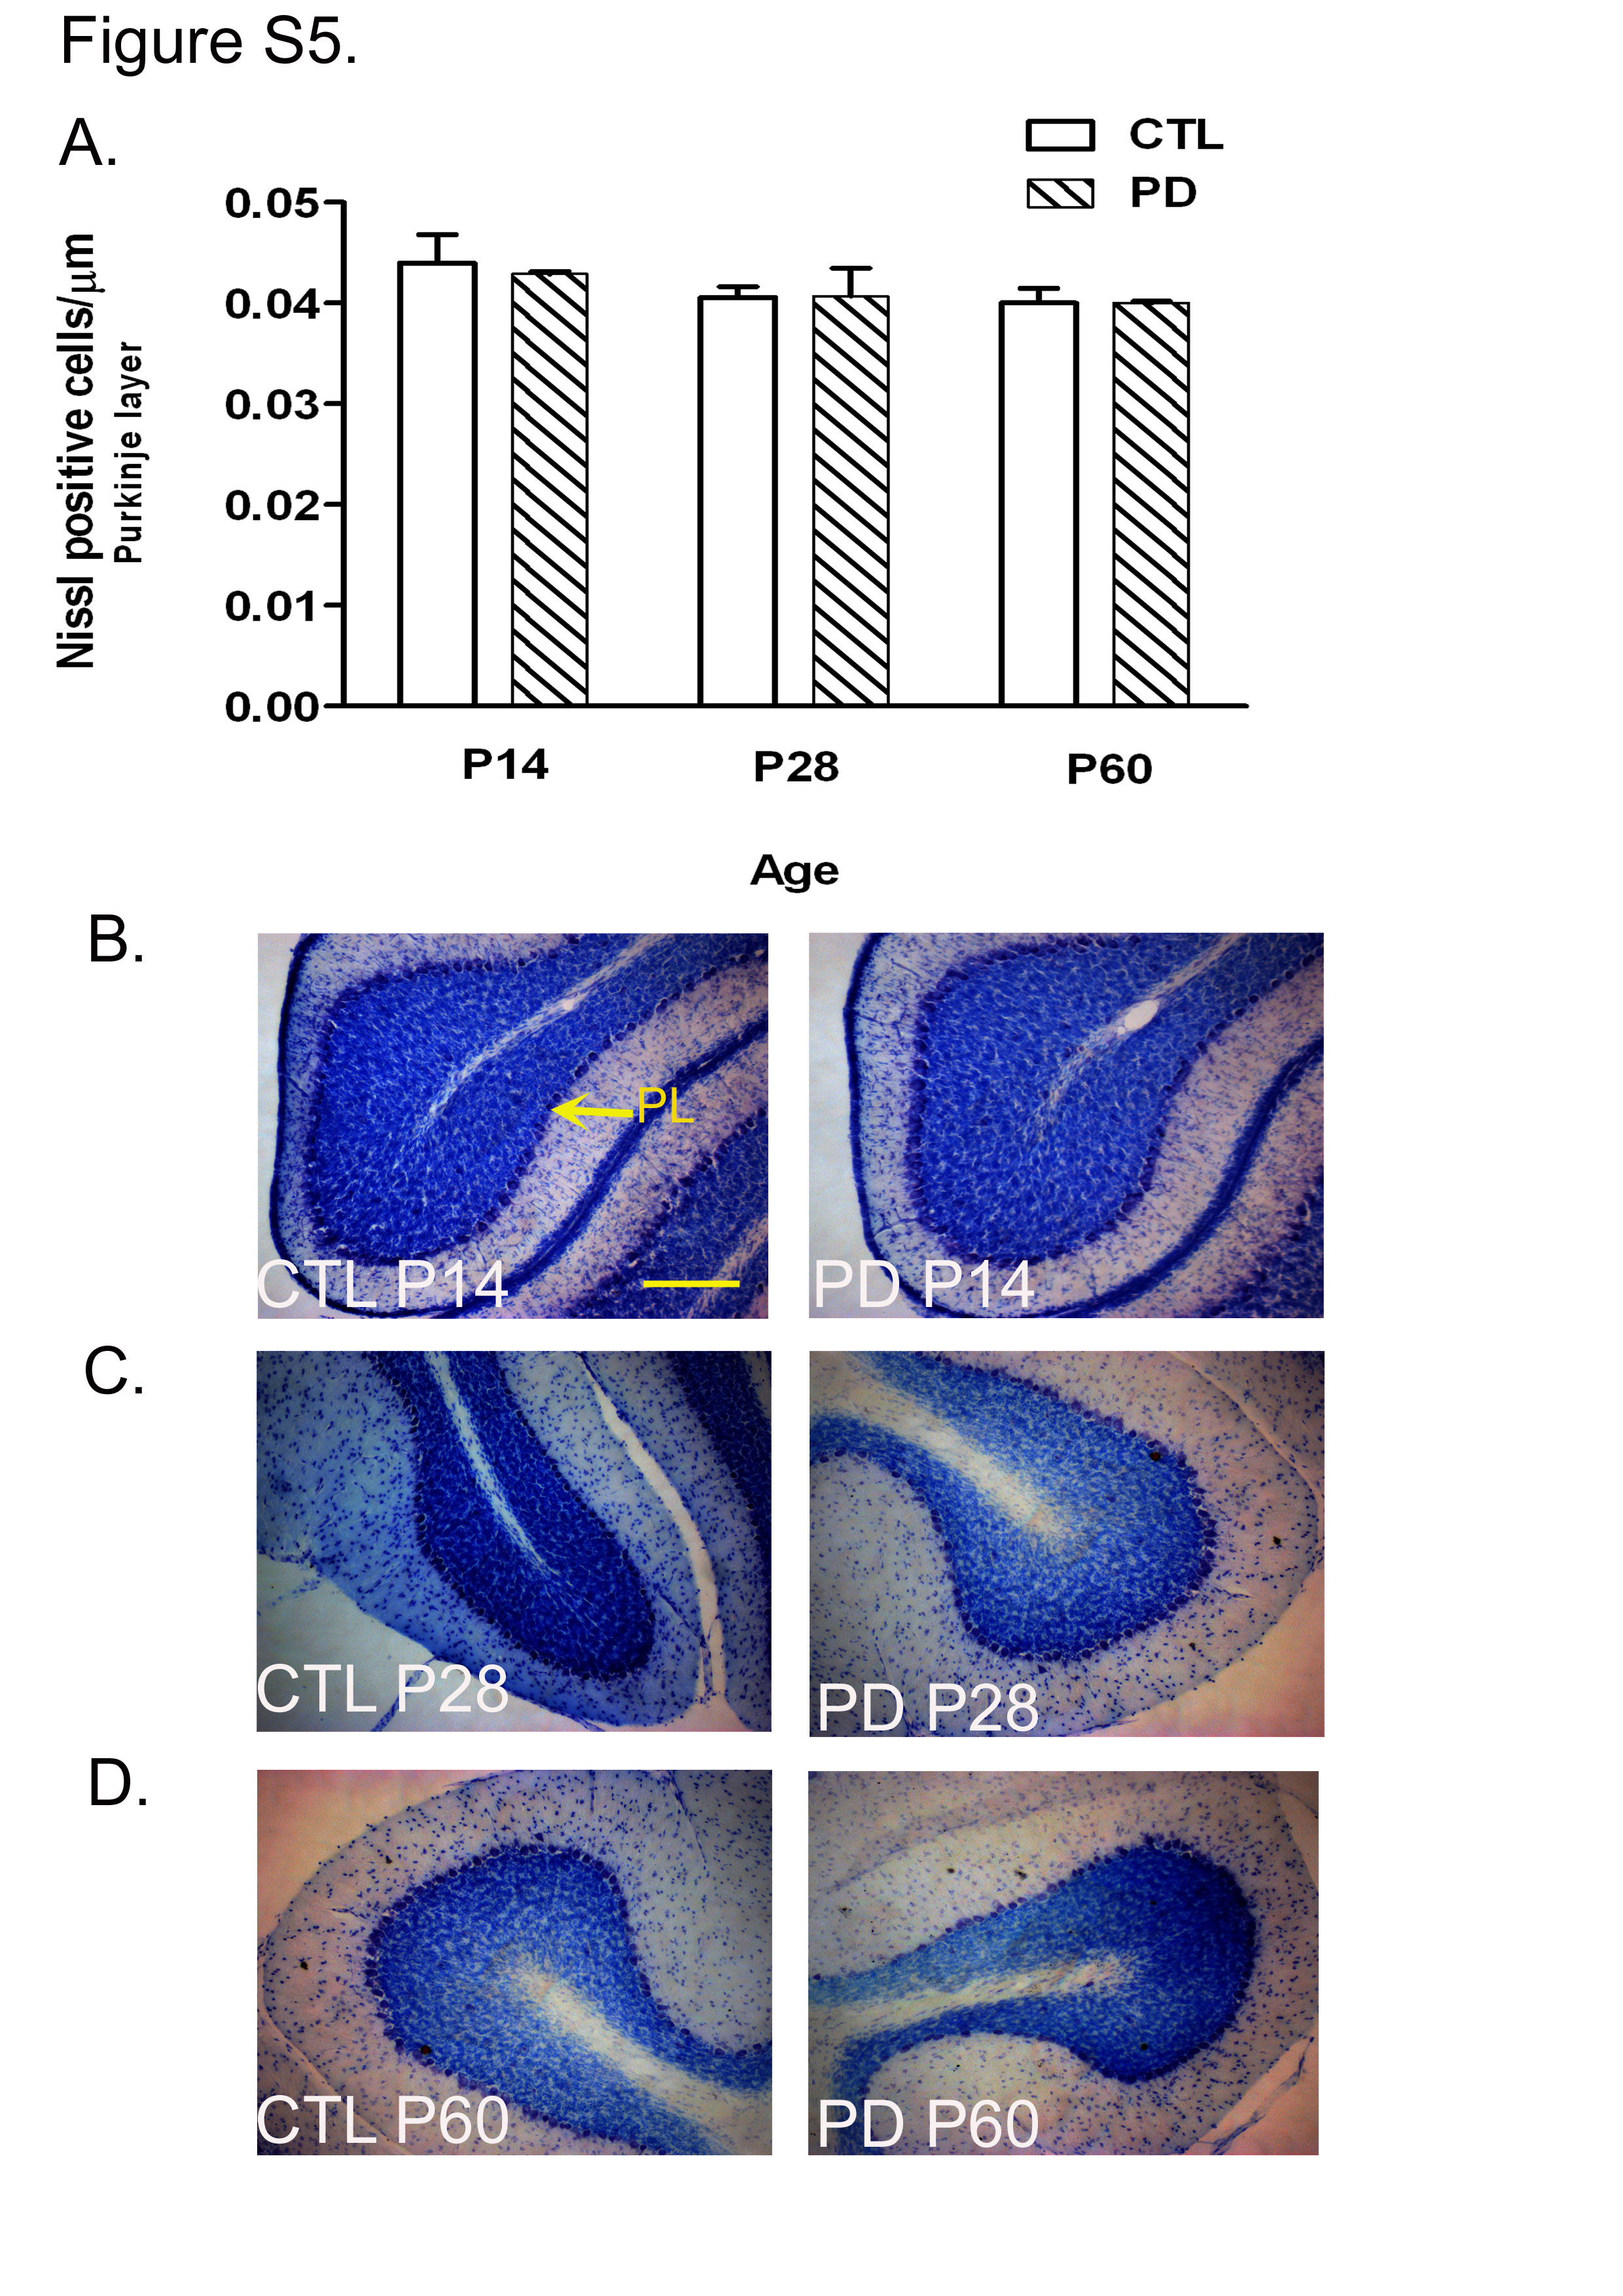
The number of Nissl's positive cells in the Purkinje layer showed no significant difference between the two groups at any developmental stages. The PC were identified as cells with large nuclei forming a single layer below the molecular layer. At P14, P28 and P60, no difference was observed in the number of Nissl's positive cells in the Purkinje layer of the cerebella between the CTL and PD groups (see Fig. S5(a)–(d) of the supplementary material, available online at http://www.journals.cambridge.org/bjn).
The lobe-wise (i.e. anterior, central and posterior) comparison of the cerebella between the two groups revealed no significant difference (data not shown).
Pups born to protein-deficient mothers showed suboptimal performance on behavioural tasks involving the cerebellum
Footprint analysis
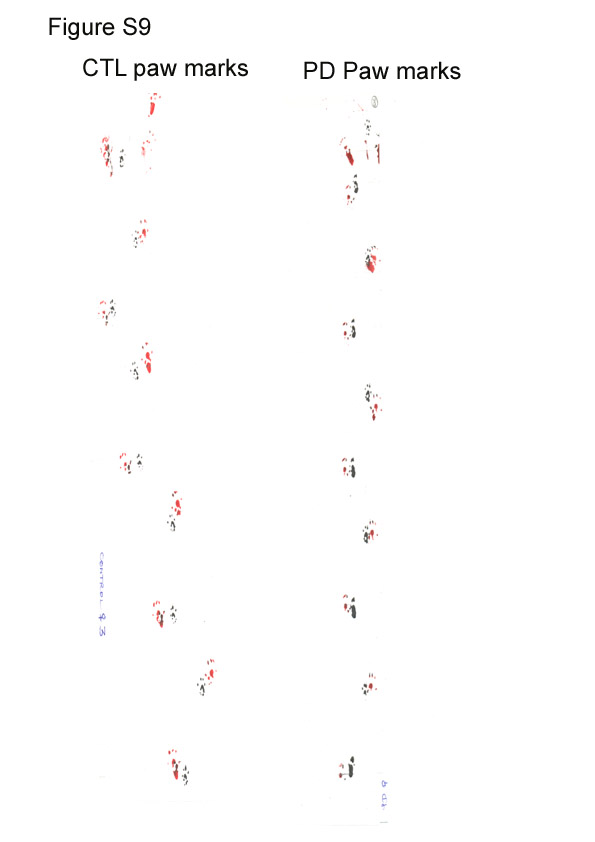
The fore-limb and hind-limb stride lengths were measured to check for any possible gait defects. Both fore-limb and hind-limb stride lengths were reduced in PD mice compared with age-matched CTL mice. The values for fore-limb stride length were 6·073 (sem 0·203) cm for CTL mice and 5·118 (sem 0·228) cm for PD mice. The hind-limb stride length values were 5·960 (sem 0·139) cm for CTL mice v. 5·15 (sem 0·372) cm for PD mice (P < 0·001; Fig. 6). There was no significant difference in fore-limb base width between the two groups. This gait defect can be clearly seen on the footprint sheets (see Fig. S9 of the supplementary material, available online at http://www.journals.cambridge.org/bjn).
Maternal protein deficiency (PD, ) shows reduced stride length in the footprint analysis of F1 offspring. Footprint assay of gait abnormalities in control (CTL, □; n 5) and PD mice (n 7). The stride lengths of both fore-limb and hind-limb in CTL and PD mice were compared. Both stride lengths were significantly shorter in PD mice compared with CTL mice. The stride length was measured using the left-hind paw. Values are means, with their standard errors represented by vertical bars. *** Mean values were significantly different (P < 0·001). Scale bar is 100 μm.

Rotarod analysis
Rotarod analysis was carried out when both CTL and PD offspring reached 8 weeks of age. PD mice fell off the rod quicker than their age-matched CTL counterparts. The latency period in PD mice was significantly reduced compared with CTL animals. During all the 3 d of trials (two trials per d) in the acquisition phase, using ten mice of each group, the rotarod performance of PD mice was significantly different from that of CTL mice (Table 3).
(Mean values with their standard errors)
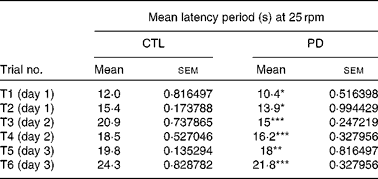
CTL, control.
Mean value was significantly different from that of the CTL group: *P < 0·05 **P < 0·01, ***P < 0·001.
Discussion
Nutrition is an important factor that affects the developing nervous system. The changes caused by early malnutrition, although functionally significant, are more subtle and therefore usually under-rated. Protein deficiency is one of the most commonly observed nutritional deficiencies that affects both developing countries and certain parts of developed countries. It is well established that protein–energy restriction or protein malnutrition experienced during the early postnatal period in the rat leads to significant and often permanent changes in brain anatomy(Reference Altman, Das and Sudarshan14, Reference Bedi and Dobbing15) physiology, biochemistry(Reference Morgane, Miller and Kemper16, Reference Dyson and Jones17) and behaviour(Reference Dobbing11, Reference Dobbing, Smart and Barnett18, Reference Ranade, Rose and Rao19). The time of the most rapid brain growth has been called the ‘critical’ or ‘vulnerable’ period(Reference Dobbing, Davison and Dobbing20) since it is during this time that brain growth and development are more susceptible to the lasting effects of protein malnutrition.
The cerebellum is a crucial component in the neuronal circuitry responsible for muscle coordination, posture and locomotion. Cerebellar maturation takes place postnatally and makes the cerebellum more sensitive to a wide range of adverse environmental factors than the rest of the brain during its early postnatal development(Reference Barnes and Altman6–Reference Shambaugh, Lee and Watanabe8).
GCL are the main neuronal cell type in the cerebellum. In the present study, PD animals showed a reduction in EGL proliferation at P7 and P14. The reduction in EGL thickness that we observed could be the result of this reduced proliferation. This reduction in proliferation may have led to a reduced number of cells in the IGL in later developmental stages (P14, P28 and P60). It is therefore reasonable to assume that the cells that we observed in the IGL at this stage are GCL, which are fewer in the cerebella of the PD group compared with the CTL group and are the result of reduced proliferation in earlier stages.
No significant change in the number of GFAP-positive cells was observed following protein deficiency. Although fewer glial cells are observed in the earlier stages their number is restored in adulthood by some compensatory mechanism. The reason for this delayed development of the glial population in response to maternal protein deficiency is not known.
Another important cell type that is seen to be affected significantly in PD animals is PC. The present immunohistochemistry data showed a reduction in the number of calbindin-positive cells in the Purkinje layer of the cerebella of the PD group at all developmental stages (P14, P28 and P60) when compared with that of the CTL group. However, no change was observed in the number of Nissl's positive cells in the PC layer. The present data thus suggest differential vulnerability of different cell types to maternal protein malnourishment.
In addition to affecting individual cell types, protein deficiency may also affect the interaction between different cell types. The signal for GCL proliferation postnatally comes from the PC. Although no change was seen in the number of Nissl's positive PC, alterations in calbindin levels in PC were observed. This result, taken together with Nissl's cell count and Western blot analysis, indicates a reduced or no expression of calbindin in certain fraction of PC. These alterations of calbindin levels in PC may result in disturbed interaction between PC and GCL. PC are also involved in the differentiation of Bergmann glia. The present results, however, indicate normal differentiation of Bergmann glia. So, protein deficiency seems to specifically affect the PC–GCL interaction.
Although there is an anterio-posterior gradient to cerebellar development, protein deficiency defects do not seem to show any lobe specificity (data not shown), but the defects rather seem to be universally distributed. This could be due to the extended period of protein malnourishment.
Cerebellar circuitry is important for motor coordination(Reference Diener, Dichgans, Bronstein, Brandth and Woollacott21) and proper cerebellar circuitry can only occur if the correct number of GCL and PC differentiate at the developmentally appropriate times. In addition to differentiation at proper time in development, migration at appropriate sites is also important for motor coordination.
So, based on the present results, we hypothesise that since Bergmann glia remain unaffected following protein deficiency, migration of GCL may be normal. The primary deficit therefore probably lies in EGL proliferation, which in turn could lead to less GCL differentiation. We wanted to know whether this affected motor coordination. An important question raised by the present study is why PD selectively affects neurons and not glia. This needs to be further investigated since this may reveal selective developmental pathways that are affected by PD.
PD mice when analysed on the rotarod for their motor coordination fell off the rod quicker compared with their CTL counterparts. The difference between their performances was statistically significant. In addition, gait evaluation done by paw marking showed a reduction in both fore-limb and hind-limb stride lengths.
Gait analysis(Reference Gilman, Bloedel and Lechtenberg22) and the rotarod test(Reference Goodlett, Thomas and West23) are few of the commonly used tests of motor coordination. In the present study, PD animals showed a significantly disrupted gait. This could underlie the reason why these animals also performed poorly in the rotarod test.
The role of calbindin in PC in fine motor coordination has already been established(Reference Barski, Hartman and Rose24). In addition, calbindin expression in PC, which are sole output of the cerebellar cortex, has a significant role to play in cerebellar function. A selective genetic deletion of the calcium-binding protein calbindin D-28k (calbindin) from cerebellar PC resulted in distinctly different cellular and behavioural patterns(Reference Barski, Hartman and Rose24). Ataxia and kinetic tremor shown by calbindin mutants are typical signs of impaired cerebellar function(Reference Thompson and Day25). The calbindin mutants, however, are not ataxic in a standard environment, which is indicative of less importance of calbindin for normal day-to-day behaviour. The subtle changes seen between the two groups (CTL and PD) in the present foot printing analysis perhaps confirm this.
Most animals can compensate for cerebellar defects when performing an essential and routine behaviour such as walking or moving around in the cage, but when presented with a novel task requiring finer cerebellar coordination such as balancing on a thin rod, the true extent of the coordination defects can be judged. The present study, when directly compared between the groups for the rotarod task, showed subtle differences in their performance. The statistically significant difference seen between the CTL and PD groups on the rotarod performance is indicative of subtle defects induced by protein deficiency possibly through reduced calbindin expression.
The defects induced by intrauterine protein malnutrition on different cerebellar cell types include delayed cerebellar neurogenesis(Reference Wallingford, Shreder and Zeman26), loss of GCL(Reference Clos, Favre and Selme-Matrat27) and aberrant PC dendritic arborisation(Reference Chen and Hillman28). There are also reports of certain structural changes induced by protein deficiency in PC(Reference Griffin, Woodward and Chandra29). However, this is the first time that we report an alteration in the levels of calbindin in the cerebellar PC.
Each developmental stage may be differentially vulnerable to protein malnutrition and the effect may differ in degree or kind, or both. In the present case, since the window of malnutrition is quite large, encompassing almost all developmental milestones of cerebellar development, it is therefore difficult to pinpoint the site and exact cause of this very specific alteration. It can, however, be speculated that since the mature PC are the major calbindin-expressing neuronal subtype in the cerebellum and calbindin contributes about 15 % of total cellular protein(Reference Baimbridge, Miller and Parkes30), it is reasonable to conclude that the protein that is expressed highest will be compromised the most under the conditions of protein deficiency. It is therefore no surprise that only calbindin shows a detectable decrease in its levels, leaving intact levels of GFAP.
Although the cerebellum is not the only brain region affected by protein deficiency and also not the only region involved in motor coordination, the tasks that we considered assess cerebellar function more specifically than any other brain structure involved in motor coordination. In addition, the period of protein deficiency that mice are subjected to in the present study corresponds more specifically to the developmental time window of the cerebellum than the other brain structures. So, the motor coordination defects that we report here most probably arise from developmental defects in the cerebellum than any other structures, namely brainstem or spinal cord.
The present study, however, does not rule out the fact that PD could also have other central as well as peripheral effects that could account for the disrupted motor behaviour. However, the present study shows that the effects of PD on the development of the cerebellum could be one of the reasons for the observed motor deficits.
In addition, the primary source of fat that was used in the diet was peanut oil, which is low in n-3 fatty acids. DHA, an n-3 fatty acid, is important for the development of the central nervous system(Reference Guesnet and Alessandri31) and motor function(Reference Bakker, Hornstra and Blanco32). In the present study, since CTL animals also received the same diet as that of the PD group, except for different amounts of protein, the defects that we see in PD animals cannot be attributed to the low levels of n-3 fatty acid in the diet. However, with the available data, we cannot rule out the possible interaction between low fatty acid and low protein content in the diet.
The brain changes produced by early malnutrition, which are more severe in nature, are evident only during or immediately after a period of malnutrition. These defects in most cases are found to be reversible. On the other hand, it is these more subtle anatomical and functional defects that are invariably resistant to nutritional rehabilitation(Reference Strupp and Levitsky33). These changes, although subtle, are likely to be functionally significant. There changes, however, should not go unnoticed and unattended since they alter the quality of life of the affected individuals.
This is the first study to report that early protein malnutrition leads to the suboptimal performance of PD pups in behavioural paradigms.
It is possible to use behavioural data to study the locus of underlying neural damage and, reciprocally, for neural changes to suggest likely functional deficits. Even though the brain changes produced by early malnutrition are diffuse, rendering unlikely specificity in the resulting dysfunction, the nature of the brain changes observed can suggest behavioural processes that should be tapped. These processes and underlying structural damages are required to be studied in detail in order to fully understand the mechanisms involved and possibly to design new intervention therapies.
Acknowledgements
The authors would like to thank Professor V. Ravindranath, Former Director, National Brain Research Centre for her valuable support. We thank Dr Nihar Ranjan Jana, National Brain Research Centre, India for technical support with the rotarod experiments. We thank Dr Shikha Yadav for expert assistance with care of the experimental animals. We would also like to thank Mr Kaushik Sharma, Ms Chinmoyee Maharana and Mr Parthiv Haldipur for their valuable suggestions and inputs. This study was supported by the Indo-French ICMR-INSERM grant and by the CEFIPRA grant (3803) to P. G. and S. M. and by the postdoctoral scholarship programme of the French Embassy in India to S. C. R. There is no conflict of interest from any of the contributing authors regarding data in this manuscript. S. C. R. contributed to at all levels, from carrying out the experiments (immunohistochemistry, Western, behavioural, data analysis) to the preparation of the manuscript. M. S. N. was involved in the generation of malnutritioned animals, immunohistochemistry experiments, behavioural data acquisition and analysis. A. J. R. was involved in all the BrdU experiments and data analysis of those experiments. P. K. R. was responsible for blind cell counting of the immunohistochemistry experiments and behavioural data acquisition. P. G. and S. M. gave intellectual inputs at all levels and contributed to manuscript preparation and funding.