


The postprandial glycaemic response is the increase in blood glucose concentrations after ingestion of a meal or a drink. While good glycaemic control is essential to maintain cardiometabolic health in humans(Reference Blaak, Antoine and Benton1), increased glycaemic variability has been linked to the development of inflammation, type 2 diabetes (T2D), CVD, cancer and pre-mature death(2). Impaired glucose tolerance (IGT), as reflected by an elevated 2-h blood glucose concentration, is one of the diagnostic criteria of pre-diabetes and eventually leads to the development of T2D in many cases. More specifically, individuals with IGT are shown to have an increased risk of CVD(Reference Cai, Zhang and Li3). It is estimated that 352 million people between 20 and 79 years worldwide currently have IGT, and this number is expected to increase to 587 million by 2045(4). Furthermore, approximately 382 million adults currently have T2D, and it is estimated that this number will reach 566 million by 2045(4). Moreover, it is increasingly evident that individuals who are considered normoglycaemic also regularly have glucose concentrations that reach diabetic ranges(Reference Hall, Perelman and Breschi5). In fact, even for individuals who are considered normoglycaemic, acute postprandial hyperglycaemia is associated with the risk of developing T2D and cardiovascular complications later in life(Reference Pareek, Bhatt and Nielsen6,Reference Peddinti, Bergman and Tuomi7) . Additionally, strategies which improve glycaemic control by preventing postprandial glycaemic dips in healthy individuals may also be of interest due to an acute reduction in hunger and energy intake(Reference Wyatt, Berry and Finlayson8). Altogether, it is important to implement strategies to prevent impairments in blood glucose homoeostasis(Reference Hall, Perelman and Breschi5). In our study, we attempted to elucidate the effects of a strategy to limit acute postprandial glucose excursions starting with healthy individuals.
Dietary interventions to delay carbohydrate digestion or absorption are effective ways to attenuate the postprandial rise in blood glucose concentrations and, as such, can help to prevent or lower hyperglycaemia in the early postprandial phase. The enzyme sucrase is an α-glucosidase which specifically hydrolyses the α-1,2 glycosidic bond from sucrose to form glucose and fructose. Sucrose is a substantial contributor to the daily average energy intake, and thus α-glucosidase inhibitors are commonly used strategies to treat hyperglycaemia in patients with T2D(Reference van de Laar, Lucassen and Akkermans9).
Findings from in vitro studies revealed that the plant-derived monosaccharide L-arabinose acts as an α-glucosidase inhibitor, specifically targeting sucrase activity(Reference Seri, Sanai and Matsuo10), and can remain bound for several hours. L-arabinose is a component of plant cell wall hemicellulose(Reference Zhang, Zhang and Whistler11) and can be isolated from many different plant types, including sugar beets. In vivo studies have shown that co-ingestion of L-arabinose with sucrose attenuates the postprandial increase in plasma glucose concentrations when compared with the ingestion of sucrose alone. This has been reported in rodents(Reference Seri, Sanai and Matsuo10,Reference Preuss, Echard and Bagchi12) , healthy individuals(Reference Krog-Mikkelsen, Hels and Tetens13) and patients with T2D(Reference Inoue, Sanai and Seri14).
Notably, postprandial glucose concentrations are influenced not only by the rate of exogenous glucose appearance but also by the rate of endogenous glucose production (EGP) and the rate of glucose disposal. In this double-blind, randomised crossover study, we included twelve young, healthy participants to investigate the glycaemic response after the ingestion of a drink containing 50 g of sucrose with and without the addition of 7·5 g of L-arabinose. By using a dual stable isotope methodology, endogenous and exogenous rates of glucose appearance and disappearance were determined. The study provides a complete overview of the mechanisms behind the changes in blood glucose concentrations after the consumption of sucrose with and without L-arabinose in healthy participants.
Participants and methods
Study population
Seven men and six women between the ages of 18 and 35 years and with a BMI between 18·5 and 25·0 kg/m2 were included in the study. One male participant showed elevated blood glucose concentrations at the start of one test day, but not at the start of the screening and the remaining test, suggesting that he was not fasted during that particular test. Therefore, he was excluded from all analyses (online Supplementary Fig. 1). All individuals were healthy and participated in recreational sports activities ≤ 3 times per week. Exclusion criteria were smoking, food allergies, T2D, metabolic or gastrointestinal disorders, participation in a 13C-glucose or 2H-glucose tracer study within 2 weeks prior to the test, unstable body weight (≥ 3 kg difference) during 3 months prior to testing, medication use and high alcohol consumption (regularly > 2 drinks per d or > 7 drinks per week). Participants’ characteristics are summarised in Table 1.
Plasma glucose after ingestion of sucrose with or without the addition of L-arabinose (n 12). Data are presented as mean with sem. Data were analysed with a two-way repeated-measures ANOVA. **P < 0·01; ***P < 0·001. L-ARA, L-arabinose drink; CONT, sucrose drink.

Baseline characteristics of participants (Mean values and standard errors of the mean)

Baseline characteristics of all participants are shown as mean with sem.
This study was conducted according to the guidelines laid down in the Declaration of Helsinki, and all procedures involving human participants were approved by the Medical Research Ethics Committee affiliated with Maastricht University Medical Center+ (METC azm/UM; METC183021). Written informed consent was obtained from all participants. The study was registered at the Netherlands Trial Register with ID number NL7302; URL: www.trialregister.nl. All tests were performed at the department of Human Biology, Maastricht University, from October 2018 to July 2019. The study was independently monitored by the Clinical Trial Center Maastricht.
Study protocol
Participants visited the laboratory on three different occasions. On the first visit, eligibility was tested during a screening session. Participants were instructed to refrain from intense physical activities and consuming alcoholic beverages for a period of at least 24 h prior to the screening. Following an overnight fast, a 2-h oral glucose tolerance test was then performed to test for normoglycaemia, and a dual-energy X-ray absorptiometry scan (Discovery A fan beam densitometer, Hologic, Inc.) was performed to measure body composition. The dual-energy X-ray absorptiometry data were analysed by using software package APEX version 13.5.3 (Hologic, Inc.) and NHANES 2008 reference values(Reference Kelly, Wilson and Heymsfield15).
After a successful screening session, the experimental tests were performed during the second and third visit. The two test days were performed in a double-blind, randomised crossover fashion. An independent researcher within our department who was otherwise not practically involved in the study used Research Randomizer to generate the list with the randomised treatment order for the participants(16). All researchers involved in data collection and analysis for this study as well as all participants were completely blinded. Until the completion of the data analysis process, the two different drinks were referred to only as ‘Drink A’ and ‘Drink B’ during the test days. Moreover, the two drinks had a similar taste, which prevented unintended unblinding of the participants. To adhere to proper concealment of allocation and to prevent selection bias, the involved researchers were only informed about the next participant’s treatment order after a successful screening.
Participants were instructed to complete a nutritional and activity log for a period of 3 d prior to the first test day and to follow a similar diet and activity pattern during the second pre-test period. Participants were also instructed to refrain from intense physical activity and the consumption of alcoholic beverages during these periods. The evening prior to both test days, all participants consumed the same standardised meal (2945 kJ; 54·5 E% carbohydrate, 30·3 E% fat and 15·2 E% protein) consisting of a pre-packed chicken, potato and vegetable dinner (Aviko Maaltijdpannetje), 150 g of strawberry cream yogurt (FruFru, Bauer) and 200 ml of orange juice (PLUS). The standardised meal was selected to be easy to prepare and to reflect a balanced dinner based on total number of kilojoules and macronutrient composition. For male participants, there was a washout period of 2 weeks or more between the two test days in order to rule out possible carry-over effects. For female participants, there was a washout period of exactly 4 weeks to minimise the effects of the menstrual cycle on study parameters.
After an overnight fast, all participants arrived at the research facility at 08.00 h. A Venflon™ cannula was placed into a dorsal hand vein to collect arterialised blood samples. Arterialisation was obtained by placing the hand in a hot box (60°C). The second cannula was placed in a contralateral antecubital vein to infuse a (6,6–2H2)-glucose tracer (Cambridge Isotope Laboratories, Inc.). The plasma glucose pool was primed with the (6,6–2H2)-glucose tracer (2·4 mg/kg body weight) at t = –90 min, after which the continuous infusion was started at a rate of 0·04 mg/kg body weight/min until the end of the test(Reference van Loon, Koopman and Stegen17–Reference Reijnders, Goossens and Hermes20). At t = –60 min, baseline blood and exhaled breath were collected, and a baseline indirect calorimetry measurement was performed for 20 min. At t = 0 min, participants were given a drink containing either 50 g of sucrose in 200 ml of water (CONT) or a drink containing 50 g of sucrose plus 7·5 g of L-arabinose (Sensus B.V.) in 200 ml of water (L-ARA). Participants were instructed to consume the drink within 5 min. The 50 g of sucrose contained 570 mg of (U-13C6)-glucose-labelled sucrose (98 %) tracer (Cambridge Isotope Laboratories, Inc.). Blood sampling was performed at t = 0, 15, 30, 60, 90, 120, 150, 180, 210 and 240 min. Indirect calorimetry measurements were performed at t = 0, 30, 60, 90, 120, 150, 180, 210 and 240 min for a period of 20 min. During the entire test day, participants remained in a semi-supine position and were not allowed to sleep. Participants were monitored for adverse events. Specifically, approximately 1 week after each experimental test, participants were contacted and asked to report any medical complaints they may have experienced during that week.
Analyses
Blood samples (10 ml) were collected in pre-cooled EDTA-containing tubes (Vacutainer, BD, Plymouth) and centrifuged at 1300 g at 4°C for 10 min. Aliquots of plasma were snap-frozen in liquid N2 and stored at −80°C until analyses were performed. Plasma glucose and NEFA concentrations were determined by performing an enzymatic assay and using a spectrophotometric autoanalyser (Pentra C400, HORIBA ABX SAS). Plasma free glycerol was determined after deproteinisation of the sample and by using a different analyser (Cobas Fara II, Roche Diagnostics). Plasma insulin concentrations were determined by performing a RIA (Human Insulin-Specific RIA, Merck). Breath samples were collected in 12-ml evacuated Exetainer™ Breath Vials (Labco Limited) from a mixing chamber. The 13C/12C ratio of expired CO2 was determined by isotope ratio mass spectrometry (Finnigan MAT 253, Thermo Fisher Scientific). Plasma samples for stable isotope analyses were deproteinised, after which the dried glucose was derivatised into a butylboronic acid acetate derivative by using 1-butaneboronic acid and acetic anhydride. Isotopic composition of plasma glucose was measured by gas chromatography/MS (Agilent G1530N/G2589A) for 2H/H ratio, and by isotope ratio mass spectrometry for 13C/12C ratio. For indirect calorimetry, an open-circuit ventilated hood system (Omnical, Maastricht Instruments) was used, which measured the production of CO2 (VCO2) and consumption of O2 (VO2) in ml/min. From those parameters, RER, energy expenditure (EE) in kJ/min, and carbohydrate and fat oxidation rates (g/min) were calculated.
Calculations for indirect calorimetry
Equations of Weir(Reference Weir21) and Frayn(Reference Frayn22) were used to calculate EE, and carbohydrate and fat oxidation rates from VCO2 and VO2 in l/min. For these calculations, nitrogen excretion (N) in g/min was estimated under the assumption that protein oxidation accounts for 15 % of EE during resting conditions, as previously described(Reference van Can, Ijzerman and van Loon23).
-
1) Carbohydrate oxidation (g/min) = 4·55 × VCO2 – 3·21 × VO2 – 2·87 × N.
-
2) Fat oxidation (g/min) = 1·67 × VO2 – 1·67 × VCO2 – 1·92 × N.
-
3) N (g/min) = 0·15 × EE/17/6·25.
-
4) EE (kJ/min) = 4·187 × (3·9 × VO2 + 1·1 × VCO2).
Tracer calculations
Tracer calculations were performed as described previously(Reference Manders, Wagenmakers and Koopman19,Reference Eelderink, Moerdijk-Poortvliet and Wang24,Reference Eelderink, Schepers and Preston25) . Isotopic enrichment of 13C in expired CO2 and in plasma glucose were expressed as the δ13C difference in ‰ between the 13C/12C ratio of the collected samples and the international standard Pee Dee Belemnite (PDB), which has a known 13C/12C ratio. The following formula was used for determining δ13C:
-
5) δ13C (‰) = ((Rsample/Rstandard) – 1) × 1000.
Rsample is the 13C/12C of the sample, and Rstandard is the 13C/12C ratio of PDB.
Mole percent excess in % for plasma (6,6–2H2)-glucose and (U-13C6)-glucose were calculated by subtracting the molar percentage enrichment at baseline, which represents the natural abundance, from the molar percentage enrichment of the sample. Steele’s non-steady state equation(Reference Steele, Wall and De Bodo26), modified by De Bodo et al. (Reference De Bodo, Steele and Altszuler27), was used to calculate the rate of total glucose appearance (RaT), the rate of exogenous glucose appearance (RaE) and the rate of total glucose disappearance (RdT), based on the enrichment of plasma (6,6–2H2)-glucose and (U-13C6)-glucose(Reference Tissot, Normand and Guilluy28). Formulas for RaT and RdT were reported by Manders et al. previously(Reference Manders, Wagenmakers and Koopman19). The formula for RaE was reported by Tissot et al., for which we used a fraction P of 0·75, a distribution volume v of 0·2 l/kg and mole percent excess instead of atom percent excess(Reference Tissot, Normand and Guilluy28). EGP was calculated by subtracting RaE from RaT(Reference Tissot, Normand and Guilluy28). The different rates were expressed as the amount of glucose in g, per kg of body mass, per min.
Statistical analyses
Sample size was calculated based on the primary objective, RaE. For RaE, we expected a minimal detectable difference in means of 1·3 mg/kg/min and assumed a within-participant sd of 0·95. With a statistical power of 80 % and a two-sided significance level of 0·05, a sample size of eleven participants was calculated by using a sample size calculator(Reference Schoenfeld29). Based on our previous studies, we expected a dropout of 10–15 % after a completed first test day, so we needed to include thirteen participants. However, one participant turned out to be unavailable for the experimental tests after a successful screening visit, so this participant had to be replaced. Therefore, fourteen participants were screened successfully, but only the correct number of thirteen participants were eventually tested.
A two-way ANOVA model for repeated measures was applied using treatment (i.e. CONT or L-ARA) as between-subject variable and time as within-subject variable. In the case of a significant time × treatment interaction, Bonferroni post hoc analysis was used to compare differences between treatments at specific time points. Paired Student’s t tests were performed to compare the AUC in the early (0–1 h), late (1–4 h) and total (0–4 h) postprandial phase between both drinks, as well as summarised glucose kinetics results. All statistical analyses were performed with GraphPad Prism version 5.00 for Windows (GraphPad Software, Inc.). Statistical significance was set at P < 0·05 (two-sided).
Results
Glucose kinetics
Fasting plasma glucose concentrations were not different between CONT and L-ARA before ingestion of the drinks (4·81 ± 0·09 v. 4·89 ± 0·08 mmol/l, P > 0·05). Plasma glucose concentration increased following drink ingestion in both treatments, but increased more rapidly in CONT when compared with L-ARA (time × treatment interaction: P < 0·0001). Postprandial glycaemic response was attenuated for L-ARA compared with CONT. Specifically, for L-ARA, a peak glucose concentration of 6·62 ± 0·18 mmol/l was reached 60 min after ingestion, whereas for CONT, a peak glucose concentration of 8·18 ± 0·29 mmol/l was reached 30 min after ingestion (Fig. 1). As a result of the prolonged, more gradual increase and subsequent decrease in plasma glucose for L-ARA, the AUC for plasma glucose concentrations was smaller 0–1 h post-ingestion (366 ± 7 v. 420 ± 11 mmol/l/h, P < 0·0001) and greater 1–4 h post-ingestion (972 ± 12 v. 885 ± 17 mmol/l/3 h, P < 0·0001) when compared with CONT, with no differences in the total AUC from 0–4 h between treatments (Table 2).
Summarised glucose kinetics (Mean values and standard errors of the mean)

L-ARA, L-arabinose drink; CONT, sucrose drink; RaT, rate of total glucose appearance; RaE, rate of exogenous glucose appearance; RdT, rate of total glucose disappearance; EGP, endogenous glucose production.
Summarised glucose kinetics results after ingestion of sucrose with or without the addition of L-arabinose are shown as mean with sem. Data were analysed with a paired Student’s t test.
We determined several parameters related to glucose kinetics over the 4-h postprandial period: RaT, RaE, RdT and EGP. A time × treatment interaction was observed between CONT and L-ARA for RaT, RaE and RdT. The combined release of exogenous and endogenous glucose into the circulation (RaT) was lower for L-ARA compared with CONT at t = 15 min (23·0 ± 1·3 v. 39·2 ± 4·2 µmol/kg/min, P < 0·001) and at t = 30 min (23·4 ± 1·4 v. 37·9 ± 3·8 µmol/kg/min, P < 0·001). RaT then decreased for CONT and remained similar to the L-ARA condition for the remainder of the test, except for t = 150 min, at which time point there was a higher RaT for L-ARA compared with CONT (15·6 ± 1·1 v. 8·5 ± 1·0 µmol/kg/min, P < 0·05) (Fig. 2(a)). The total amount of endogenous and exogenous glucose appearance during the 0–4 h period did not differ between L-ARA and CONT (Table 2).
Glucose kinetics results: RaT (a), RaE (b), RdT (c) and EGP (d) after ingestion of sucrose with or without the addition of L-arabinose (n 12). Data are presented as mean with sem. Data were analysed with a two-way repeated-measures ANOVA. *P < 0·05; **P < 0·01; ***P < 0·001. L-ARA, L-arabinose drink; CONT, sucrose drink; RaT, rate of total glucose appearance; RaE, rate of exogenous glucose appearance; RdT, rate of total glucose disappearance; EGP, endogenous glucose production.
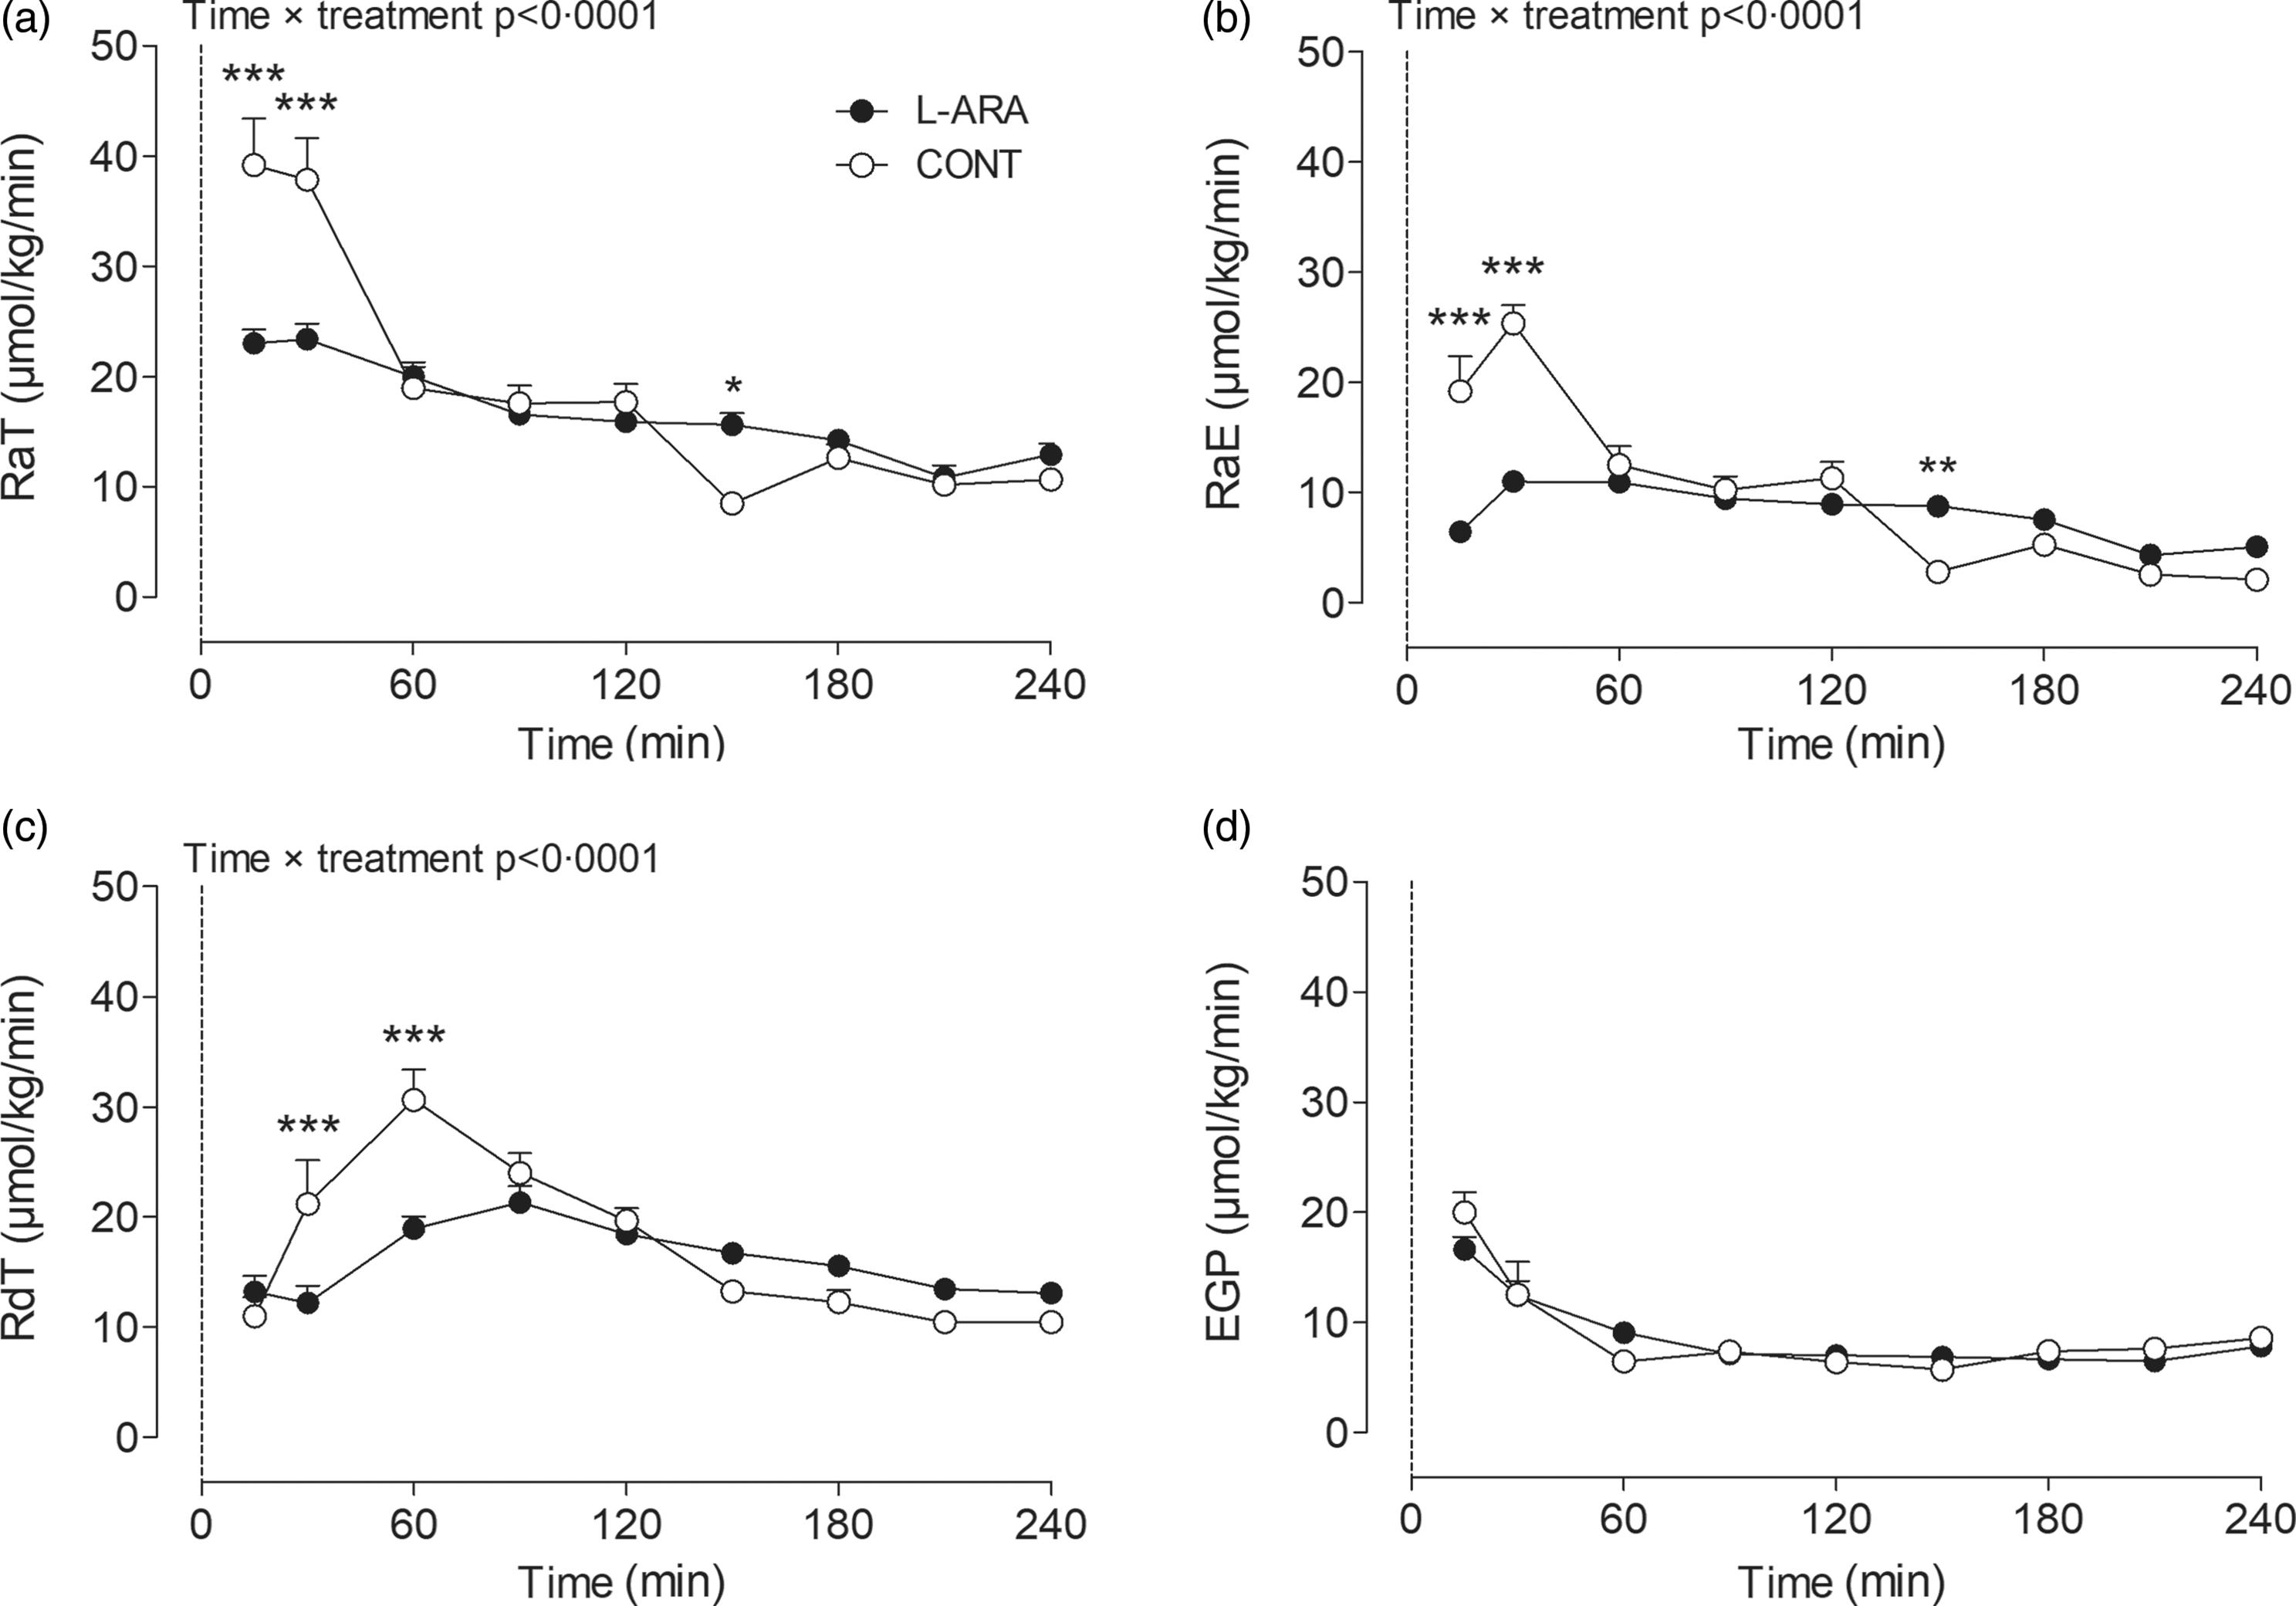
RaE followed a similar pattern to RaT. The release of exogenous sucrose-derived glucose into the circulation (RaE) was lower for L-ARA compared with CONT at t = 15 min (6·4 ± 0·4 v. 19·2 ± 3·2 µmol/kg/min, P < 0·001) and at t = 30 min (11·0 ± 0·7 v. 25·4 ± 1·6 µmol/kg/min, P < 0·001), whereas it was higher at t = 150 min (8·8 ± 0·7 v. 2·8 ± 0·9 µmol/kg/min, P < 0·01) (Fig. 2(b)). Total exogenous glucose appearance during the 0–4 h period was lower for L-ARA compared with CONT (23 ± 1 v. 25 ± 1 g, P = 0·0183) (Table 2).
The increase in the combined disappearance of exogenous and endogenous glucose (RdT) following ingestion of the test drinks was less pronounced for L-ARA compared with CONT. RdT was lower for L-ARA compared with CONT at t = 30 min (12·2 ± 1·5 v. 21·2 ± 4·0 µmol/kg/min, P < 0·001) and at t = 60 min (19·0 ± 1·1 v. 30·6 ± 2·7 µmol/kg/min, P < 0·001) (Fig. 2(c)). The total amount of endogenous and exogenous glucose disappearance during the 0–4 h period was not different between L-ARA and CONT (Table 2).
There were no differences in endogenous glucose release (EGP) between L-ARA and CONT at any time point (Fig. 2(d)). The total amount of EGP in g during the 0–4 h period was also not different between L-ARA and CONT (Table 2).
Plasma insulin, NEFA and free glycerol
Plasma insulin, NEFA and free glycerol concentrations were not different between CONT and L-ARA before ingestion of the drinks. Insulin concentrations increased immediately after ingestion of the drink in both CONT and L-ARA. The increase in insulin was less pronounced for L-ARA compared with CONT at t = 15 min (10·6 ± 0·7 v. 24·5 ± 4·8 µU/ml, P < 0·001) and at t = 30 min (14·6 ± 0·9 v. 32·7 ± 4·7 µU/ml, P < 0·001) (Fig. 3(a)). The AUC for insulin was lower 0–1 h (743 ± 42 v. 1403 ± 172 µU/ml/h, P = 0·0012) and 0–4 h post-ingestion (2239 ± 141 v. 2821 ± 276 µU/ml/4 h, P = 0·0192) for L-ARA compared with CONT. There was no difference in the insulin AUC from 1–4 h (not shown).
Plasma insulin (a), NEFA (b) and free glycerol (c) after ingestion of sucrose with or without the addition of L-arabinose (n 12). Data are presented as mean with sem. Data were analysed with a two-way repeated-measures ANOVA. *P < 0·05; **P < 0·01; ***P < 0·001. L-ARA, L-arabinose drink; CONT, sucrose drink.
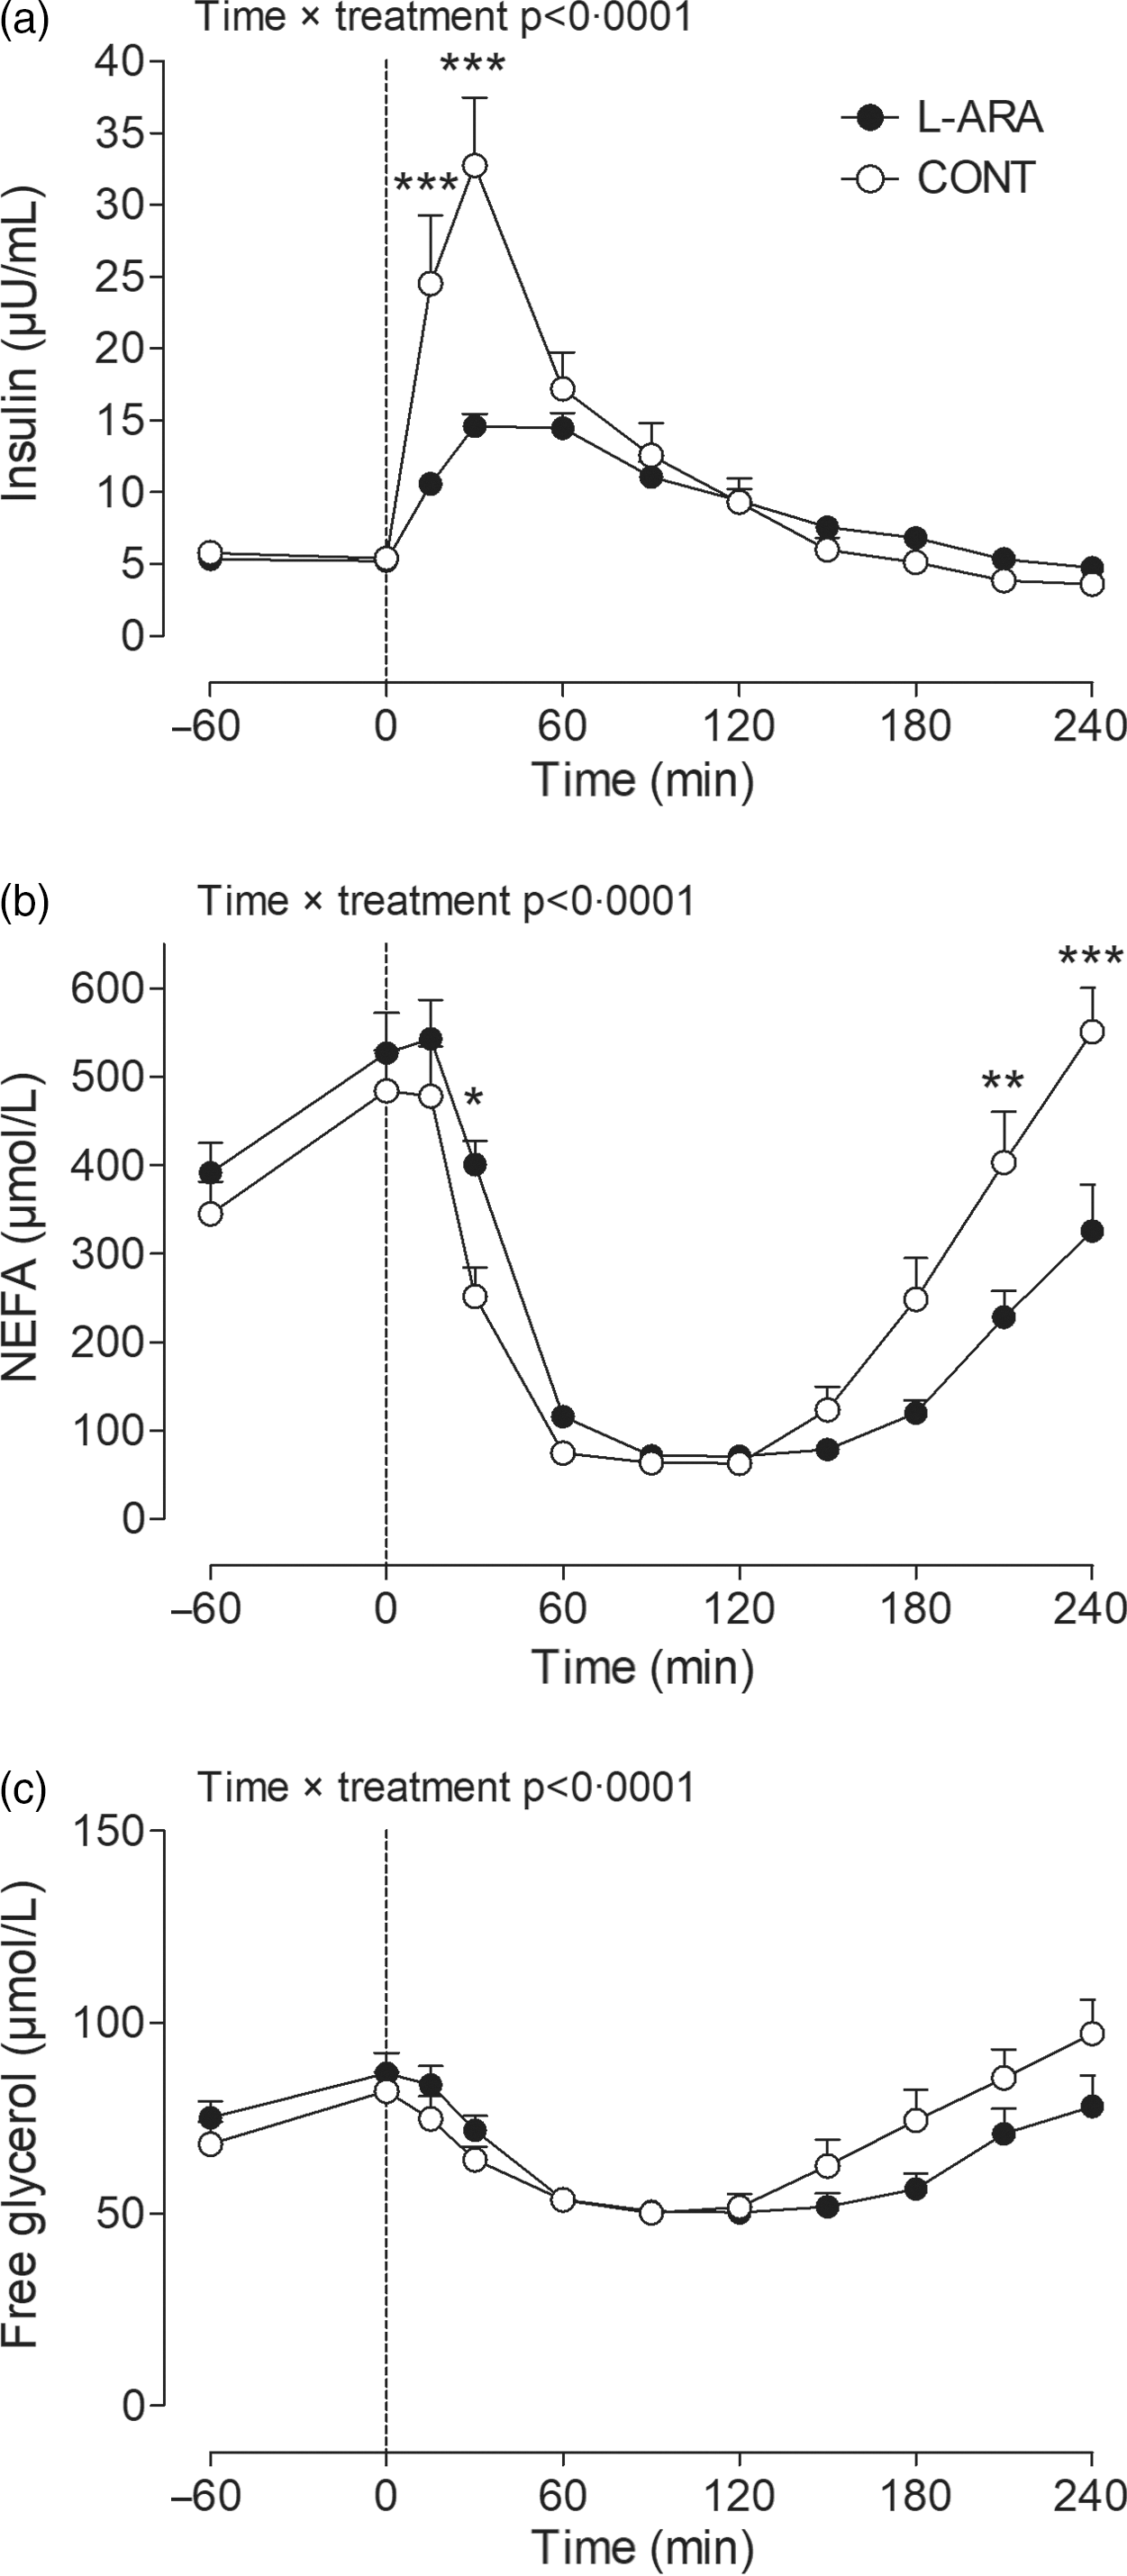
NEFA concentrations decreased immediately after ingestion of both drinks and went back to baseline concentrations 4 h post-ingestion, although the magnitude of the response was different for L-ARA compared with CONT as indicated by a significant time × treatment interaction (P < 0·0001). Detailed analysis showed that plasma NEFA was higher for L-ARA compared with CONT at t = 30 min (401 ± 26 v. 252 ± 33 µmol/l, P < 0·05) (Fig. 3(b)), and lower at t = 210 min (228 ± 29 v. 403 ± 58 µmol/l, P < 0·01) and t = 240 min (326 ± 53 v. 551 ± 49 µmol/l, P < 0·001). The AUC for NEFA from 0–1 h was higher after ingestion of L-ARA (23 ± 2 v. 18 ± 2 mmol/l/h, P = 0·0007) and lower from 1–4 h (24 ± 2 v. 36 ± 4 mmol/l/3 h, P = 0·0024) (not shown).
Free glycerol concentrations were different between CONT and L-ARA (time × treatment interaction P < 0·0001) (Fig. 3(c)). Free glycerol AUC from 0–1 h was higher after ingestion of L-ARA (4332 ± 218 v. 3988 ± 219 µmol/l/h, P = 0·0068), and lower from 1–4 h (10 390 ± 645 v. 12 000 ± 870 µmol/l/3 h, P = 0·0138), with no difference in the total AUC from 0–4 h (not shown).
Carbohydrate oxidation, fat oxidation, energy expenditure and RER
Carbohydrate and fat oxidation rates were affected in accordance with changes observed in plasma glucose and NEFA concentrations. Specifically, carbohydrate oxidation increased and fat oxidation decreased substantially in the early postprandial phase for both drinks (Fig. 4(a) and (b)), and the effects were less pronounced for L-ARA compared with CONT (carbohydrate oxidation t = 50 min: 0·16 ± 0·01 v. 0·25 ± 0·02 g/min, P < 0·001; fat oxidation t = 50 min: 0·04 ± 0·01 v. 0·01 ± 0·01 g/min in L-ARA and CONT, respectively, P < 0·01) (Fig. 4(a) and 4(b)). Since RER reflects changes in substrate oxidation, we also observed a lower RER at t = 50 min for L-ARA compared with CONT (0·87 ± 0·01 v. 0·94 ± 0·01, P < 0·001) (Fig. 4(d)). Whole-body EE was not different between CONT and L-ARA (Fig. 4(c)).
Carbohydrate oxidation (a), fat oxidation (b), energy expenditure (c) and RER (d) after ingestion of sucrose with or without the addition of L-arabinose (n 12). Data are presented as mean with sem. Data were analysed with a two-way repeated-measures ANOVA. *P < 0·05, **P < 0·01; ***P < 0·001. L-ARA, L-arabinose drink; CONT, sucrose drink.

Breath 13CO2 enrichment
The 13CO2 enrichment of exhaled air was not different between CONT and L-ARA before ingestion of the drinks and increased gradually after ingestion of the drink in both CONT and L-ARA until approximately the end of the 4-h postprandial period. Breath 13CO2 enrichment increased less for L-ARA compared with CONT and was significantly lower at t = 90 min (19 ± 2 v. 40 ± 4 δ‰, P < 0·05), t = 120 min (42 ± 3 v. 66 ± 5 δ‰, P < 0·01), t = 150 min (64 ± 4 v. 91 ± 7 δ‰, P < 0·001) and at t = 180 min (83 ± 5 v. 103 ± 8 δ‰, P < 0·05) (Fig. 5).
Breath 13CO2 enrichment after ingestion of sucrose with or without the addition of L-arabinose (n 12). Data are presented as mean with sem. Data were analysed with a two-way repeated-measures ANOVA. *P < 0·05, **P < 0·01; ***P < 0·001. L-ARA, L-arabinose drink; CONT, sucrose drink; PDB, Pee Dee Belemnite reference standard.

Gastrointestinal symptoms
Participants did not report any adverse events related to the gastrointestinal tract during the tests and in the period up to 1 week after the tests.
Discussion
By using a dual stable isotope methodology, we investigated the exact plasma glucose kinetics after ingestion of sucrose plus L-arabinose, compared with the ingestion of sucrose only, in young, healthy participants. We conclusively demonstrate that supplementation with L-arabinose attenuated the release of sucrose-derived glucose into the circulation.
Sucrose is a disaccharide that is broken down into monosaccharides glucose and fructose by sucrase in the small intestine. Previously, in vitro studies have shown that the plant-derived monosaccharide L-arabinose inhibits the ability of rat, porcine and human intestinal sucrase to hydrolyse sucrose into glucose and fructose(Reference Seri, Sanai and Matsuo10,Reference Krog-Mikkelsen, Hels and Tetens13,Reference Shibanuma, Degawa and Houda30,Reference Oku, Tanabe and Ogawa31) . Additionally, it has been reported that this inhibitory effect of L-arabinose is specific to sucrase as opposed to other α-glucosidases(Reference Seri, Sanai and Matsuo10). When L-arabinose forms an enzyme inhibitor–substrate complex with sucrase and sucrose, it does so in an uncompetitive manner, and the complex is maintained for several hours(Reference Seri, Sanai and Matsuo10,Reference Shibanuma, Degawa and Houda30) . In vivo studies have shown that co-ingestion of L-arabinose with sucrose attenuates the increase in plasma glucose concentrations when compared with the ingestion of sucrose only(Reference Krog-Mikkelsen, Hels and Tetens13,Reference Inoue, Sanai and Seri14) .
Importantly though, postprandial plasma glucose concentrations are influenced by multiple factors, such as RaE, EGP and the rate of glucose disposal. Exact plasma glucose kinetics after co-ingestion of sucrose and L-arabinose, however, were not known, and thus it was unclear whether L-arabinose delays sucrose digestion and subsequently slows down sucrose-derived glucose absorption, and whether L-arabinose affects hepatic glucose output.
In line with previous literature, we found that the addition of 7·5 g of L-arabinose to a 200-ml of drink containing 50 g of sucrose attenuated the sucrose-induced increase in plasma glucose concentration in the early postprandial phase (0–1 h post-ingestion) and induced a more gradual decrease of plasma glucose concentrations in the late postprandial phase (1–4 h). Furthermore, we showed for the first time that both the release of exogenous sucrose-derived glucose (RaE) separately and the combined release of exogenous and endogenous glucose (RaT) into the circulation were strongly reduced in the early postprandial phase for L-ARA compared with CONT and increased in the late postprandial phase. The combined disappearance of exogenous and endogenous glucose (RdT) was also decreased for L-ARA in the early postprandial phase, whereas the release of endogenous glucose into the circulation (EGP) was not affected in any phase. Altogether, our data demonstrate that ingestion of L-arabinose results in a more gradual digestion of sucrose, and therefore, a delayed absorption of glucose, without an effect on hepatic glucose output.
Postprandial hyperglycaemia has been linked to several serious health problems(Reference Blaak, Antoine and Benton1,Reference Stehouwer32) . It has been found that 1-h postprandial glucose concentrations are a stronger predictor of future T2D development than 2-h glucose concentrations, both in individuals with normal glucose tolerance as well as in individuals with IGT(Reference Pareek, Bhatt and Nielsen6). Sucrose contributes substantially to the average daily energy intake(Reference Newens and Walton33), and there are indications that excessive sucrose consumption is associated with increased risk of disease(Reference Macdonald34). We found that ingestion of L-arabinose with sucrose strongly delays the appearance of sucrose-derived glucose and attenuates the insulinemic response in the early postprandial phase compared with the ingestion of sucrose only. This is of clinical interest as a delay in sucrose digestion will attenuate or prevent hyperglycaemia in the early postprandial phase, resulting in more stable postprandial blood glucose concentrations. Similar effects of L-arabinose on acute postprandial increases in blood glucose concentrations would also be useful for the treatment of hyperglycaemia as well as the prevention of macrovascular and microvascular complications in people with IGT or T2D(Reference Stehouwer32). However, this has to be demonstrated in future research.
In line with the glucose kinetics, we observed a decrease in whole-body carbohydrate oxidation and an increase in whole-body fat oxidation in the early postprandial phase after ingestion of L-arabinose, while there was no change in total EE. Our 13CO2 enrichment data also suggest that the oxidation of glucose derived from the ingested sucrose was delayed after L-arabinose supplementation. This shift in substrate utilisation could be attributed to a greater supply of NEFA to the fat-oxidising tissue, secondary to a reduced inhibition of insulin-mediated lipolysis. Indeed, the insulin response was lower and the NEFA response was higher after co-ingestion of L-arabinose with sucrose compared with sucrose ingestion alone. The present data are in line with a previous study, in which the rise in glucose and the rise in insulin responses were attenuated by replacing sucrose by isomaltulose(Reference van Can, van Loon and Brouns35). This may contribute to a more favourable metabolic profile for the prevention of T2D.
It is important to note that the use of L-arabinose in earlier studies did not cause any gastrointestinal distress or other side effects in humans(Reference Inoue, Sanai and Seri14,Reference Kaats, Keith and Keith36) . This is in contrast to the gastrointestinal side effects that are regularly observed with other products that delay carbohydrate digestion, such as acarbose(Reference van de Laar, Lucassen and Akkermans9,Reference Rosak and Mertes37) . Acarbose is a medical α-glucosidase inhibitor prescribed to patients with T2D for the prevention of hyperglycaemia, and intake of acarbose may result in flatulence and abdominal discomfort(Reference Rosak and Mertes37). The side effects of acarbose are likely to be caused by the non-specific inhibition of multiple enzymes involved in breaking down complex carbohydrates, whereas L-arabinose specifically inhibits sucrase in the intestines(Reference Seri, Sanai and Matsuo10). Also, in our study, there were no adverse events related to the gastrointestinal tract reported by the participants, indicating that an addition of up to 7·5 g of L-arabinose to a 50 g of sucrose load is safe in an acute setting.
Apart from inhibiting the enzyme sucrase, L-arabinose is of particular interest due to its sweetening properties. Its relative sweetness to sucrose by weight was observed to be 39 %(Reference Moskowitz38). This implies that if L-arabinose is supplemented, it may be possible to reduce the amount of sucrose in food products to some degree, without affecting the sweetness of those products. This could lead to a further attenuation of postprandial glucose spikes.
The main strength of our study was the dual stable isotope methodology to comprehensively assess postprandial glucose handling. Yet, our study has several limitations to report. Firstly, it was evident that even 4 h after ingestion of L-ARA, there was still some exogenous glucose appearing in the blood. This strongly suggests that glucose absorption during L-ARA was delayed, rather than decreased. However, an extended postprandial testing period, for instance 6 h, may be required to draw firm conclusions. Secondly, it is important to note that glycaemic responses after sucrose-containing drinks are not necessarily comparable to the glycaemic responses after a solid, mixed meal. A study in rats has shown that L-arabinose after starch ingestion suppressed postprandial glycaemia to a larger extent than after sucrose ingestion(Reference Jurgoński, Krotkiewski and Juśkiewicz39). In healthy human participants, however, supplementation of 20 % L-arabinose relative to carbohydrate content to a single solid mixed meal did not alter glycaemic or insulinemic responses(Reference Halschou-Jensen, Bach Knudsen and Nielsen40).
It should be noted that our study was performed in healthy, young individuals. Our findings might be useful for the prevention of impairments in blood glucose homoeostasis and T2D in healthy individuals later in life, though this would require further research. Moreover, it would be of great clinical interest to also include individuals with IGT and T2D to investigate the acute effects of L-arabinose co-ingestion with sucrose on plasma glucose kinetics and substrate utilisation. This will provide essential information for rational development of nutritional strategies to treat individuals with hyperglycaemia.
In conclusion, our study has provided detailed information on glucose kinetics after ingestion of a sucrose drink supplemented with L-arabinose. We conclude that co-ingestion of L-arabinose with sucrose delays sucrose digestion, resulting in a slower absorption and oxidation of sucrose-derived glucose without causing gastrointestinal distress in young, healthy adults.
Acknowledgements
The authors greatly acknowledge the participants of this study. Furthermore, the authors would like to thank Hasibe Aydeniz, Annemie Gijsen, Joy Goessens, Wendy Sluijsmans and Antoine Zorenc for their analytical work involving the plasma metabolites and stable isotope measurements. The authors would also like to thank Gabby Hul, Jean Nyakayiru, Inez Trouwborst and Maria Christina Zeronian for their assistance with data collection and their assistance during the experimental tests.
Funding for this research was provided by Sensus B.V., Roosendaal, the Netherlands, a member of Royal Cosun. The study results and data contained in this publication have been developed by and/or for Sensus B.V. and/or Royal Cosun and are considered proprietary results and data of Sensus B.V. and/or Royal Cosun, who reserve the right to use these results and data for possible health claim requests. Sensus B.V. (Royal Cosun) has provided the investigational product L-arabinose and funding for conducting this study to KP. The funder has contributed to the conceptualisation of the study design as well as revising the manuscript.
R. C. R. M., E. E. V., L. J. C. v L. and E. E. B. formulated the research questions and designed the study. K. P. and J. M. G. S. carried out the study. E. E. V. provided essential materials. K. P., R. C. R. M., J. T., J. M. G. S. and L. J. C. v L. analysed the data. K. P., R. C. R. M., J. T., L. J. C. v L. and E. E. B. interpreted the findings. K. P., R. C. R. M., J. T., L. J. C. v L. and E. E. B. wrote the article. E. E. B. had primary responsibility for final content. All authors read and approved the final manuscript.
K. P. has received funding for conducting this study from Sensus B.V. (Royal Cosun). E. E. V. is an employee of Sensus B.V. (Royal Cosun). J. T. and L. J. Cv L. have previously received speaker’s fees, research grants, consulting fees, or a combination of these, from the Knowledge Center Sugar and Nutrition (KSV). R. C. R. M., J. M. G. S. and E. E. B. have no conflict of interest to report.
Supplementary material
For supplementary material/s referred to in this article, please visit https://doi.org/10.1017/S0007114521004153


 Open access