

The worldwide prevalence of overweight and obesity has been increasing at a dramatic rate over the last decades. According to the WHO, in 2008, 35 % of adults over the age of 20 years were overweight, whereas 10 % of men and 14 % of women worldwide were obese (BMI≥30 kg/m2)( 1 ). Overweight and obesity lead to adverse metabolic effects on blood pressure, cholesterol, TAG and insulin resistance. Risks of CHD, ischaemic stroke, type 2 diabetes mellitus and some types of cancer increase steadily with increasing BMI( 1 – Reference Brown, Higgins and Donato 6 ).
Many researchers recognize that the growing epidemic of chronic diseases in both developed and developing countries may be related to dietary and lifestyle changes( 7 – 9 ). The WHO emphasizes the role of diet and some dietary components in preventing and controlling morbidity and premature mortality resulting from non-communicable diseases( 7 ).
Similar to other developing countries, Serbia is currently undergoing a nutrition transition. Malnutrition and infectious diseases used to be the main cause of poor health in the early 20th century; however, chronic, non-communicable diseases stand out the most today. Obesity has become highly prevalent and a severe public health issue in Serbia. The results of the Health Survey in Serbia from 2006 showed that 55·7 % of the population was overweight, of whom 19·0 % were obese, and 46·5 % of adults suffered from arterial hypertension( 10 ). In 2011, 8·2 % of the population in Serbia already suffered from diabetes( Reference Sicree, Shaw and Zimmet 11 ). According to the International Diabetes Federation, the largest increase in the number of people with diabetes is expected in developing countries( Reference Sicree, Shaw and Zimmet 11 ). It is therefore expected that this growing trend will spread to Serbia as well.
The range of foods available on the market is increasing around the world. At the same time, the proportion of people suffering from hypersensitivity reactions to food is increasing. The prevalence of reported hypersensitivity reactions to food ranges from 3 % to 35 %( Reference Rona, Keil and Summers 12 ). It was even observed that 20 % of people will change their diet due to the suspicion that they do not tolerate a certain food or its ingredients( Reference Sicherer and Sampson 13 ).
Having in mind the growing prevalence of diet-related diseases mentioned above, as one of the most important preventive measures, governments, retailers and food companies are promoting nutrition labelling in order to help consumers make adequate food choices( Reference Storcksdieck genannt, Celemín and Larrañaga 14 ). The WHO included nutrition labelling as part of its global strategy on diet, physical activity and health. In order to help consumers make the adequate choice in accordance with health recommendations, legislation should provide accurate, standardized and comprehensive nutrition information on all foods( 15 ). Nutrition labels facilitate choices and access to nutrient-dense foods and are a very important part of a supportive environment( Reference Mhurchu and Gorton 16 ). Observational studies have consistently found a positive correlation between reading nutrition labels and healthier diets. Many consumers claim that nutrition labels influence their selection of foods( Reference Campos, Doxey and Hammond 17 – Reference Kristal, Hedderson and Patterson 21 ).
The format, content and position of nutrition labels have an important impact on consumers’ perception and hence on their choice of product( Reference Rayner, Wood and Mhurchu 22 ). Existing studies indicate that some types of nutrition labels are more effective than others in helping consumers choose healthier products. For example, user-friendly labels that provide information at a glance (such as on the front of the package) influence consumers’ buying behaviours and dietary intakes more effectively( Reference Hersey, Wohlgenant and Arsenault 23 , Reference Hawley, Roberto and Bragg 24 ).
A nutrition label is a very powerful marketing tool as well. Marketing-based statements can lead consumers to a decision based on scientifically non-justifiable and tendentious statements. Because of that, and due to the broad use of nutrition labels in shops, fast-food restaurants, restaurants and cantinas, it is necessary to continuously improve both national and international legislation in the field( Reference Campos, Doxey and Hammond 17 , Reference Rayner, Wood and Mhurchu 22 ). At present, declaration of nutrition information is voluntary in Serbia( 25 ) as well as in the European Union (EU)( 26 ), unless a food product contains nutrition and/or health claims. Nutrition declaration will become mandatory in the EU in December 2016( 26 ), whereas in Serbia this date has not yet been specified. In Serbia, the use of nutrition claims is regulated under the Regulation on Nutrition Labelling for Foodstuffs( 27 ), while the use of health claims is not currently defined by legislation. On the other hand, nutrition and health claims on food products are well regulated in the EU( 28 ).
The objective of the present research study was to determine the presence of nutrition labels on pre-packaged food products in retail stores in Belgrade, Serbia among different food categories, as well as to analyse the types of presentation.
Methods
The study was conducted in Belgrade, Serbia from March 2012 until June 2012. A survey of pre-packaged food products was carried out in three different food retail chains: ‘Maxi Delhaize’ (the largest food retail chain in the region), ‘DIS Market’ (the largest national food retail chain) and ‘SOS Market’ (discount/economy stores). The listed food retail chains were selected to allow for extensive coverage of different food manufacturers in order to present a complete availability of packaged food products in the territory of Serbia. The selected retailers also cover different customer profiles. As the lead international food retail chain in the region, ‘Maxi Delhaize’ stores mainly attract consumers with higher incomes. ‘DIS Market’, the greatest national retail chain in Central Serbia, advertises itself as offering the best value for money and mainly attracts middle-class customers. ‘SOS Market’ retail chain is designed for people with low incomes. For the purpose of the present research study, the survey of products was performed in the largest stores of each retail chain.
To summarize the above, the selected stores not only offer a wide variety of popular brands and foods present in Serbia but also cover different consumer profiles.
Ten categories of pre-packaged products were included in the survey and these product categories were defined as follows.
-
1. Breakfast cereals: cereal products that are consumed for breakfast with milk, tea or yoghurt.
-
2. Bread and toast: products based on flour, containing the word ‘bread’/’toast’ on the packaging.
-
3. Milk: products containing the word ‘milk’ on the packaging; refers to cow’s, sheep’s or goat’s milk, natural or with added flavour.
-
4. Yoghurt: fermented milk product, containing the word ’yoghurt’ on the packaging, natural or with added fruit.
-
5. Cheese: milk product, containing the word ‘cheese’ on the packaging.
-
6. Meat products: products of animal origin produced from muscle, fat, intestines and skin by different technological methods of processing and preservation.
-
7. Biscuits: products containing flour, sugar and fat, with or without a filling or a topping.
-
8. Ready meals: ready-packed meals containing protein sources (meat, fish or similar), carbohydrate sources (potatoes, pasta or similar) and vegetables, as well as the variety of products that do not contain all of the three elements.
-
9. Instant soups: powdered products which dissolve in water; containing the word ’soup’ on the packaging.
-
10. Soft drinks: carbonated, non-carbonated and fruit drinks stored in bottles or cans, and used as refreshments.
According to the Serbian household budget survey( 29 ), these food groups are the most common parts of diets in Serbia. That was the primary reason for selecting them for survey. These products represent the packaged foods that can be consumed at different times and on different occasions, i.e. foods that are used daily as a meal or a snack, both at home and outdoors.
The survey included all pre-packaged products, within the ten listed categories, that were available on the shelves in each store at the time of the survey. In the first store we visited, the survey covered all of the available products in each category. In the next two stores we analysed only the products that were not found in the previous one, in order to avoid unintentional repetition of the products surveyed.
The following characteristics of the product packaging were analysed.
-
1. The presence of a nutrition declaration, defined as information on the energy value and the content of certain nutrients in the food( 30 ).
-
2. The position of the nutrition declaration: either as front-of-pack (FOP) or back-of-pack (BOP). FOP information is defined as information that is located on the front of the box, in the central field of vision with the name of the product. The remaining area of the package is defined as BOP( 31 ).
-
3. The type of presentation of nutrition information: linear, table, FOP scheme-signpost, traffic light system or health logo. The ‘FOP scheme-signpost’ is supplementary nutrition information which represents the repetition of the elements of comprehensive declarations that are essential for health. The ‘traffic light system’ gives a warning about the level of certain nutrients in the product by using colours. The ‘health logo’ is supplementary nutrition information in the form of a symbol (which may vary from one logo to another) on the package. Its use is restricted to food products that fulfil certain nutrition criteria. A product marked with a ‘health logo’ can be considered a healthier choice in that particular category.
-
4. The content of the information presented on the BOP, defined as the ’Big 4’, the ‘Big 8’, the ‘Big 4 with additional information’ or the ‘Big 8 with additional information’ as follows:
-
a. the ‘Big 4’ refers to energy value and the amounts of protein, carbohydrate and fat;
-
b. the ‘Big 8’ refers to the ‘Big 4’ plus the amounts of sugar, saturated fat, fibre and sodium;
-
c. the ‘Big 4 with additional information’ refers to the ‘Big 4’ plus other nutrients but less than the ‘Big 8’; and
-
d. the ‘Big 8 with additional information’ refers to the ‘Big 8’ plus other nutrients( 30 ).
-
-
5. The information on the Guideline Daily Amounts (GDA)( 32 ).
-
6. The font size and legibility of relevant written information. The font size was measured using a ruler. It was considered adequate if the x-height of the font size was equal to or greater than 1·2 mm. In the case of packages whose largest surface area was less than 80 cm2, the x-height of the font size was considered adequate if it was equal to or greater than 0·9 mm( 26 ). Legibility is the degree to which individual characters in text are understandable and/or recognizable based on the appearance. It is determined by various elements, such as font size, letter spacing, spacing between lines, type of colour, typeface, width-to-height ratio of the letters, surface of the material and significant contrast between the print and the background. Legibility was evaluated subjectively.
-
7. The presence of nutrition claims. Nutrition claims indicate that a food has particular nutrition properties originating from its energy value and/or its content of certain nutrients( 28 ).
-
8. The format of the nutrition claims: text, numeric or symbol.
-
9. The type of nutrition claims:
-
10. The presence of health claims. A health claim is defined as the statement of a relationship between the food or its certain nutrients and health( 28 ).
-
11. The format of the health claim: text or symbol.
-
12. The type of health claim:
-
a. ‘function claim’ refers to a health claim that describes the physiological role of the nutrient in growth, development and functions of the body( 33 );
-
b. ‘general health claim’ refers to a health claim concerning specific beneficial effects of the consumption of a food or its constituents. Such health claims relate to a positive contribution to health, its improvement or a function of preserving health( 33 ); and
-
c. ‘reduction of disease risk claim’ refers to a health claim relating the consumption of a food or food constituent to the reduced risk of developing a disease or health-related condition( 33 ).
-
The general management of all three retailers approved the survey and the collected information/data.
Descriptive statistics were used to analyse the results.
Results
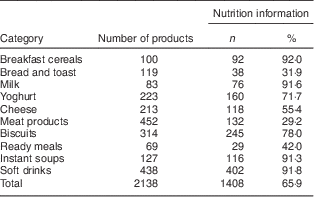
The study included 2138 pre-packaged food products from ten categories as presented in Table 1. The results showed that 65·9 % of all tested products contained some nutrition declaration. The presence of a nutrition declaration differed significantly by food category. The highest prevalence of nutrition information (90 % or more) was observed in the following categories: breakfast cereals, soft drinks, milk and instant soups. Furthermore, 78·0 % of biscuits and 71·7 % of yoghurts contained some nutrition information. In contrast, nutrition information was rarely present in the bread and toast category, as well as in meat products, where about one-third of all products had nutrition labels. A nutrition declaration was observed on about half of all cheese examined (55·4 %) and on 42·0 % of ready meals.
Number of products and the frequency of nutrition information presence per audited category. Survey of 2138 pre-packaged food products in three different types of retailers in Belgrade, Serbia, March–June 2012
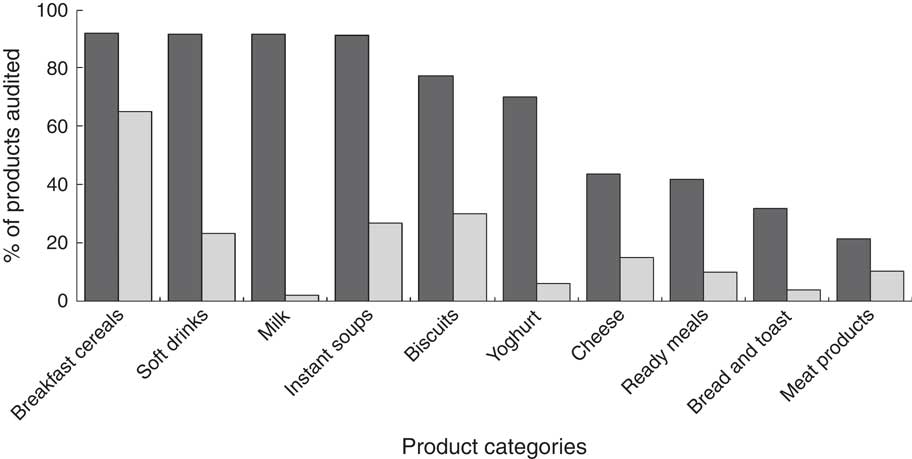
Analysis of the frequency of the presence of BOP and FOP nutrition information revealed that BOP information was displayed on 62·7 % of pre-packaged food products, whereas FOP information was displayed on 19·1 % of products. The FOP form was mainly used to highlight certain data about the products that were already listed in the BOP table. In a very few products (3·2 %) FOP information was the only nutrition information available. This was noted among meat products, cheese, yoghurt and biscuits.
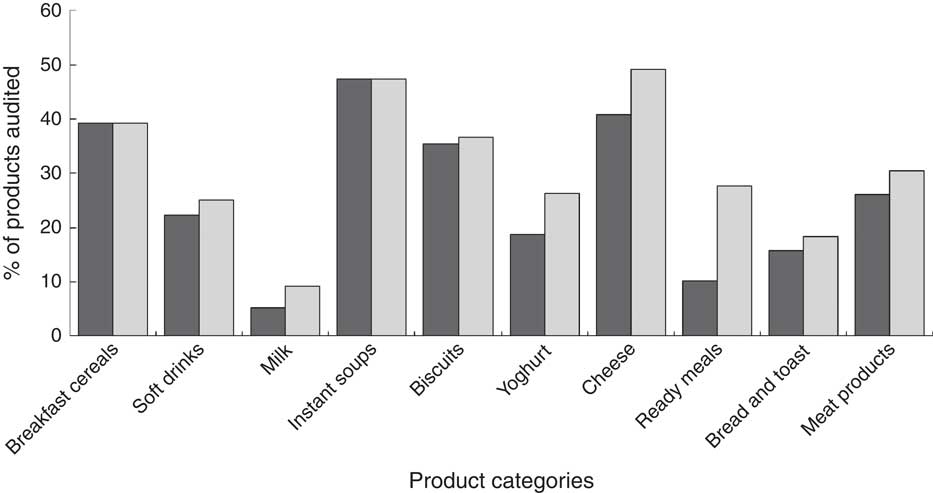
Figure 1 shows a large difference in the frequency of presence of nutrition information on the front and back of the packaging (FOP and BOP respectively) across the surveyed products in different categories. The BOP table was the dominant mode of display of nutrition information in all observed groups. It was most commonly observed in the following food categories: breakfast cereals, soft drinks, milk and instant soups (over 90 %), and the least common in meat products (21·5 %). For the FOP style of information, the leading category was breakfast cereals where it figured on 65·0 % of products. On the other hand, in other product categories, the FOP information was less often recorded. In food categories such as biscuits, instant soups and soft drinks, FOP information was recorded on approximately a quarter of the examined products. In the other groups, however, the proportion of FOP information was only up to 10 %. Only a few milk products (2·4 %) contained the FOP information.
Frequency of the presence of nutrition information on the back of the packaging (BOP; ![]() ) and on the front of the packaging (FOP;
) and on the front of the packaging (FOP; ![]() ) for the ten product categories. Survey of 2138 pre-packaged food products in three different types of retailers in Belgrade, Serbia, March–June 2012
) for the ten product categories. Survey of 2138 pre-packaged food products in three different types of retailers in Belgrade, Serbia, March–June 2012
The most widespread type of BOP presentation of nutrition information was the nutrition table, which figured on 95 % of all products with BOP information, whereas linear listing was displayed on 5 % of all products containing BOP information.
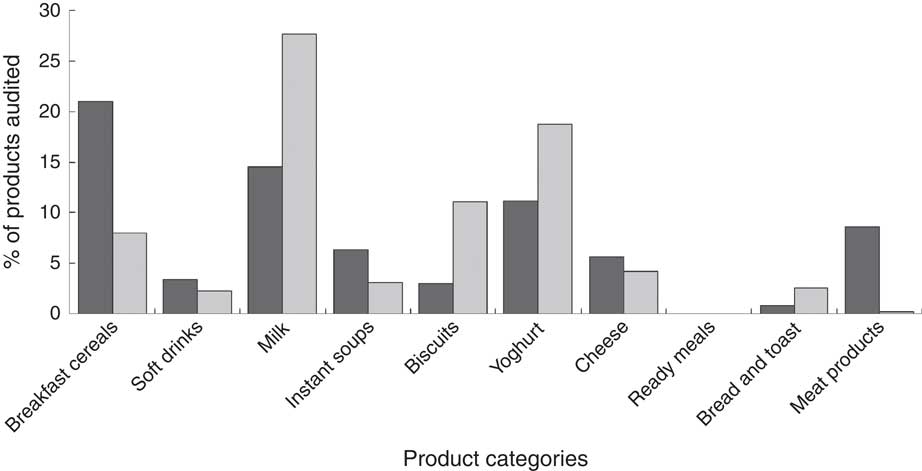
As for the contents of the nutrition declaration, the ‘Big 4’ and the ‘Big 4 with additional information’ figured on 40·9 % of all products. The ‘Big 8’ and the ‘Big 8 with additional information’ were present half as often (20·5 %). Energy content alone was recorded on 1·1 % of all selected products. More specifically, information about the energy content alone was found on meat products (0·8 %), breakfast cereals (0·2 %) and ready meals (0·1 %).
Figure 2 displays the contents of the nutrition information on the BOP table by product category. It shows that breakfast cereals and biscuits contained the most extensive nutrition labels. A nutrition table in the form of the ‘Big 8’ or the ‘Big 8 with additional information’ was registered on 75·0 % of breakfast cereals and 49·7 % of biscuits.
Contents of the nutrition information (![]() , ‘Big 4’ and ‘Big 4 with additional information’;
, ‘Big 4’ and ‘Big 4 with additional information’; ![]() , ‘Big 8’ and ‘Big 8 with additional information’;
, ‘Big 8’ and ‘Big 8 with additional information’; ![]() , energy value) on the back-of-pack (BOP) table for the ten product categories. Survey of 2138 pre-packaged food products in three different types of retailers in Belgrade, Serbia, March–June 2012
, energy value) on the back-of-pack (BOP) table for the ten product categories. Survey of 2138 pre-packaged food products in three different types of retailers in Belgrade, Serbia, March–June 2012
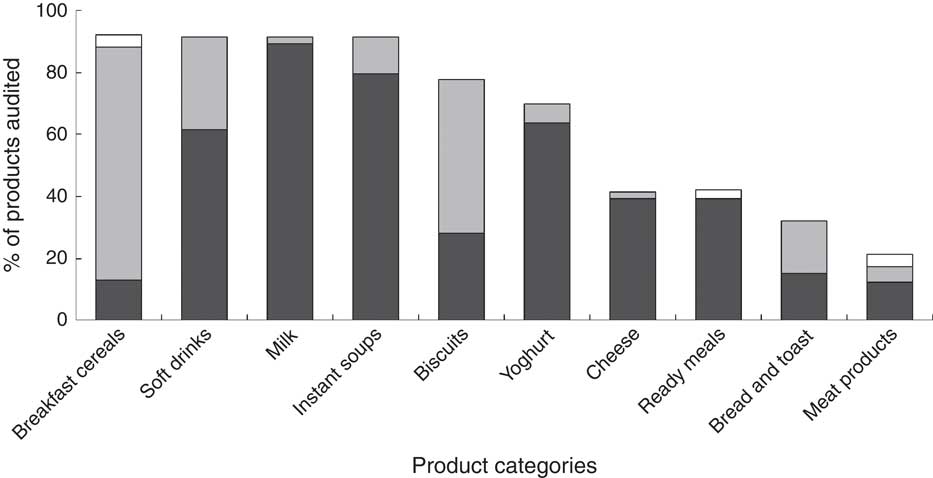
In the bread and toast category half of the products had more extensive information. On the other hand, the ‘Big 4’ or the ‘Big 4 with additional information’ was present on products from the following categories: milk (89·1 %), instant soups (79·5 %) and yoghurt (63·6 %). For milk and yoghurt products, the only additional information within the ‘Big 4’ was calcium content. The only category that contained the ‘Big 4’ or the ‘Big 8’ tables without additional information was instant soups. Among the investigated food categories where nutrition labels were less frequently present (cheese, ready meals and meat products), the ‘Big 4’ was the dominant way of labelling. The ‘Big 4’ figured on about 40 % of cheese and ready meals and on about 12 % of meat products.
Predominantly, the nutrition labels were expressed per 100 g of the product with the exception of 3·5 % of the investigated products. The additional information per serving was specified on 23·0 % of the products.
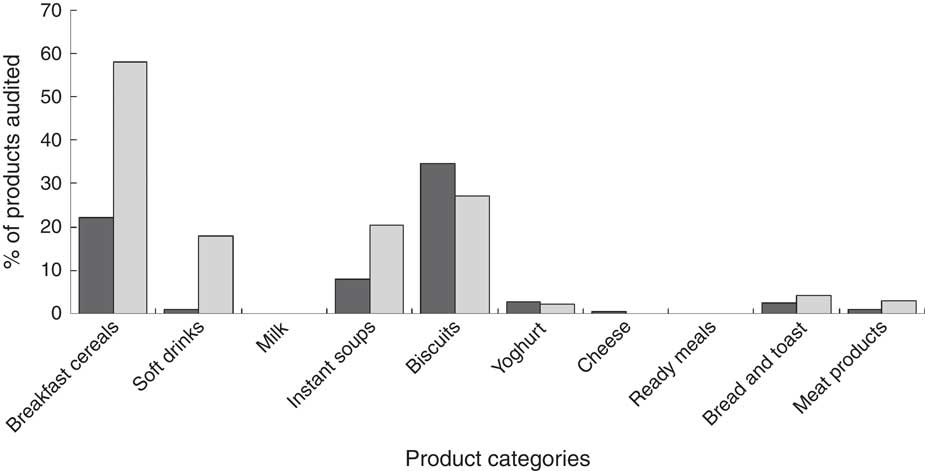
The GDA value was shown on 15·7 % of the products. The GDA system was present in the BOP table (7·4 % of food products) and the FOP scheme (12·6 % of products).
Figure 3 presents the results of the analysis of the presence of the GDA information depending on food category. The GDA value was usually provided on breakfast cereals (60·0 % of products) and biscuits (45·9 % of products). In the category of breakfast cereals, the GDA was more often displayed within the FOP schemes (58 % of products) than on the BOP table (22 % of products). Among instant soups and soft drinks the GDA value was provided on about 20 % of the products. In the other groups, this information was presented on less than 5 % of the products or was not present at all. The traffic light labelling style was not recorded on any of the reviewed products.
Frequency of the presence of Guideline Daily Amounts (GDA) information on the back of the packaging (BOP; ![]() , GDA on BOP) and on the front of the packaging (FOP;
, GDA on BOP) and on the front of the packaging (FOP; ![]() , GDA on FOP) for the ten product categories. Survey of 2138 pre-packaged food products in three different types of retailers in Belgrade, Serbia, March–June 2012
, GDA on FOP) for the ten product categories. Survey of 2138 pre-packaged food products in three different types of retailers in Belgrade, Serbia, March–June 2012
The font analysis included the x-height and legibility of the nutrition information. The font size was found to be too small for 27·6 % of all products. Additionally, the proportion of products with insufficient legibility increased to 31·5 % when the other factors contributing to unsatisfactory legibility were taken into account.
Figure 4 shows the frequency of appearance of inadequate font by product category. Inadequate font size was recorded on a wide range of products, varying from approximately 5 % to 50 % of the products within individual food categories. Too small font size was observed on over 40 % of products within the following categories: instant soups, cheese, breakfast cereals and biscuits. The most satisfactory category in relation to font size was milk, where only 5·3 % of the products had x-height less than the required EU mandatory level. In some product categories, x-height was appropriate but there was a problem of poor legibility. This was particularly evident among the following categories: cheese (49·2 %), ready meals (27·6 %) and yoghurt (26·3 %).
Frequency of the presence of inadequate font (![]() , inadequate x-height;
, inadequate x-height; ![]() , poor legibility) in the nutrition information for the ten product categories. Survey of 2138 pre-packaged food products in three different types of retailers in Belgrade, Serbia, March–June 2012
, poor legibility) in the nutrition information for the ten product categories. Survey of 2138 pre-packaged food products in three different types of retailers in Belgrade, Serbia, March–June 2012
The presence of health logos was very small (3·7 %). A health logo was registered on the following categories: breakfast cereals (18·0 %), yoghurt (11·2 %) and biscuits (11·1 %). Among other food categories, this information was not highlighted (data not shown).
The presence of nutrition and health claims is shown in Fig. 5. Nutrition claims were recorded on 6·6 % of all products and health claims on 6·3 % of all products.
Frequency of the presence of nutrition claims (![]() ) and health claims (
) and health claims (![]() ) in the nutrition information for the ten product categories. Survey of 2138 pre-packaged food products in three different types of retailers in Belgrade, Serbia, March–June 2012
) in the nutrition information for the ten product categories. Survey of 2138 pre-packaged food products in three different types of retailers in Belgrade, Serbia, March–June 2012
The nutrition claims were usually present on nutrient-dense, so-called ‘healthy’ food products: milk (14·5 %) and yoghurt (11·2 %). They also appeared on breakfast cereals (21·0 %), which are perceived as ‘healthy’ by the general public. In many cases, however, their nutrition content (high sugar level) does not truly meet evidence-based criteria for healthy food products. The nutrition claims are of the utmost importance in these three food categories that are commonly used in everyday diet. They can act as guidelines for consumers in choosing a product of a certain quality, e.g. with less fat or more fibre. In the other groups, nutrition claims were rarely observed (less than 10 % of the surveyed products).
Analysing the format of the nutrition claims, text was the most commonly used format, displayed on 87·3 % of all products that had nutrition claims. The numerical format was present on the diary products: yoghurt and milk (about 65 %), but less frequently on cheese and soft drinks (about 25 %). In the other groups of products this format was not present. The symbol format was present only on two groups of products: on nearly a quarter of breakfast cereals and on all biscuits (the whole grain symbol). It was observed that a text statement with the same message simultaneously supported the symbol representation on the products.
Analysis of the type of nutrition claims revealed that the ‘nutrient content claim’ was present on the majority of products in all of the groups. ‘Nutrient comparative claims’ were noticed in a greater proportion on products such as yoghurt (60 % of all yoghurts had nutrition claims) and soft drinks (40 % of all soft drinks had nutrition claims).
Health claims, as well as nutrition claims, were present more often on the so-called ‘healthy products’. They were present on 27·7 % of milk products, on 18·8 % of yoghurts and on 8 % of breakfast cereals. Health claims were noticed on 11·1 % of biscuits, which may not be considered a healthy food choice due to their high energy and low nutrition value. Among the other groups of products, health claims were sporadically present (less than 5 % of the surveyed products).
The health claims were often in the form of text (97 %). However, in the three groups where health claims were most commonly present, the manufacturer decided to present them by a symbol (e.g. heart-shaped symbol, slim human figure). This form of presentation of the health claim was present on 55 % of milk and yoghurt products and on all breakfast cereals.
The presented health claims were mainly addressing the physiological role of some nutrients in the growth, development and functioning of the body, so-called ‘function claims’ (57·1 %), while ’general health claims’ were less frequent (25·9 %). Finally, health claims related to the ‘reduction of disease risk’ were present on 17 % of all the food products investigated.
Discussion
To the best of our knowledge, the present research is the first comprehensive study about nutrition labels on pre-packaged foods in Serbia. The strength of the study is that the analysis was carried out in retail stores, replicating the conditions in which consumers shop daily. It provides an insight into the real-life exposure of consumers to nutrition labels.
The results show that two-thirds of the examined products contained nutrition information; 62·7 % of the products displayed nutrition information on the back of the packaging (BOP) and 19·1 % on the front of the packaging (FOP). According to the Codex Alimentarius standards all foods should have a nutrition declaration( 34 ), which can be considered the ‘gold standard’. If we compare the current situation in Serbia with this benchmark, the results presented herein may be considered unsatisfactory. One of the possible explanations may be related to the fact that in Serbia, at the time of the survey, nutrition labelling on pre-packaged foods was voluntary unless food products contained nutrition and/or health claims( 25 ). At present, there are no regulations at the state level which encourage food manufacturers to provide a nutrition declaration and improve their products in order to achieve higher nutritional quality. Serbia is still far away from countries such as the USA, Australia and New Zealand, where the prevalence of nutrition information has already reached 100 %( Reference Legault, Brandt and McCabe 35 , 36 ).
The EU funded a project called ‘Food Labelling to Advance Better Education for Life (FLABEL)’ aiming to assess the penetration of nutrition labelling on various food products in all twenty-seven EU Member States and Turkey. The survey revealed different results across several European countries( Reference Storcksdieck genannt, Celemín and Larrañaga 14 ). That study identified the UK and Ireland as the leading countries in food nutrition labelling. These countries, however, may not be comparable with Serbia, considering their level of development. It would be more appropriate to compare Serbia with Slovenia and Turkey. Slovenia, a current member of the EU, was a former Yugoslav republic as was Serbia. Turkey is the only country in the project that is not an EU member, but is on the path towards EU, similarly to Serbia. In these two countries the penetration of nutrition food labelling was at the lowest level. The average European penetration of BOP was 85 %, but in Slovenia was 70 %. The UK showed the highest penetration of FOP (82 %), while Turkey had the lowest (24 %). In comparison with that, the results obtained in Serbia are unsatisfactory especially considering that the survey was conducted three years later. In particular, a major drawback is the rare presence of FOP signposting in Serbia. Some researchers suggest that placing nutrition information on the front of packaging is more effective than on the side or on the back( Reference Grunert 37 , Reference Wansink 38 ).
Apart from the fact that the nutrition information was not regularly present, our research study found some other problems as well. The nutrition tables are not uniform, both in their contents and in their form. The wide range of different contents of nutrition information noticed among packaged foods in Serbia can be explained by the domestic regulations. These give manufacturers the freedom to present nutrition information in the way that suits them best. For example, manufacturers can choose to present nutrition information as the ‘Big 4’, the ‘Big 8’ or in other forms. Our suggestion is that the contents of the nutrition declaration should always be in the form of the ‘Big 8’. We therefore consider the current situation unsatisfactory because of the frequent presence of insufficient information. In our study, the ‘Big 4’ was observed twice as often as the ‘Big 8’. This finding is in contrast with the FLABEL results, which generally reported that the ‘Big 8’ was more frequent than the ‘Big 4’ (49 % v. 34 %)( Reference Storcksdieck genannt, Celemín and Larrañaga 14 ). There were some countries, however, where the situation was similar to that in Serbia: Turkey, Lithuania, Latvia, Estonia and Bulgaria; these countries have a poor trend of nutrition labelling.
The form of the information, such as the letter size, is of crucial importance for consumers. The consumer should be able to read the nutrition information and make the adequate choice accordingly. At the time of the present study, Serbia did not have any legislation regulating the legibility of nutrition information. This implies that the legibility of the food nutrition labelling was left to the food manufacturers. It is therefore not surprising that we found poor legibility of nutrition declarations in almost one-third of all surveyed products. Defining the minimum font size is crucial in improving the nutrition declaration. The current EU standards state that the x-height of the font size should be equal to or greater than 1·2 mm( 26 ). Nutrition declarations, even when being the right size and form, do not always provide consumers with all of the necessary information they require in a user-friendly format( Reference Temple and Fraser 39 ).
Given the current situation in Serbia, the purpose of the nutrition declaration is compromised. The real question is whether manufacturers have a truthful intention to inform consumers about the product or are just using these ineligible labels as a marketing tool. Faced with a variety of unreadable messages, the consumer can feel confused and may easily give up on reading the declaration and choose other, more aggressively advertised products. Similar problems were observed by researchers in China who proposed necessary improvements and legislation in this area( Reference Wang, Chen and Liu 40 ).
Recently the focus of interest is on the type of food labels, which should not only provide information but also give advice to consumers. The evidence reveals that most consumers have problems interpreting this information when selecting a healthy diet( Reference Temple and Fraser 39 ). According to the recommendations by Rayner et al., all foods should have simply designed supplementary nutrition information which at least can be interpreted, such as the traffic light labelling. The number of these schemes in use should be one( Reference Rayner, Wood and Mhurchu 22 ). In Serbia, the FOP scheme was present on 19·1 % of all surveyed products, and the GDA value within the FOP scheme on 12·6 % of all products. The proportion of GDA information is similar to the situation in Slovenia, but higher than in Turkey, where the GDA is located on only 2 % of products. This is far less than in the UK and Ireland (63 % and 58 %, respectively) where this type of food labelling is being actively promoted( Reference Storcksdieck genannt, Celemín and Larrañaga 14 ). The traffic light warning system, which greatly enhances the ability of consumers to assess the nutritional value and quality of food( Reference Hawley, Roberto and Bragg 24 ), was not observed in Serbia. We conclude that the observed situation in our study differs from the proposed benchmark.
The presence of a health logo, which by definition is approved by the legal authorities, is widely compromised in Serbia. In fact, in Serbia there are no legal health authorities that either assign these symbols or clearly define nutrition criteria that need to be fulfilled by a particular food product. The existence of different arbitrary symbols on the packaging is very challenging because it can mislead the consumer. This area requires serious regulations, which are already present in the other developed countries, especially Sweden and The Netherlands( 41 , 42 ).
Some products on the Serbian market display health claims which suggest that certain foods heal and/or prevent certain diseases. We find such claims unacceptable. All health claims should be based on medical evidence and should meet particular Codex Alimentarius standards( 33 ). At present, no such standards exist in Serbia. This allows food manufacturers to manipulate and deceive consumers using these misleading clams as marketing tools for the deception.
Unlike health claims, the use of nutritional claims is regulated by law in Serbia( 27 ). Nutrition claims were encountered on 6·3 % of the products in the present survey, which is less than in other developed countries. In the EU, on average, 25 % of the products had nutrition claims( Reference Storcksdieck genannt, Celemín and Larrañaga 14 ), while in Ireland nutrition claims were recorded on nearly half of the products (47·3 %)( Reference Lalor, Kennedy and Flynn 43 ). The importance of clear and truthful nutrition and health claims was noted by Barreiro-Hurlé et al. ( Reference Barreiro-Hurlé, Gracia and de-Magistris 44 ). They indicate that such claims may reach out to those who are less likely to read nutrition labels, such as people with lower nutrition knowledge or more hedonic lifestyles( Reference Barreiro-Hurlé, Gracia and de-Magistris 44 ).
The results of our study indicate a need to improve the nutrition declaration in Serbia. This would greatly assist consumers in selecting products according to their health condition and the available guidelines. It is believed that such labelling would encourage food manufacturers to improve the quality of their products. This was observed in The Netherlands once a simple ‘healthy choice’ FOP logo was introduced( Reference Vyth, Steenhuis and Roodenburg 45 ).
In the authors’ experience, food manufacturers are generally reluctant to accept any suggestion of a food labelling system unless it is legally enforced. Legislation is more efficient than the various recommendations and incentives up to a certain extent( Reference Legault, Brandt and McCabe 35 , Reference Wang, Chen and Liu 40 ).
The present study faced several limitations. Gathering of the data and the survey took place in Belgrade, the capital of Serbia, the largest and most developed city in country, in the largest stores. Smaller shops and stores in rural regions were not taken into consideration. We may therefore have omitted to analyse products by less known local producers and/or illegally imported products from neighbouring countries. The impact of this omission is likely to be negligible because of the fewer number of such products. Hence, it should not have any significant impact on the obtained results. We failed to survey all of the available product categories on the market. Instead, we chose ten listed categories of products that consumers commonly use in their everyday diet and that are officially included in the consumption basket.
Conclusion
To the authors’ knowledge, the present research study is the first one on nutrition labelling carried out in Belgrade, Serbia. It reveals that the current situation of nutrition labelling is poor and rather unsatisfactory. The greater involvement of relevant legal health authorities and the improvement of legislation will improve the current situation, particularly given the forthcoming harmonization with the EU regulations. These results provide the basis for subsequent studies involving the reading, the understanding and the use of the nutrition labels by consumers in Serbia.
Acknowledgements
Financial support: This work was supported by the Ministry of Education and Science, Serbia (contract number OI 175067). The funder had no role in the design, analysis or writing of this article. Conflict of interest: None. Authorship: D.B.D. and J.B.J. conceived and designed the study. D.B.D., D.V.T. and K.Ž.P. collected the data. D.B.D. and J.B.J. wrote the paper. N.D.V. and J.B.J. made critical corrections and revised the manuscript. Ethics of human subject participation: Not applicable.


