

Introduction
The formation of ice in polar ice sheets results from densification processes of dry snow and firn. Three stages of densification are generally considered. During the first stage, the densification of snow is mainly a structural re-arrangement of grains by grain-boundary sliding. Sintering is driven by the temperature gradient in the first few meters and by surface tension. Transport mechanisms such as evaporation-condensation and surface diffusion contribute to rounding the grains and intergranular bonding (Reference Anderson, Benson and KingeryAnderson and Benson, 1963; Reference GowGow, 1975). From Reference Anderson, Benson and KingeryAnderson and Benson (1963), the re-arrangement of unbounded grains dominates the densification of highly porous snow. The critical density of ~0.55 Mg m−3 (relative density ~0.6) would represent the limit beyond which grain packing is not preponderant. The depth at which this critical density is reached increases as temperature decreases (Reference Anderson, Benson and KingeryAnderson and Benson, 1963; Reference GowGow, 1975; Reference Herron. and LangwayHerron and Langway, 1980). It is about 30 m at Voslok Station (Antarctica) at -57 JC and about 12 m at Site 2 (Greenland) at −23.3°C (Reference Herron. and LangwayHerron and Langway, 1980). The effect of the accumulation rate must be also considered (Reference Herron. and LangwayHerron and Langway, 1980; Reference Nishimura, Maeno and Satow.Nishimura and others, 1983).
The second stage is firn (consolidated snow). Since the seasonal variations of surface temperature disappear below 10 m, the densification of firn can be considered as isothermal. The end of this stage is characterized by the growth of the impermeable pore-space fraction vs depth under the increasing overburden pressure. The average number of bonds per grain (coordination number increases with density and neck growth is achieved by creep (Reference Alley and Bentley.Alley and Bentley, 1988).
During the final stage, the atmospheric air is trapped in the formation of cylindrical and spherical pores, and further densification of bubbly ice is driven by the pressure lag between the ice matrix and the air in bubbles (Reference Alley and Bentley.Alley and Bentley, 1988; Reference Salamatin, Lipenkov and Duval.Salamatin and others, 1997).
The potential significance of density profiles for glaciological studies has been discussed by Reference Lipenkov, Salamatin and DuyaLLipenkov and others (1997). For example, during the firn ice transition, the air inside the pores becomes progressively isolated from the atmosphere prevailing at the surface of the ice sheet. The air content in ice is directly related to the porosity, temperature and pressure at the time corresponding to this transition. As atmospheric pressure and altitude are linked by the hydrostatic equation, air content depends on the surface elevation of the ice sheet (Reference Martinerie, Lipenkov., Raynaud and ChappellazMartinerie and others, 1994). Another application of the study of the transformation of snow to ice is the dating of gas with respect to the ice. The age of the air enclosed in ice is of central interest to the study of trace gases climate relationship (Reference Raynaud, Jouzel., Barnola., Chappellaz, Delmas and Lorius.Raynaud and others, 1993). It is younger than the age of the ice itself, since the air is trapped well below the surface. Dating the air with respect to the ice implies knowing where the pore closure occms in the firn.
Based on the analogy between the hot-isostatic pressing of engineering materials, pressing-sintering mechanism maps were constructed for snow and polar firn (Reference Maeno. and EbinumaMaeno and Ebinuma 1983; Reference Ebinuma and Maeno.Ebinuma and Maeno, 1987; Reference WilkinsonWilkinson, 1988). Calculations have been done on the basis of the Reference Wilkinson and Ashby.Wilkinson and Ashby (1975) model, which contains questionable assumptions. The number of contacts per particle (the coordination number Z) is assumed constant and the pore is assumed to be rounded (Reference Swinkel, Wilkinson, Arzt and Ashby.Swinkels and others, 1983). A geometrical model was developed by Reference Arzt.Arzt (1982) and Reference Fischmeister and ArztFischmeister and Arzt (1983), and applied to the densification of firn by Reference Arzt, Ashby and Easterling.Arzt and others (1983) and Reference AshbyAshby (1990). Densification is modelled by considering mono-size spherical powders and by allowing each particle to increase in radius around fixed centers. The continuous increase in the number of contacts per particle and the growth of the average contact area is modelled. Results are in agreement with those given by Reference Maeno. and EbinumaMaeno and Ebinuma (1983) on the preponderance of power-law creep for the densification of polar firn.
The work described here is centered on the simulation of firn densification by using the Arzt model. The deformation of particles is assumed to occur by power-law creep with the exponent of the flow law equal to three. Numerous density profiles are used to validate the geometrical model of Reference Arzt.Arzt (1982) describing the structural evolution during the second stage of densification. This study is also focused on the analysis of the snow-firn transition. It is shown that the relative density D0, corresponding to the transition between grain-boundary sliding and power-law creep as the dominant densification mechanism, is lower than the experimental maximum-packing density of spheres (D0 = 0.64). Structural parameters introduced in this model are calculated from a detailed analysis of the two-dimensional structure of this porous medium obtained by image processing.
Densification of Firn by Power-Law Creep
Equations for the rate of densification for firn of initial relative density Do are directly derived from the geometrical model developed by Reference Arzt.Arzt (1982). The densification rate of firn is given by:

where a is the average contact area in unit of R2 is the initial particle radius), P is taken equal to the ice-load pressure, P* is the effective pressure acting on an average contact area and Z is the coordination number at the relative density D. The relative density (D) is the ratio between the sample density and the pure ire density.
The driving force due to surface tension is always very-low compared to that resulting from the external pressure (Reference GowGow, 1968). With a typical radius of pores of 0.1mm, the pressure due to the surface tension is of the order of 1 kPa, i.e. a very low value compared with the ice pressure. Calculations were done with:

where Q is the activation energy (Q = 60 KJ mol−1) deduced from the densification of bubbly ice (Reference PimientaPimienta, 1987), R and T are respectively the gas constant and the absolute temperature.
Equation (1), giving the densification rate of firn as a function of the effective pressure, can be written as:

According to the power-law creep mechanism (n = 3) and with the value of the experimental parameter A(T) (Reference PimientaPimienta, 1987), the experimental values of f(D) were deduced from Equation (2) and from the densification profiles for several sites in Antarctica and Greenland (cf. Table 1). Equation (1) was used to obtain the model variations of f(D). As shown in Figure 1, the experimental profiles f(D) are well reproduced by the physical model with Do varying between 0.53 and 0.61 in the site-temperature range of −19° to −57°C. On the other hand, the value of D0 is always lower than the value corresponding to the maximum packing density. These results will be discussed further.
profile of the function f vs relative density for seven sites in Greenland and Antarctica ( Table 1). The theoretical curves giving the variation of f (D) with relative density were obtained for three values of D0.

Main characteristics of the sites studied in Antarctica and Greenland

Structure of Firn
Characterization of the Structure
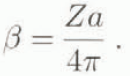
The understanding of the transition between snow and firn can be improved by analysing the evolution of the structure of (his porous material near the snow-firn transition and for different sites. The parameters necessary to test densification models include the average number of bonds per grain (Z) and the average contact area relative to the grain-size (a). These parameters cannoi be calculated with two-dimensional structural analysis. So, we prefer to work with the structural parameter: the surface fraction of the average grain involved in grain bonds (β). This parameter is also known as the “contiguity factor” (Reference Underwood.Underwood, 1970).
With the model parameters, β is given by:
With a two-dimensional structural analysis, the parameter β is related to the specific surface area of the grain–pore interface (Sv(g-p)) and the specific surface area of the grain-grain interlace (Sv(g − p)):

In the case of the grain-grain interface, surfaces shared by two grains are counted twice.
The technique used to characterize the structure of snow and firn is based on photographs of the surface of thick samples using reflected light. In order to observe the pore structure and grain boundaries, sections of around 10 mm are cut. Samples are then polished using a microtome and placed in a plastic sheath at −12°C for about 12 hours. Sublimation takes place preferentially in the highly disordered zones, i.e. at grain boundaries. Using this technique, observation in coaxial reflected light shows relief differences on the surface of the samples, making it possible to see the pores and grain boundaries. This procedure simultaneously allows the determination, with only one image, of the porous network and grain boundaries. Photographs were taken with a Leica MZ8 binocular fitted with a coaxial episcopic light. A similar procedure was recently used for ice by Reference Nishida and Narita.Nishida and Narita (1996). But, the etching was obtained by rubbing the surface with alcohol. Our technique was tested in the field on non-impregnated samples of firn and ice, over a range of relative densities from 0.5 to 0.99. In a second step, these photographs were treated by image processing to extract the parameters defined above.
Results
A set of measurements was made during the winter of 1995 96 at Vostok Station (Antarctica). Images of samples were recorded during drilling a 250 in shallow core (Bh7) and also from another core stored at Vostok, originating from the Mirniy-Vostok traverse at points 200 km from Mirniy (Km200). Characteristics of these two sites are given in Table 1.
Figure 2 gives the evolution of the structure of firn near the snow-fim transition for Bh7 and Km200. Important features of the structure of this porous medium can be observed on these binary images. In particular, for low density, aggregates of ice crystals clearly appear. This is an important point related to the snow firn transition, since this means that at the snow-firn transition (relative density of 0.6) a significant surface fraction of grains is involved in bonds. The evolution of the parameter β with relative density is given in Figure 3 for Bh7 and Km200. The curves taken from the model of Reference Arzt.Arzt (1982) applied to the densification of firn with two values of D0 (0.53 and 0.57) are given by comparison. For the two sites, more than 40% of the surface area of grains is involved in grain-grain interfaces at the relative density of 0.6, whereas the theoretical value must be equal to zero at the beginning of the second stage of densification.
Evolution of the structure of firn near the snow firn transition. Binary images obtained by image processing of photographs taken in refected light from sections of the Vostok (Bh7) and Km200 cores.

Fraction of surface area of average grain involved in bond (β) vs relative density for two sites: (![]() ) Vostok (Bh7) and (
) Vostok (Bh7) and (![]() ) Km200. Model curves with two values of D0: (
) Km200. Model curves with two values of D0: (![]() ) D0 = 0.53 and (
) D0 = 0.53 and (![]() ) D0 = 0.57.
) D0 = 0.57.

The formation of grain bonds during the densification of snow could result from the structure of snow at deposition or after melaruorphism in the first few meters of the ice sheets. Indeed, snow grains are generally composed of polycrystal-line ice grains and this texture is retained during meta-morphism (Reference FuchsFuchs, 1959; Reference Sommerfeld. and LaChapelle.Sommerfeld and LaChapelle, 1970; Reference Arons and Colbeck.Arons and Colbeck, 1995). Another explanation for the presence of grain bonds at the stage of snow compaction is the plastic deformation of particles under the overburden pressure. Both deformation and grain-boundary sliding would occur concurrently at the beginning of compaction. There will certainly be micro-regions where deformationless particle re-arrangement is prevalent but also others where contact flats are formed by plastic deformation. Then, the transition between snow and firn corresponds to a change in the dominant densificalion mechanism. In snow, particle re-arrangement by sliding is the dominant densification mechanism and power-law creep is the dominant one in firn. Obviously, both mechanisms concurrently operate in a relative density range close to the transition D0.
From the validation of the Arzt model for firn (Fig. 1), we have assumed that at D0 the particle is not a grain but an aggregate of grains, in order to make the contact area between aggregates equal to zero at D0. This is physically compatible with the occurrence of power-law creep during densification of snow, even if this densification mechanism (power-law creep) is not yet dominant.
Considering densification by plastic deformation concerns groups of crystals (aggregates) and not one grain, the parameter βa for the aggregate must be equal to zero at D0. Sv0(g − P) is the specific surface area of the grain-pore interface at D0; this value also corresponds to the specific surface area of the aggregate-pore interface. Assuming a constant size of the average surface of aggregates, the parameter (1 −(βa) which represents the fraction of free-surface area of average aggregate, is given by:

This parameter has been determined by image processing on Bh7 and Km200 cores. Its evolution with relative density is given in Figure 4 with that obtained by assuming there is no aggregate. These structural data are compared with model curves. The results given in Figure 1 appear to be compatible with a description of the firn as a group of aggregates.
Fraction of free-surface area of grain (open symbol) and aggregate (solid symbol) vs relative density for two sites (![]() and
and ![]() ) Vostok (Bh7) and ∆ and
) Vostok (Bh7) and ∆ and ![]() ) Km200. Model curves with two values of D0: D0 = 0.53 for Vostok and D0 = 0.57for Km200.
) Km200. Model curves with two values of D0: D0 = 0.53 for Vostok and D0 = 0.57for Km200.

Discussion
Variation of D0 With Temperature
The relative density D0 appears to correspond to the transition between densification by grain-boundary sliding and densification by power-law creep as a dominant densification mechanism. The first process is Newtonian, whereas densification by particle deformation is associated with a flow-law exponent equal to 3 (Reference PimientaPimienta, 1987). Densification of snow by grain-boundary sliding has been modelled by Reference Alley.Alley (1987). The model yields a good fit to densification data and it accounts for the increase ofthe load with a decrease in temperature. To explain the variation of D0 with temper-ature, the competition between sliding and grain deformation must be assessed. With regard to the effect of the pressure, the power-law creep should prevail at a lower density in cold sites. From Table 1, the load in the transition zone is about three times higher at −57°C than at −20°C The strain-rate increase induced by this variation of load is respectively 3 for sliding and 27 for particle deformation. This effect is probably at the origin of the decrease of D0 with site temperature. Rut, it is also necessary to take into account the variation of the ice viscosity with temperature. The activation energy for the grain-boundary viscosity is about 42 kj mol −1 (Reference Alley.Alley, 1987). It is about 60 kJ mol−1 for the power-law creep. The variation of the activation energy with the densification process therefore partially counteracts the effect of the load. Indeed, from −20° to −57°C:, the strain rate is divided by about 15 for sliding and by 45 for the power-law creep. By taking into account both the effect of the load and the effect of temperature, the strain rale associated with the non-linear densification process decreases by a factor of 1.5 with a decrease of temperature from −20° to −57°C, whereas the strain rate associated with sliding decreases by a factor of 5. So, in the colder site, the power-law creep process becomes the dominant densification mechanism at lower density. The final ellect is a decrease with temperature of the relative density Do, corresponding to the transition between snow and firn, as indicated by experimental data (Fig. 1).
Relation Between D0 and the Firn Structure
It was shown above that the density at the end of the first densification stage, i.e. at the end of grain-boundary sliding as a dominant densification mechanism, was taking the lowest value in the coldest sites. Figure 5 shows that the specific surface area of the solid-pore interface Sv(s/p) at a relative density close to Do is lower at Bh 7 than Km200. These data show that, at a given density, the pores are bigger in cold sites. These results are in accordance with a worse re-arrangement of grains in the coldest sites at the end of the first stage. So, a low value of D0 appears to correspond to a relatively coarse pore structure,
Specific surface area of the grain-pore interface vs relative density for two sites: (![]() ) vostok (Bh7) and (∆) Km200.
) vostok (Bh7) and (∆) Km200.

Conclusion
The density profiles of polar firn have been reproduced by a geometrical model developed for the densification of an irregular packing of mono-size spheres. The transformation of snow to firn is defined as the transition between grain-boundary sliding and power-law creep as a dominant densification process. The relative density at the transition Do is lower than the value corresponding to the dense packing of spheres and decreases with temperature. Contact flals between grains are formed in snow by plastic deformation, whereas sliding is the dominant densification mechanism. Variations of Do with temperature are shown to be related to variations in the load between sites for a given density.
The characterization of the structure of snow and firn by photographs in coaxial reflected light of thick samples and image processing is essential to bear out assumptions made on densification models and the definition of the snow-firn transition.
Acknowledgements
This work was supported by P.N.E.D.C. (Programme National d’Étude du Climat), C.N.R.S. and by C.E.C. (Commission of European Communities) Environment program.
We acknowledge the Russian Antarctic Expeditions, the Arctic and Antarctic Research Institute, U.S. National Science Foundation (Division ol Polar Programs and I.F.R.T.P. (Institut Français pour la Recherche el la Techno-logie Polaires) for logistic support at Vostok Station. A.Manouvrier is specially acknowledged lor the drilling at Vostok Station.
The Laboratoire de Glaciologic et Géophysique de l’En-vironncment has an agreement with the Université Joseph Fourier de Grenoble.


