


1. Introduction
Dark patterns are online user interfaces which seek to subvert, manipulate or impair user autonomy, decision-making or choice (Narayanan et al., Reference Narayanan, Mathur, Chetty and Kshirsagar2020; OECD, 2022).Footnote 1 They are used in e-commerce, mobile apps (Geronimo et al Reference Di Geronimo, Braz, Fregnan, Palomba and Bacchelli2020), shopping websites (Mathur et al., Reference Mathur, Acar, Friedman, Lucherini, Mayer, Chetty and Narayanan2019), social media networks (Mathur et al., Reference Mathur, Narayanan and Chetty2018) and for privacy notices (Utz et al., Reference Utz, Degeling, Fahl, Schaub and Holz2019; Nouwens et al., Reference Nouwens, Liccardi, Veale, Karger and Kagal2020). Common examples of dark patterns include misleading statements such as ‘Only 1 left!’ (Exploding offers), the use of questions that trick people into giving an answer they do not intend (Trick questions), interfaces which make it difficult to exit a screen, reject an offer or cancel a subscription (Roach motel), and manipulations that make users feel ashamed or guilty for not accepting or opting into a service (Confirm shaming). Table A1 in Appendix A presents other examples of dark patterns.
Dark patterns are used to exploit widely held consumer decision-making biases and heuristics. One recent study estimated that around 97% of the most popular websites and applications in Europe apply practices perceived by users as a dark pattern (Nouwens et al., Reference Nouwens, Liccardi, Veale, Karger and Kagal2020; European Commission, 2022). This is perhaps unsurprising considering that a growing body of studies have found that dark patterns can be highly effective in achieving their aim of manipulating consumer decision-making (Gray et al., Reference Gray, Kou, Battles, Hoggatt and Toombs2018; Mathur et al., Reference Mathur, Acar, Friedman, Lucherini, Mayer, Chetty and Narayanan2019; Bongard-Blanchy et al., Reference Bongard-Blanchy, Rossi, Rivas, Doublet, Koenig and Lenzini2021).
The impact of dark patterns extends beyond the mere manipulation of online purchasing choices. Individual autonomy can also be undermined through reductions in privacy and a decrease in decision-making agency (Zarsky, Reference Zarsky2019; Spencer, Reference Spencer2020). More generally, economic and social inefficiencies can arise when citizens and consumers fail to properly exercise their preferences or are required to take costly and wasteful self-protection measures that decreases welfare.
In broad terms, ‘dark patterns’ can be distinguished from other benign or beneficial online nudges based on two criteria: the purpose for which the pattern is being used and the principal beneficiary. The principal purpose of online nudging (or benign ‘patterns’) is arguably to assist consumers in overcoming or mitigating decision-making biases in ways that are ‘welfare enhancing’ and are in their long-term interests. In contrast, the principal purpose of dark patterns is to complicate or obscure consumer decision-making in ways which directly benefits a seller or online service provider and may not benefit the consumer.Footnote 2
Admittedly, the qualitative judgement applied in defining dark patterns and distinguishing them from more positive nudges, has led to somewhat inconsistent classifications used by scholars and regulators (Bielova et al., Reference Bielova, Santos and Gray2023; Gray et al., Reference Gray, Santos and Bielova2023). For this study, however, we focus on a small number of behavioural manipulations that are clearly labelled as dark patterns and used by online sellers to affect users’ choices.Footnote 3
The increased popularity of dark patterns and their distorting effects have led to growing international consensus about the need to control their use, and protect those who are most susceptible to these tactics. However, the optimal means to achieve such protection are still debated. A key unresolved policy question concerns the identity of those who warrant protection. Should new regulations aim to protect all online consumers, or should they focus only on key groups deemed to be most susceptible to harmful manipulation owing to the specific and observable traits they display (e.g., age, gender, income or other detectable characteristics commonly associated with consumer vulnerability)?
Existing research does not offer a conclusive answer to this question. While some studies have found that less educated consumers are significantly more susceptible to dark patterns (Luguri and Strahilevitz, Reference Luguri and Strahilevitz2021), other studies have found no evidence that the ability to detect dark patterns was correlated with age, employment status or level of education (Di Geronimo et al., Reference Di Geronimo, Braz, Fregnan, Palomba and Bacchelli2020). Emerging policies in different parts of the world also appear to be adopting different positions on those in need of protection. For example, the US Federal Trade Commission has noted that dark patterns may generate greater impact on lower-income consumers or other vulnerable populations (FTC, 2022). By contrast, the recently introduced Digital Services Act (DSA) in the European Union assumes that all users are susceptible to dark patterns and thus prohibits them altogether.
Using a novel experimental design, we empirically test the vulnerability of different user groups to dark patterns in a real-world online setting. First, we investigate the effectiveness of different dark patterns in influencing and manipulating user decision-making. To do so, we examine whether some of the most used dark patterns have a material impact on the autonomy and decision-making of the ‘average’ online user. Second, we test whether dark patterns generate significant heterogeneous effects among different groups of users. We explore whether they have more material effects on specific user groups, such as those on lower incomes, with lower education attainment or the elderly. Third, we consider whether the effect of dark patterns tapers off when friction is introduced – for instance, by requiring users to insert payment details after successful deployment of the dark pattern.
To carry out the experiment, we designed a fictitious online trading platform which offered users the opportunity to purchase a financial product. We used this platform to observe how different types of commonly deployed dark patterns affected users’ decisions. A critical aim of our experiment was to replicate a ‘real-life’ manipulation of user decision-making as far as possible, including by requesting that users who wanted to purchase the financial product make an immediate payment. As such, our experiment adds an important methodological element of realism that has been missing in previous studies of dark patterns which have either been conducted in lab settings or have not required the participant to commit to payment following the manipulation (relying on an implied commitment to pay, rather than a real and immediate financial commitment).
We find strong evidence that commonly deployed dark patterns can materially affect user decision-making. However, in contrast to some previous studies which have found that dark patterns are relatively more effective on specific user groups, we find that user susceptibility to dark patterns is largely uniform among all users regardless of income, education and to some degree age. Our empirical results reveal that all user groups are potentially susceptible to being manipulated by dark patterns.
We further find a distinct reduction in uptake when a requirement for payment is introduced, following the successful deployment of dark patterns. This suggests that dark patterns are of greatest effect when the online interface requires a ‘single click’ to complete the purchase or engage in action. Accordingly, we note that users’ vulnerability is more pronounced when they engage with online platforms that already hold users’ payment details, or when the manipulation relies on immediate action. Our results are of direct relevance to current policy debates about the scope of future prohibitions of dark patterns and the optimal means to protect consumers.
The paper comprises six sections. Section 2 surveys the existing research on online consumer vulnerability and dark patterns. Section 3 elaborates on our experiment design. Section 4 describes our data sample, including the underlying correlation structure within the personal questionnaire. In Section 5, we present the results of the main experiment, separating the findings for ‘average’ effects of dark patterns across all users, and the ‘heterogenous’ effects among specific user groups. Section 6 explores the policy implications of our findings.
2. Literature review
2.1 Dark patterns and decision-making biases
A diverse body of literature examines how consumers can be manipulated and influenced through commercial practices that seek to exploit decision-making biases or take advantage of common decision-making heuristics (Hanson and Kysar, Reference Hanson and Kysar1999; Mathur et al., Reference Mathur, Acar, Friedman, Lucherini, Mayer, Chetty and Narayanan2019). Behavioural economic research in particular has shown that such biases are systematic and predicFootnote table 4 (Ariely, Reference Ariely2009; Dijksterhuis et al., Reference Dijksterhuis, Smith, Van Baaren and Wigboldus2005; Bar-Gill, Reference Bar-Gill2012; Hanson and Kysar, Reference Hanson and Kysar1999). In some cases, the purported aim of such practices may be to improve consumer welfare such as where a commercial entity (or a government agency) seeks to ‘nudge’ a consumer towards making a choice that is in their own long-term interests (Camerer et al., Reference Camerer, Issacharoff, Loewenstein, O’donoghue and Rabin2003; Thaler and Sunstein, Reference Thaler and Sunstein2008). However, in the case of dark patterns, the principal objective of the manipulations is generally to further business and commercial interests by subverting consumer choice in ways that can undermine consumer welfare and wider societal interests. It is this type of harmful manipulation in the online environment that we focus on in this paper.
Some studies have sought to map the connections between dark patterns and notable cognitive biases, namely the anchoring effect, the default effect and the framing effect (Mathur et al., Reference Mathur, Acar, Friedman, Lucherini, Mayer, Chetty and Narayanan2019). Together with other relevant decision-making biases such as salience and hyperbolic discounting, these biases describe the psychology underpinnings of the three dark patterns that are the focus of our study: Confirm shaming, False hierarchy and Roach motel. Let us elaborate on these three patterns:
Confirm shaming affects consumer decision-making through the use of insulting or shaming language to guilt users into a particular choice, or to coerce them to accept an offer (Özdemir, Reference Özdemir2020; Barros et al., Reference Barros, Klein, Shchepetova and Hogg2022). It exploits the framing effect, which is a cognitive bias where individuals tend to make different decisions based on the presentation of the same information (Tversky and Kahneman, Reference Tversky and Kahneman1981; Hanson and Kysar, Reference Hanson and Kysar1999). Specifically, framing influences whether an opportunity is perceived positively or negatively (Waldman, Reference Waldman2020), thereby affecting consumer behaviour.
False hierarchy affects consumer decision-making through the promotion of certain options over others. It can be viewed as a graphical version of confirm shaming, insofar as it frames choice alternatives through visual design (Gray et al., Reference Gray, Santos, Bielova, Toth and Clifford2021), with inferior/less profitable options being assigned colours that are subtler and thus blend into the interface, while preferable/more profitable options assigned bolder colours that make them stand out. False hierarchy can also be viewed as exploiting the anchoring effect (Mathur et al., Reference Mathur, Acar, Friedman, Lucherini, Mayer, Chetty and Narayanan2019). This bias suggests that individuals often place too much emphasis on an initial piece of information (i.e., the option they see at the first sight), which significantly influences their judgements and choices (Tversky and Kahneman, Reference Tversky and Kahneman1974; Özdemir, Reference Özdemir2020; Waldman, Reference Waldman2020). Lastly, false hierarchy exploits salience, which describes a phenomenon in which human attention, is subconsciously captured by highlighted elements/messages that stand out relative to their surrounding (Özdemir, Reference Özdemir2020).
Roach motel affects consumer decision-making by making it easier for users to enter a situation, such as subscribing to a service, but significantly harder for them to exit (Özdemir, Reference Özdemir2020). Users are typically required to navigate through multiple pages or obscure menus to cancel accounts, decline an offer or change settings, contrasting sharply with the simplicity of account creation and service purchase (Bhoot et al., Reference Bhoot, Shinde and Mishra2020; Roffarello et al., Reference Roffarello, Lukoff and de Russis2023). This manipulation takes advantage of consumers’ impatience or inertia and seeks to exploit the bias which arises from hyperbolic discounting where individuals care more about their present rewards or feelings than those that could arise in the future.
2.2 Consumer vulnerability
While studies have shown that decision-making biases or heuristics are systematic and predictable, they are often not directly identifiable at the individual level. For this reason, research on consumer susceptibility to harmful manipulation has traditionally focused on observable characteristics, such as age, income, education and other demographics that have been found to be broadly associated with the tendency to exhibit such biases. The underlying assumption is that certain consumer groups (for instance, those who are elderly or in financial distress) are typically characterised by specific biases and thus are more vulnerable to harmful manipulation. Accordingly, consumer ‘vulnerability’ varies in its scope and intensity between consumer groups with distinct characteristics. This approach has been labelled the ‘victim approach’, because it is based on the idea that certain groups of people warrant specific or added protection because they are inherently weak and/or insufficiently able to fend for their own interests (Cole, Reference Cole2016).Footnote 5
However, the view that only specific groups of consumers are subject to certain biases and decision-making traits is increasingly being challenged. Based on their comprehensive survey of US panel data, Stango and Zinman (Reference Stango and Zinman2020) find that ‘biases are more rule than exception’ and that the median consumer exhibits 10 of 17 potential biases and ‘almost everyone exhibits multiple biases’. Moreover, they find that any cross-consumer heterogeneity in biases is poorly explained by a ‘“kitchen sink” of other consumer characteristics’ including demographic characteristics. Of particular relevance to our study is the finding that there was more bias variance within classical subgroups that are often used as proxies for consumer vulnerability than across them: for example, Stango and Zinman found that there was more bias variation with the highest-education group than between the highest- and lowest-education groups. An important implication of this survey is that all consumers display biases and are thus potentially at risk of having those biases exploited and manipulated.
Developments in the digital economy, the rise of big data analytics and the ability to individually target online users, have stimulated a debate on consumer vulnerability in online environments. Organisations like the OECD, for example, have argued that in the digital age ‘vulnerability may be experienced not only by some consumers, but increasingly by most, if not all, consumers’ (OECD, 2023).
Some studies argue that our senses of time and space are reshaped in the online environment, and that an (over) abundance of information makes it more likely that consumers will use heuristics to make decisions, make simplified choices and pay less attention than offline (ACM, 2020; CMA, 2020). Others argue that while consumers may believe they have more options and choice in an online environment, in fact, they ultimately seem to be choosing from a much smaller choice set online (Costa and Halpern, Reference Costa and Halpern2019; Stucke and Ezrachi, Reference Stucke and Ezrachi2021). This is because the consumer experience is mediated by a controlled environment of tailored buttons to press, boxes to check, options to swipe and information to (skim-) read. Technological advances in data collection, processing and analytics increasingly entail a shift in temporal dynamics such that: ‘[i]n an age of constant “screen time,” […] an offer is always an algorithm away’ (Calo, Reference Calo2014).
The online environment is also characterised by stealth and personalisation, and studies have found that many online consumers are often unaware of the extent to which what they encounter online has been individually tailored to them and can be (re)adjusted to fit a ‘persuasion profile’ (Susser, Roessler and Nisssenbaum, Reference Susser and Nisssenbaum2019; CMA, 2020). Indeed, while some studies have found that consumers feel safer online than they do offline (Moran, Reference Moran2020), many consumers are nevertheless unaware of the cognitive process through which their decision-making is being purposively shaped and influenced (Marchiori et al., Reference Marchiori, Adriaanse and De Ridder2017; Spencer, Reference Spencer2020).
The new dynamics unfolding online create a significant challenge to the traditional understanding of consumer vulnerability. Indeed, some argue that in digital markets, the notion of consumer vulnerability refers to a ‘universal state of defencelessness and susceptibility to (the exploitation of) power imbalances’ that weigh heavily in favour of the digital choice architects (Helberger et al., Reference Helberger, Sax, Strycharz and Micklitz2021). Calo (Reference Calo2014) goes further and argues that armed with data-driven, dynamically adjustable and personalised choice architectures, online commerce is designed to exploit or even create vulnerabilities. In short, while consumers may perceive that they are in control and safer, and thus less vulnerable, in an online environment, this may be an illusion created by online service providers using technological advancements to fulfil their own aims.Footnote 6
2.3 The effectiveness and effects of dark patterns
A small but growing body of empirical research has examined the use and effects of dark patterns on consumers. Some studies have sought to develop a typology of the different types of dark patterns or focussed on the prevalence of dark patterns (Mills et al., Reference Mills, Whittle, Ahmed, Walsh and Wessel2023). While these studies have found that the type and frequency of dark patterns can vary across websites, apps and across jurisdictions, taken as a whole they show that ‘dark patterns are far from a niche practice’ (OECD, 2022). A separate set of studies has focussed on the effectiveness of dark patterns (and particular types of dark patterns) in manipulating consumer decision-making. Important among these studies are Luguri and Strahilevitz (Reference Luguri and Strahilevitz2021), Sin, Harris and Nilsson and Beck (Reference Sin, Harris, Nilsson and Beck2022) and the study by the European Commission (2022), all of which conclude that certain types of dark patterns can have substantial effects on consumer decision-making.
Of relevance to our study is the emerging evidence on whether dark patterns can have differential (heterogenous) impacts on consumers, according to common metrics such as income, age, education etc. The available research, albeit limited, offers several (at times, inconsistent) insights. Some of the studies focus on how age affects a consumer’s susceptibility to dark patterns, particularly children and older consumers (European Commission, 2022). Luguri and Strahilevitz (Reference Luguri and Strahilevitz2021) and Bongard-Blanchy et al. (Reference Bongard-Blanchy, Rossi, Rivas, Doublet, Koenig and Lenzini2021) found that lower educated consumers are most susceptible to dark patterns, while the European Commission (2022) found that vulnerable consumers are more likely to make inconsistent choices than average consumers when exposed to dark patterns. In contrast, Di Geronimo et al. (Reference Di Geronimo, Braz, Fregnan, Palomba and Bacchelli2020) found no evidence that the ability to detect dark patterns was correlated with age, employment status or level of education.
In considering why these emerging findings may not provide consistent results, it is important to understand the methodological approaches applied in these studies and how closely they resembled a real-world choice and decision environment. Studies such as Di Geronimo et al. (Reference Di Geronimo, Braz, Fregnan, Palomba and Bacchelli2020) and Bongard-Blanchy et al. (Reference Bongard-Blanchy, Rossi, Rivas, Doublet, Koenig and Lenzini2021) used online surveys to assess participants’ capability to recognise different dark pattern types and then elicited their views on the effectiveness of different dark patterns. The European Commission (2022) study was also based around a survey but included an online experiment where participants were required to choose between two different digital entertainment service packages. If their choice was consistent with their stated preferences, they received a certain number of points.
In their influential study, Luguri and Strahilevitz (Reference Luguri and Strahilevitz2021) used an online experiment based around a fictitious website and product. In our opinion, this approach is preferable to ‘lab experiments’ in which subjects are not subjected to dark patterns in a manner that reflects a real-life experience. However, while Luguri and Strahilevitz’s experimental design is the closest to our own, our approaches differ in one fundamental aspect which we believe is critical to understanding the results of the two studies. Specifically, in Luguri and Strahilevitz (Reference Luguri and Strahilevitz2021), participants were told that they had been automatically signed up to a costly identity theft protection service and they would need to pay for the service if they did not ‘opt out’. Participants were told that the website had been able to pinpoint their mailing address (using their IP address and zip code) and that following 6 months of free theft protection they would be billed monthly to that address. In contrast, in our experiment participants had to consciously ‘opt-in’ to purchasing the service by entering their credit card or PayPal details. The offer they received did not include any ‘free’ subscription period and led to an immediate charge. As we explain below, we believe this difference in design is highly material to the credibility and robustness of the experiment and the results, since the use of a payment page more closely approximates reality.
2.4 Our contribution
Our research builds on and expands existing research on dark patterns and online consumer vulnerability in several ways.
First, we required participants to fill in a detailed questionnaire about their personal experiences, attitudes and preferences beyond the main demographics, such age, education and income (e.g., Bongard-Blanchy et al., Reference Bongard-Blanchy, Rossi, Rivas, Doublet, Koenig and Lenzini2021). This information allowed us to identify specific characteristics and demographic details about participants and thus assign them to different user groups during analysis. This level of granularity is central to our assessment of whether there are heterogenous user effects of dark patterns. To justify the request for such information and to encourage participants to respond truthfully, we informed participants that this information would be used to understand underlying factors that influence people’s views about a website design.
Second, to ensure a natural online environment (semi-field experiment), we created a genuine website for a (fictitious) algorithm-driven investment product building on the approach of studies such as Di Geronimo et al. (Reference Di Geronimo, Braz, Fregnan, Palomba and Bacchelli2020) and Bongard-Blanchy et al. (Reference Bongard-Blanchy, Rossi, Rivas, Doublet, Koenig and Lenzini2021).Footnote 7 However, in our study, all the information about the product, including the offer pop-ups and the payment page, were presented on the website, separately from the survey. We believe the use of an actual product website with all the associated features made the existence of the product and the offer more realistic compared to a lab setting (as used in some of the other studies), and therefore increased the ecological validity of the experiment. In addition, by asking participants to evaluate the website and its content, we familiarised them with the product.
Third, to convince participants of the genuineness of the offer (i.e., that accepting it would entail an actual monetary commitment) and to reflect a real-life scenario, participants understood this to be a paid service from the moment the offer was made. We subsequently used an online payment process (‘procced to payment’) and typical industry payment page (Figure 1b). Figure 1 includes screenshots of: (a) the landing page of the website; and (b) the payment page (further screenshots of the website are presented in the Appendix C). The incorporation of an immediate payment page into our experiment differs from other experiments, particularly that of Luguri and Strahilevitz (Reference Luguri and Strahilevitz2021), which informed participants of the experimenters’ ability to pinpoint participants’ billing addresses by means of postcode and IP information they provided in the survey or other non-common methods of payment. A key advantage of our approach is that participants were more likely to believe they are facing a true offer and accepting it may incur a real cost when required to insert payment details. On this point, we note that in Luguri and Strahilevitz (Reference Luguri and Strahilevitz2021) participants’ sensitivity to price was very low to non-existent. This, we believe, might reflect the fact that participants did not perceive that they were facing actual costs (i.e., it was costless to accept). By designing our study in a way that enables us to measure the immediate effect of dark patterns on decisions (click to accept), and subsequently the actual commitment to pay (payment choice), we were able to go beyond the present literature by investigating whether dark patterns can significantly affect purchasing decisions when the choice to buy a product and make payment are presented sequentially.
BeanStocks’ landing and payment pages.

The final way in which we believe our experiment improves on previous designs is through the use of specialised session recording software which allowed us to evaluate the effectiveness of our experiment by viewing full session recordings of the online activity on our website. To the best of our knowledge this has not been used in previous experimental work on dark patterns.
3. Experiment design and procedure
As described in Section 1, our experiment sought to test three questions: first, whether dark patterns were effective in increasing the acceptance rate of a fictitious online financial product; second, whether some identifiable groups of users were more susceptible to these manipulations than others; and third, whether the introduction of friction (in the form of a payment page) following a successful deployment of a dark pattern, reduces its effectiveness and influences users’ vulnerability. Our prior, given the existing evidence, and specifically the finding in Luguri and Strahilevitz (Reference Luguri and Strahilevitz2021) was that some demographic factors, (e.g., levels of income or educational attainment) would affect user susceptibility to dark patterns. Our empirical study was pre-registered on the OSF website,Footnote 8 and was approved as compliant with relevant ethical and data protection requirements.
3.1 Design
To explore how user autonomy is affected by dark patterns, we used a research design close to a field experiment. Participants were recruited from an existing recruitment platform (Prolific) and instructed to evaluate the website design of a newly launched investment product called ‘BeanStocks’. The product offered as part of our experiment was for an online financial investment product, and was similar to financial products offered on other trading platforms, such as the Robinhood app.Footnote 9
Participants were first asked to complete a questionnaire before reviewing the website and were told that information about their personality traits (obtained via a questionnaire) was required to better understand their expressed opinions about the website’s design. Participants then replied to several questions about the website design and their views about the investment product.
After participants completed what they considered to be the main task of website evaluation, a pop-up window appeared and informed them that in recognition of their assistance with the website evaluation, they now had an opportunity to buy the product in question. It is at this stage that we subjected the participants to dark patterns. Specifically, the pop-up offer messages presented to participants varied according to the dark pattern condition they were (randomly) assigned to (the next section provides details of each dark pattern condition used in the experiment). Critically, to enhance the realism and accuracy of the experiment, the fact that dark patterns had been pre-embedded in the pop-up offer was not disclosed to participants at the outset. Our aim was to convince participants that they were making a genuine purchase decision online, involving a real payment for a product. At the end of the offer process, we used a credit card payment page to ensure participants’ responses reflected a genuine commitment to purchase the product.
The experiment involved an element of deception on our part, but it was nevertheless kept to the minimum necessary. Participants were promptly debriefed after responding to the offer. In the debriefing, they were told the real purpose of the study and informed that no such product offer exists and that they would not be charged (see Figure A4 in Annex C).
We based our experiment on an online financial product for several reasons. First, the use of online financial trading platforms has accelerated in recent years, widening the number of consumers who can directly access such services (ESMA, 2022). Second, the development of online financial platforms has been largely driven by a new category of, often inexperienced and young, users that diversifies the expected profile of investors. This makes the question of whether such younger and inexperienced users are more susceptible to dark patterns one of critical importance. Third, studies have shown that decision-making under uncertainty, such as in financial markets, often involves heuristic processing. Unlike systematic processing that involves careful and deliberate information processing, heuristic processing reduces cognitive efforts by using simple decision rules to quickly analyse situations (Tversky and Kahnmenn, Reference Tversky and Kahneman1974). While these simplifications, such as buying stocks based on familiarity of companies’ names or a friend’s recommendation, are often sensible and valuable in uncertain environments, they are also susceptible to predictable biases. For instance, heuristic decisions are prone to persuasive techniques such as framing, anchoring and mere exposure. These effects are further intensified in digital settings (Zhang et al., Reference Zhang, Yuan, Zheng, Lian, Xie and Rui2015; Luo et al., Reference Luo, Gu, Wang and Zhou2018).
3.2 Procedure
In determining the geographical location of the study and the fictitious website, we took the decision to base it in the UK. Notwithstanding the fact that the UK is a developed economy, there continues to exist profound disparities in income, education and digital and financial literacy, which are relevant to our study. At the same time, the wide availability of internet access, and the common marketing of online services in the UK, increases the likelihood that users would be broadly familiar with the possibility of using online financial products such as the one we offered in our experiment.
The main online experiment was conducted in five identical sessions on weekday evenings from March to May 2022, with a total of 2500 voluntary UK participants. In each session, participants were recruited from the Prolific platform and electronically provided their informed consent within the survey before participation. In the consent form, participants were informed that the data were collected pseudonymously for research purposes only. As described above, the experiment was implemented in a web browser via Qualtrics (survey). Participants were asked to review the ‘BeanStocks’ website and required to answer questions as to its functionality and content. On average participants spent fifteen to twenty minutes completing the survey. At all times, participants could withdraw from the experiment without giving any reason by simply closing the web window.
The online experiment was undertaken in four phases. First, participants were invited to participate through an email sent by Prolific or an advertisement shown on that platform, with a recruitment message and a link to the survey. The recruitment message included a summary of the purpose of the study (website evaluation), inclusion and exclusion criteria, the duration of the experiment and contact information of the research team. Participants who chose to accept the invitation were asked to click on a link which took them directly to the Qualtrics platform. They were then provided with a formal consent form to indicate their willingness to participate in the experiment and those who consented began the next part.
In the second part, participants answered demographic questions, including their age, gender, education level, pre-tax monthly household income in the past 12 months and self-assessments about actual and perceived financial position. Following the demographic questions, participants answered several questions about their preferences, knowledge and experiences. Most of the questions consisted of 1–5 Likert scale-type questions that measure participants’ digital literacy, online shopping experience, impulse buying tendency, propensity to trust and need for cognition (NFC). In addition, four multiple choice questions were used to test participants’ financial knowledge, each of which had only one correct answer. To assess risk preferences and time preferences, participants were asked to report their willingness to take a risk (or to give up something that is beneficial today for more benefit in the future) from points 1 to 10. All these questions were presented in a random order to prevent an order effect arising. Participants were not told what these questions were measuring. We refer to this part of the experiment as the ‘personal questionnaire’.
After completing the personal questionnaire, participants were given a link to the website of the product. This was the start of the third part of the experiment which we call ‘website evaluation’. Participants were instructed to evaluate the website carefully as this was the declared purpose of their recruitment. They were asked questions about their feelings and views about the design of the website (e.g., on a 1–5 Likert scale or yes/no indicators) and provided their answers on the Qualtrics platform.Footnote 10 At this stage, participants were required to have two tabs open: one for the Qualtrics survey and the other for the website of the product. Responding to these three phases constituted a major proportion of the experiment time.
In the last phase, participants were informed that their survey responses were submitted and recorded, and they were now invited to press a button ‘Tell Me More’ on the website to open and review an offer pop-up from ‘BeanStocks’. Participants were also told that the product offer was made to express our gratitude for their participation, and that the offer was not a part of the survey they had just completed and therefore they did not have to accept the offer to complete the study. Once participants clicked the ‘Tell Me More’ button in the website tab, they were either randomly exposed to a dark pattern manipulation or, if they were in the control group, to no manipulation.Footnote 11
We adopted a between-subjects design, such that participants were randomly assigned to different dark pattern treatment conditions, namely: (1) False hierarchy; (2) Roach motel and (3) Confirm shaming. The control group received a neutral offer (shown in Figure 2(b)) which did not include a dark pattern and was designed to be informative. Each of the four dark pattern treatment conditions contained a specific product offer, that was similar to the neutral offer made to the control group, but with an alteration to the two options of choice as explained in Table 1. The False hierarchy condition is presented in Figure 3 as an example, while all the other dark pattern treatment conditions are shown in Appendix C.
‘Tell Me More’ and the neutral offer pop-up.

False hierarchy (visual interference).

All participants, including those in the control group, were informed that if they accepted the offer, they will be directed to a payment page (the ‘proceed to payment’). We also informed all participants that the minimum investment was £10. The use of a neutral offer to the control group allowed us to establish an objective benchmark by which to measure the proportion of participants interested in the BeanStocks trading product, without the use of dark patterns.
Participants that indicated a willingness to accept the product on the offer page – i.e, clicked on the green ‘proceed to payment’ button – were immediately transferred to a (pseudo) payment page (see Figure 1(b)). Participants that declined the offer (choosing the red ‘reject’ button in the neutral offer) were directed to the debriefing page without seeing the payment page.Footnote 12 We refer to this decision to accept or reject the offer as the ‘first choice’.
Participants who accepted the ‘first-choice’ offer were then confronted with a second choice on the payment page where they could choose the amount they would like to invest, or could cancel the payment. We refer to this second decision point as ‘payment choice’ and consider this stage of the experiment that required a direct commitment to make payment and buy the service, as being critical to the credibility and realism of our results. Immediately after making the choice about the amount of payment (any other clickable elements, besides the amount or cancel options, would provide an error message of ‘choose an amount first’) a debriefing message appeared ending the experiment (before full credit card details were inserted).
The debriefing message explicitly and clearly informed participants of the full purpose of the study and that both the product and the company were fictitious. Participants were told that they were not going to be charged, nor would they receive the service.Footnote 13 In Figure 4, we present the flow of the four parts of the experiment and the main aim of each stage. Table 1 summarises the five conditions and variables used to code the data.
Experiment flow.

Treatment conditions and dependent variables

To ensure our results were reliable we used session recording videos that recorded participants’ behaviours on the website (i.e., their mouse movements, focus, time per page and such). This allowed us to undertake a qualitative review of user behaviour and to identify malfunctions in the website design, such as lack of attention (proxied by extremely fast submission).
This qualitative examination enabled us to identify a technical problem that affected a fourth dark pattern condition (trick question) that was part of the original experiment. Specifically, while viewing the recordings after the experiment ended, we noticed a problem with the execution of the trick question pop-up window.Footnote 14 We therefore decided, as a conservative step, not to rely on this manipulation for the purposes of our study and to only analyse the results obtained for the other three dark pattern conditions for which no technical problems were identified.
4. Sample description and underlying data structure
4.1. Sample description
The main online experiment comprised a total of 2500 voluntary UK participants. The final sample included 2252 complete observations,Footnote 15 with ages ranging from 18 to 86 years, (M =39.20 years, SD =14.17). Of this sample, 1126 were female (50.04%), 1089 participants were male (48.40%), 29 were non-binary (1.29%) and 8 did not disclose gender identity (0.36%). As shown in Figure 5, participants also varied in their income levels, with reported pre-tax monthly household income ranging from £0 to more than £7001. Our sample size was sufficiently large to allow us to measure all income groups in a robust manner, regardless of the median income of our participants, which was slightly more affluent than the UK population (Our median income was between £3,000 and £4,000 while the UK median income is around £2,750).
Distribution of income among participants.

Table A2 in Appendix A includes a list of all variables collected in the personal questionnaire, with relevant literature references and sources. Table 2 provides the basic descriptive statistics for the key variables we used in our analysis.
Descriptive statistics

We performed a two-sample Kolmogorov–Smirnov test using Matlab to understand whether the randomisation was perfectly implemented such that there were no systematic differences in demographic covariates between participants in the different groups. We found most of the demographic data to be distributed equally across all conditions, with only income covariates showing a difference in distributions between samples supposedly randomly assigned to two different conditions (detailed results are summarised in Appendix D).Footnote 16 However, as discussed in Section 5, we only find a weak relationship between (objective) income and dark pattern effectiveness. This makes the potential problem of non-randomness less severe. In other words, even though some income covariates are not distributed identically across all conditions, the results of our experiment remain valid and reliable.
4.2 Correlations structure
Using our rich dataset we are able to study consumers’ attributes, which are the first step in understanding online vulnerability beyond superficial demographics. Our sample includes both binary, categorical and continuous variables (e.g., gender, education, subjective income, respectively). For the continuous variables, we use Pearson’s correlation tests, while for the binary variables (e.g., gender), we conducted a t-test, Wilcoxon rank sum test and correlations. For categorical/ordinal variables (e.g., education and income), we use ANOVA, Kruskal–Wallis test and correlations. Table A3 (in the Appendix) summarises the underlying relationships between the eight personal characteristic measures and the key demographic data collected in the personal questionnaire.
Section 5.3 investigates whether dark patterns have heterogenous effects using three standard proxies for consumer vulnerability (age, education and income). Before considering the results of this analysis, it is useful to consider how each of these demographic variables correlated with the various personal characteristics in our data. We found age to be positively correlated with trust, NFC and financial literacy, and negatively correlated with impulsive shopping, digital literacy and risk-taking behaviour. Similarly, we found that higher levels of educational attainment are positively correlated with digital literacy, higher cognition and higher levels of patience. Conversely, our data suggest that educational attainment was negatively correlated with impulsive shopping. Finally, we found a positive correlation between income and trust, cognition, financial literacy, risk taking, experience of online shopping and patience. Appendix B describes the results of our correlation analysis in detail and compares our data with the findings of existing research for each personal characteristic. We go back to these findings while summarizing the key analysis of vulnerability.
5. Results
This section presents the main results of the experiment. First, we present the results obtained for each of the three different dark pattern conditions (False Hierarchy, Confirm Shaming, Roach Motel) controlling for any underlying differences between participants, such as income, age and other personal characteristics. These are the average effects of dark patterns on all participants. We then move on to explore whether the effectiveness of the three dark pattern conditions varied among participants with different characteristics using an interaction analysis between treatment and demographics.
5.1 Did dark patterns affect the average acceptance rate for all participants?
To examine if a participants’ willingness to accept the offer was affected by the condition that they faced (note that in this analysis, the neutral offer is the baseline condition) a cross-tabulation (contingency table) was computed along with a Pearson’s chi-square analysis.Footnote 17 The statistical analysis implies that the use of dark patterns did affect the acceptance decision of participants in our experiment, i.e., the decision to accept was dependent on the condition a participant faced.
However, this statistical evidence only suggests an overall association between the conditions and a participant’s choice (either first choice or payment choice). To explore the effectiveness of each dark pattern condition relative to the baseline condition, we implemented several statistical tests for each condition separately.Footnote 18 Results are summarised in Table 3.
Average treatment effects

* p < 0.1, **p < 0.05, ***p < 0.001.
Columns (c) and (d) in Table 3 show that some dark patterns materially changed the acceptance rates, compared to the baseline. Notably, based on the results of the cross-tabulation analysis, the first-choice acceptance rates are significantly higher for the False Hierarchy and Roach Motel conditions than for the baseline condition. This implies that these types of dark patterns were effective in increasing the acceptance rates for the offer we made to participants. However, when confronted with a second decision point involving payment for the service, the effectiveness of two of the dark patterns (Roach Motel and Confirm Shaming) weakens. Recall, however, that the payment page was identical across all conditions and did not include a dark pattern. Indeed, it was created with the intention of capturing whether using dark patterns at the offer stage are effective in leading a participant to complete the full transaction involving a real payment at a later stage.
To further investigate the effects of dark patterns on our sample participants, we applied both a linear model and GLM (logistic regression) to predict the average likelihood that participants, by condition, would accept the offer at the two time points of the experiment: first choice and payment choice (Y). The first linear form is presented below:
 \begin{equation*}{\text{Y}} = \mu + \alpha {\text{D}} + \eta {Z_{1..N}} + \varepsilon .\end{equation*}
D is our treatment indicator, which takes binary form (when all dark patterns are analysed together) and a categorical form (when each dark pattern is analysed separately as a treatment condition vs the control group). The coefficient α takes the association between the dark pattern treatment variables, while Z is a vector for the controls, the personal and demographic characteristics from the personal questionnaire. The variables in Z capture any effect which is not related to treatment but directly predicts acceptance. For simplicity we present the results of the linear regression here, and the GLM in Appendix E. Columns (1) and (3) in Table 4 present the results when the three dark pattern conditions are combined to measure the effect of dark patterns vis-à-vis the control group. Columns (2) and (4) separate out each dark pattern treatment group.
LM regression full results

Note: All variables are scaled the mean.
* p < 0.1; **p < 0.05; ***p < 0.01.
Overall, the results indicate stronger acceptance rates for the combined dark patterns group compared to the baseline acceptance rate. This holds for both the first-choice and payment-choice stages, meaning that the dark patterns were not only effective in altering participants’ impulsive decision to accept, but also influenced their decision to commit to payment.
None of the demographic and personal characteristics variables are statistically significant at the first-choice stage which suggests that they are not driving the results, although men were more likely to accept the offer at the payment-choice stage. These findings differ from previous studies, such as Luguri and Strahilevitz (Reference Luguri and Strahilevitz2021, 81) who found that ‘less education increases vulnerability to small- or moderate-dose dark patterns’. We discuss the moderation effects of education in more detail in the next section.
Looking at each dark pattern treatment condition separately reveals that the False Hierarchy was the most effective dark pattern. Although the Confirm Shaming dark pattern was effective at the first-choice stage it was weaker when participants were given a ‘second chance’ and directly confronted with a need to pay for their decision. The Roach Motel dark pattern also appears to have caused some backlash among participants that were exposed to this condition, as shown by the gap between first choice and payment choice which is also apparent by the fact that the payment-choice results are not statistically significant.
5.2 Did the effectiveness of dark patterns differ among participants according to their characteristics?
Having examined the average effects of dark patterns on all participants, we turned to the question of whether there was evidence that dark patterns had heterogenous effects according to certain characteristics of the participants in our sample. Section 5.2.1 explains the modifications we made to the classic interaction model, while Section 5.2.2 presents the results for the effects of dark patterns on three common proxies for consumer vulnerability: income, education and age. We summarize the main findings in Section 5.3.
5.2.1 The interaction models
An interaction model examines whether the relationship between the outcome Y (first choice or payment choice) and a key independent variable D (dark patterns treatment) varies with levels of a moderator X (in our case the demographic variables: income, education and age). Specifically in our case, it might be conjectured based on the standard consumer vulnerability paradigm that dark patterns would be more effective for participants that were older, or with lower levels of income or education attainment. Such conditional hypotheses are common in the social sciences and linear regression models with multiplicative interaction terms are the most widely used framework for testing them in applied work (Brambor et al., Reference Brambor, Clark and Golder2006). μ and ϵ represent the constant and error terms, respectively. The regression equation for the interaction model is
 \begin{equation*}{\text{Y}} = \mu + \alpha {\text{D}} + \eta {\text{X}} + \beta \left( {{\text{D*X}}} \right) + \varepsilon .\end{equation*}
We modified the Brambor et al. (Reference Brambor, Clark and Golder2006) classic model, using a binning estimator as set out in Hainmueller, Mummolo, & Xu (Reference Hainmueller, Mummolo and Xu2019).Footnote 19 The binning estimator breaks a continuous moderator into several bins represented by dummy variables and then examines the interaction between these dummy variables and the treatment indicator, with some adjustment to improve interpretability. The binning estimator is much more flexible as it jointly fits the interaction components of the classic model to each bin separately, thereby relaxing the linear interaction assumption. Since the bins are constructed based on the support of X, the binning ensures that the conditional marginal effects are estimated at typical values of the moderator and do not rely on excessive extrapolation.
5.2.2 Results of interaction models
Having set out our approach, Table 5 summarises the results, for income and education, while Table 6 summaries the interaction model for Age. We continue to study the results of Table 6 graphically to assess the strength of the evidence supporting an age moderation effect.
LM interaction results, income and education

Note: All variables are scaled the mean.
* p < 0.1; **p < 0.05; ***p < 0.01.
LM interaction results, age

Note: All variables are scaled the mean.
* p < 0.1; **p < 0.05; ***p < 0.01.
As shown in Table 5, we do not identify any statistically significant moderation effects of income or education to support the conjecture that the effects of dark patterns monotonically decrease with higher income or educational attainment as the standard vulnerability argument typically assumes (i.e., that susceptibility to dark patterns decreases with higher levels of income or education). While the interaction model supports the main findings from Table 4 (i.e., the dark patterns conditions, and especially the false hierarchy are powerful designs for deception), all of the interaction models in Table 5 are statistically insignificant, as are the income and education indicators.Footnote 20
We also did not observe a clear statistical relationship between financial literacy and dark patterns (see Appendix E). While there was no statistically significant relationship between financial literacy at the first-choice stage, in some specifications we observed a slight positive moderation effect at the payment-choice stage suggesting higher levels of financial literacy could be associated with a stronger treatment effect (see Table A6). This was a surprising result as our expectation was that, given the product we were offering, there would have been a negative relationship between financial literacy and dark pattern susceptibility.Footnote 21 While further research is needed to understand the relationship between financial literacy and dark patterns, one possible explanation for our results is that the novel online financial product used in the experiment was unfamiliar to participants who have a general level (which is what the personal characteristic measures) of financial literacy. In other words, the unique fintech context might have meant that even those participants with a general level of financial knowledge were still susceptible to the dark patterns. Indeed, it may have been the case that those with higher levels of financial literacy were more attracted to the product offering given their general interest in investment and finance.Footnote 22
Having found no evidence to support the prior assumptions concerning heterogenous effects on dark patterns according to income and education, we continue to study the moderation effect of age. In contrast to our findings for income and education, Table 6 shows that age does seem to interact with our treatment, i.e., higher age groups were slightly more susceptible to dark patterns at the first-choice stage. However, the moderating effect of age appears to differ by dark pattern treatment. Figure 6 shows a positive moderation effect of age for Confirm Shaming and False Hierarchy, and a negative moderation effect of age for the Roach Motel treatment. This could potentially be explained by the fact that the Roach Motel treatment relies on impatience and is therefore possibly less effective on older participants (age is correlated with patience in our sample).
Marginal effect size by age group – raw plot.

The non-linearity of the LOESS (red) curve in Figure 6 motivates further investigation,Footnote 23 and we used binning model plots to relax the linear interaction assumption. Using a binning model, Figure 7 shows that the effects of dark patterns are not fully uniform across the age groups. The oldest age group bin coefficient is lower than the previous age group bins for both False Hierarchy and Confirm Shaming. However, the wide confidence intervals leave scope for uncertainty.Footnote 24
Marginal effect size by age group – binning model.

Taken as whole, we believe our analysis provides some evidence of a moderating effect of age, which is monotonically increasing as the standard vulnerability argument typically assumes (i.e., that susceptibility to dark patterns increases with age).Footnote 25
5.3 Summary of results
Table 7 presents an overview of the findings in Section 5.2, with the additional associations between demographics and personal attributes discussed in Section 4.2.
Summary of the main findings

Note: ‘Strong’ results refer to statistical significance at 5% or 1% and large enough magnitudes across the estimates in the paper. ‘Weak’ results refer to unstable or weak statistical significance or a very small magnitude in effect size. The notion ‘+’ and ‘−’ in the last column indicates the direction of the association between age and the personal attribute based on the relevant statistical test.
In summary, we find that dark patterns affected the acceptance decision of participants in our experiment, and that older users were slightly more susceptible to some dark patterns such as false hierarchy and confirm shaming.
While our data are not large enough to allow us to establish the formal psychological and cognitive mechanisms which might have driven these results, it nevertheless suggests that a high tendency to trust and low digital literacy as possible channels for greater susceptibility to dark patterns. In addition, our analysis suggests that for novel online financial products which purport to use AI and other sophisticated techniques like in our case, a general knowledge of finance, low impulsivity and low risk preference did not seem to protect older participants from the effects of dark patterns.
These findings are based on the results of our experiment using a specific product in a particular jurisdiction, and more research is needed before they can be generalised to other products and jurisdictions.
5.5 Limitations of the analysis
Several caveats to our analysis should be acknowledged.
First, our participants were recruited from an online platform (Prolific) which matches researchers with participants. While this site is widely used in academia, and for previous dark patterns studies, concerns have been raised about the representativeness of the pool of participants who use these platforms. There may be a selection bias (volunteer bias) of our sample which may reduce the generalisability of the study results. We tried to mitigate this by gathering relevant data in our questionnaire, and by testing the distributions of our three key variables of interest (age, income, education).
Second, there is also a risk that participants were sceptical of the website experiment and the genuine nature of the offers being made to them. While we designed our website using inspiration from actual online financial products, we did not replicate the full user experience of setting up an account, signing disclaimers, reviewing contract terms etc. Our design was directed by the desire to shorten the participants’ journey to fit the tight time and attention window of an online experiment. We note that two design factors may have enhanced the credibility of the offer. First, the inclusion of an immediate payment page which prompted participants to enter their actual credit card information (which we did not record), and second the fact that the product was also described as being part of an innovation advanced by an academic institution.
Third, the experiment was based on an online financial product in the UK, which, as noted above, means that the results may not immediately be transferable to other jurisdictions or to other consumer products, especially products those that are less complex and more familiar to consumers. Accordingly, more empirical work is needed before strong policy implications are reached in other settings. Furthermore, our design only targeted non-mobile users. As the US Federal Trade Commission has noted the type of device (mobile or PC) can potentially affect user interaction which again suggests that caution should be exercised before generalising our findings to all online users.
Finally, our experiment was based on three commonly used dark patterns out of an ever-expanding list. While we sought to address this limitation by undertaking a pilot experiment using many more dark patterns, it is possible that our results may either under-report or over-report the users’ vulnerability to other types of dark patterns.
6. Concluding remarks
This study used a novel experimental design to test if dark patterns are effective in manipulating and influencing consumer decision-making, and further, whether the effectiveness of dark patterns varied based on three commonly used proxies of consumer vulnerability (age, income and education). Our findings offer relevant insights that could influence policy debate and regulation at two distinct levels:
6.1 Dark patterns and consumer vulnerability
We find strong evidence that dark patterns are effective across all participants (average effects), but no evidence that the effectiveness of dark patterns is conditioned by income or education. Our results offer some evidence that older age participants are more susceptible to manipulation (heterogeneous effects). As such, our results suggest that the classic general proxies for consumer vulnerability (characteristics such as income or education) may be of limited relevance when considering consumer susceptibility to dark patterns. Instead, our analysis favours the alternative view that all online consumers are potentially vulnerable when confronted with dark patterns, with possible heightened vulnerability for older users.
These findings support current policy debate and recent regulatory efforts. As mentioned in the introduction, the EU’s recently adopted DSA enshrines a specific ban on the use of dark patterns by online platforms, which appears to put forward an implicit acknowledgment that all consumers are vulnerable to falling prey to such practices. In the UK, the CMA has published various papers on which have addressed dark patterns or harmful online choice architectures (CMA, 2022; CMA and ICO, Reference CMA and ICO2023). The CMA has also taken enforcement action against websites which used ‘urgency claims’, such as countdown timers and ‘discounts’ to mislead consumers (CMA, 2023). This trend is not limited to Europe. Indeed, while the US FTC Staff Report on dark patterns states that they can have a greater impact on lower-income and other vulnerable populations, elsewhere the agency has acknowledged the need for a wider concept of vulnerability to be adopted when it comes to consumer decisions in digital markets. The FTC has put businesses on notice that every enforcement tool at the agency’s disposal would be mobilized to tackle dark patterns (FTC, 2022). According to its consumer protection head, ‘[i]n today’s digital economy, it is simply illogical to put the onus on individuals to appreciate the implications of this enormously complex ecosystem, an ecosystem powered by massive data collection and often arcane technology’ (Levine, 2022).
Our study contributes to these policy debates by providing empirical evidence to support this trend towards policies that seek to protect all, or a large proportion of consumers, from dark patterns and other forms of online manipulation. As such it is also consistent with the wider but differentiated conception of vulnerability (European Parliament, 2021; OECD, 2023) that involves protecting the average consumer online with prohibitions against dark patterns, while at the same time allowing for enhanced protections for mental or physical infirmity and age.
6.2 Acceptance and payment choices
Our experimental design and the use of a payment page offer important insights as to when dark patterns may be most effective. As we elaborated above, many participants who were influenced by the dark pattern to accept the offer, did not proceed to buy the product once they reached the payment page. This implies that when further action was required by the user, following the successful deployment of a dark pattern, its effectiveness diminishes. Accordingly, the breaking of the acceptance and payment choices into two decision points in our experiment reduced consumer vulnerability. This insight highlights the enhanced vulnerability in instances which involve a ‘single click’ acceptance.
As a matter of policy, one could distinguish situations where dark patterns are deployed with an ‘immediate effect’ to syphon off data, encourage choice, or execute a charge when payment details are already stored online (e.g., where there is an existing subscription, a free trial period or the service provider has recorded the payment information, or when the dark pattern is deployed in setting of zero-pricing and no further action is required by the user e.g., cookie consent notices), from those where further action is needed beyond the immediate manipulation. Given our findings, the latter situations offer online consumers an opportunity for further reflection and may prompt them to reconsider their choices and opt out.
If one accepts this distinction, the latter situations appear to be a less urgent problem or at least one for which a tailored response may be more appropriate than a blanket prohibition. On the other hand, when dark patterns achieve their goal through a ‘single click’ or are deployed by an established platform or ecosystem that already possess the user’s relevant payment details, users remain vulnerable and under the ‘spell’ of the dark pattern. These effects, coupled with the increased centrality of established online platforms, increased asymmetry of power between users and service providers, and the stealth deployment of dark patterns, may well justify blanket protections, as advanced by the European Union in its DSA.
Our study sheds light on the possible benefits which may flow from the slowing down of the decision-making process. Rather than celebrating users’ acceptance being ‘a click away’, it points to the benefits of breaking the payment or acceptance process into two decision points. This insight may support the artificial slowing down of decision-making in instances in which consumer vulnerability could expose it to exploitation. Such may be the case in instances involving agreement to share personal data, accept onerous conditions or pay for services.
Appendix A.
Common examples of dark patterns

Source: Based on OECD (2022) and the examples at https://www.deceptive.design/types
Personal questionnaire variables

Appendix B. Correlation analysis
Table A3 compares the responses to the personal questionnaire with four demographic variables (age, gender, education and income) and previous studies.
Personal characteristics and they key demographics

Note: The numbers reported in Table 3 indicate coefficient values of Pearson’s linear correlation between variables, with red cells marking a negative association between the variables. Note that since we have a large sample (>2000), many of the coefficients are statistically significant, but most of them are insignificant in size. We use, but do not report here, additional, more rigorous tests (i.e., a t-test, Wilcoxon rank sum test, ANOVA and Kruskal–Wallis test) depending on data types. The null hypothesis for t-test: x and y come from normal distributions with equal means and equal but unknown variances; The null hypothesis for ANOVA: data from several groups (levels) of a factor have a common mean. The results are in line with the correlation matrix.
* p < 0.1, **p < 0.05, ***p < 0.001.
Trust
Our data support a clear positive correlation between propensity to trust and demographic variables such as age (Fisch and Seligman, Reference Fisch and Seligman2022) and gender (specifically being male) (Glaeser et al., Reference Glaeser, Laibson, Scheinkman and Soutter2000; Uslaner, Reference Uslaner2002; Cyr and Bonanni, Reference Cyr and Bonanni2005; Buchan et al., Reference Buchan, Croson and Solnick2008). In addition, we find income to be significantly correlated with trust which is not well-documented in existing literature.
Experience of shopping online shopping
Our data support previous work which has found that gender to be significantly correlated with experience of online shopping. We found that females are more experienced in online shopping than male (Lian and Yen, Reference Lian and Yen2014). However, in contrast with previous research which found that young people are the most active online shoppers (Selwyn, Reference Selwyn2004; Lian and Yen, Reference Lian and Yen2014), our data suggest no statistically significant correlation between age and experience with online shopping.
Digital literacy
Our data on digital literacy are consistent with the findings of existing studies that find that higher levels of digital literacy are correlated with being youngerFootnote 26 (Tripp, Reference Tripp2011; van Deursen et al., Reference van Deursen, Helsper and Eynon2016), gender (specifically being male)Footnote 27 (van Deursen et al., Reference van Deursen, Helsper and Eynon2016) and higher levels of educational attainment (Gui and Argentin, Reference Gui and Argentin2011; van Deursen et al., Reference van Deursen, Helsper and Eynon2016). Our results also suggest a positive correlation between income and digital literacy, an area which has received relatively little attention to date.Footnote 28
Need for cognition (NFC)
Our data show a positive correlation between cognitive abilities and age, gender (specifically being male), level of educational attainment, and income. However, the existing literature only supports the association between cognitive abilities and education (e.g., Wu et al., Reference Wu, Parker and de Jong2014; de Holanda Coelho et al., Reference de Holanda Coelho, Hanel and Wolf2020). Factors such as age and gender are often found to be insignificant (Smith and Levin, Reference Smith and Levin1996; Wu et al., Reference Wu, Parker and de Jong2014). Some caution should be exercised as there are only a relatively small number of papers reporting demographic influences on cognition.
Tendency to impulse buying
Impulsive buying tendency in our data is unsurprisingly negatively correlated with age, being male, and levels of educational attainment. Overall, these results align with existing research (e.g., Rook and Hoch, Reference Rook and Hoch1985; Wood, Reference Wood1998; Kacen and Lee, Reference Kacen and Lee2002; Lai, Reference Lai2010; Badgaiyan and Verma, Reference Badgaiyan and Verma2015; Styvén et al., Reference Styvén, Foster and Wallström2017; Wibowo and Indartono, Reference Wibowo and Indartono2017) and largely echoes recent meta-analysis conclusions (e.g., Gangai and Agrawal, Reference Gangai and Agrawal2016; Santini et al., Reference Santini, Ladeira, Vieira, Araujo and Sampaio2019). It is worth noting that although we only find a weakly significant positive relationship between impulsive buying tendency and monthly household income level, past research results are also mixed on this point, with some showing a negative relationship (Wood, Reference Wood1998), some positive (Mihic´ and Kursan, Reference Mihic´ and Kursan2010; Deon, Reference Deon2011; Barakat, Reference Barakat2019), and some finding no relationship (Gutierrez, Reference Gutierrez2004; Ghani et al., Reference Ghani, Imran and Jan2011). This implies that income may be related to this variable in a more specific or complex manner; for example, financial situation at the time of purchase (Gangai and Agrawal, Reference Gangai and Agrawal2016).
Financial literacy
Our data suggest that older adults, males, highly educated people, and the rich are more financially literate. This is consistent with past literature on education (Lusardi and Mitchell, Reference Lusardi and Mitchell2014), income levels (Lusardi and Mitchell, Reference Lusardi and Mitchell2011), and the gender gap, which is persistent and widespread across countries (e.g., Lusardi and Mitchell, Reference Lusardi and Mitchell2008; Bucher-Koenen et al., Reference Bucher-Koenen, Lusardi, Alessie and van Rooij2017; Cupák et al., Reference Cupák, Fessler, Schneebaum and Silgoner2018; Potrich et al., Reference Potrich, Vieira and Kirch2018; Preston and Wright, Reference Preston and Wright2019). However, we note that inconsistent results have been reported in past studies on the relationship between age and financial literacy, with some studies reporting a positive relationship (Fisch and Seligman, Reference Fisch and Seligman2022), others a quadratic relationship (in a belled shape; Lusardi and Mitchell, Reference Lusardi and Mitchell2014), while other studies report no relationship (Baker et al., Reference Baker, Kumar, Goyal and Gaur2019).
Time preference
Our data suggests that male, highly educated adults, and richer people are, on average, more patient, which largely aligns with the findings of Falk et al. (Reference Falk, Becker, Dohmen, Enke, Huffman and Sunde2018). We note, however, that existing research provide no consistent conclusion on the relationship between income and time preferences, possibly due to varying measurement approaches. For example, Hunter et al. (Reference Hunter, Tang, Hutchinson, Chilton, Holmes and Kee2018) do not find any significant relationship between income and three different time preferences scales, respectively, while others (e.g., Johnson et al., Reference Johnson, Richeson and Finkel2011; Peretti-Watel et al., Reference Peretti-Watel, L’haridon and Seror2013) observe a greater tendency of low socio-economic status adults (vs high) towards procrastination and the present bias.
Risk preference
Our data are consistent with Falk et al. (Reference Falk, Becker, Dohmen, Enke, Huffman and Sunde2018) in finding that women and the elderly tend to be more risk averse than their counterparts.Footnote 29 Other demographic covariates such as education and income, unfortunately, tend to be under-reported. To address this we have reviewed the results of other studies which adopt various approaches to measuring risk preferences. Similar to our data, Rosen et al. (Reference Rosen, Tsai and Downs2003) find that lower education predicts increased risk aversion, several other studies (e.g., Riley and Chow, Reference Riley and Chow1992; Schooley and Worden, Reference Schooley and Worden1996; Bellante and Green, Reference Bellante and Green2004; Lin, Reference Lin2009) present opposing results.Footnote 30 On the relationship between risk preferences and income, our data align with earlier research that identifies risk loving attitudes as an increasing function of absolute income or wealth (Riley and Chow, Reference Riley and Chow1992; Guiso and Paiella, Reference Guiso and Paiella2008; Caner and Okten, Reference Caner and Okten2010), possibly because potential income risks would motivate less affluent people to play safe (Lin, Reference Lin2009). We note, however, other studies that do not find a correlation between income and experimentally elicited risk preference (Ahern et al., Reference Ahern, Duchin and Shumway2014) or an increased engagement in risky economic behaviour when being allocated insufficient resources in an experiment (Mishra and Lalumière, Reference Mishra and Lalumière2010).
Appendix C. Stimuli description
Trick questions
For this treatment condition the text of the pop-up message was identical to the neutral offer condition (see Figure 2). However, the question which asked participants to accept the offer was framed in a different way with the aim of confusing participants: it used a double-negative statement in the product offer and the response buttons. Specifically, as shown in Figure A1, choosing the option ‘No’ actually involved accepting the offer given how the question is framed. To follow the common framing approach, and to explore more about participants’ real demand, participants who declined the offer (by choosing ‘Yes’) would then see a neutral follow-up question (with no manipulation) which asked them if they would like to buy the product. This experimental design follows the common practice of the trick question, characterised by offering choices that require careful assessment (Mathur et al., Reference Mathur, Kshirsagar and Mayer2021; Waldman, Reference Waldman2020). Double negative is one of the most popular forms of a trick question, while another example provided by Mathur et al. (Reference Mathur, Acar, Friedman, Lucherini, Mayer, Chetty and Narayanan2019) is the option to ‘Uncheck the box if you prefer not to receive email updates’.
Trick questions treatment condition.

Roach motel
This treatment condition involved a user interface design that created a situation of ‘asymmetric difficulty’ for participants in choosing between two options (or among several options). In the first stage, participants see the same message as in the neutral offer condition. However, they were then presented with two options ‘Proceed to payment’ and ‘More information’ (instead of ‘Proceed to payment’ and ‘Reject’). If they choose ‘More information’, they will be given another offer message about the investment product. The message presented in the second stage was different from the one in the first stage. Here, participants were given information about the benefits of the product. Participants needed to choose between ‘Proceed to payment’ and ‘More information’. If ‘More information’ is chosen, participants will be asked to indicate their reasons for not accepting. At this stage, they will be given an option to accept or reject the offer.
Roach motel treatment condition.

This experimental design followed that of Mathur, Kshirsagar, and Mayer (Reference Mathur, Kshirsagar and Mayer2021) who used a user interface offers a readily visible choice (‘OK’) to agree to data tracking and gathering, while the option to decline can only be accessed after navigating through a sequence of seven different displays, initiating from the ‘Manage Options’ section. The use of a third stage was inspired by Luguri and Strahilevitz (Reference Luguri and Strahilevitz2021), who also asked participants to choose from a range of reasons for not accepting the offer, with a final chance to accept, at the last stage.
Confirm shaming
For this treatment condition the text of the pop-up message was identical to the neutral offer condition, but the wording of the options was different. As shown in Figure A3, participants are presented with two options: ‘Yes, I want to start earning high returns!’ and ‘No, I don’t care about securing my future and earning high returns.’ Texts of both options were worded in the way to manipulate participants’ emotions, making them excited about accepting the offer, and at the same time, engendering a feeling of guilt about declining. Our design is similar to the common practice of confirm shaming which frames the decline option (or any options undesired by firms) intentionally to shame or guilt users into opting in (Mathur et al., Reference Mathur, Kshirsagar and Mayer2021; Özdemir, Reference Özdemir2020); for example, ‘No thanks, I don’t want Unlimited One-Day Delivery’ (Mathur et al., Reference Mathur, Kshirsagar and Mayer2021), ‘No thanks, I like paying full price’ (Mathur et al., Reference Mathur, Acar, Friedman, Lucherini, Mayer, Chetty and Narayanan2019), and ‘No thanks, I hate fun & games’ (Mathur et al., Reference Mathur, Acar, Friedman, Lucherini, Mayer, Chetty and Narayanan2019).
Confirm shaming treatment condition.

De-briefing messages (all conditions).

Appendix D. Randomisation checks
We performed randomisation checks to examine how demographic data were distributed across different conditions. While participants were assigned to each condition randomly, there is nevertheless a potential risk that the demographic profile of participants in the different treatment groups may show significant differences. Figure A5 shows how demographic data are distributed across the different neutral and treatment conditions according to age, education, gender and our income variables. The figures reveal that the patterns of data are highly similar across conditions, implying a strong possibility of random allocations.
Number of participants in each demographic group by dark pattern conditions.

The statistical test results for the permutation test

Note:
* p < 0.1, **p < 0.05, ***p< 0.01.
A more nuanced statistical analysis was conducted following the graphical investigation. A two-sample Kolmogorov–Smirnov test was employed to examine whether there exists heterogeneity in a demographic covariate between two subgroup (i.e., condition) samples. More specifically, it was used to test if the two dark pattern conditions being compared are from the same (population) distributions over a certain demographic variable (Berger and Zhou, Reference Berger and Zhou2014). Importantly, this test is a powerful tool in situations where traditional parametric assumptions are not satisfied or when the data are skewed (Baumgartner and Kolassa, Reference Baumgartner and Kolassa2023). The present analysis used the function provided by Matlab.
The results imply distributional invariance, with only a few (i.e., the three income variables) revealing statistical differences between two condition samples. Full results are available upon request from the authors. In addition to checking the randomness of the participant assignment, a permutation test (a.k.a. a re-randomisation test) was employed to investigate whether the observed mean differences in acceptance rates between the control and a treatment condition are due to a chance (or luck) or a treatment effect. Like the two-sample Kolmogorov–Smirnov test used above, the permutation test is non-parametric (Holt and Sullivan, Reference Holt and Sullivan2023) and its null hypothesis is that the two tested (independent) sample groups come from the same distribution (Hemerik & Goeman, Reference Hemerik and Goeman2018). There are many extensions and variations of this method, the present analysis used the Matlab code developed by Krol (Reference Krol2021) and set to repeat the permutation procedure 10,000 times for better accuracy.
Table A4 shows the test results such as effect sizes (Hedges G) and outcomes of hypothesis testing. The rejection of the null hypothesis implies that the observed mean differences in first choice (or payment choice) stem from the treatment effect (i.e., the dark pattern manipulation), instead of randomness. Accordingly, as revealed in Table A4, the statistical differences in acceptance rates reported in Table 3 in the main paper are not the result of a random chance. This further strengthens the conclusion that dark patterns form an effective strategy for increasing acceptance rates.
Appendix E. Additional results
In this section we include results for the GLM models and additional interaction models for financial literacy (Table A6). First, in the GLM (logistic model) models, the output is on link-scale (logit); thus, the numerical output of the model corresponds to the log-odds. For example, the coefficient of the treatment variable (Dark Patterns) has a numerical value of 0.139 for the first choice. Its positive sign indicates that the chance of observing a first choice increases with treatment (the three dark patterns are considered the treatment group here). The magnitude of the coefficient implies that compared to the control group, treatment results in 0.139 increase in the log-odds ratio of acceptance: rejection of the offer. Therefore, the odds for accepting the offer are 174% higher for the treatment group compared to the control.
GLM regression full results

Note: All variables are scaled the mean.
* p < 0.1; **p< 0.05; ***p < 0.01.
In rows two and four in Table A5, each of the three dark pattern treatment conditions are explored separately. According to the results, the most powerful manipulation is False Hierarchy (visual interface), followed by the Roach Motel and Confirm Shaming. All three manipulations are highly effective in the first choice. The Roach Motel condition, which includes two repeated screens with no decline option for the offer (only an option for ‘more information’) is effective in inducing an acceptance in the first-choice phase (which is considered an ‘accept’ in any of the screens). But it might cause a ‘backlash effect’ in the payment phase, where we see acceptance levels drop, with users not being more likely to accept the offer compared to the control group.
LM interaction results, financial literacy
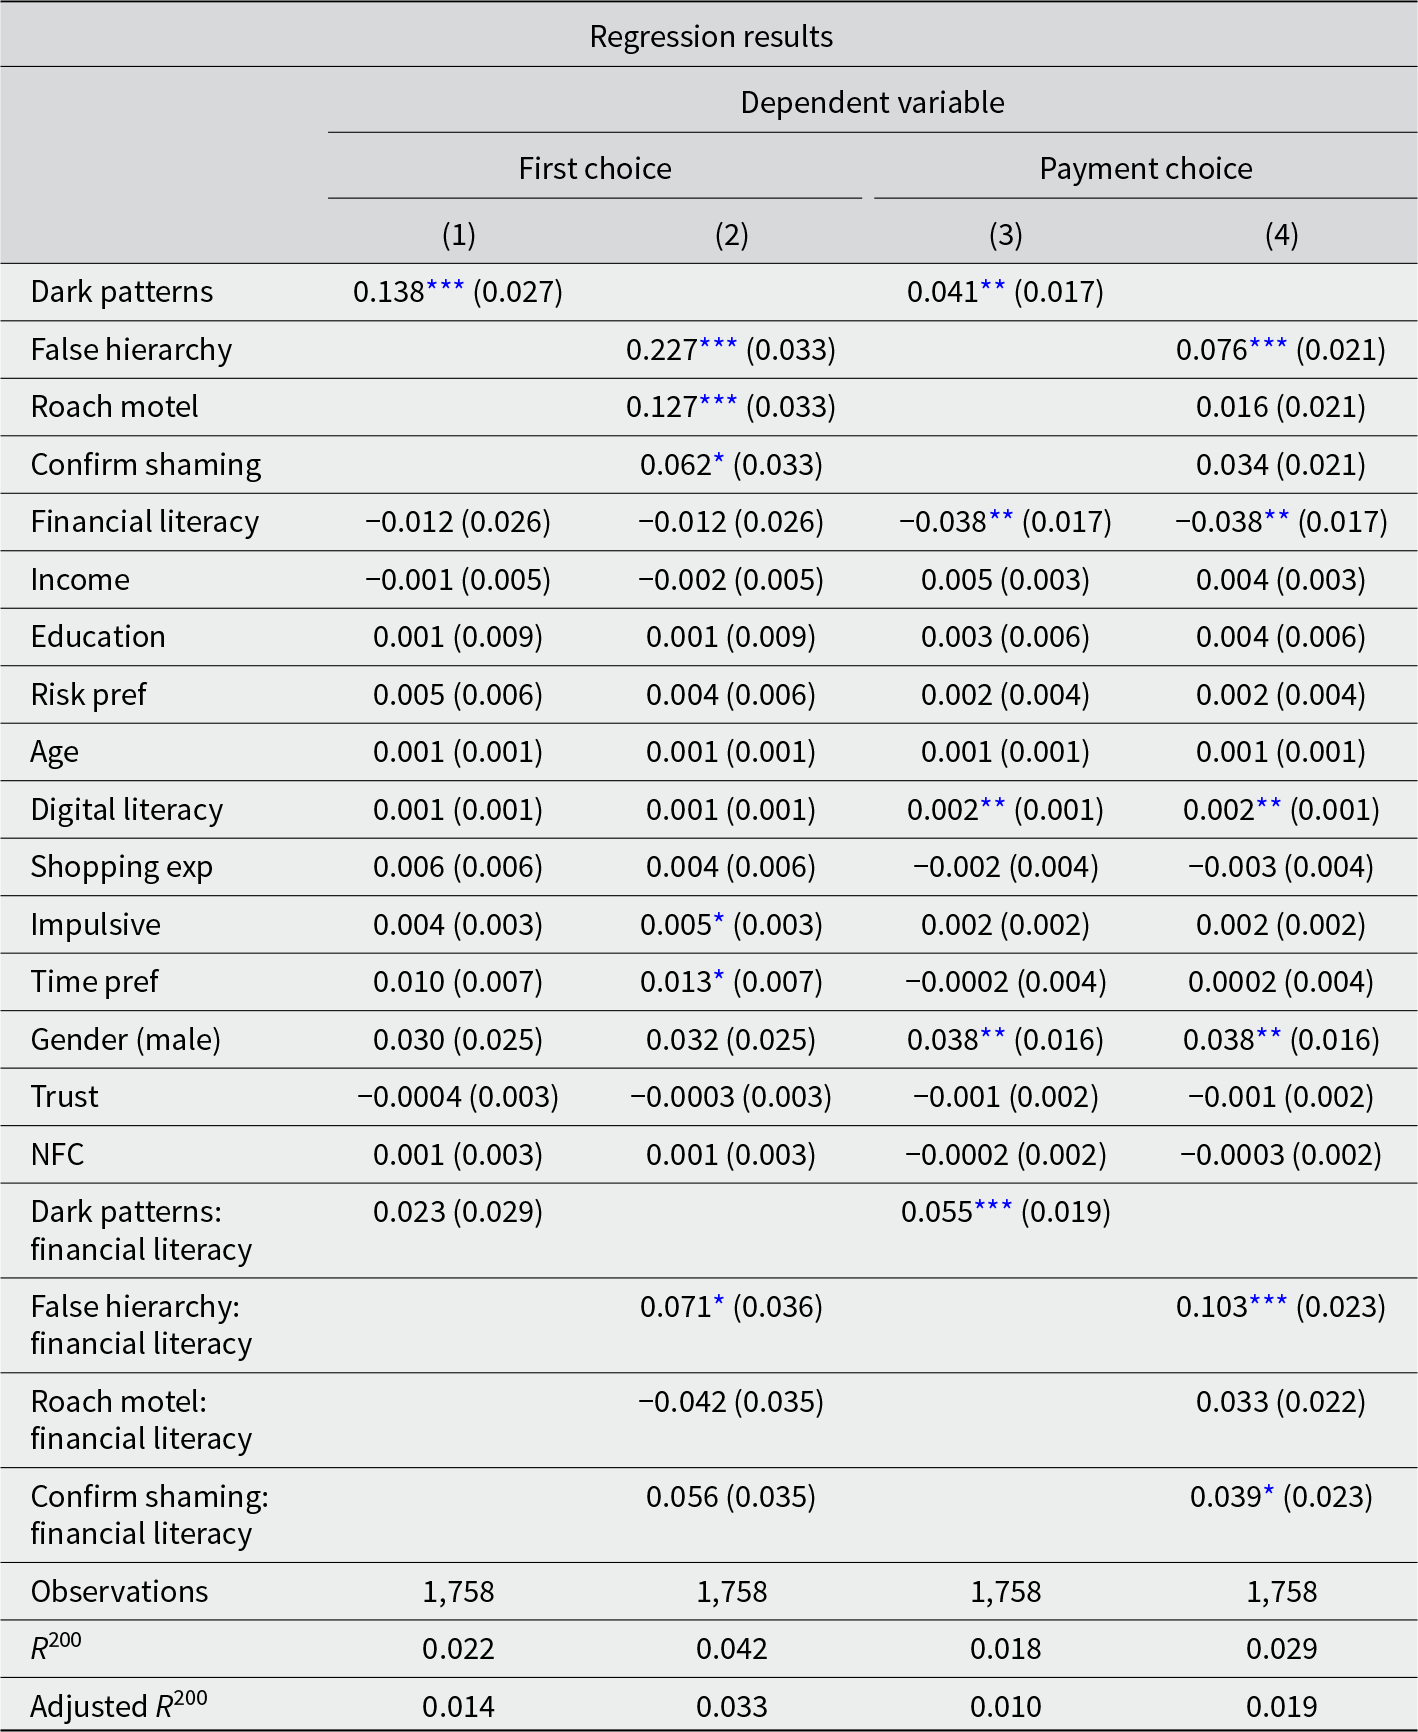
Note: All variables are scaled the mean.
* p < 0.1; **p < 0.05; ***p < 0.01.
Marginal effect size by financial literacy – raw plot.


 Open access