


1. Introduction
Middle Eastern or North African (MENA) Americans are an understudied speech community in sociolinguistics. In terms of racial classification and identification, MENA Americans have been legally and historically classified as white but are not socially perceived as white (Beydoun, Reference Beydoun2013, Reference Beydoun2015). While early immigrants from MENA regions to the US were mostly Christians, ever since 1947, the majority of immigrants from MENA regions to the US have been from Muslim backgrounds (Orfalea, Reference Orfalea2006); this demographic change can result in more ethnic visibility for MENA Americans in the US (cf., e.g., Shryock & Lin, Reference Shryock, Lin, Baker, Howell, Jamal, Lin, Shryock, Stockton and Tessler2009, for a discussion of ethnic visibility of MENA Americans in southeastern Michigan). Higher ethnic visibility can in turn lead to certain linguistic performances on the part of MENA Americans. Several studies have looked at the interaction of ethnic identity/visibility and local vowel patterns such as the merging of the low back vowels (the vowels in THOUGHT and LOTFootnote 1). For example, Hall–Lew (Reference Hall–Lew2009) showed that Asian Americans in San Francisco took part in the low back vowel merger and high back vowel fronting, which both index local meanings being part of the California Vowel Shift (Eckert, Reference Eckert2008). Going beyond one particular locality, Wong and Hall–Lew (Reference Wong and Hall–Lew2014) demonstrated clear influence of local dialect on the speech of Asian Americans in two different localities, with Asian Americans from NYC having distinct low back vowels and those from San Francisco merged low back vowels. Comparing the speech of three different ethnic groups in the multicultural context of Toronto, Hoffman and Walker (Reference Hoffman and Walker2010) explored two features of the Canadian Vowel Shift: the retraction of TRAP and the lowering and retraction of DRESS. Their findings showed that while Chinese Canadians disfavored these two patterns, British/Irish and Italian Canadians favored them. In another study in the context of California English, Cardoso et al. (Reference Cardoso, Hall–Lew, Kementchedjhieva and Purse2016) looked at subclasses of the TRAP vowel in the speech of Chinese Americans and white Americans of San Francisco. They found that the nasal split of TRAP (it being raised when followed by a nasal consonant, and being retracted and lowered when followed by an oral consonant) was more advanced for white speakers than the Chinese group. Cardoso et al. (Reference Cardoso, Hall–Lew, Kementchedjhieva and Purse2016) associated the observed difference to the social meaning of the TRAP nasal split in California indexing white or non-Chicanx social personae.
In the present paper, I make a contribution to the literature on the intersection of ethnic identities and local vowel patterning by comparing the speech of two groups of MENA Americans: one from the Upper Midwest and the other from southern California. For the latter group, the Low-Back-Merger Shift (LBMS) is an established local vowel pattern while it is an emerging supralocal pattern for the former group replacing the more stereotypically local pattern of the Northern Cities Shift (NCS). The NCS is a vowel pattern whose most advanced features include the raising and fronting of the TRAP vowel, the fronting of the LOT vowel, and the lowering of the THOUGHT vowel. By contrast, the LBMS is characterized by the retraction and lowering of pre-oral TRAP, the retraction of LOT, and the merger of THOUGHT and LOT (hence the name LBM) a feature that the NCS resists or inhibits (Labov, Boberg & Ash, Reference Labov, Boberg and Ash2005; Benson, Fox & Balkman, Reference Benson, Fox and Balkman2011). While previous studies have documented NCS features among speakers of various ethnic backgrounds in the Upper Midwest (see, e.g., Evans et al., Reference Evans, Ito, Jones, Preston, Simon and Murray2006; Samant, Reference Samant2010; Bakos, Reference Bakos2012; Rankinen, Reference Rankinen2014), more recent studies show that some NCS features are being reorganized in this region in ways more consistent with the LBMS (see, e.g., Driscoll & Lape, Reference Driscoll and Lape2015; Wagner et al., Reference Wagner, Mason, Nesbitt, Pevan and Savage2016; Zheng, Reference Zheng2018; Nesbitt, Reference Nesbitt2021). Some studies have gone beyond the description of these local vowel patterns and have explored the social meanings of the retainment or reversal of NCS features in terms of deindustrialization in the region (Driscoll & Lape, Reference Driscoll and Lape2015; Nesbitt, Reference Nesbitt2021) or group affiliations and personae (D'Onofrio & Benheim, Reference D'Onofrio and Benheim2020; King, Reference King2021). The present paper contributes to this emerging literature on the intersection of group affiliation and local vowel patterns, showing the absence of stereotypically local features that can index white social personae in the speech of MENA Americans. I attribute this observation to the speakers’ agency and positionality in terms of ethnic affiliation by providing evidence from metalinguistic commentary and stylistic variation (in the sense of contextual styles).
In the following section, I provide a brief description of the NCS and the LBMS. In Section 3, I describe the methodology and the findings of the present study; and finally in Section 4, I conclude the paper.
2. Background
The Upper Midwestern participants in this study are from south-central and southeastern Wisconsin and southeastern Michigan. According to Labov et al. (Reference Labov, Boberg and Ash2005), these three regions are part of the Inland North sub-dialect region. The Inland North dialect area is a smaller dialect area within the broader North dialect area, and features more advanced sound patterns of the NCS including distinct low back vowels. As such, a large body of variationist work in different areas of the Upper Midwest have focused on the NCS (e.g., Evans & Preston, Reference Evans and Preston2001; Gordon, Reference Gordon2001; Evans et al., Reference Evans, Ito, Jones, Preston, Simon and Murray2006; Benson et al., Reference Benson, Fox and Balkman2011). Labov et al. (Reference Labov, Boberg and Ash2005) illustrate six changes in the NCS influencing seven vowel classes in the order shown in Figure 1.
Illustration of NCS (adapted from Labov et al., Reference Labov, Boberg and Ash2005: 121)
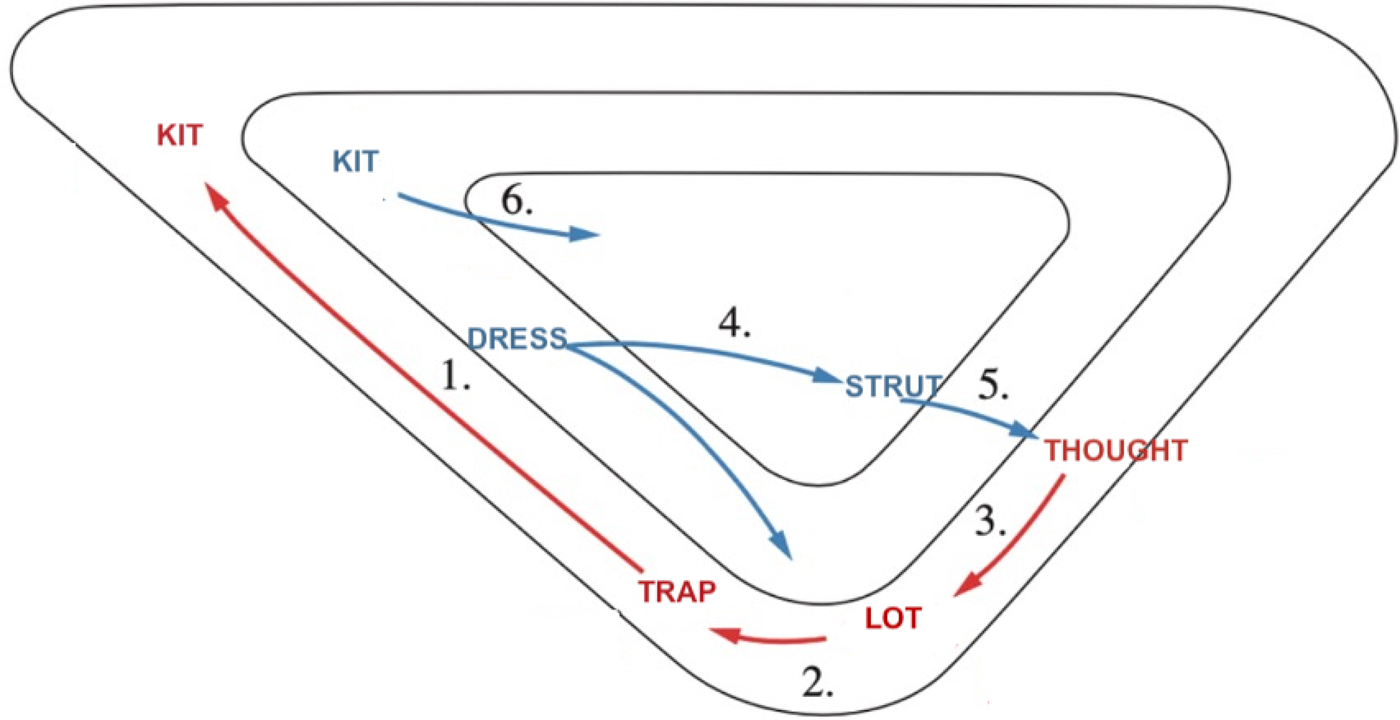
As shown in Figure 1, the initial step in the NCS is the raising and fronting of the TRAP vowel, which prompts the fronting of the LOT vowel, which, in turn, prompts the lowering of the THOUGHT vowel (the three most advanced features of the NCS, marked by the color red). Steps 4, 5, and 6 of this sound change involve the retraction (and lowering) of the DRESS, the STRUT, and the KIT vowels respectively. In analyzing specific communities’ participation in this vowel patterning, some scholars have focused on the more innovative features (e.g., DRESS retraction and lowering and STRUT retraction) and some have focused on the most advanced features (e.g., TRAP raising and fronting and LOT fronting) of this sound change. These different sets of features have been shown to align with different social meanings. For example, Eckert (Reference Eckert1998, Reference Eckert2000) shows that the ‘burnout’ high school speakers in the Detroit area show higher rates of STRUT retraction as a more innovative feature of the NCS in comparison with their ‘jock’ counterparts. Samant (Reference Samant2010) focused her analysis on the more advanced NCS feature of TRAP raising and fronting in examining Dearborn youth's participation in the NCS in southeastern Michigan. Working in the context of a high school in Dearborn, Samant (Reference Samant2010) looked at whether specific nationality (within the broad Arab ethnic community in Dearborn) and religiosity would covary with different degrees of participation in the NCS. Samant specifically made a distinction between the Lebanese and non-Lebanese nationalities informed by patterns of internal hierarchies that she observed in the community. Samant measured religiosity in terms of regular versus sporadic religious practice and in her sporadic religious practice group, she found that the Lebanese youths had the more raised and fronted TRAPs than the non-Lebanese speakers, indicating an association between higher social prestige and participation in the NCS.
In a similar study, Bakos (Reference Bakos2012) looked at the level of participation in the NCS by only the Lebanese community in Dearborn. Bakos’ results showed that the Lebanese Dearborners were not participating in the NCS and did not merge their low back vowels. Evidence from other ethnic groups also shows that the NCS is waning in the Upper Midwest of the US. For example, Wagner et al. (Reference Wagner, Mason, Nesbitt, Pevan and Savage2016) found that the speech of European Americans in Lansing, MI, showed the continuation of DRESS lowering and backing (consistent with the NCS and the LBMS), but the reversal of LOT fronting, and the nasal split of TRAP (both contrary to the NCS but consistent with the LBMS).
Following a discussion and a poll with several scholars to synthesize and unify accounts of the trans-local and widespread vowel patterning involving the retraction of low and mid-high front vowels (illustrated in Figure 2) and the merger of low back vowels, Becker (Reference Becker and Becker2019) introduced the term ‘the Low-Back-Merger Shift’. The LBMS is a more general term that synthesizes and unites accounts of the California and Canadian Vowel Shifts (both conveniently abbreviated as CVS) and similar vowel patterns occurring outside these two areas in North America (such as Washington [Swan, Reference Swan2019]; Nevada and Oregon [Fridland & Kendall, Reference Fridland and Kendall2019]; and the Upper Midwest [Nesbitt, Wagner & Mason, Reference Nesbitt, Wagner and Mason2019]). While the merger of THOUGHT and LOT as the initial trigger for the lowering and retraction of front vowels ‘allows for considerable variation in instantiation’ (Becker, Reference Becker and Becker2019: 2), Figure 2 illustrates the general sequence and patterning of the LBMS.
The general sequence and patterning of the LBMS (adapted from Becker, Reference Becker and Becker2019: 1)
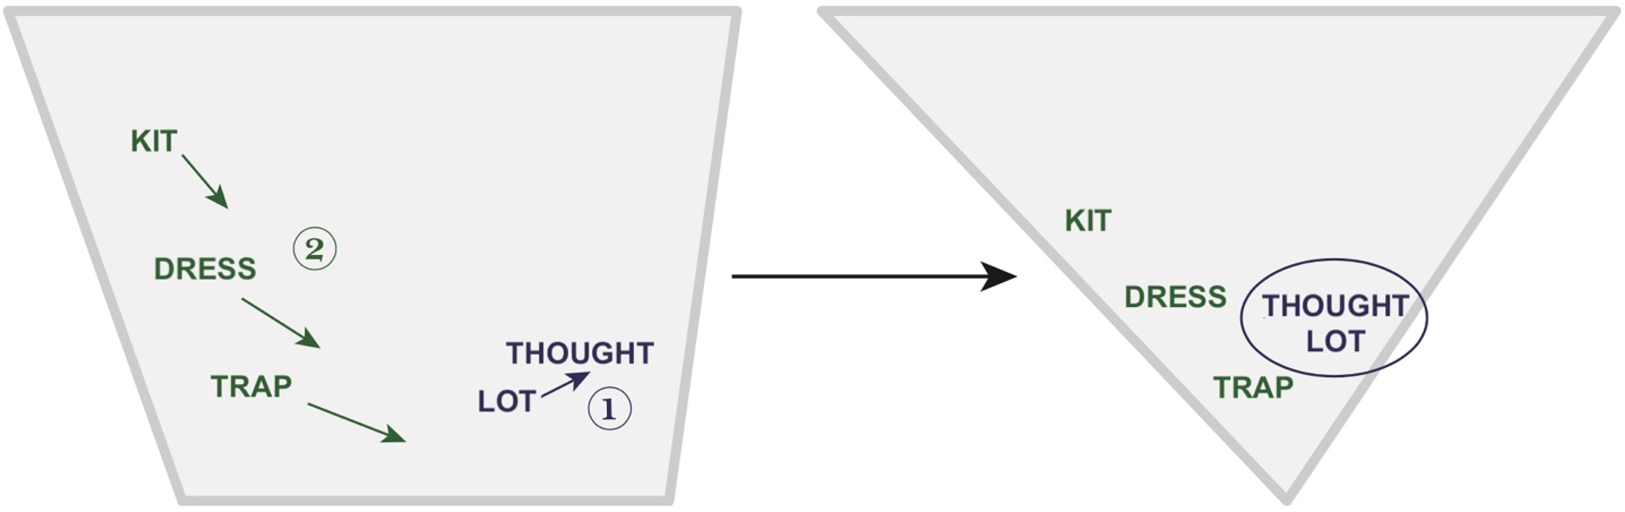
In the LBMS, the merging of LOT with THOUGHT creates instability in the subsystem of low and mid-high front vowels of TRAP, DRESS, and KIT, which results in their lowering and retraction in the direction of the gap left by the rising and retraction of LOT. As mentioned above, while there is considerable variation in the trajectory and sequence of these changes across different geographical areas, Becker (Reference Becker and Becker2019) illustrates the end result as the triangular vowel space showed in Figure 2 rather than the trapezoidal one on the left. The LBMS features have been documented in various areas in North America, as pointed out above, including southern California and the Upper Midwest. The California Vowel Shift (henceforth CVS) (Eckert, Reference Eckert2008; Cardoso et al., Reference Cardoso, Hall–Lew, Kementchedjhieva and Purse2016) features the fronting of GOOSE, GOAT, and STRUT, and the raising and fronting of pre-nasal TRAP in addition to the LBMS features illustrated in Figure 2. While many studies have documented the LBMS patterns of low back merger and lowering and retraction of low and mid-high front vowels in the Upper Midwest, the fronting of high back vowels and its possible social meanings in the areas have gone under-investigated. The low back vowel merger, for example, has been reported in the speech of European Americans in Lansing (Nesbitt & Mason, Reference Nesbitt and Mason2016) and both European Americans and Chinese Americans in Troy, MI (Zheng, Reference Zheng2018). An earlier work on the NCS in Michigan, however, shows that the degree of participation in the NCS could depend on community membership or ethnic visibility. Evans et al. (Reference Evans, Ito, Jones, Preston, Simon and Murray2006) compared Appalachians in Ypsilanti and African Americans in Lansing in terms of their participation in the NCS: Appalachians who lacked network density had more fronted and raised TRAP vowels while African Americans did not practice this advanced feature of the NCS that Evans et al. explored. Evans et al. attribute African Americans’ divergence from this NCS pattern partly to a ‘visual barrier’ (p. 195) that might discourage full participation in local patterns. Similarly, recent sociolinguistic research has highlighted the social meanings of the retention or reversal of the NCS features; for example, D'Onofrio & Benheim (Reference D'Onofrio and Benheim2020: 486) discuss the metalinguistic associations of the NCS with ‘White, working-class men who live in neighborhoods known to be historically “White ethnic” enclaves’ in Chicago. With the specific focus on the understudied community of MENA Americans and informed by studies reported above that evidence the influence of ethnic visibility and identity on linguistic behavior, the speech of the two groups of MENA Americans in this study is examined in reference to stereotypically local features that can be associated with white speakers in terms of vowel patterning. Given that one group of MENA Americans in this study is from southern California, the fronting of high back vowels is also examined in this paper; while the literature above shows advanced features of the NCS (such as fronted LOT and fronted and raised TRAP) can index ‘White’ local personae in the Upper Midwest, fronted high back vowels can index ‘White’ local personae in California (Bucholtz et al., Reference Bucholtz, Bermudez, Fung, Edwards and Vargas2007; Pratt & D'Onofrio, Reference Pratt and D'Onofrio2017). Therefore, the inclusion of high back vowels informs the exploration of the interaction between participants’ local and ethnic identities. As such, this study explores the speech of MENA Americans in two different local contexts in relation to stereotypically local features and the LBMS which is an established local pattern for southern Californians and an emerging trans-local pattern for the Upper Midwesterners.
3. Methodology
In order to explore the intersection of ethnic identity, locality, and vowel patterning, Sociolinguistic Interviews (Becker, Reference Becker, Mallinson, Childs and Herk2017) were conducted with MENA Americans in the Upper Midwest and southern California. This section provides a brief description of the Sociolinguistic Interviews.
3.1. Participants
Interviews were conducted with 17 MENA Americans in the Upper Midwest and 9 MENA Americans in southern California. All participants were recorded in one-on-one interviews except for two groups of two participants in southern California who decided to do the interview together. A full list of the participants, alongside age groups, is presented in Table 1.
Participants in sociolinguistic interviews
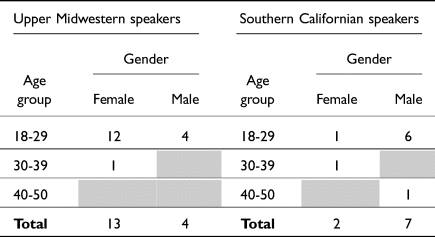
As shown in Table 1, the majority of participants (94% of Upper Midwesterners and 78% of Californians) are in the age group of 18 to 29. All participants were L1 English/English dominant speakers who were either born in the US (18 speakers) or moved to the US during the critical period for language acquisition (Lenneberg, Reference Lenneberg1967) (seven speakers). Of the 17 Upper Midwesterners, eight were from southcentral or southeastern Wisconsin, and nine participants from southeastern Michigan. Most participants from Wisconsin were either my friends (seven speakers) or friends of friends. In southeastern Michigan and southern California, I was able to interview friends of friends. I was also able to recruit participants by visiting community centers in southeastern Michigan and southern California. I had friendly chats with participants recruited through community centers, started their interviews with the reading passage (see §3.2) and welcomed joint interviews to create a more relaxed context comparable to interviews with friends. All participants knew I was also of MENA descent prior to their interview. Participants in the Upper Midwest volunteered their time and were not compensated for their participation in the study; however, participants in southern California received compensations of $10. This study was granted approval by the host institution's IRB, which provided permission for collecting interviews with informed consent.
3.2. Interview procedure
The interviews were done over the course of the period from November 2017 to January 2020 and conducted in a quiet area. The average duration of the interviews was 38 minutes. The interviews consisted of three components: 1) casual speech with a focus on cultural and ethnic identities, 2) a reading passage, and 3) a sentence list. All interviews were recorded on a solid state digital voice recorder. The interviews were transcribed using ELAN (Wittenburg et al., Reference Wittenburg, Brugman, Russel, Klassmann and Sloetjes2006) and force-aligned (with manual correction) using the FAVE-aligner (Rosenfelder et al., Reference Rosenfelder, Fruehwald, Evanini and Yuan2011).
3.3. Vowel extraction
Only vowels in lexical syntactic categories, with primary stress, and longer than 59 milliseconds were extracted for analysis in this paper. F1, F2, and F3 values were taken at 30% (head) and 70% (tail) of the duration of the vowel. I used a PRAAT (Boersma & Weenink, Reference Boersma and Weenink2018) script to mark the heads and tails of the target vowels; then, I went through each marked vowel manually to make sure the marking was done correctly: tokens for which the first three formants were not consistently tracked (in three parallel and straight lines) were excluded. Another PRAAT script was used to gather the F1, F2, and F3 values; formant settings were Praat's default for both male and female speakers, with formant ceiling set at 5500Hz. Formant measurements were done separately for each speech style reported in the previous section: casual speech, reading passage, and sentence list. The number of tokens of each vowel class will be presented in the following sections as I go through each vowel class in different speech styles. All formant values were normalized at the speaker level using the Lobanov method in the R package ‘vowels’ (Kendall & Thomas, Reference Kendall and Thomas2018).
4. Results
4.1. Casual speech style
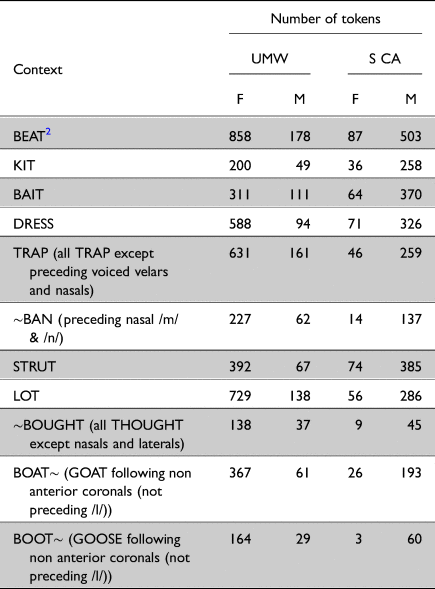
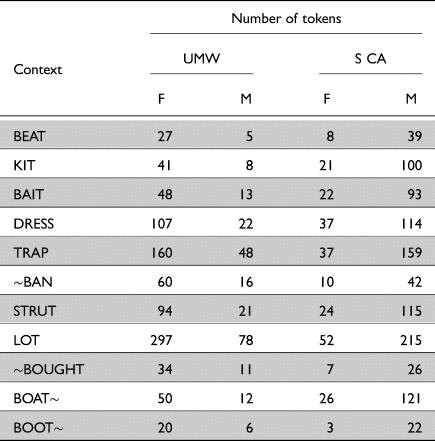
Table 2 shows the number of tokens of different vowel classes extracted from the casual speech context.
Tokens of different vowel classes extracted from the casual speech context across the two localities of Upper Midwest (UMW) and southern California (S CA) and binary genders
The vowel plots of the two groups of speakers across the two localities of the Upper Midwest and southern California and binary genders for the casual speech context are shown in Figure 3. Figure 3 and the following figures and the statistical tests that follow all include only vowel head measurements at 30% of the duration of vowels.
Casual Speech vowel plots (vowel heads at 30%) for MENA Americans in southern California (black color) and the Upper Midwest (gray color)
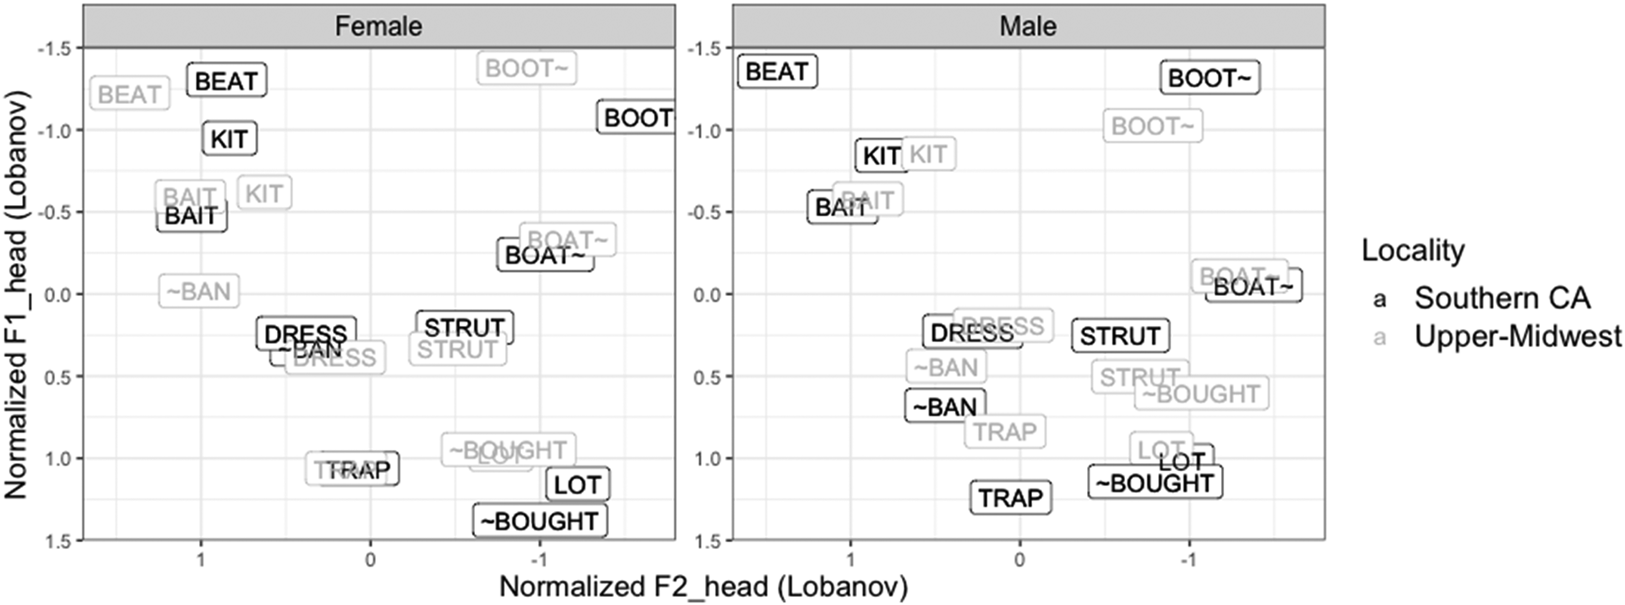
Figure 3 clearly shows some patterns across the two groups of speakers: (1) both KIT and DRESS are retracted for both groups of speakers (if we use BAIT as a benchmarkFootnote 3) and more so for the Upper Midwestern group (this pattern is consistent with both the LBMS and the NCS); (2) STRUT is fronted (using LOT as a benchmark) for both groups and more so by the Upper Midwestern group (this pattern is consistent with the LBMS but not with the NCS); (3) the nasal split of TRAP can be observed for both groups of people, with ~BAN raised and fronted and TRAP lowered and retracted, the split is clearly bigger for the Upper Midwestern female speakers; (4) interestingly, the low back vowels are merged for both groups (except the 4 male Upper Midwesterners); and (5) Upper Midwesterners’ BOOT~ is more fronted than the Californians’. In short, all vowel spaces are more consistent with the triangular patterning in the LBMS in Figure 2.
Linear mixed-effects models performed for select vowel classes (Appendix) also showed that ~BAN and TRAP are significantly different in both F1 and F2 for both groups of speakers; ~BOUGHT and LOT are significantly different in F2 only for both groups; and BOOT~ is also significantly different from LOT in F2 for both groups (being more retracted than LOT for Californians but fronter than LOT for Upper Midwesterners as Figure 3 shows). As mentioned above, DRESS and KIT retractions are both consistent with the CVS and the NCS; however, STRUT and BOOT~ frontings are features of the CVS and not consistent with the NCS. As such, in Figure 4 below, I will compare the F2 values of BOAT~, BOOT~, DRESS, KIT, and STRUT across the two groups of speakers.
Select F2 comparisons in Casual Speech style alongside t-test p values (‘***’ < 0.001; ‘**’ < 0.01; ‘*’ < 0.05) (lower on the Y-axis means further back in the mouth)
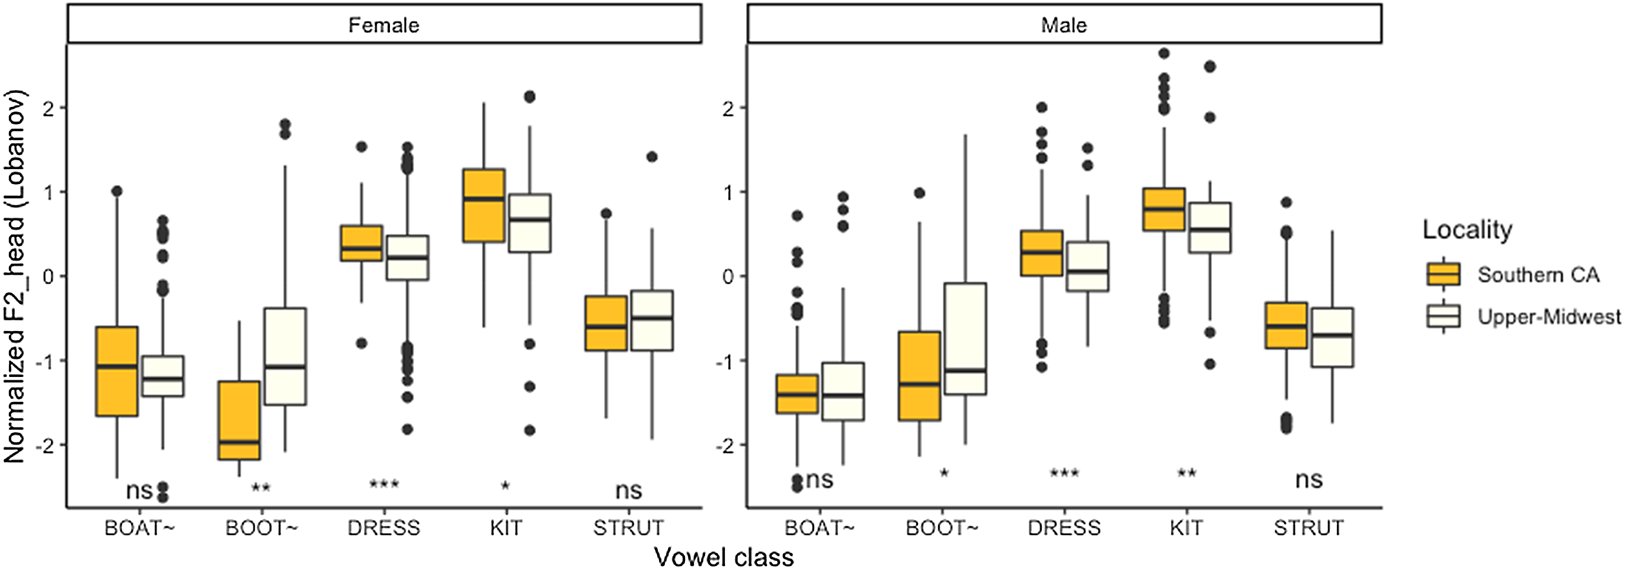
As shown in Figure 4, MENA Americans in the Upper Midwest have significantly more retracted DRESS and KIT vowels, but that pattern is consistent with the NCS as well. However, the Upper Midwesterners’ significantly more fronted BOOT~ vowel is more aligned with the CVS, a pattern more expected from their Californian counterparts. In the next section, I will explore this observation in the reading passage style.
4.2. The reading passage style
Table 3 shows the number of tokens of different vowel classes extracted from the reading passage style.
Tokens of different vowel classes extracted from the reading passage context
The vowel plots of the two groups of speakers across the two localities of the Upper Midwest and southern California and binary genders for the reading passage context are shown in Figure 5.
Reading passage vowel plots (vowel heads at 30%) for MENA Americans across locality
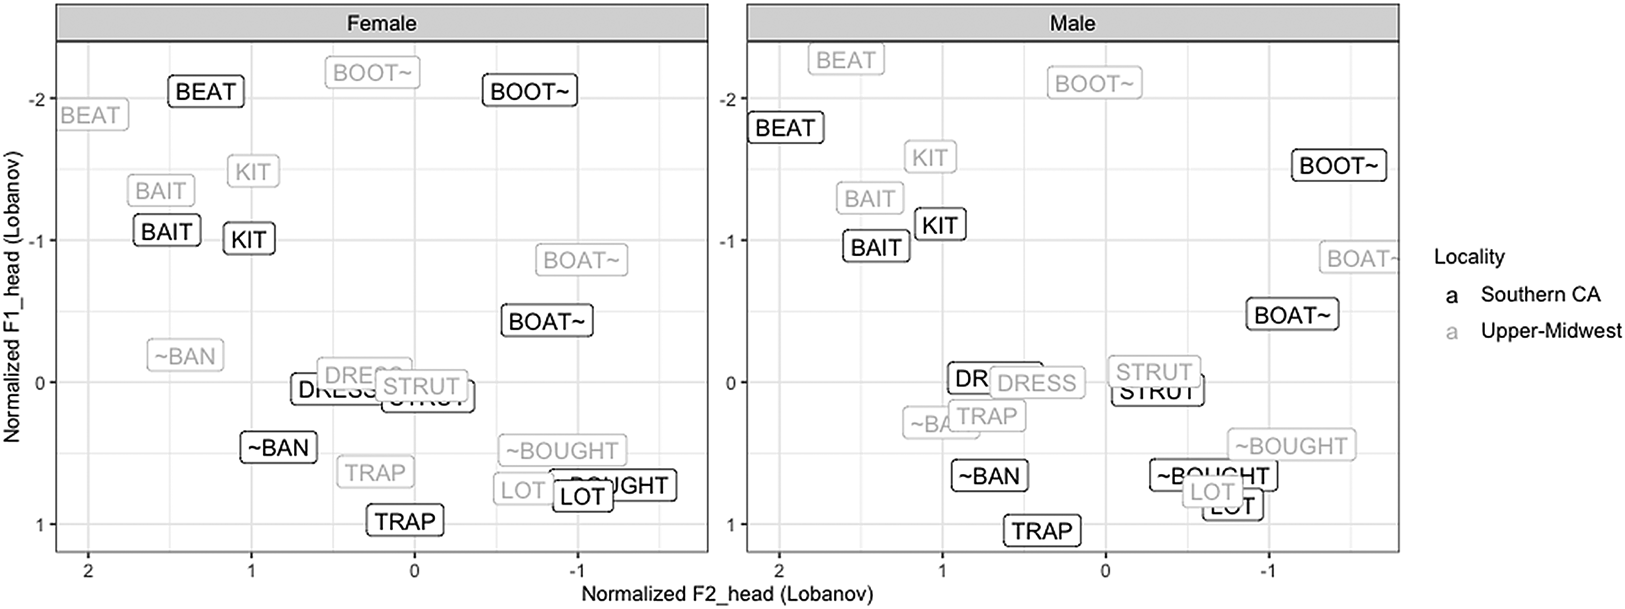
Linear mixed-effects models performed for select vowel classes (Appendix) showed both groups have distinct TRAP and ~BAN vowels in terms of both F1 and F2. However, while Californians’ LOT and ~BOUGHT are only significantly different in F1, Upper Midwesterners’ low back vowels are distinct both in F1 and F2. Additionally, while male Californians’ BOOT~ (88% of all California tokens) is significantly more retracted than their LOT, Upper Midwesterners’ BOOT~ is significantly fronter than their LOT. The boxplots in Figure 6 compare the F2 values of select vowels across the two groups of speakers.
Select F2 comparisons in Reading Passage style alongside t-test p values (‘*’ < 0.05) (lower on the Y-axis means further back in the mouth)
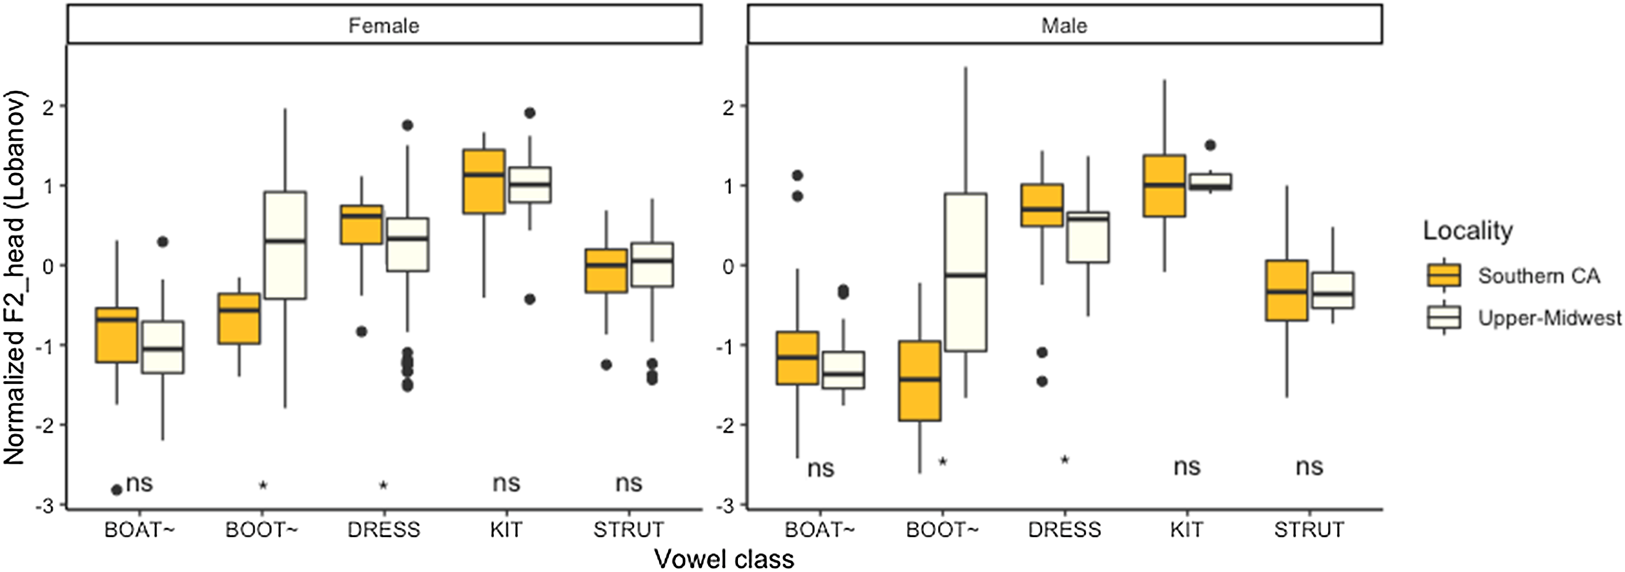
Figure 6 shows two significant differences between the two groups of speakers: (1) DRESS is more retracted for the Upper Midwesterners, which is consistent with both the LBMS and the NCS; and (2) Upper Midwesterners’ BOOT~ is more fronted, a prominent feature of the CVS.
So far, we have observed that MENA Americans in the Upper Midwest and southern California both demonstrate the TRAP nasal split in their speech (a feature of the CVS) and the Upper Midwesterners have fronter BOOT~ vowels than their southern Californian counterparts and when they pay more attention to their speech (i.e., in the reading passage context), their BOOT~ vowels are even fronter (again both features of the CVS). Nonetheless, with more attention to speech, the Upper Midwesterners’ low back vowels become more distinct (a feature of the NCS and not a feature of Californian speech). Figure 7 illustrates the distance between the two low back vowels both in height (F1) and backness (F2) for both groups of MENA American speakers across speech styles and binary gender.
Comparison of low back vowels height (F1) and backness (F2) alongside pillai scores across speech styles, locality, and binary gender
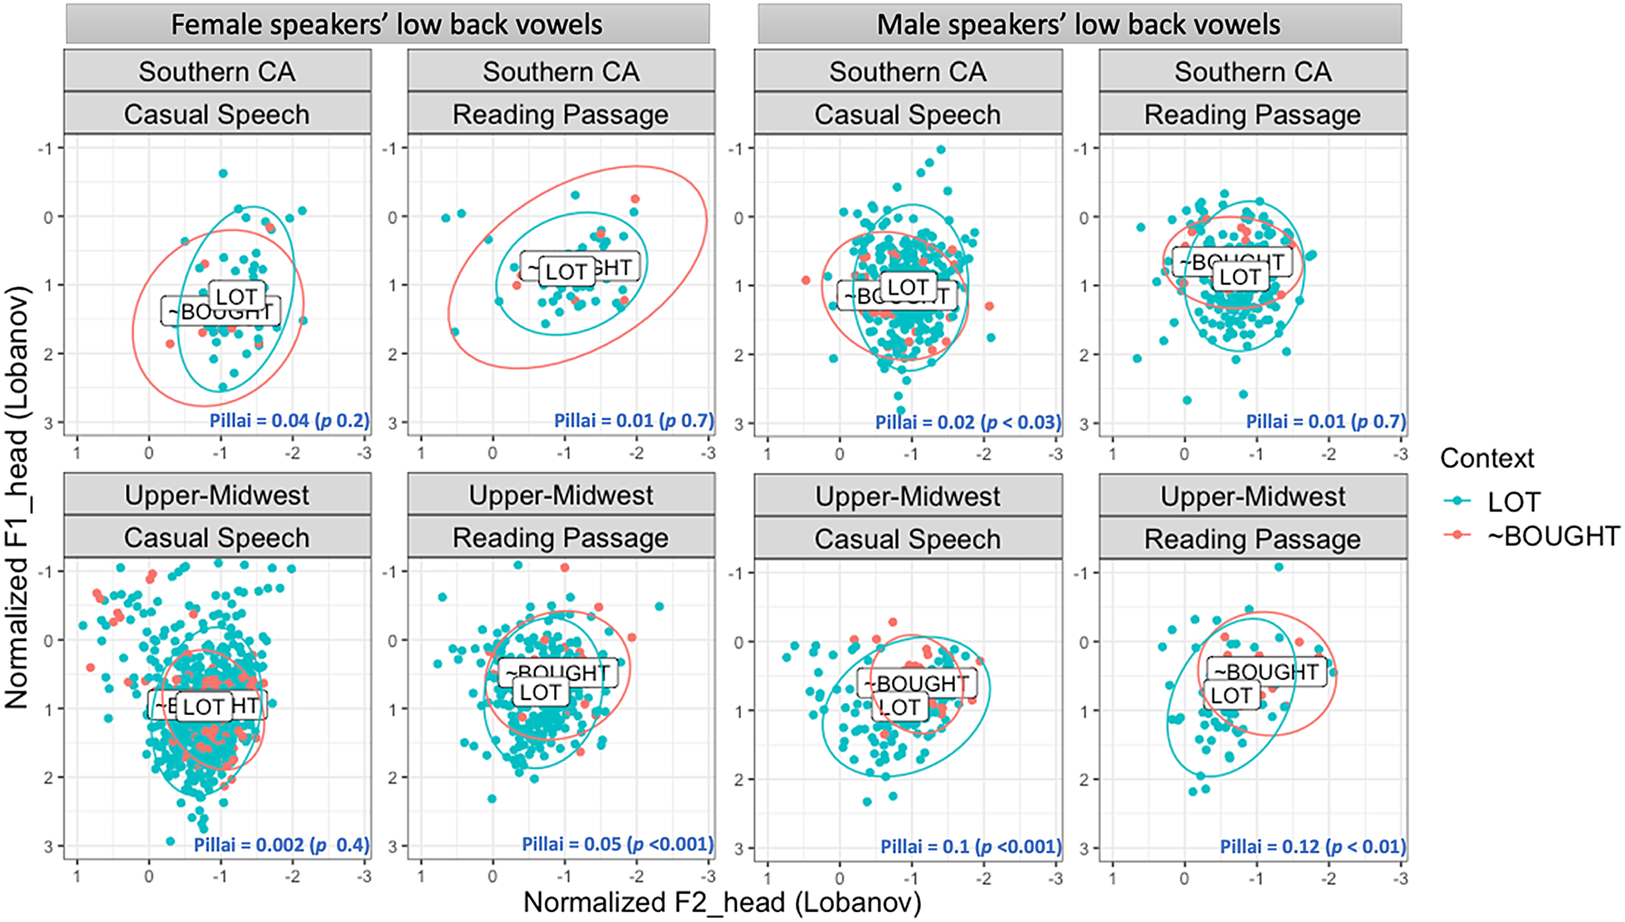
As Figure 7 shows, for the southern Californian group, the distance between the low back vowels is not affected by speech style: Pillai score (Hay, Warren & Drager, Reference Hay, Warren and Drager2006; Nycz & Hall–Lew, Reference Nycz and Hall–Lew2013) – with values close to 0 indicating more overlap and closer to 1 indicating complete distinction – stays almost the same. Interestingly, male Upper Midwesterners’ low back vowels are not affected by style, and they have the most distinct low back vowels. However, for the Upper Midwestern female speakers, more attention to speech covaries with more distance between the low back vowels, with an increase of 0.048 in Pillai score. This observation can suggest that the convergence of the low back vowels is a change in progress for Upper Midwesterners led by female speakers.
5. Discussion and conclusion
In its mid-decade research on race and ethnicity in the 2010s, the US Census Bureau considered the addition of a standalone ‘Middle Eastern or North African’ box to census forms (Jones, Reference Jones2017). This consideration was a reflection of the socio-political implications of the dilemma that many MENA Americans face in their everyday lives. MENA Americans have been historically and legally classified as ‘white’ in the US census system but are not socially perceived as white (Beydoun, Reference Beydoun2013, Reference Beydoun2015). While previous studies exploring vowel patterns of MENA Americans in southeastern Michigan indicate to the lack of participation in the stereotypically local pattern of the NCS (e.g., Samant, Reference Samant2010; Bakos, Reference Bakos2012), recent studies show the waning of NCS features in the Upper Midwest (e.g., D'Onofrio & Benheim, Reference D'Onofrio and Benheim2020; D'Onofrio, Reference D'Onofrio2021) and particularly in south-central and southeastern Michigan even among European American speakers (e.g., Wagner et al., Reference Wagner, Mason, Nesbitt, Pevan and Savage2016; Zheng, Reference Zheng2018; Nesbitt, Reference Nesbitt2021). Local speech patterns such as the NCS have traditionally been associated with European American speakers (e.g., Labov, Reference Labov2001). As such, the speech of European American speakers has been traditionally used as a benchmark to compare the speech of ethnic minority speakers against in the field of language variation and change (Fought, Reference Fought, Chambers and Schilling2013). Recently, variationists have focused more on the internal community comparisons (see, e.g., Holliday, Reference Holliday2019; King, Reference King2021) which highlights variation in the speech of minority groups. For example, King (Reference King2021) showed how speakers with different personae within a Black community in Rochester, NY, position themselves in terms of the local and social meanings of the NCS features. Contributing to this emerging literature on variation within minoritized groups of speakers, the present study compared the vowel patterns of two groups of MENA Americans in two different localities: the Upper Midwest and southern California. The results of the present study showed that the vowel patterning in the speech of MENA Americans in the Upper Midwest provides further evidence that the NCS is waning in this region in favor of a vowel pattern consistent with the LBMS. Their vowel space is a triangular pattern with the convergence of low back vowels, and the retraction and lowering of KIT, DRESS and TRAP (while ~BAN is raised and fronted). It is important to note here that the convergence of low back vowels – a feature of this trans-local vowel pattern – is not a complete merger for the Upper Midwestern group and can be considered a change in progress led by female speakers: while male speakers’ low back vowels are more distinct across speech styles, with more attention to style, the female Upper Midwesterners’ speech showed more distinction of low back vowels, which could suggest that this change in progress is a change from below led by female speakers. Future research can shed more light on this specific speech pattern by looking at the low back vowels across different age groups, different speech styles, different ethnic groups, urban versus rural contexts in the Upper Midwest, and including a more balanced number of female and male speakers.
By comparing the speech of the two groups of MENA Americans across the localities of southern California and the Upper Midwest, the results of the present study shows interesting intersections of ethnic affiliation and linguistic behavior by considering the TRAP nasal split and the fronting of high back vowels. Recent studies show that TRAP raising in the NCS – in all its phonological environments – has lost its locally-based prestigious status against the backdrop of deindustrialization in southcentral and southeastern Michigan and the Upper Midwest in general (Driscoll & Lape, Reference Driscoll and Lape2015; Nesbitt, Reference Nesbitt2018, Reference Nesbitt2021; King, Reference King2021); as such, the Upper Midwesterners’ TRAP nasal split could be interpreted within the broader context of the waning of NCS features in the Upper Midwest. However, metalinguistic commentary of some of the Upper Midwestern participants in which they associated the raising of non-nasal TRAP vowels with local (and mostly white) speech in their surroundings can indicate some degree of intentional avoidance of stereotypically local features. For example, one of the speakers in the Upper Midwest (Speaker SCWI03) mentioned the words bag with a raised TRAP vowel and Wisconsin with a fronted LOT vowel as stereotypical local features of south-central Wisconsin; this is consistent with D'Onofrio & Benheim's (Reference D'Onofrio and Benheim2020) findings that the use of the NCS is associated with local personae, specifically white speakers, in a specific community in Chicago.
Meanwhile, as discussed above, in the social context of California the nasal split of TRAP is perceived to be more advanced for white speakers. Cardoso et al. (Reference Cardoso, Hall–Lew, Kementchedjhieva and Purse2016), for example, discussed the social meanings of the TRAP nasal split in California English in terms of its association with white speakers, with D'Onofrio (Reference D'Onofrio2015) arguing that TRAP backing can be associated with the ‘Valley Girl’ persona. While both groups of speakers in the present study have the TRAP nasal split, this split is more advanced for the Upper Midwesterners (especially female speakers) than the Californians specifically in the more careful speech style (the reading passage). In light of Cardoso et al.'s (2016) discussion of more advanced TRAP nasal split being associated with white Californian speech, this finding could be interpreted as a social indexing of non-white personae for MENA American Californians, an interpretation consistent with the participants’ metalinguistic comments about another stereotypical feature of California English: high back vowel fronting. While TRAP retraction (and by proxy the nasal split of TRAP) could be taken as a markerFootnote 4 of California English being considered in the variationist literature on California English for a long time (cf., e.g., Hinton et al., Reference Hinton, Moonwomon, Bremner, Luthin, Van Clay, Lerner and Corcoran1987; Villarreal, Reference Villarreal2018), Bucholtz et al. (Reference Bucholtz, Bermudez, Fung, Edwards and Vargas2007) describe high back vowel fronting as a stereotype of California English. The fronting of BOOT and BOAT is associated with the Valley Girl, or the ‘Surfer Dude’, persona and is considered ‘a stereotype of Southern California teenage girls’ (Bucholtz et al., Reference Bucholtz, Bermudez, Fung, Edwards and Vargas2007: 326). Similarly, Speaker SC27 in southern California in the present study mentioned the word rainbow with a fronted BOAT vowel to describe stereotypically local features which he mostly associated with ‘the white people like the typical, you know, surfer’. The Upper Midwestern speakers in the present study had fronter BOOT vowels than their Californian counterparts, even more so when they paid more attention to their speech (in the more careful speech context of the reading passage). As such, in light of the metalinguistic commentary of the participants and the literature on the social meanings of the NCS and California English discussed above, I argue that the speech of both groups of MENA Americans in the present study shows resistance to stereotypically local features in ways consistent with the trans-local vowel patterning of the LBMS. Future research can conduct a more systematic analysis of the social attitudes of MENA Americans towards stereotypically local features in their surrounding communities, and include a more balanced group of participants in terms of conceptual gender and numbers across different local contexts. In summary, the present study contributed to the emerging literature on the LBMS vowel patterning in the US Upper Midwest by providing evidence from MENA Americans. This study showed that while Upper Midwestern MENA Americans’ vowel patterning is consistent with the LBMS led by female speakers (specifically in TRAP nasal split and low back vowels’ convergence), some level of agency in avoiding stereotypically local features could be assumed in the speech of both groups of MENA Americans. Upper Midwesterner's lowered and retracted pre-oral TRAP vowel and Californians’ not fronted BOOT~ vowel (compared to that of their Upper Midwestern counterparts’) – alongside their metalinguistic comments – provide evidence for their performative agency in avoiding stereotypically local features.
Appendix
Linear mixed effects regression models were fit to the normalized F1 and F2 values for select vowel classes (~BAN, TRAP, ~BOUGHT, LOT, BOOT~) using the lme4 package (Bates et al., Reference Bates, Mächler, Bolker and Walker2015). Sample R codes used to fit these models are as follows:
lmer(f1_head~Context + Word + Gender + (1|Speaker), data = CAcstrim)
lmer(f2_head~Context + Word + Gender + (1|Speaker), data = CArptrim)

 IMAN SHEYDAEI is a lecturer at the University of Wisconsin-Madison's English Department, and a Research Affiliate at the University of Michigan where he worked as a Visiting Research Assistant Professor from 2021 to 2023. Iman got his Ph.D. in English Language and Linguistics from UW-Madison in 2021, and his sociolinguistic research focuses on Americans of Middle Eastern or North African descent and Dearborn English. Email: sheydaei@umich.edu


 Open access