

It has been suggested that approaches of combining instruments, e.g. repeated 24-h dietary recall (24HDR) with a FFQ, may provide high-quality dietary information, especially for the assessment of foods that are not consumed every day( Reference Tooze, Midthune and Dodd 1 – Reference Subar, Dodd and Guenther 5 ). These methods presume that the usual dietary intake of a subject equals the consumption probability of a food on a given day multiplied by the average amount of intake of that food on a typical consumption day. In theory, the information on consumption probability and consumption-day amount could be derived from different instruments. It has been previously noted that most of the variation in food consumption is explained by frequency of intake( Reference Heady 6 , Reference Noethlings, Hoffmann and Bergmann 7 ). We therefore recently proposed the application of a short 24-h food list for the estimation of consumption probability, which only enquires about whether or not a food was consumed on the previous day( Reference Freese, Feller and Harttig 8 ). Individual information on amounts consumed is replaced by standard consumption-day amounts. The 24-h food list is intended to be used in a combined approach with an FFQ to estimate usual dietary intake. This approach is currently implemented in a large German cohort study, the German National Cohort( Reference Ahrens, Greiser and Linseisen 9 , 10 ), and reflects an effort to reduce demands on time in dietary assessment in large-scale settings.
Information on standard consumption-day amounts of foods may be derived from different sources: representative national dietary survey data or detailed dietary assessments on a subgroup of the population under study are two examples. Furthermore, standard consumption-day amounts can either be assigned identically for all study participants, or specifically stratified for subgroups of the study population such as men and women( Reference Noethlings, Hoffmann and Bergmann 7 ), or estimated by using appropriate statistical models( Reference Tooze, Midthune and Dodd 1 , Reference Haubrock, Nothlings and Volatier 3 ).
Thus far, there has been some research on factors influencing both the amount of foods consumed and frequency of consumption. It has been shown that amounts consumed differed by sex, age or BMI( Reference Noethlings, Hoffmann and Bergmann 7 , Reference Clapp, McPherson and Reed 11 ). According to previous research in surveys, sociodemographic factors such as education( Reference Worsley, Blasche and Ball 12 ), income( Reference Worsley, Blasche and Ball 13 ), family status( Reference Billson, Pryer and Nichols 14 ), socio-economic status( Reference Hulshof, Brussaard and Kruizinga 15 ) and smoking status( Reference Margetts and Jackson 16 , Reference Padrao, Lunet and Santos 17 ) were associated with food and beverage consumption. However, these studies looked at the factors separately, so that it remains unclear whether or not the factors have a joint impact on the individual consumption-day amounts. Moreover, different factors may be of relevance for amounts of different groups of foods and beverages.
Implementing person-specific standard consumption-day amounts, also differently across food groups, may lead to more precise estimates of individual usual dietary product intake. Therefore, the aim of the present study was to identify determinants explaining variation in consumption-day amounts across different food groups using national dietary survey data.
Subjects and methods
Survey methodologies and study population
The German National Nutrition Survey II (NVS II) was carried out from November 2005 to January 2007 in a representative sample of German-speaking residents( Reference Heuer, Krems and Moon 18 ). Amongst others, dietary intake in the NVS II was assessed on two non-consecutive days using EPIC-Soft (renamed GloboDiet in 2014), a well-established computerised 24HDR, conducted by trained interviewers over the telephone( Reference Slimani, Deharveng and Charrondiere 19 , Reference Eisinger-Watzl, Strassburg and Ramunke 20 ). The two 24HDR were randomly sampled and approximately proportionally distributed over weekdays and weekends (75 and 25 %, respectively)( Reference Eisinger-Watzl, Strassburg and Ramunke 20 ). The interviews were open-ended and included probing questions and integrated quality checks. In detail, participants were asked to recall the foods and drinks they had consumed the previous day. A quick list was used to report all foods and beverages consumed. This was followed by a detailed enquiry on food preparation, portion size, brand names or additions( Reference Slimani, Deharveng and Charrondiere 19 , Reference Slimani, Ferrari and Ocke 21 ). Portion size was assessed using household measures, standard units and a picture booklet( Reference Eisinger-Watzl, Strassburg and Ramunke 20 ). In the end, additional data checks were conducted by the research team to identify and correct for data input errors (e.g. for large and small quantities, extremes in the calculated energy and macronutrient intake).
In total, 12 502 participants of the NVS II aged 20–80 years completed two EPIC-Soft 24HDR. For the present study, NVS II participants were excluded if they were breastfeeding or pregnant women, or if they had a particular diet such as a slimming diet or a diet related to health conditions (n = 2672). It was assumed that those study participants did not consume typical amounts of foods and beverages. In addition, NVS II participants with missing values on socio-economic factors and smoking status were excluded (n = 1308). This resulted in an analytical study population of 8522 participants.
Demographic, socio-economic and lifestyle variables were assessed in a computer-assisted personal interview( Reference Heuer, Krems and Moon 18 ). Years of education were determined according to the International Standard Classification of Education 1997( 22 ). Anthropometric measures were assessed in three different ways: (1) measures of weight and height following a standardised protocol( Reference Lohmann, Roche and Martorell 23 ) (n = 5809); (2) self-reported weight and height (n = 2694); and (3) for participants with missing information on weight and height, the BMI was calculated based on sex- and age-specific mean values for BMI from NVS II participants with information on measured or self-reported weight and height (n = 19).
Classification of food groups
Foods were grouped according to a newly developed tool, the short 24-h food list( Reference Freese, Feller and Harttig 8 ). Food and drink items were categorised into thirty-eight groups of food and beverages. The food groups and the general food items within each group are listed in Supplementary Table S1. For each food group, the consumption-day amount, defined as the amount consumed in g per d, was calculated.
Statistical analysis
Descriptive statistics of the study population are presented as percentages for categorical variables and as mean and standard deviation for continuous variables.
To check for multicollinearity between determinants, the variance inflation factor was calculated. The φ coefficient was determined to measure the association between predictors for consumption-day amounts. The analyses were performed using the statistical software package SAS (version 9.4, 2008; SAS Institute Inc.).
The consumption-day amount (g/d) was treated as the dependent variable. Sex, age (years), BMI (kg/m2), smoking status (current; former; never), years of education (9–10; 12–13; 14–16; 17–18 years), living together with a partner (yes; no), household net income (<1500 €; 1500 € to <3000 €; ≥3000 €) and employment status (yes; no) were investigated as determinants.
To determine the most relevant predictors of consumption-day amounts, the LASSO, as a popular shrinkage and variable selection method for linear mixed-effects models, was used (see Supplementary Methods for detailed information on the statistics). The dependent variable was Box-Cox transformed to obtain normally distributed residuals( Reference Box and Cox 24 ). Further statistical analysis was conducted using the package lmmlasso in R (version 3.1.1). To pick the most suitable LASSO model, the Bayesian information criterion was used. The Bayesian information criterion is advocated in the original article proposing the LASSO for linear mixed-effects models based on the authors’ empirical experience( Reference Schelldorfer, Buhlmann and Van De Geer 25 ).
Results
The analytical sample comprised 3989 men (47 %) and 4533 women (53 %) (Table 1). Overall, the mean age of the study population was 48 years and the mean BMI was 26·0 kg/m2.
Characteristics of participants of the German National Nutrition Survey II (n = 8522)
(Percentages, mean values and standard deviations)
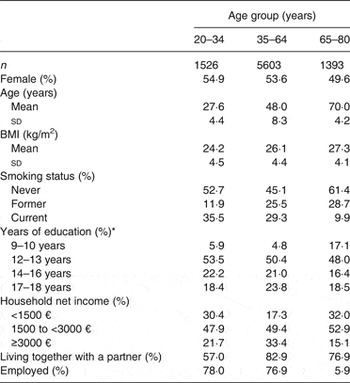
* According to the International Standard Classification of Education 1997( 22 ).
The results of the LASSO variable selection explaining the consumption-day amounts across the thirty-eight food and beverage groups, using the Bayesian information criterion as the selection criterion, are shown in Tables 2 and 3. Overall, sex was selected as the predictor most often (n = 26) followed by age (n = 21) and smoking status (n = 18) (Table 2). In contrast, employment status, living with a partner and household net income were chosen less frequently. Years of education and BMI were selected for the models of thirteen and twelve food groups, respectively. With respect to single food groups, all eight determinants were of relevance for the consumption-day amount of coffee and juice (Table 3). In contrast, no predictor was selected for the models of the food groups cabbage, legumes, offal, tea, fruit vegetables, leafy vegetables, root vegetables, vegetable oils and other fats. For cake, potatoes and poultry, sex was the only determinant selected, whereas for the food group other vegetables, solely age was chosen.
Relevance of determinants for consumption-day amounts across thirty-eight food groups using LASSO variable selection*
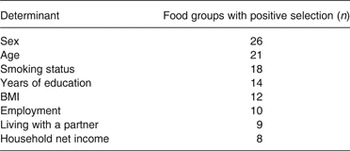
* Selection criterion: Bayesian information criterion.
Selected determinants for consumption-day amounts across thirty-eight food and beverage groups*

* LASSO variable selection for linear-effect models was used; selection criterion: Bayesian information criterion.
† Food groups cabbage, tea, root vegetables, leafy vegetables, fruit vegetables, legumes, offal, vegetable oils and other fats are not shown because no determinant was selected for those food groups.
Both the variance inflation factor and the φ coefficient indicated a correlation only of the determinants years of education and household net income in the models (variance inflation factor >2; r φ = 0·37) (data not shown).
Discussion
The findings of the present study indicate that all demographic and socio-economic factors investigated were relevant for the consumption-day amount of specific food groups. However, differences in importance across food and beverage groups were observed. Sex was shown to be the most relevant predictor followed by age and smoking status. In contrast, household net income was less important. Interestingly, BMI was overall less relevant for consumption-day amount of food groups than expected.
The estimation of usual dietary intake in large-scale prospective studies is a current topic of interest. It has been suggested that an approach of combining instruments such as repeated 24HDR and FFQ may provide high-quality dietary information, especially for the assessment of foods that are not consumed every day( Reference Tooze, Midthune and Dodd 1 – Reference Subar, Dodd and Guenther 5 ). These methods presume that the usual dietary intake of a subject equals the consumption probability of a food on a given day multiplied by the average amount of intake of that food on a typical consumption day. Although multiple administrations of detailed 24HDR would be optimal, this is impracticable in large-scale cohort studies due to the associated high costs and time expenditure( Reference Schatzkin, Subar and Moore 26 ). Detailed web-based 24HDR developed for self-administered use are likely to be more cost-effective with respect to administration( Reference Illner, Freisling and Boeing 27 ), but might still be time-consuming for the study participant, and are only available in the UK( Reference Carter, Albar and Morris 28 ) and the USA( Reference Subar, Kirkpatrick and Mittl 29 ) so far. For Germany, we recently proposed a short 24-h food list, which only enquires about whether or not a food was consumed on the previous day( Reference Freese, Feller and Harttig 8 ). Instead of individual amounts consumed, standard consumption-day amounts can be applied for the estimation of usual dietary intake.
Our study indicated that different determinants were of importance for different food groups. For some food groups, six to eight predictors were important whereas for other groups, none was chosen. Overall, sex, age and smoking status were shown to be mostly relevant, but for some food groups further determinants carried information. Thus, if available, person-specific consumption-day amounts could be predicted differently across foods. However, the gain in information for the estimation of usual dietary intake might have to be evaluated in future research.
Information on standard consumption-day amounts may be derived from different sources of data. First, national dietary survey data such as the NVS II in Germany can be used( Reference Heuer, Krems and Moon 18 ). Second, the application of 24HDR on a subgroup of the population under study can be conducted. National survey data might provide representative data of the population of a country. Moreover, survey sample sizes are typically large and, thus, the variety in the pictured diet might be high. This may lead to more reliable data for the computation of standard consumption-day amounts. In contrast, the application of 24HDR in a subgroup of the population under study might be preferable for specific ethnic populations.
To take into account covariates predicting consumption-day amounts, two general strategies are possible. First, standard consumption-day amounts could be derived using stratified mean or median intakes of the respective food items as it has been done previously( Reference Noethlings, Hoffmann and Bergmann 7 , Reference Lyons, Walton and Flynn 30 ); and second, amounts could be estimated by using appropriate statistical models( Reference Tooze, Midthune and Dodd 1 , Reference Haubrock, Nothlings and Volatier 3 , Reference Harttig, Haubrock and Knuppel 31 ). Tooze et al. ( Reference Tooze, Midthune and Dodd 1 ) stated that using statistical models may result in a more efficient estimation than does stratification. Especially when applying a number of person-specific factors, as is suggested by the present findings, stratification may lead to very small samples for specific strata combinations. Therefore, the application of prediction models seems to be advantageous for the proposed approach.
Of note, person-specific standard consumption-day amounts can only be used for determinants which actually have been measured in the respective study. All of the proposed determinants are nowadays typically assessed in nutritional epidemiological studies meaning that no additional assessment effort would be necessary( Reference Wichmann, Kaaks and Hoffmann 32 , Reference Riboli, Hunt and Slimani 33 ). However, for household net income, which was one of the factors proposed to be important for consumption-day amounts, no general standards are available for the generation of categories. Even if prediction models are applied instead of stratification, this variable needs to be categorised for analysis. Thus, future research should evaluate the application of different strata according to the estimation of usual dietary intake. A correlation between the variables household net income and years of education was observed. Thus, the use of one of the variables would be sufficient for the application of person-specific standard consumption-day amounts.
Our study has some limitations. First, to identify determinants that explain variation in consumption-day amounts of foods and beverages, food items of different serving size were combined into commonly used food groups, reducing some of the variation in the data. Second, although a broad range of possibly informative socio-economic and anthropometric factors was considered, there may be other important determinants such as physical activity that additionally influence the amount consumed. It was, however, not possible to include this variable in our analysis since information on physical activity in the NVS II was assessed for a subgroup of participants only. The remaining study population would have weakened the analysis. Third, the application of person-specific standard consumption-day amounts is limited by sufficient variation of determinants in a study population.
The fact that representative contemporary German dietary survey data were used to analyse determinants of consumption-day amounts can be considered a strength. Thus, the results are suitable for use all over Germany. State-of-the-art variable selection procedures were applied to analyse the relevance of consumption-day amount predictors. The application of person-specific standard consumption-day amounts may lead to more precise estimates of usual dietary intake in large-scale settings that are limited by the costs and logistics of data collection.
Conclusion
For the estimation of usual dietary intake in combined approaches, person-specific standard consumption-day amounts could be used. Sex, age and smoking status were shown to be the most relevant determinants in our analysis. However, for some food groups further determinants were explanatory, suggesting, if possible, to predict consumption-day amounts based on the whole set of relevant variables. The impact of person-specific standard consumption-day amounts for the estimation of intake of single food items might need to be evaluated in future research.
Supplementary material
The supplementary material for this article can be found at http://dx.doi.org/10.1017/jns.2016.26
Acknowledgements
The original survey (NVS II) was funded by the German Federal Ministry of Food, Agriculture and Consumer Protection.
The authors’ contributions are as follows: U. N., J. F., H. B. and S. K. designed the research; J. F. was responsible for manuscript preparation; J. F., M. P.-J. and S. K. were responsible for data handling, statistical analyses and data interpretation; M. P.-J. was involved in manuscript preparation; U. N., H. B., M. C. and T. H. contributed to data interpretation. All authors critically reviewed the manuscript. All authors read and approved the final version of the manuscript.
The authors declare that they have no conflicts of interest.


 Open access