

Sustainable expansion of aquaculture requires reduction in the use of fishmeal (FM) and fish oil (FO) in aquafeed formulations( Reference Glencross 1 – Reference Tacon and Metian 4 ). Both raw materials, particularly FO, are rich in the two key n-3 long-chain (≥C20) PUFA (LC-PUFA), EPA (20 : 5n-3) and DHA (22 : 6n-3), recognised as essential fatty acids (EFA) for the majority of marine fish species( Reference Tocher 5 ). DHA is an essential component of neural and retinal membranes( Reference Gawrisch, Eldho and Holte 6 ) and both EPA and DHA are precursors for an extensive range of autocrine signalling molecules (e.g. eicosanoids, resolvins, protectins, etc.)( Reference Serhan, Chiang and Van Dyke 7 ). Dietary deficiency of n-3 LC-PUFA has impacts on the health( Reference Oliva‐Teles 8 ), metabolism( Reference Tocher 9 , Reference Jordal, Torstensen and Tsoi 10 ) , composition( Reference Izquierdo, Montero and Robaina 11 , Reference Benedito-Palos, Navarro and Sitjà-Bobadilla 12 ) and growth( Reference Kalogeropoulos, Alexis and Henderson 13 ) of marine fish.
Typically, an aquafeed for a given marine fish species contains a combination of FO to supply essential n-3 LC-PUFA and vegetable oils (VO) that, whereas devoid of LC-PUFA, supply dietary energy( Reference Sargent, Tocher and Bell 14 , 15 ). Marine fish lack sufficient activity of the LC-PUFA biosynthesis pathway to satisfy requirements( Reference Tocher 5 ). In terms of fatty acid composition, the key effects of high inclusion levels of VO are an increase in C18 unsaturated fatty acids (α-linolenic acid, linoleic acid and oleic acid) in the fish tissues at the expense of LC-PUFA that is reflective of the altered composition of dietary fatty acids( Reference Turchini, Ng and Tocher 16 ). With regards to lipid metabolism, studies have reported that inclusion of dietary VO leads to reduced fatty acid catabolism and the accumulation of lipid in liver of Atlantic salmon (Salmo salar) and gilthead seabream,( Reference Caballero, Izquierdo and Kjørsvik 17 – Reference Jin, Lu and Yuan 19 ). Studies examining the influence of VO on lipid biosynthesis have yielded conflicting results with some reporting increased gene expression in Atlantic salmon and black seabream (Acanthopagrus schlegelii)( Reference Morais, Pratoomyot and Taggart 18 , Reference Jin, Lu and Yuan 19 ) and others reporting decreased enzyme activity in gilthead seabream( Reference Menoyo, Izquierdo and Robaina 20 ) although, in mammals, EPA has been shown to supress lipogenesis( Reference Takeuchi, Yahagi and Izumida 21 ).
Lipid homoeostasis is maintained in animals through a balance of catabolic and anabolic processes. Fatty acids and cholesterol can be synthesised de novo by pathways that are activated by sterol regulatory element-binding proteins (Srebp) 1 and 2, respectively. Srebp are transcription factors involved in energy homoeostasis and have many target genes with examples of those in lipid metabolism including fatty acid synthase (fas) and fatty acid desaturase 2 (fads2), the latter being key enzymes in the LC-PUFA biosynthesis pathway( Reference Daemen, Kutmon and Evelo 22 , Reference Castro, Corraze and Basto 23 ). Fatty acids are catabolised by the β-oxidation pathway in either mitochondria or peroxisomes, and expression of genes encoding proteins involved in these pathways are regulated by, among others, Ppar( Reference Mandard, Müller and Kersten 24 ). Upon binding ligands and retinoid X receptor, Ppars bind to peroxisome proliferator response elements in the promoter regions of target genes, many of which are involved in β-oxidation, such as carnitine palmitoyl transferase I (cpt1α) and liver-type fatty acid binding protein (fabp1), both proteins involved in the intracellular transport of fatty acids destined for catabolism( Reference Mandard, Müller and Kersten 24 , Reference Leaver, Villeneuve and Obach 25 ).
Despite recent advances in our knowledge regarding the impacts of dietary VO some questions remain, for instance, are dietary differences in gene expression dependent on precise concentrations of dietary nutrients or are genes activated/deactivated at particular levels of FO substitution? Therefore, the present study aimed to examine the impact of modern (high lipid, low FM) aquafeed formulations across a gradient of n-3 LC-PUFA, achieved by blending commercially available oils (FO, rapeseed oil and palm oil), on the biochemical composition of body compartments, and fatty acid compositions and gene expression in the liver and mid-intestine of a marine teleost, the gilthead seabream (Sparus aurata). The liver being a key metabolic tissue in vertebrate metabolism and the mid-intestine being a primary site of nutrient absorption and processing.
Methods
Fish husbandry and diets
The nutritional trial was carried out at the BioMar Feed Trial Unit between April and August 2014. Seabream juveniles of approximately 3 g were purchased from a commercial hatchery (Les Poissons du Soleil) and randomly distributed among 18×1 m3 tanks. The tanks were part of a Recirculation Aquaculture System with photoperiod, temperature and salinity maintained at 12 h light–12 h dark, 24°C and 32 parts per million, respectively. Initially, the fish were fed with commercial fry feeds rich in FM and FO until they reached approximately 24 g. After acclimation, each tank was assigned one of six iso-energetic and iso-nitrogenous diets for 18 weeks, initially as a 3-mm pellet (8 weeks) and then with a 4·5-mm pellet to the end of the trial. Fish were fed to satiation twice per day using automatic feeders and waste feed was collected to accurately measure feed consumption. The six diets were formulated to deliver specific levels of LC-PUFA by progressively replacing FO with blends of rapeseed and palm oil, whereas the other dietary ingredients were selected to meet the known nutrient requirements of seabream( Reference Teles, Lupatsch and Nengas 26 ) (Table 1). Diets were produced by extrusion at the BioMar Tech-Centre. The experimental diets were numbered to reflect the VO/FO inclusion so that diet D1 contained the VO blend as sole exogenously added oil source, diet D6 contained only FO, and diets D2–D5 contained graded levels of VO and FO as described in Table 1. The fatty acids that increased with dietary FO were: 16 : 1n-7, 24 : 1n-9, 20 : 3n-6, 20 : 4n-6, 20 : 4n-3, 20 : 5n-3, 22 : 5n-3 and 22 : 6n-3, whereas 20 : 0, 22 : 0, 18 : 1n-9, 18 : 2n-6 and 18 : 3n-3 increased with dietary VO (Table 2).
Diet formulations and proximate analyses of the six experimental diets
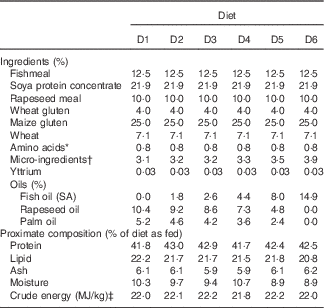
* Lysine and methionine.
† Vitamin and mineral premix, monocalcium-phosphate, cholesterol, Emulthin G35, antioxidants
‡ Estimated by using the mean values of gross energy for proteins, lipids and carbohydrates 23·6, 39·5 and 17·2 kJ/g, respectively( 15 )
Fatty acid composition of the experimental diets (D1–D6) given as percentage of total fatty acidsFootnote *
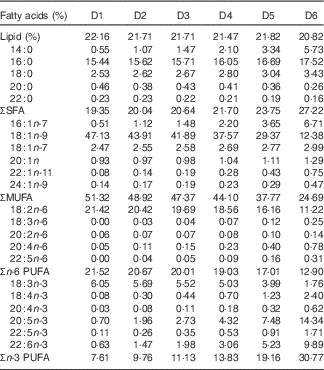
* Trace (<0·05) fatty acids have been removed.
Experimental animals were maintained under the current European legislation on handling experimental animals. In addition, all research performed by the Institute of Aquaculture, University of Stirling (UoS) is subject to thorough ethical review carried out by the UoS Animal Welfare and Ethical Review Board (AWERB) before any work being approved. This involves all projects, irrespective of where they are carried out, to be submitted to AWERB for approval using detailed Ethical Approval forms that require all aspects of the experimentation to be described including all animal health and welfare issues as well as other ethical considerations. The present research was assessed by the UoS AWERB and passed the ethical review process of the University of Stirling.
Sampling
Fish were sampled at the initiation of the trial and at termination after being euthanised with a lethal dose of benzocaine (Centrovet, Kalagin). Fish were not fed the day before sampling. Five whole fish and three eviscerated carcasses, liver and viscera (the entire contents of the body cavity minus the liver) were sampled from each tank for compositional analysis. Three fish per tank were also sampled for gene expression and fatty acid composition taking samples of liver and mid-intestine. Samples for RNA analysis were incubated with 1 ml RNAlater ® at 4°C for 24 h (Sigma-Aldrich) before storage at −70°C, whereas samples for fatty acid analysis were immediately frozen and stored at −20°C before shipment on dry ice to the Institute of Aquaculture, University of Stirling.
Proximate composition
Feed samples were ground before analyses. Whole fish, carcass and viscera samples were homogenised in a blender (Waring Laboratory Science) to produce pates. Proximate compositions of feeds and fish were determined according to standard procedures( Reference Horwitz 27 ). Moisture contents were obtained after drying in an oven at 110°C for 24 h and ash content determined after incineration at 600°C for 16 h. Crude protein content was measured by determining nitrogen content (N×6·25) using automated Kjeldahl analysis (Tecator Kjeltec Auto 1030 analyser; Foss) and total lipid content determined as described below.
Lipid extraction
Total lipid for fatty acid analyses was extracted from seabream tissues according to Folch et al. ( Reference Folch, Lees and Sloane Stanley 28 ). In brief, liver and mid-intestine samples (approximately 0·5 g) were homogenised in 20 ml chloroform–methanol (2:1, v/v) and incubated for 1 h on ice. Subsequently, 5 ml of 0·88 % KCl (w/v) was added, samples were vortexed and centrifuged at 400 g to separate organic and aqueous fractions. The aqueous fraction was discarded and the organic layer (infranatant) was then filtered (Whatman No. 1) and solvent evaporated under a stream of O2-free N2. After desiccation in vaccuo overnight, lipid content was determined gravimetrically. Total lipid samples were stored at 10 mg/ml in chloroform–methanol (2:1, v/v) containing 0·01 % (w/v) butylated hydroxytoluene as antioxidant.
Fatty acid analysis
Fatty acids were quantified by GLC after preparation of fatty acid methyl esters (FAME) by acid-catalysed transesterification of total lipid( Reference Christie 29 ). In brief, 1 mg of total lipid and 0·1 mg of heptadecanoic acid (17:0) as internal standard were incubated with 1 ml toluene and 2 ml 1 % sulphuric acid in methanol (v/v) for 16 h at 50°C. FAME were extracted and purified by TLC as described by Tocher & Harvie( Reference Tocher and Harvie 30 ) and resuspended in isohexane before GC analysis using a Fisons GC-8160 (Thermo Scientific) equipped with a 30 m×0·32 mm internal diameter×0·25 μm ZB-wax column (Phenomenex), on-column injector and a flame ionisation detector. Data were collected and processed using Chromcard for Windows (version 2.01; Thermoquest Italia S.p.A.). FAME were identified by comparison to known standards (Supelco 37-FAME mix; Sigma-Aldrich Ltd) and published data( Reference Tocher and Harvie 30 ). Fatty acid contents were expressed as mg/g of tissue and estimated using the response of the internal standard. The CV estimated using mg DHA/g over a subset of twenty samples was 2·80 (sd 2·51) %.
RNA extraction
Total RNA was extracted from approximately 100 mg of liver and mid-intestine by homogenisation in 1 ml of TriReagent (Sigma-Aldrich) using a Mini-Beadbeater 24 (Biospec). Phase separation was achieved by the addition of 100 µl of 1-bromo-3-chloropropane (Sigma) and centrifugation at 20 000 g . Subsequently 400 µl of the supernatant were recovered and RNA precipitated by the addition of 200 µl isopropanol (Fisher) and 200 µl RNA precipitation solution (1·2 m sodium chloride and 0·8 m sodium citrate sesquihydrate) followed by centrifugation at 20 000 g . The resulting pellet was washed twice with 75 % ethanol, air-dried and resuspended in 50 µl nuclease-free water. The concentration and quality were verified spectrophotometrically (NanoDrop ND-1000 Spectrophotometer; Thermo Scientific) and by agarose gel electrophoresis to visualise the presence of 18S and 28S ribosomal subunits. Extracts were stored at −70°C until complementary DNA (cDNA) synthesis.
Complementary DNA synthesis
Reverse transcription was performed according to the kit manufacturer’s protocol (High Capacity Reverse Transcription kit; Applied Biosystems). A no template control reaction and RT-free reactions were prepared as blank and negative controls. Each 20 µl reaction included: 10× reverse transcription buffer (2 µl), 100 mm deoxyribonucleotide triphosphate (dNTP) mix (0·8 µl), 10 µm random primers (1·5 µl), 10 µm oligo dT primers (0·5 µl), RT (1·0 µl), 2 µg of total RNA as template and nuclease-free water to make up the volume. RNA was denatured at 95°C for 10 min before addition of master mix containing all other reagents. Reverse transcription was performed on a Biometra Thermocycler (Analytik Jena) using the following programme: 25°C for 10 min, 37°C for 120 min, 85°C for 5 min and then terminated at 4°C. A pool of cDNA samples was created for serial dilutions, calibrator samples and primer validations. Samples of cDNA were diluted 20-fold with nuclease-free water as template for quantitative real time PCR (qPCR), and stored at −20°C.
Gene expression analysis
Gene expression was determined for candidate genes involved in key pathways by qPCR. Primers for qPCR were designed using Primer3 through the NCBI database’s ‘Primer-BLAST’ against known gene sequences including sequences from the S. aurata expressed sequence tag NCBI database that were confirmed to be the gene of interest by BLAST searches. Primer sequences for genes in the present study are given in Table 3. Primers were tested to confirm that they functioned optimally at annealing temperatures of 60°C and that a single amplicon of appropriate length was visualised on agarose gel. A serial dilution of the cDNA pool was analysed by qPCR (Luminaris Color HiGreen qPCR Master Mix; Thermo Scientific) to determine primer efficiency (rejected at <1·85). Duplicated qPCR reactions were carried out on 96-well plates, each reaction contained: Luminaris Color HiGreen (10 µl), 10 µm primers (1 µl each), 1/20 diluted cDNA sample (5 and 2 µl for target and reference genes, respectively) and nuclease-free water up to 20 µl. As there were fifty-four samples per tissue (six treatments, n 9) two plates were run per gene with treatments equally represented on both plates, a 1/20 dilution of the cDNA pool was used as a calibrator and a serial dilution included on one plate. A single master mix was used for all the reactions required per gene and both plates were run consecutively on a Biometra TOptical Thermocycler (Analytik Jena). The thermocycling programme was 50°C for 2 min, 95°C for 10 min, thirty-five cycles of 95°C for 15 s (denaturation), 60°C for 30 s (annealing) and 72°C (extension) for 30 s, followed by a melting curve to check for non-specific products. Data were acquired through the software package qPCRsoft 3.1 (Analytik Jena) and calculations for sample expression ratios were carried out according to Pfaffl( Reference Pfaffl 31 ):
 $${\rm Expression}\,{\rm ratio}{\,\equals\,}{{E({\rm ref})^{{C_{t} ({\rm Sample)}}} } \over {E({\rm goi})^{{C_{t} ({\rm Sample)}}} }}{\div}{{E{\rm (ref)}^{{C_{t} {\rm (Calibrator)}}} } \over {E{\rm (goi)}^{{C_{t} {\rm (Calibrator)}}} }},$$
where E is the determined efficiency; ref the geometric mean of four reference genes, goi the gene of interest and C t the threshold cycle. The genes of interest were normalised to the geometric mean of four reference genes, elongation factor 1α (ef1α), β-actin, α-tubulin and ribosomal protein P0, whose expression was not influenced by dietary treatment. Gene expression data are presented as log2 expression ratios( Reference Hellemans and Vandesompelle 32 ) of genes related to lipid metabolism: srebp1, srebp2, pparα1, fas, fads2, cpt1α and fabp1 and elongation of very long-chain fatty acid 5 protein (elovl5). The average intra assay CV was 0·44 (sd 0·12) % at the level of quantification cycle (C q ).
Primer sequences used for gene expression analysis by quantitative RT PCR·Amplicon sizes (bp) and GenBank accession numbers also are provided
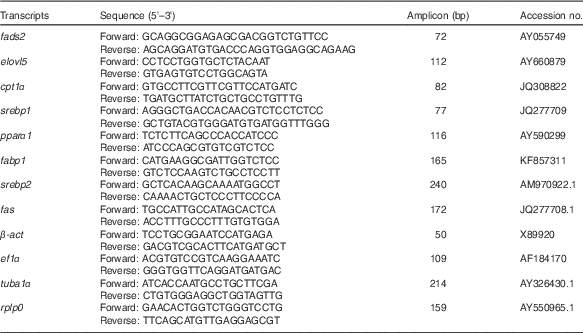
fads2, fatty acid desaturase 2; elovl5, elongation of very long-chain fatty acid 5 protein; cpt1α, carnitine palmitoyl transferase I; srebp1, sterol regulatory element-binding protein 1; fabp1, fatty acid binding protein; srebp2, sterol regulatory element-binding protein 2; fas, fatty acid synthase; β-act, β actin; ef1α, elongation factor 1α; tuba1, α-tubulin; rplp0, ribosomal protein P0.
Statistical analysis
Final weights, specific growth rate (SGR), proximate composition and tissue fatty acids were analysed by between groups ANOVA, rejecting null hypotheses at P<0·05. Absence of within treatment effects (i.e. tank effects) were first confirmed using tank as a nested variable in the ANOVA formula. F-tests were verified by Bartlett’s test and Shapiro–Wilk for variance homogeneity and distribution.
Three individuals from each tank (nine per treatment) were randomly sampled giving fifty-four fish in total, this is the minimum number of fish to detect medium effect sizes (f 2=0·15; power=0·8) by ordinary least squares regression. Proximate composition data were analysed using linear regression to identify the existence of trends across the experimental diets. Trends were reported as significant if the slope was significantly different (P<0·05) to 0. For fatty acid profiles of tissues (n 54) the first step of analysis was to reduce the dimensions of the data by principal component analysis (PCA), which enabled the identification of fatty acids that were correlated with each other and that should be analysed further. The level of dietary FO was supplied as a supplementary variable to PCA. Fatty acids with several no detects (effectively zero) were removed from the data set, because zero values are problematic with PCA analysis, and the C20 and C22 MUFA were combined into two single variables (20 : 1 and 22 : 1, respectively) as these peaks do not always separate in the GC analysis. Further analyses of selected fatty acids were performed using regression of the tissue fatty acid concentration as a function of the diet fatty acid concentration. Tissue fatty acid levels were regressed with absolute data (mg/g tissue). Where a range was reported, this was derived from the fitted values of the model applied to the data, not the mean values reported in the online Supplementary Tables. Where appropriate, percentage data (% of total fatty acids) were used to support the analyses. When a fatty acid did not have a dietary component it was regressed against dietary VO, for instance the fatty acid 18 : 2n-9, and the expression of genes. Analyses and plots were produced in the statistical package R( 33 ) (version 3.1.3). PCA were performed using the FactoMineR package( Reference Husson, Josse and Le 34 ) and regression diagnostics using the Car package( Reference Fox, Weisberg and Adler 35 ).
Results
Growth rates and proximate composition of gilthead seabream
After feeding the experiment diets for 18 weeks mean weights ranged between 200 and 250 g and SGR between 1·64 and 1·81, with significant differences (P<0·001) between dietary groups that showed increasing the dietary VO content beyond the level of that in diet D4 led to reduced growth (Table 4).
Final weights and specific growth rates of Sparus aurata after 18 weeks feeding on diets (D1–D6) (Mean values and standard deviations)
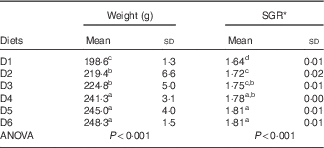
a,b,c,d Mean values with unlike superscript letters were significantly different between group differences by ANOVA.
* SGR=(ln final weight−ln initial weight)/d×100.
Significant effects of diet on proximate compositions of gilthead seabream were observed in liver, mid-intestine and viscera. In liver and mid-intestine, total lipid contents increased from 18·6 to 31·8 % diet (R 2=67·8, P<0·001) and 8·6 to 13·9 % (R 2=23·9, P<0·001), respectively, as dietary VO increased from 0 to 15·6 % of diet. In viscera (minus liver), total lipid content decreased from 53·5 to 45·2 % (R 2=24·0, P<0·001) as dietary VO increased in the diet. The lipid contents of whole fish and carcass were unaffected by dietary treatment (P>0·05). Protein and ash contents were not affected in any body compartment examined in the present study (P>0·05). A summary of these data is presented in the online Supplementary Table S1.
Fatty acid composition of liver and mid-intestine
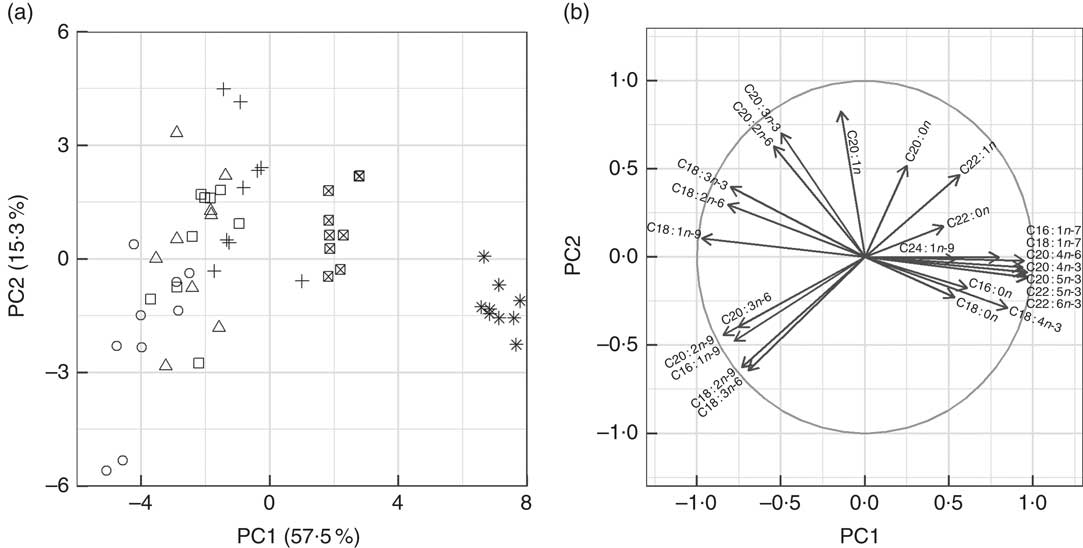
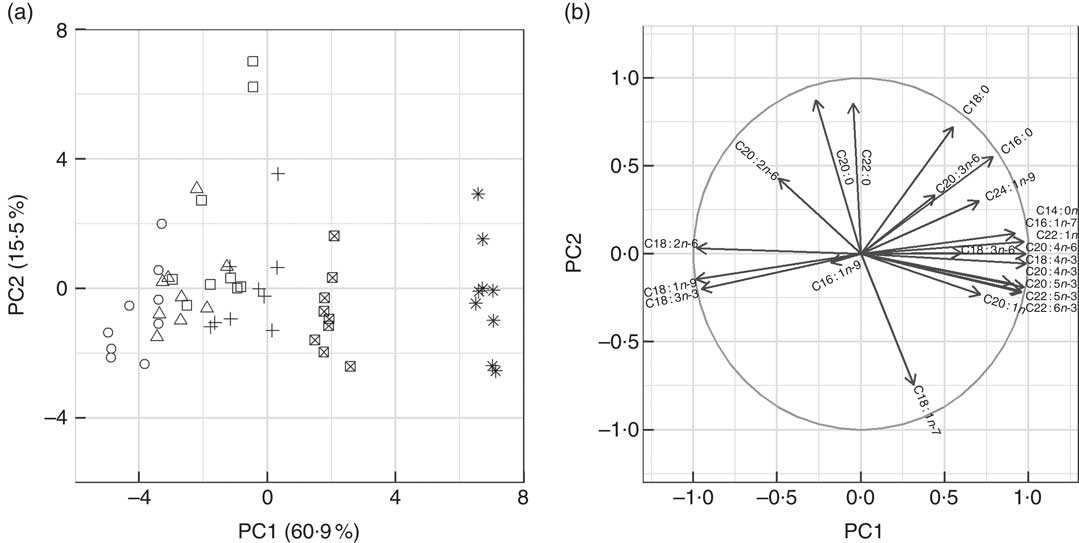
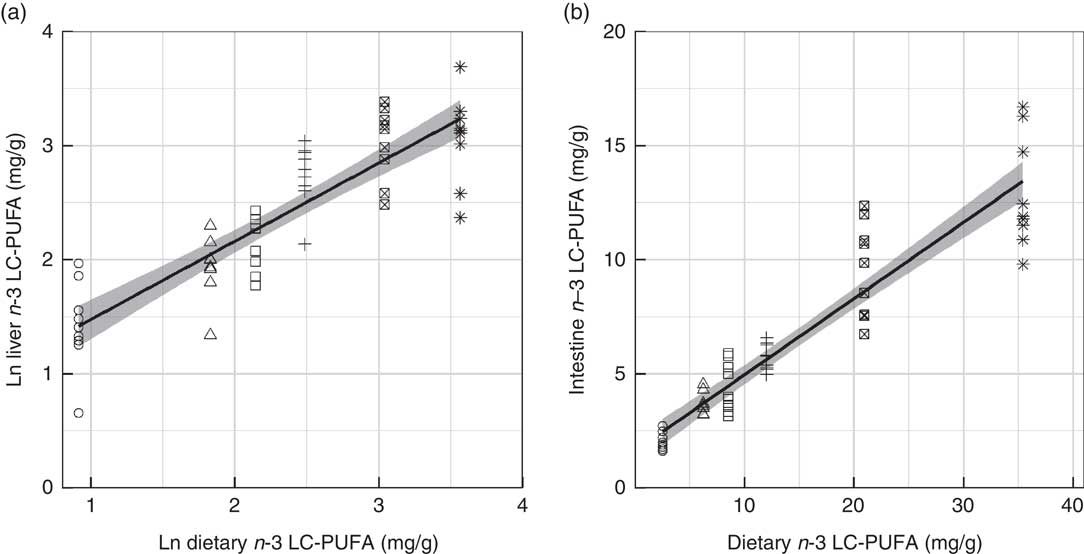
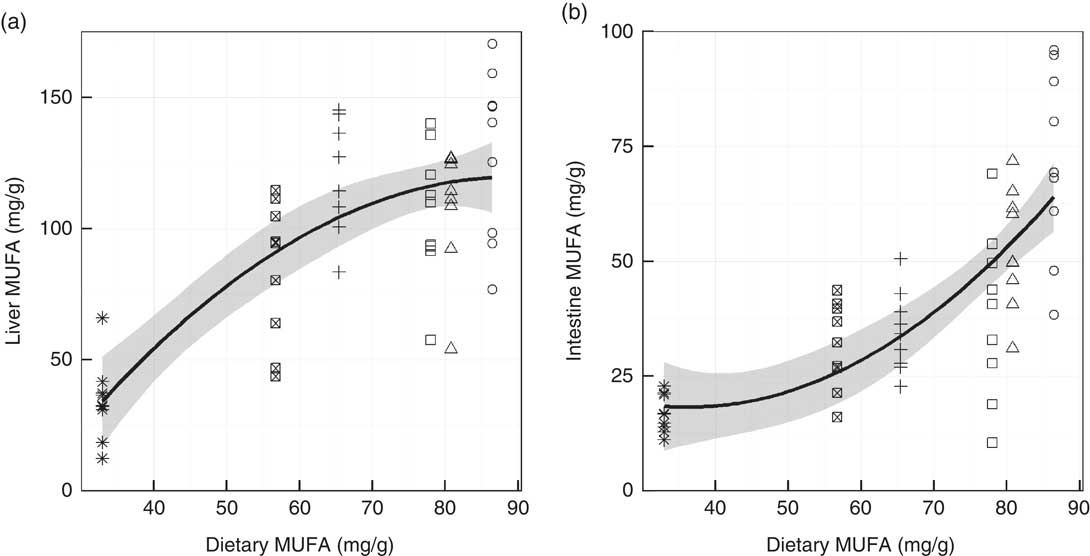
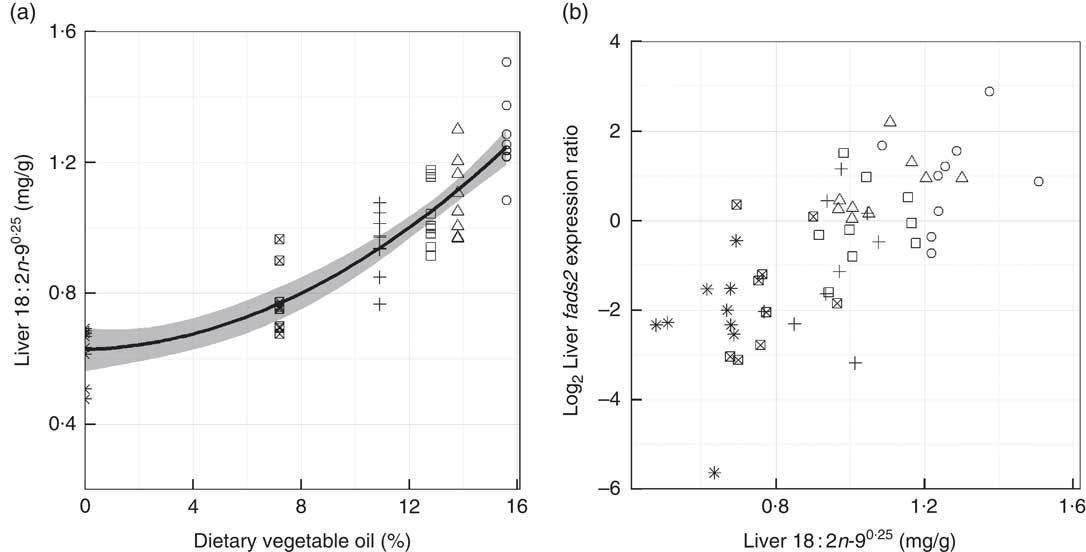
Fatty acid profiles of total lipid of two major lipid metabolic sites, namely liver and mid-intestine, were determined and further analysed by PCA. In both the liver and mid-intestine the first principal component (PC1) was correlated to dietary FO and explained 57·5 and 60·1 % of the variance in fatty acid compositions, respectively (Fig. 1 and 2). The fatty acids associated with FO, namely 14 : 0, 16 : 1n-7, 20 : 4n-3, 20 : 5n-3, 22 : 5n-3 and 22 : 6n-3, had positive correlations to PC1, and those associated with VO, specifically 18 : 1n-9, 18 : 2n-6 and 18 : 3n-3, a negative correlation to PC1 in liver and mid-intestine Thus, PC1 separated the fatty acid profiles according to diet, D1 had low values and D6 had high values for PC1. PC2 accounted for 15·3 and 15·5 % of the variance in liver and mid-intestine fatty acid profiles, respectively. The contributions of the fatty acids towards PC2, which separated the profiles vertically in Fig. 1 and 2, differed between liver and mid-intestine. In liver, 20 : 2n-6 and 20 : 1 had a positive influence on PC2, and 18 : 2n-9, 20 : 2n-9, 18 : 3n-6, 20 : 3n-6 a negative influence, with these fatty acids thus being important to separate individual fatty acid profiles once the variability due to PC1 (diet) had been accounted for. In the case of mid-intestine samples, 18 : 0, 20 : 0 and 22 : 0 had a positive influence, and 18 : 1n-7 a negative influence on PC2 while 18 : 2n-9 and 20 : 2n-9 were not detected, again it can be interpreted that these are the fatty acids that vary the most between individual fatty acid profiles once the effect of PC1 had been removed. It was also apparent from biplots that there was considerable overlap between the fatty acid profiles of liver and mid-intestine of fish consuming diets D1–D4, although fatty acid profiles from individuals fed on diets containing the highest inclusion levels of FO (D5 and D6) formed clearly separated groups (Fig. 1(a) and 2(a)). PCA indicated that the n-3 LC-PUFA (20 : 3n-3, 20 : 4n-3, EPA, DPA and DHA) were all correlated with each other in both liver and mid-intestine and therefore these fatty acids were summed as a single variable reflecting their origin from FO. Absolute levels of tissue n-3 LC-PUFA were strongly related to dietary n-3 LC-PUFA in liver (R 2=0·75, P<0·001) and mid-intestine (R 2=0·87, P<0·001) (Fig. 3). Absolute levels of MUFA responded positively to dietary MUFA in liver (R 2=0·57, P<0·001) and mid-intestine (R 2=0·76, P<0·001) (Fig. 4). Contents of MUFA in liver were typically 75–175 mg/g in fish fed diets D1–D4, and <50 mg/g in fish consuming the FO diet (D6). High variability is evident in MUFA levels with the major contributing factor being variation in the total lipid content of the tissues. Two fatty acids, namely 18 : 2n-9 and 20 : 2n-9, were identified in liver in spite of their absence in diets and mid-intestine, so they were plotted against dietary VO. Levels of 18 : 2n-9 increased with the dietary VO (R 2=0·81, P<0·001) (Fig. 5(a)). The level of 18 : 2n-9 was correlated (R 2=0·41, r 0·64, P<0·001) to the log2 expression of fads2 (Fig. 5(b)), the latter data requiring to be transformed to satisfy the assumptions of Pearson’s correlation. Dietary levels of saturates were relatively stable across the experimental diets (32–36 g/kg). Despite this low range, livers of fish fed diet D1 (VO rich) contained 50–70 mg/g saturates and those of fish fed diet D6 (FO rich) ranged between 10 and 40 mg/g, and there was a significant relationship with dietary saturates (R 2=0·27, P<0·001) (data not shown). Examination of percentage data indicated that absolute levels of saturates was mainly associated with the increasing lipid level of the liver, lower levels of saturates were observed in the mid-intestine (15–35 mg/g). Quantitatively, palmitic acid was the dominant SFA in both tissues and only 14 : 0 increased with dietary FO. Liver and mid-intestine fatty acid data are summarised in the online Supplementary Tables S2 and S3, respectively, where they are analysed by ANOVA, with the results being in agreement with those reported above.
Graphical representation of principal components analysis (PCA) of fatty acid profiles from liver (n 54) of fish fed experimental diets (D1–D6). The two panels are complimentary to one another. (a) Biplot of the first two principal components (PC1 and PC2) of gilthead seabream liver fatty acid profiles. The fatty acid profiles of fish consuming diets D5 and D6 formed succinct groups to the right of the plot and they were well defined by PC1. The fatty acid profiles of fish consuming diets D1–D4 were negatively correlated to PC1 and there was considerable overlap (variability) between the dietary treatments. PC2 accounted for 15·3 % of the total variance and was important to distinguish individual liver fatty acid profiles of fish consuming diets D1–D3. (b) Variables (fatty acids) used to construct the principal components. The circle in this plot is the correlation circle, the stronger the correlation of a fatty acid to PC1 and, or PC2 the closer its arrowhead to the circle. Arrowheads that do not approach the circle are not well represented by PC1 and PC2 (e.g. 22 : 0). The arrows indicate how the fatty acids contributed to the formation of PC1 and PC2 and thus the formation of (a). Several points can be made to describe the data, the fatty acids derived from fish oil (e.g. 22 : 6n-3) were strongly correlated to PC1, the main fatty acids from vegetable oil (e.g. 18 : 1n-9) were negatively correlated to PC1. Several fatty acids were best explained by a combination of PC1 and PC2, including 18 : 2n-9 and 20 : 2n-9, and it can be said that these fatty acids are important to distinguish liver fatty acid profiles from fish consuming diets D1–D4. ○, D1; △, D2; □, D3; +, D4; ⊠, D5; ![]() , D6.
, D6.
Graphical representation of principal components analysis (PCA) of fatty acid profiles from mid-intestine (n 54) of fish fed experimental diets (D1–D6). The two panels are complimentary to one another. (a) Biplot of the first two principal components (PC1 and PC2) of seabream mid-intestine fatty acid profiles. The fatty acid profiles of fish consuming diets D5 and D6 formed succinct groups to the right of the plot. The fatty acid profiles of fish consuming diets D1–D3 were negatively correlated to PC1 and there was considerable overlap in the points. PC2 separated the fatty acid profiles vertically and explained 15·5 % of the variance, two outliers appeared in D3 and these samples contained unusually high levels 20 : 0 and 22 : 0 and, other than these samples, the variance was quite evenly distributed amongst the diets when compared with liver. (b) Variables (fatty acids) used to construct the principal components. The circle in this plot is the correlation circle, the stronger the correlation of a fatty acid to PC1 and, or PC2 the closer its arrowhead to the circle. Arrowheads that do not approach the circle were not well represented by PC1 and PC2 (e.g. 16:1n-9). The arrows indicate how the fatty acids contributed to the formation of PC1 and PC2 and thus the formation of plot A. ○, D1; △, D2; □, D3; +, D4; ⊠+ D5; ![]() , D6.
, D6.
Levels of n-3 long-chain (≥C20) PUFA (LC-PUFA) in gilthead seabream liver (a) and mid-intestine (b) against the dietary levels of n-3 LC-PUFA. The natural logarithm (ln) transformation applied to the data in (a) indicates that in liver this relationship was not linear. Both models were linear ordinary least squares fits with the standard error shaded in grey (n 54). ○, Diet 1; △, Diet 2; □, Diet 3; +, Diet 4; ⊠, Diet 5; ![]() , Diet 6.
, Diet 6.
Levels of MUFA in gilthead seabream liver (a) and mid-intestine (b) against the dietary levels of MUFA. Both are quadratic ordinary least squares fits with the standard error shaded in grey (n 54). ○, Diet 1; △, Diet 2; □, Diet 3; +, Diet 4; ⊠, Diet 5; ![]() , Diet 6.
, Diet 6.
Levels of 18 : 2n-90·25, which is not present in the diets, in gilthead seabream liver against dietary vegetable oil (a), and the level of fatty acid desaturase 2 (fads2) expression correlated (r 0·64; P<0·001) with the levels of 18 : 2n-90·25 in liver (b). The model applied in A is a quadratic ordinary least squares fit with the standard error shaded in grey (n 54). The transformation (x
0·25) is applied to the 18 : 2n-9 data. ○, Diet 1; △, Diet 2; □, Diet 3; +, Diet 4; ⊠, Diet 5; ![]() , Diet 6.
, Diet 6.
Gene expression
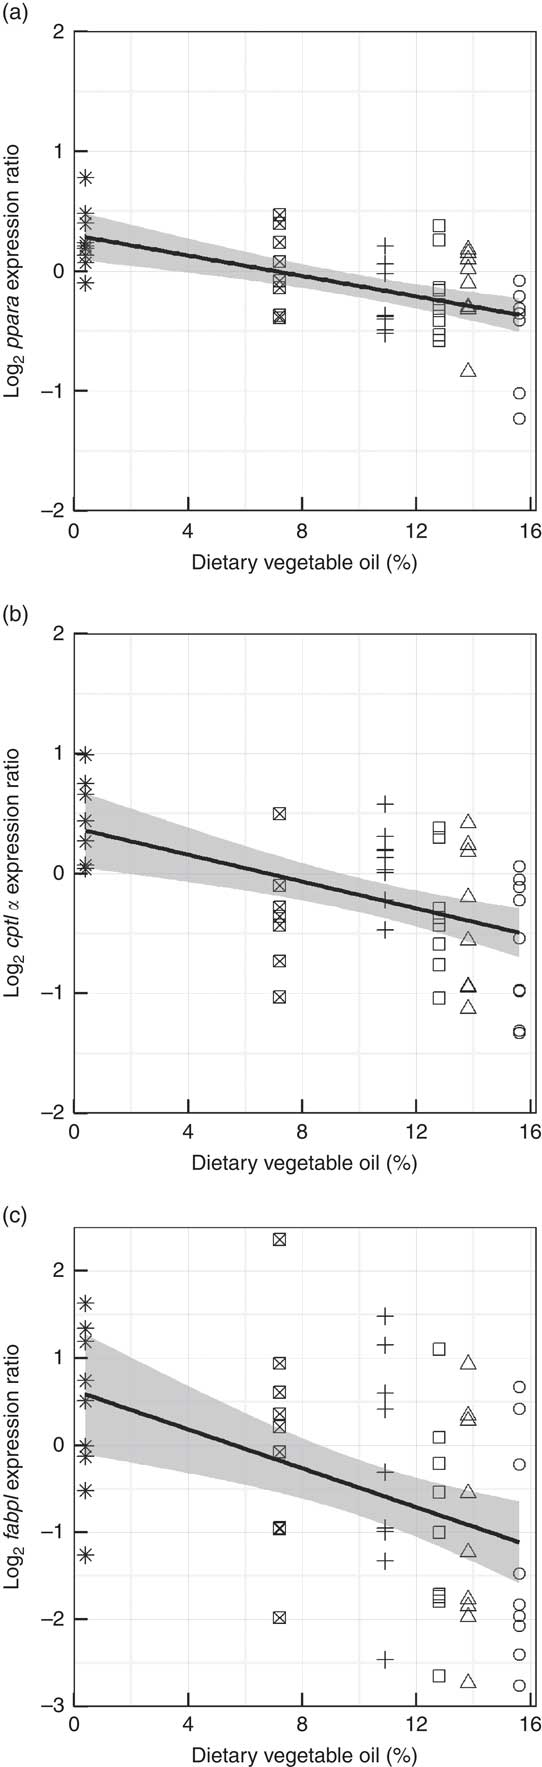
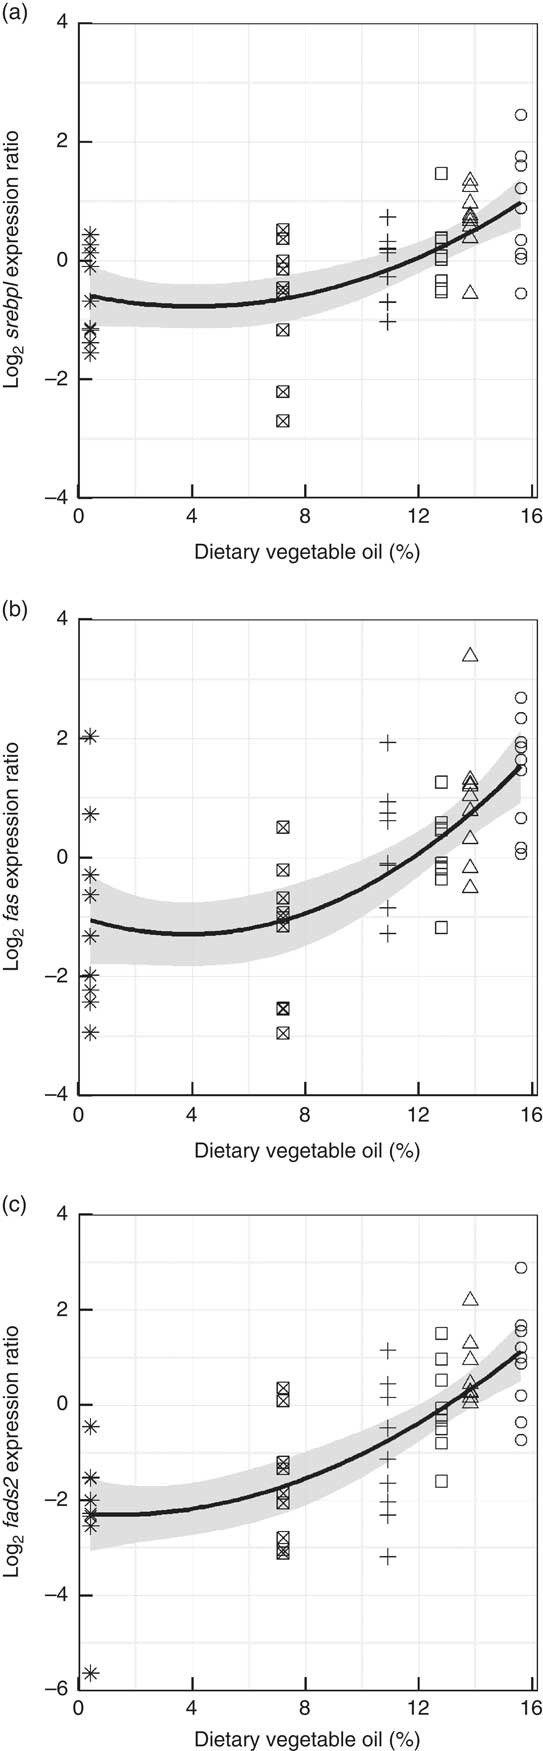
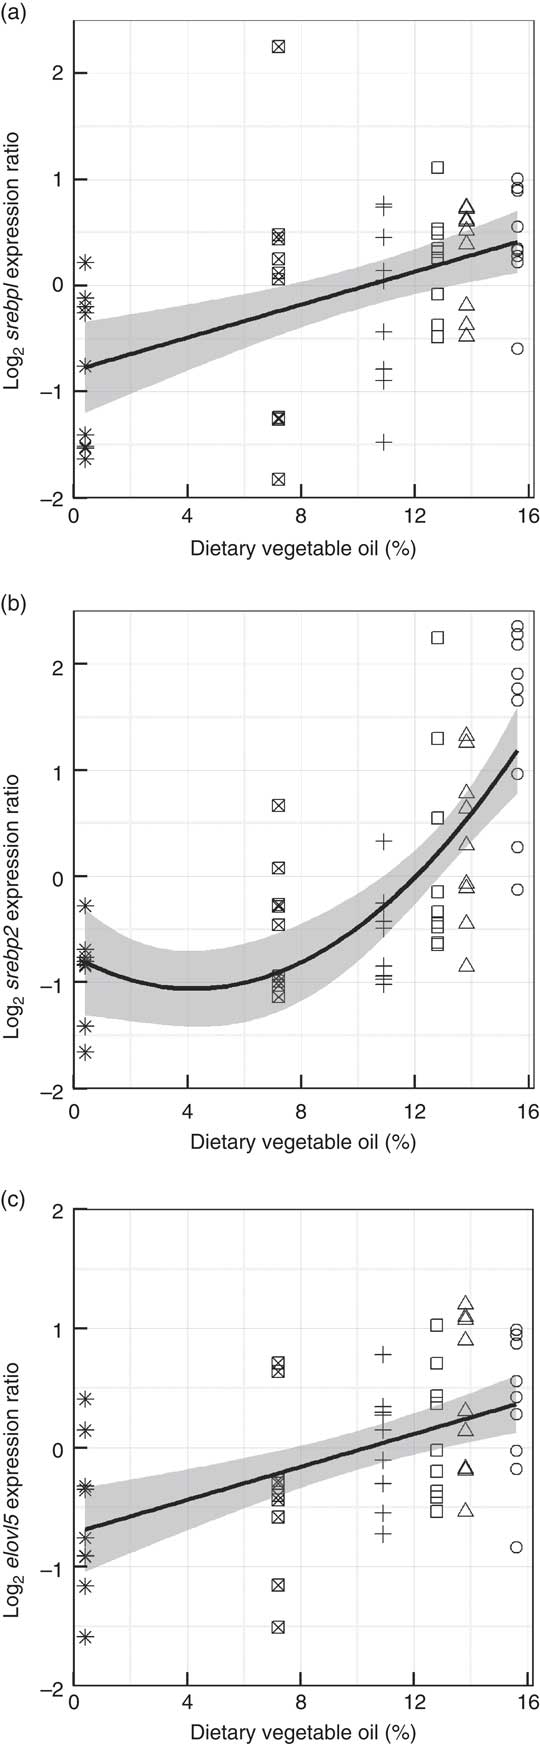
Genes representing lipid metabolic pathways were assayed by qPCR, and the expression of target genes plotted against dietary VO and, although variability (R 2=19–52 %), between individuals was high, significant trends showed that the diets had an impact on the regulation of lipid metabolism. Subtle, negative trends were found in the liver between dietary VO and the expression of pparα1 (R 2=0·32, P<0·001) and its target genes cpt1α (R 2=0·26, P<0·001) and fabp1 (R 2=0·19, P<0·001) (Fig. 6). The highly variable within treatment data indicated that diet is not the sole source of this variation in the expression of these genes. The level of variation in the mid-intestine prevented the application of suitable models to the data. In the liver, positive trends, fitted with quadratic functions were found between VO and srebp1 (R 2=0·37, P<0·001) and its target genes fas (R 2=0·42, P<0·001) and fads2 (R 2=0·52, P<0·001) (Fig. 7). Effects of VO on the expression of srebp2 and elovl5 in liver were not detected (data not shown). However, in mid-intestine, the effect on srebp1 expression was not as strong and linear (R 2=0·23, P<0·001), but srebp2 showed a strong up-regulation in fish fed diets D1 and D2 (R 2=0·49, P<0·001) and elovl5 was responsive to dietary VO (R 2=0·26, P<0·001) (Fig. 8). Effects of VO on the expression of fads2 were not detected in mid-intestine (data not shown).
Hepatic gene expression of ppara1 (a), carnitine palmitoyl transferase I (cpt1α) (b) and fatty acid binding protein (fabp1) (c) against dietary vegetable oil. Data are log2 (expression ratios) normalised to four reference genes and then to the calibrator sample. Fitted lines are linear functions with the standard error highlighted in grey (n 54). ○, Diet 1; △, Diet 2; □, Diet 3; +, Diet 4; ⊠, Diet 5; ![]() , Diet 6.
, Diet 6.
Hepatic gene expression of sterol regulatory element-binding protein 1 (srebp1) (a), fatty acid synthase (fas) (b) and fatty acid desaturase 2 (fads2) (c) against dietary vegetable oil. Data are log2 (expression ratio) normalised to four reference genes and then to the calibrator sample. Fitted lines are second order quadratic functions with the standard error highlighted in grey (n 54). The similarity between the responses is striking. ○, Diet 1; △, Diet 2; □, Diet 3; +, Diet 4; ⊠, Diet 5; ![]() , Diet 6.
, Diet 6.
Mid-intestine gene expression of sterol regulatory element-binding protein 1 (srebp1) (a), srebp2 (b) and elongation of very long-chain fatty acid 5 protein (elovl5) (c) against dietary vegetable oil. Data are log2 (expression ratio) normalised to four reference genes and then to the calibrator sample. Fitted lines are linear fits for srebp1 and elovl5 and a second order quadratic function is fitted to srebp2. The model standard errors are highlighted in grey (n 54). ○, Diet 1; △, Diet 2; □, Diet 3; +, Diet 4; ⊠, Diet 5; ![]() , Diet 6.
, Diet 6.
Discussion
Replacement of FO by alternative oils in aquafeeds has been an extensively investigated research topic over the last two decades( Reference Turchini, Ng and Tocher 16 ). The most common FO alternatives are VOs, for example rapeseed oil or soyabean oil, which are devoid of essential LC-PUFA and, consequently, their use has important implications, not only on the nutritional value of the product for consumers( Reference Henriques, Dick and Tocher 36 – Reference Shepherd, Monroig and Tocher 38 ), but also effects on metabolism and fish health( Reference Glencross 1 ). We employed a dietary gradient of VO to span the EFA requirements reported for a commercially relevant teleost, the gilthead seabream( Reference Teles, Lupatsch and Nengas 26 ) and show how this gradient modifies the composition and the expression of lipid metabolic and regulatory genes in gilthead seabream juveniles.
Fish consuming diets D4–D6 (LC-PUFA: 1·20–3·54 % of diet) gained significantly more weight than the other dietary groups, a likely result that these diets were supplied EPA and DHA in excess of the nutrient requirement. The results of the present study show that dietary provision of n-3 LC-PUFA below the reported EFA requirement, 0·9 % EPA+DHA dry weight, for gilthead seabream( 15 ) led to alterations in lipid metabolism as indicated by increased lipid content in liver and decreased lipid in viscera, the latter being regarded as the normal lipid storage site in this species( Reference McClelland, Weber and Zwingelstein 39 ). These results were in agreement with previous studies regarding increased hepatic lipid content as a result of dietary deficiency of EPA and DHA in gilthead seabream( Reference Kalogeropoulos, Alexis and Henderson 13 , Reference Caballero, Izquierdo and Kjørsvik 17 , Reference Ibeas, Cejas and Gómez 40 ) and other fish species( Reference Glencross 1 , Reference Tocher, Bell and MacGlaughlin 41 ). Interestingly, increased lipid contents in liver have been also described when dietary lipid was increased to boost the energy content of the diet( Reference Vergara, López-Calero and Robaina 42 ). The range of values for hepatic total lipid was 17–32 % (wet wt) and these were higher than those reported previously, 15–25 % (wet wt), in gilthead seabream fed graded levels of soyabean oil( Reference Kalogeropoulos, Alexis and Henderson 13 ). This may be due to the larger size of the fish in the present trial (24–230 g) whereas the previous study used fry (1·2–12·4 g), the longer feeding period of 4 months in the present study, or the higher crude lipid levels in the diets. In the previous study there was a threshold level of soyabean oil (approximately 50 % of oil) that increased hepatic lipid content whereas data in the present study suggested VO increased hepatic lipid in a concentration-dependant manner (linear increase).
Quantitatively, the main fatty acids driving the increased liver lipid were 18 : 1n-9 (oleic acid), 18 : 2n-6 (linoleic acid) and 18 : 3n-3 (α-linolenic acid), all major constituents of the VO used in the experimental diets. Such accumulation of dietary fatty acids observed in liver, occurring as well in mid-intestine, has been commonly reported in FO replacement studies in gilthead seabream( Reference Benedito-Palos, Navarro and Sitjà-Bobadilla 12 , Reference Kalogeropoulos, Alexis and Henderson 13 , Reference Montero, Robaina and Socorro 43 ). Interestingly, two fatty acids, namely 18 : 2n-9 and 20 : 2n-9, were found in the liver, but not mid-intestine, of fish fed VO that were not present in the diets. The presence of 18 : 2n-9 is likely to be the result of ∆6 desaturation of 18 : 1n-9, with 20 : 2n-9 being the elongation product of 18 : 2n-9. Fads2 is typically a ∆6 desaturase in marine teleosts( Reference Castro, Corraze and Basto 23 ) and, although its activity towards 18 : 1n-9 has not been demonstrated in gilthead seabream( Reference Zheng, Seiliez and Hastings 44 ), it is likely that Fads2 activity was responsible for observed production of 18 : 2n-9 in liver. Additional data in the form of enzyme protein levels or activity assays could lend support to this conclusion. Indeed, this is consistent with increased expression of fads2 in liver of fish fed high VO diets and n-3 LC-PUFA deficient diets, a regulatory mechanism often reported in literature not only on desaturases, as observed herein, but also elongases such as elovl5 ( Reference Jin, Lu and Yuan 19 ). Interestingly, an up-regulation of hepatic elovl5 was not observed, that would support the production of 20 : 2n-9 mentioned above. Instead, a moderate but detectable increase in elovl5 expression was observed in the mid-intestine with dietary VO, in agreement with previous studies on seabream( Reference Castro, Tocher and Monroig 45 ), and it is likely that this decrease is a response to declining availability of n-3 LC-PUFA. Hepatic fads2 expression was variable between individual fish fed diets with high VO inclusion (D1–D4). The PCA analysis showed that this was also the case for the fatty acid profiles of fish consuming these diets and that 18 : 2n-9 and 20 : 2n-9 were important fatty acids in driving this variability. Furthermore, the level of 18 : 2n-9 was strongly correlated to the level of fads2 transcripts in the liver. It may be possible to exploit this individual variability in response to VO to select seabream that are better adapted to diets that are rich in VO, as has been described previously in Atlantic salmon( Reference Morais, Pratoomyot and Taggart 18 ). The fatty acids, 18 : 2n-9 and 20 : 2n-9, are metabolites of 18 : 1n-9 derived from its metabolism via the LC-PUFA biosynthesis pathway. Marine fish are able to perform the first two steps, ∆6 desaturation (fads2) and elovl5, but are unable to perform the subsequent step of the pathway due to the absence of an active ∆5 desaturase( Reference Castro, Monroig and Leaver 46 ). The above result shows that the ∆6 in seabream can operate on 18 : 1n9.
In addition to the distinctive patterns of fads2 and elovl5 expression described above, the regulatory mechanisms by which dietary fatty acids modulate metabolic responses in liver and mid-intestine appear to differ. In liver, srebp1, but not srebp2, was increased in gilthead seabream fed diets D1–D3, with a threshold between diets D3 and D4, interestingly this at the point where effects on growth were also observed. In mid-intestine, both srebp1 and srebp2 expression were increased with dietary VO. Srebp signalling is responsible for maintaining lipid levels in balance and, although there is some overlap between the functions of Srebp1 and Srebp2, the former is mainly associated with fatty acid/lipid synthesis, whereas the latter is associated with cholesterol synthesis in mammals( Reference Daemen, Kutmon and Evelo 22 , Reference Pai, Guryev and Brown 47 , Reference Amemiya-Kudo, Shimano and Hasty 48 ) and fish( Reference Carmona-Antoñanzas, Tocher and Martinez-Rubio 49 ). While the up-regulation of srebp1 has been often associated with increased expression of fads2 in response to VO-rich diets( Reference Morais, Pratoomyot and Taggart 18 , Reference Jin, Lu and Yuan 19 , Reference Glencross, De Santis and Bicskei 50 ), the up-regulation of srebp2 in mid-intestine suggested putative activation of cholesterol biosynthesis. Cholesterol was added to the experimental diets to balance the supply of this key nutrient, but VO are known to contain a range of phytosterols that may have stimulated up-regulation in the mid-intestine( Reference Leaver, Villeneuve and Obach 25 , Reference Morais, Pratoomyot and Torstensen 51 – Reference Tocher, Bendiksen and Campbell 53 ).
The fas gene is also regulated by Srebp1( Reference Daemen, Kutmon and Evelo 22 ) and its product, Fas, is an enzyme complex responsible for de novo synthesis of SFA( Reference Smith 54 , Reference Chirala and Wakil 55 ). Despite the inclusion of 20 % lipid in the diets, the inclusion of VO resulted in up-regulation of fas in liver. There have been reports of VO increasing fas expression in Atlantic salmon( Reference Morais, Pratoomyot and Taggart 18 ) and black seabream( Reference Jin, Lu and Yuan 19 ). Nevertheless, this is not always supported by measurements of Fas activity in gilthead seabream fed diets with 80 % of dietary FO replaced with linseed oil( Reference Menoyo, Izquierdo and Robaina 20 ) however, in turbot (Scophthalmus maximus), Fas activity was stimulated by dietary VO although the differences were NS( Reference Regost, Arzel and Robin 56 ). It is unclear what exactly is responsible for the apparent discrepancy between these results. However, the increased expression of srebp1 in response to dietary VO, particularly notable in liver, suggested increased regulatory activity of Srebp1 towards potential target genes including fas and thus increasing their transcription. The patterns of dietary regulation of srebp1 and fas share a similar shape in liver (modelled by quadratic functions) suggesting co-regulation. Their up-regulation in response to dietary VO indicated that de novo lipogenesis may contribute to increased lipid deposition, as suggested previously by Morais et al. ( Reference Morais, Pratoomyot and Taggart 18 ) when studying diet/genotype interactions in Atlantic salmon.
Beyond the anabolic processes described above, the impact of dietary VO was further evidenced in lipid catabolic processes such as β-oxidation. Generally, the expression of catabolic genes (pparα1 and cpt1α) in liver and, to some extent, in mid-intestine, decreased with increasing dietary VO mid-intestine. The data were variable as illustrated by low R 2 values, indicating that the diet was not the sole source of variation in the expression of these genes. The reduction in catabolic gene expression is coherent with the observed increased hepatic lipid levels associated with dietary VO. Furthermore, the results were consistent with previous studies in rats( Reference Harris and Bulchandani 57 , Reference Shearer, Savinova and Harris 58 ) and Atlantic salmon( Reference Morais, Pratoomyot and Taggart 18 ) that revealed that dietary FO increased the expression of pparα and the activity of β-oxidation enzymes. In contrast, a recent study demonstrated expression of pparα1 and its target cpt1α were increased in liver of gilthead seabream fed diet containing both wild-type Camelina sativa oil (a low LC-PUFA diet) and containing GM camelina oil (containing n-3 LC-PUFA), although both these diets contained sufficient FM to satisfy EFA requirements( Reference Betancor, Sprague and Montero 59 ). Dong et al.( Reference Dong, Tan and Cai 60 ) have recently shown that pparα1 expression in response to VO was different in three species of fish. The authors observed, dietary VO increased expression of pparα1 and pparα2 in rainbow trout (Oncorhynchus mykiss) and decreased expression of pparα2 in Japanese seabass (Lateolabrax japonicus), but had no effect in livers of yellow croaker (Larimichthys crocea). This finding complicates the regulation of lipid homoeostasis but means that lipid catabolic processes can be regulated by a broad range of endogenous stimuli.
In conclusion, the present study demonstrated that diets deficient in essential LC-PUFA can cause reduction in growth rates alterations to lipid metabolism, fatty acid composition of liver and the regulation of genes involved in lipogenesis and catabolism. Despite the high variability in the expression of lipogenic genes the effect of their expression appears to be become measurable in D1–D3 and this agrees with the analysis of the final weight and SGR data. Therefore, the alteration to the expression of the genes involved in lipogenesis and energy balance appear to be related to the fish growth performance. Therefore, D4–D6 appear to provide sufficient EFA and D1–D3 appear to be deficient. Despite the high energy (high lipid) diets used in the present study, expression of lipogenic genes such as fas involved in de novo biosynthesis was increased by dietary VO. In contrast, ppara1 and its target cpt1α were down-regulated and the expression was linear and therefore appeared to be modulated in a concentration-dependant manner. However, the expression of srebp1 and its gene targets was modelled by a curve, which was indicative of a threshold concentration at which gene expression was activated, although it is difficult to determine this point due to high variability between fish. Overall, the results reported in the present study were consistent with those reported in rats( Reference Ide 61 ), that the LC-PUFA found in FO have a stimulating effect on β-oxidation and an inhibitory effect on de novo lipogenesis. These opposing biochemical activities would be expected to contribute towards the increased hepatic lipid observed in fish fed increasing VO in the present study and others investigating EFA nutrition. These physiological effects of VO have direct relevance to decisions regarding sustainable and modern feed formulations for marine fish species.
Acknowledgements
The authors express their gratitude to the technical team at the BioMar Feed Trial Unit, Hirtshals, in particular, Svend Jørgen Steenfeldt for expert care of the experimental subjects, for training and supervision provided by laboratory staff at Nutrition Analytical Services and Molecular Biology at the Institute of Aquaculture, University of Stirling, UK.
S. J. S. H’s. PhD was co-funded by BioMar and the Marine Alliance for Science and Technology Scotland. BioMar provided the experimental feeds, trial facilities and fish, and covered travel expenses.
V. K. and J. T. designed and executed the nutritional trial and all authors contributed to planning the analyses. V. K., J. T. and S. J. S. H. carried out the sampling. O. M., D. R. T and S. A. M. M. supervised the lead author. M. B. B. provided training in molecular biology to S. J. S. H. who carried out all analytical procedures. S. J. S. H. analysed all of the data and prepared the manuscript. Subsequently the manuscript was shared between all authors who made amendments, contributions and recommendations.
The authors declare that there are no conflicts of interest.
Supplementary material
For supplementary material/s referred to in this article, please visit https://doi.org/10.1017/S0007114517002975


