

INTRODUCTION
Within-host infection dynamics are thought to matter critically for evolutionary outcomes of interest, for example, whether drug resistance will emerge in a parasite population (e.g. Day et al. Reference Day, Huijben and Read2015), or whether parasites will evolve higher virulence (reviewed in Chao et al. Reference Chao, Hanley, Burch, Dahlberg and Turner2000). Intuition is a tempting tool for discerning the selective benefit of parasite traits, and for predicting how within-host processes will scale up to influence patterns in parasite evolution. But intuition is frequently misguided, and theoretical models offer great utility at every stage: formalizing intuition so that it can be tested, identifying what experiments and statistical methods are needed to evaluate those expectations and synthesizing experimental findings into a coherent narrative that can be applied broadly. Here we review recent examples of how models have been used with varying degrees of success to link parasite traits to within-host dynamics and parasite evolution, suggesting best practices for moving forward and identifying key open questions.
REFINING STUDY DESIGN FOR WITHIN-HOST ECOLOGY
Predicting parasite evolution often requires understanding within-host processes that are difficult or impossible to observe directly, and the optimal study design for illuminating key aspects of within-host ecology is by no means intuitive. Many factors change simultaneously over the course of infection, including parasite numbers and the availability of host resources, obscuring the effect of experimental perturbations and making it difficult to distinguish interesting biology from noise. Models can greatly extend the utility of experimental work by highlighting the treatments, response variables and statistical approaches most likely to inform understanding. For example, models can help ensure that experiments have enough statistical power to test theoretical expectations by trimming the number of treatments down to those likely to be the most essential, fruitful, or interesting. Models have been used to select the anti-malarial drug regimens most likely to reduce parasite burdens in mice while limiting selection for drug resistant parasites so that a manageable number of treatment protocols could be investigated experimentally (Huijben et al. Reference Huijben, Bell, Sim, Tomasello, Mideo, Day and Read2013, further examples reviewed in Lessler et al. Reference Lessler, Edmunds, Halloran, Hollingsworth and Lloyd2015).
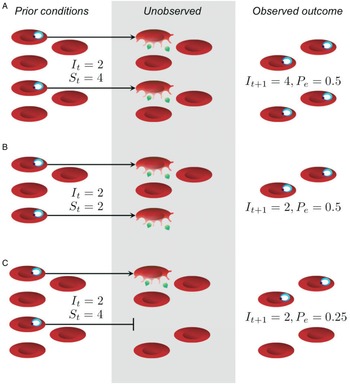
Beyond issues of statistical power and experimenter effort, models can be used to identify the appropriate null expectation for comparison, a prerequisite for detecting complicated interactions within the host. In the context of malaria infections, parasites proliferate within red blood cells, so a null hypothesis might be that infection dynamics are driven solely by the availability of host resources, i.e. red blood cells. From experimental infections in mice, detailed data are available for red blood cell numbers and parasite abundance over the course of infection. In the absence of equally detailed data on immune responses, inferring the role of immunity requires specialized statistical methods. Metcalf et al. (Reference Metcalf, Graham, Huijben, Barclay, Long, Grenfell, Read and Bjørnstad2011) describe one such approach, which relies on careful accounting of red blood cells and parasites to identify cases when the number of new infected cells generated cannot plausibly be explained by resource availability alone and immunity is likely to be involved (Fig. 1). This work has led to some important inferences by quantifying deviations from the null hypothesis. First, parasite proliferation increases with initial abundance, presumably because innate immune responses are more easily overwhelmed by larger numbers of parasites (Metcalf et al. Reference Metcalf, Graham, Huijben, Barclay, Long, Grenfell, Read and Bjørnstad2011). Second, adaptive immunity plays an important role later in infection, where it appears to be upregulated more quickly in response to larger doses of parasites (see Fig. 3 in Metcalf et al. Reference Metcalf, Graham, Huijben, Barclay, Long, Grenfell, Read and Bjørnstad2011). Extending this approach allows anaemia during infection to be partitioned into losses from parasite exploitation and losses from host responses. The model that best fits the data predicts that hosts reduce red blood cell availability in response to infection by more virulent strains; counterintuitively, anaemia may therefore represent adaptation by the host to reduce parasite replication (Metcalf et al. Reference Metcalf, Long, Mideo, Forester, Bjørnstad and Graham2012), in line with theory (Cromer et al. Reference Cromer, Stark and Davenport2009). These approaches provide a powerful way to distinguish between the potential drivers of infection dynamics – for example, resource limitation vs immune clearance or host- vs parasite-mediated destruction of red blood cells – by leveraging time series data. Critically, none of these insights about host–parasite interactions would have been apparent from examining parasitemia alone (Fig. 1), underscoring the need for experiments that quantify how parasite numbers and the in-host environment change over the course of infection.
The effective propagation number offers a way to decouple parasite proliferation from resource availability. In (A) and (B), the different outcomes observed at time t + 1 can be entirely explained by differences in the starting number of uninfected red blood cells, S t , and infected red blood cells, It , with no need to invoke immune clearance; thus, the effective propagation numbers (P e ) are the same in both scenarios. In (C), resources were sufficiently abundant, but the outcome was a smaller number of infected red blood cells than expected, reflected in a smaller effective propagation number. Importantly, the greatest fold-change in parasitemia and parasite density occurs in (A), and, without knowledge of red blood cell densities, one might incorrectly infer that immunity is having a greater impact in both (B) and (C). While P e would typically be estimated by regression (Metcalf et al. Reference Metcalf, Graham, Huijben, Barclay, Long, Grenfell, Read and Bjørnstad2011), we calculate it here assuming that P e = I t + 1 /(I t S t ).
Models can also generate understanding of how within-host dynamics manifest as population level patterns, an area where the null hypothesis is often unclear. For example, intuition might suggest that if there is facilitation between parasite species, whereby infection by one species increases the odds of infection by the other, then they would occur together in hosts more often than is expected by chance. Yet parasite species might also occur more often than expected by chance if some hosts are especially prone to infection, or if there are seasonal changes in exposure risk (Poulin, Reference Poulin2001). In both cases, hosts would tend to be either uninfected or infected with multiple parasite species, making it appear as though parasites benefit from the presence of coinfecting species even when interactions are neutral or mildly negative. Experimentally perturbing coinfections in wild hosts can uncover the chain of causality (or lack thereof), but such field studies are logistically challenging (e.g. Fenton et al. Reference Fenton, Knowles, Petchey and Pedersen2014), and observational data are often gathered instead (reviewed in Poulin, Reference Poulin2001). Models suggest several challenges in detecting interspecies interactions: for example, even if infection with one parasite species facilitates establishment by another, there may be a maximum number of parasites that can inhabit the same host. Assuming both facilitation and a maximum parasite burden, models have been used to synthesize data on parasite prevalence within the host population (Bottomley et al. Reference Bottomley, Isham and Basáñez2005). These simulations reveal that, as hosts age they may become saturated with parasites and show no evidence of facilitation that might have been apparent in younger hosts, underscoring the need to sample hosts of different ages. Instead of facilitation, parasite species may antagonize one another, but these interactions can be especially challenging to detect when host exposure increases with age, generating a positive association in infection by the two species (Fenton et al. Reference Fenton, Viney and Lello2010). Correlation-based approaches are therefore unlikely to be reliable in the absence of other data on the nature of the interaction between two parasite species (a finding further supported by field experiments, Fenton et al. Reference Fenton, Knowles, Petchey and Pedersen2014), and more sophisticated approaches may be required (Fenton et al. Reference Fenton, Viney and Lello2010). Thus, a growing number of studies show that using models to synthesize within-host data, where the true answer is known, represents a powerful way to improve study design and statistical methods so that the strength and nature of parasite interactions can be tested.
INTERROGATING INTUITION
The main goal of many models of within-host infection dynamics is to predict parasite evolution given a set of assumptions about how hosts and parasites interact. Selection is generally expected to increase R 0 (defined as the number of secondary infections, e.g. May and Anderson, Reference May and Anderson1983), but intuition is rarely sufficient to predict the evolution of parasite traits underlying transmission because their consequences accumulate over the parasite's entire life cycle. We focus on malaria infections, where complex ecology – within the host and the vector – often serves to befuddle intuition regarding the evolutionary consequences of parasite traits. One major challenge is that malaria parasites employ specialized transmission forms (gametocytes) that cannot contribute to within-host proliferation (reviewed in Bousema and Drakeley, Reference Bousema and Drakeley2011). This type of specialization erodes any simple expected relationship between transmission and total parasite abundance within the host and is present in diverse parasites. In addition to the malaria genus Plasmodium, all other Apicomplexans utilize special forms for transmission (e.g. Eimeria spp., Babesia spp., Toxoplasma spp., reviewed in Smith et al. Reference Smith, Walliker and Ranford-Cartwright2002), as do some trypanosomes (reviewed in MacGregor et al. Reference MacGregor, Ször, Savill and Matthews2012), and certain viruses, bacteria and fungi (reviewed in Anderson and May, Reference Anderson and May1981). The connection between within-host abundance and between-host spread can be further complicated when transmission investment (allocation to transmission stage production) varies across strains and in-host environments as it does in malaria (e.g. Pollitt et al. Reference Pollitt, Mideo, Drew, Schneider, Colegrave and Reece2011b ; Cameron et al. Reference Cameron, Reece, Drew, Haydon and Yates2012, reviewed in Carter et al. Reference Carter, Kafsack, Llinás, Mideo, Pollitt and Reece2013). Below, we discuss several examples of how intuition about parasite fitness can be overturned by integrating data and models, an approach that serves to illustrate not just when intuition fails, but why.
Intuition: longer infections enhance parasite fitness
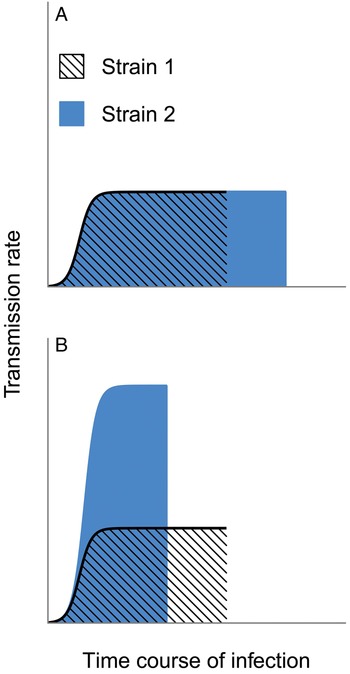
Malaria infections can persist for hundreds of days (Miller et al. Reference Miller, Good and Milon1994) and these chronic infections may be necessary to sustain malaria transmission where mosquitoes are only present for part of the year (reviewed in Bousema and Drakeley, Reference Bousema and Drakeley2011). Many studies assert that a longer period of infectiousness (i.e. of harbouring gametocytes) will increase transmission to mosquitoes (Snounou et al. Reference Snounou, Jarra and Preiser2000; Recker et al. Reference Recker, Buckee, Serazin, Kyes, Pinches, Christodoulou, Springer, Gupta and Newbold2011; Eksi et al. Reference Eksi, Morahan, Haile, Furuya, Jiang, Ali, Xu, Kiattibutr, Suri, Czesny, Adeyemo, Myers, Sattabongkot, Su and Williamson2012; Klein et al. Reference Klein, Smith, Laxminarayan and Levin2012; Coleman et al. Reference Coleman, Skillman, Jiang, Childs, Altenhofen, Ganter, Leung, Goldowitz, Kafsack, Marti, Llinás, Buckee and Duraisingh2014; Morahan and Garcia-Bustos, Reference Morahan and Garcia-Bustos2014). As a corollary, any trait that increases the period of infectiousness is thus expected to enhance parasite fitness (e.g. schematic shown in Fig. 2A). But data and theory both reveal severe flaws in this logic. Most pressingly, transmission rates are not binary: the presence of gametocytes does not ensure transmission, and data show that over a considerable range, greater numbers of gametocytes improve the odds of infecting mosquitoes (Paul et al. Reference Paul, Bonnet, Boudin, Tchuinkam and Robert2007; Huijben et al. Reference Huijben, Nelson, Wargo, Sim, Drew and Read2010; Bell et al. Reference Bell, Huijben, Paaijmans, Sim, Chan, Nelson and Read2012, reviewed in Bousema and Drakeley Reference Bousema and Drakeley2011). Therefore, fitness will not necessarily be enhanced by simply increasing the length of infections, particularly if greater cumulative transmission can be achieved by truncating infection early (e.g. Fig. 2B). Instead, selection will act on the transmission rate integrated over the lifespan of an infection. Given the complexity of within-host dynamics, the idea that a parasite strain could persist longer inside a host with no other alteration to its dynamics and transmission success (Fig. 2A) is likely to be a gross oversimplification and extremely misleading.
Selection need not maximize the duration of infection. Two hypothetical strains differ in their transmission rates over the course of infection, and selection would be expected to maximize the lifetime transmission success. In panel A, both strains maintain identical transmission rates through time, except that Strain 2 can maintain infection (and transmission) longer and would hence be favoured by selection. In contrast, panel B assumes that shorter infections allow substantially higher rates of transmission. Strain 2 has the greatest cumulative transmission success, despite causing a shorter infection (e.g. by killing the host more quickly), and should thus be favoured over Strain 1.
Understanding how infection duration and transmission rates are related is further complicated in malaria infections since the traits underlying these processes may be mechanistically linked. For malaria parasites, survival within the host depends in part on antigenic switching (reviewed in Scherf et al. Reference Scherf, Lopez-Rubio and Riviere2008). In the human malaria parasite Plasmodium falciparum, proliferative forms express proteins encoded by the var gene family which over time leads to a protective adaptive immune response (reviewed in Miller et al. Reference Miller, Baruch, Marsh and Doumbo2002). Each replicating parasite expresses a single var gene (Chen et al. Reference Chen, Fernandez, Sundström, Schlichtherle, Datta, Hagblom and Wahlgren1998), and clonal populations of P. falciparum parasites tend to express one var gene at a time within the host (Kaestli et al. Reference Kaestli, Cortes, Lagog, Ott and Beck2004). Recent in vitro assays suggest antigenic switching and gametocyte production share some common molecular machinery (Brancucci et al. Reference Brancucci, Bertschi, Zhu, Niederwieser, Chin, Wampfler, Freymond, Rottmann, Felger, Bozdech and Voss2014; Coleman et al. Reference Coleman, Skillman, Jiang, Childs, Altenhofen, Ganter, Leung, Goldowitz, Kafsack, Marti, Llinás, Buckee and Duraisingh2014), raising the question of whether parasites are able to regulate gametocyte production independently from antigenic switching. Models predict that complex antigen switching behaviour could generate chronic infections (e.g. switching order determined by a structured network, Recker et al. Reference Recker, Buckee, Serazin, Kyes, Pinches, Christodoulou, Springer, Gupta and Newbold2011). Further, models suggest that initially high rates of proliferation could generate a robust immune response against a particular antigen, simultaneously preventing a specific immune response against distinct but structurally-similar antigens; when the initial antibody response wanes, parasites expressing those related antigens will be free to proliferate, prolonging the infection (Klein et al. Reference Klein, Graham, Llina's and Levin2014). If gametocyte development functions as an additional ‘antigen’, the switching pattern could profoundly alter transmission potential. For example, in a simple scenario, antigenic switching and gametocyte production could be constrained to proceed at the same rate. In this case, a low rate of antigenic switching/gametocyte production might be strongly favoured early in infection, since theory predicts that rapid initial proliferation greatly enhances future opportunities for gametocyte production (Koella and Antia, Reference Koella and Antia1995) and allows better modulation of the adaptive immune response to permit longer infections (Klein et al. Reference Klein, Graham, Llina's and Levin2014). However, later in infection, selection pressures might conflict: in the face of an upregulated adaptive immune response, parasites might do best to restrain gametocyte production so as to proliferate enough to persist within the host (as predicted by Pollitt et al. Reference Pollitt, MacGregor, Matthews and Reece2011a ), but a faster rate of antigenic switching might be beneficial to escape the same immune response. More complex scenarios are plausible. Some selective conflicts would be avoided if parasites could regulate antigenic switching independently from gametocyte production. Thus, the mechanistic links between infection duration and transmission potential demand further study. Combining empirical and theoretical approaches could uncover important constraints on malaria parasite evolution that would be difficult to discern from experiments alone.
In the meantime, the fitness consequences of changing transmission investment cannot be adequately assessed by assuming efficient transmission over a threshold number of gametocytes (as in Coleman et al. Reference Coleman, Skillman, Jiang, Childs, Altenhofen, Ganter, Leung, Goldowitz, Kafsack, Marti, Llinás, Buckee and Duraisingh2014). Modifying allocation to transmission is likely to alter transmission rates, but with potentially different consequences in the short- vs long-term (Fig. 3). The implications for parasite fitness should be examined by integrating transmission success over the lifespan of infection. For example, curves relating gametocyte abundance to infectivity have already been experimentally-derived (from rodent infections, Bell et al. Reference Bell, Huijben, Paaijmans, Sim, Chan, Nelson and Read2012) or statistically-inferred from clinical data (from human infections, Paul et al. Reference Paul, Bonnet, Boudin, Tchuinkam and Robert2007; Huijben et al. Reference Huijben, Nelson, Wargo, Sim, Drew and Read2010). Those curves have been used to estimate the probability of transmission from gametocyte abundance and predict the fitness consequences of different parasite traits (e.g. drug resistance, Huijben et al. Reference Huijben, Bell, Sim, Tomasello, Mideo, Day and Read2013, developmental synchrony, Greischar et al. Reference Greischar, Read and Bjørnstad2014). The key point is that selection is unlikely to be able to maximize transmission rates and infection length independently, and considering the cumulative transmission success will provide more realistic predictions.
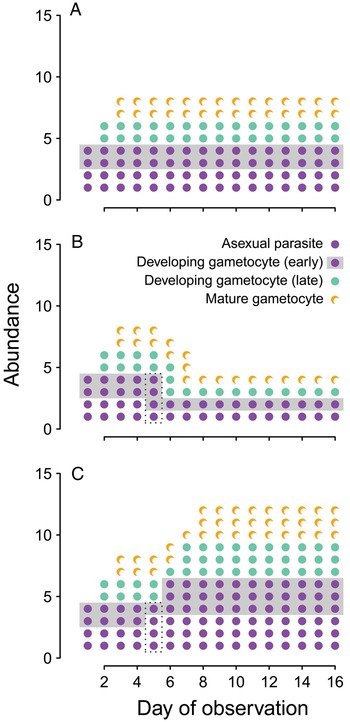
Transmission investment changes within-host dynamics. We assume each life stage (asexual, early gametocyte development, late gametocyte development, gametocyte maturity) lasts only one day (as has been reported for Plasmodium chabaudi infections of mice, Landau and Boulard, Reference Landau, Boulard, Killick-Kendrick and Peters1978; Reece et al. Reference Reece, Duncan, West and Read2003). For visual clarity, we have deliberately oversimplified the malaria biology: we assume that at first observation infections consist of two asexual parasites and two developing gametocytes, that each asexual produces two progeny, and that each of those progeny can develop as either an asexual parasite or a gametocyte. In (A), investing 50% of progeny into gametocyte production exactly balances the 2-fold replicative capacity of the asexual parasites, leading to constant parasite biomass and gametocyte abundance. In (B), transmission investment is increased on day 4 only, resulting in more developing gametocytes on day 5 (boxed) and a transient increase in mature gametocytes on day 7, followed by a reduction in parasite biomass and gametocyte numbers. Finally, if transmission investment is decreased on day 4 only (C), it leads to fewer developing gametocytes on day 5 (boxed), a transient reduction in mature gametocytes on day 7, and, subsequently, a sustained increase in gametocyte numbers and total parasite biomass.
Intuition: there is a tradeoff between virulence and transmission
This intuition forms the basis for classical theory on virulence evolution (reviewed in Alizon et al. Reference Alizon, Hurford, Mideo and van Baalen2009), which assumes that within-host proliferation enhances transmission rates but reduces infection length due to host mortality (e.g. Frank Reference Frank1996; pattern in Fig. 2B). These assumptions hold for some parasites, e.g. HIV, for which higher viral loads correlate with both greater transmission rates and shorter time until the onset of AIDS and death (Fraser et al. Reference Fraser, Lythgoe, Leventhal, Shirreff, Hollingsworth, Alizon and Bonhoeffer2014). Human malaria infections show a more nuanced pattern of host mortality. Severe outcomes are the product of immunity and parasite factors: the likelihood of severe outcomes scales with parasite numbers, but only when parasites exceed a certain threshold biomass (Cunnington et al. Reference Cunnington, Riley and Walther2013). Infections are frequently asymptomatic (e.g. Färnert et al. Reference Färnert, Snounou, Rooth and Björkman1997; Jafari-Guemouri et al. Reference Jafari-Guemouri, Boudin, Fievet, Ndiaye and Deloron2006) and terminated by host immunity rather than mortality (e.g. Bruce et al. Reference Bruce, Donnelly, Packer, Lagog, Gibson, Narara, Walliker, Alpers and Day2000). These asymptomatic hosts can harbour considerable numbers of gametocytes and infect mosquitoes (reviewed in Bousema and Drakeley, Reference Bousema and Drakeley2011). Thus, there is no straightforward association between transmission and the risk of host mortality.
The link between parasite biomass and transmission rate is also less clear in malaria infections, due to the presence of specialized transmission stages. We use a simple model to illustrate how changing transmission investment could alter proliferation in malaria infections (Fig. 3). Constant transmission investment can (with the right parameter values) offset the proliferation of the parasite population so that parasite numbers remain constant (Fig. 3A), and the transient effects of changing transmission investment follow intuition: increasing transmission investment causes a short-term increase in the number of gametocytes (Fig. 3B), while decreasing investment reduces the numbers of gametocytes, at least initially (Fig. 3C). The long-term impact is more complicated, with increased transmission investment actually reducing both proliferative and transmission stage abundance, and decreased transmission investment ultimately resulting in higher parasite biomass and numbers of gametocytes. Rapid initial proliferation – even at the expense of gametocyte production – is predicted to enhance transmission success, since it provides a larger pool of parasites that can subsequently develop into gametocytes (Koella and Antia, Reference Koella and Antia1995). Accordingly, using a quantitative genetics approach we found no evidence of tradeoffs between virulence and transmission in rodent malaria infections, but did uncover tradeoffs between early and late transmission (Mideo et al. Reference Mideo, Nelson, Reece, Bell, Read and Day2011a ). When the tradeoff emerges within a trait rather than as a consequence of correlated traits, the optimal transmission rate profile depends on host population dynamics. The size of the host population is predicted to constrain the range of strategies available to parasites (Cressler et al. Reference Cressler, McLeod, Rozins, Van Den Hoogen and Day2015). If hosts are abundant enough, parasites may be able to invade rapidly and persist indefinitely by producing acute infections, from which transmission is highly efficient for only a brief period; when host populations are smaller, parasites producing acute infections are likely to go extinct after depleting the susceptible population, and parasites causing chronic infections should tend to persist (invasion-persistence tradeoff, King et al. Reference King, Shrestha, Harvill and Bjørnstad2009). Similarly, early transmission is predicted to carry greater benefits when an epidemic is expanding (Day et al. Reference Day, Alizon and Mideo2011; Mideo et al. Reference Mideo, Nelson, Reece, Bell, Read and Day2011a ). Since each infection that is ending is replaced by more than one new infection, most infections are in the early stages and the early part of infection has a greater impact on parasite fitness. In contrast, late transmission contributes more to parasite fitness when the infection prevalence attains an endemic equilibrium in the host population (Day et al. Reference Day, Alizon and Mideo2011; Mideo et al. Reference Mideo, Nelson, Reece, Bell, Read and Day2011a ). While malaria biology dictates a tradeoff between replication and transmission in the short-term (e.g. Fig. 3), a different pattern may emerge when transmission rates are integrated over the lifespan of an infection. Theory developed to characterize malaria infections supports the idea that common parasite life history traits, including specialized transmission stages, can dissolve the expected tradeoff between virulence and transmission.
Intuition: within-vector dynamics are unlikely to make a qualitative difference
Many parasites exhibit indirect transmission, so that infecting new hosts requires colonization of one (or more) vectors. To simplify calculations, models commonly use constants to represent transmission to and from the vector, including efforts to estimate disease risk (e.g. Smith et al. Reference Smith, McKenzie, Snow and Hay2007; Gething et al. Reference Gething, Smith, Patil, Tatem, Snow and Hay2010, Reference Gething, Patil, Smith, Guerra, Elyazar, Johnston, Tatem and Hay2011) and to characterize the evolutionary consequences of repeated transmission bottlenecks (Chang et al. Reference Chang, Moss, Park, Ndiaye, Mboup, Volkman, Sabeti, Wirth, Neafsey and Hartl2013; Chang and Hartl, Reference Chang and Hartl2015). Other models instead assume that transmission success scales with total gametocyte production (e.g. to identify optimal transmission investment strategies, Koella and Antia, Reference Koella and Antia1995; Mideo and Day, Reference Mideo and Day2008), but malaria parasites may also defy that logic because not all gametocytes are equally valuable. Their potential contribution to parasite fitness depends on the size and composition of the gametocyte population. Gametocytes develop as male or female and, once they are ingested by a vector, successful fertilization is required for onward transmission (reviewed in Bousema and Drakeley, Reference Bousema and Drakeley2011). Mate finding is likely to be a particular problem when gametocytes (or gametes) are rare, and as a consequence the probability of infecting mosquitoes is observed to accelerate when gametocytes increase from low numbers (e.g. Huijben et al. Reference Huijben, Nelson, Wargo, Sim, Drew and Read2010; Bell et al. Reference Bell, Huijben, Paaijmans, Sim, Chan, Nelson and Read2012). While greater numbers of gametocytes can improve the odds of transmission, the sex ratio – the proportion of gametocytes that are male – also plays a role. Malaria parasites exhibit female-biased sex ratios (Robert et al. Reference Robert, Read, Essong, Tchuinkam, Mulder, Verhave and Carnevale1996; Paul et al. Reference Paul, Ariey and Robert2003; Talman et al. Reference Talman, Domarle, McKenzie, Ariey and Robert2004), which are predicted to be favourable in inbred populations (local mate competition theory, Hamilton, Reference Hamilton1967). When inbreeding occurs it leads to competition for mates between related males which reduces the fitness returns from males relative to females so that female-biased sex ratios will be favoured by selection (Dye and Godfray, Reference Dye and Godfray1993; West et al. Reference West, Smith and Read2000; Nee et al. Reference Nee, West and Read2002). Female-biased sex ratios occur in infections with low genetic diversity (Read et al. Reference Read, Narara, Nee, Keymer and Day1992, Reference Read, Anwar, Shutler and Nee1995; Paul et al. Reference Paul, Packer, Walmsley, Lagog, Ranford-Cartwright, Paru and Day1995; West et al. Reference West, Reece and Read2001, Reference West, Smith, Nee and Read2002; Sowunmi et al. Reference Sowunmi, Gbotosho, Happi, Folarin and Balogun2009), and experimental rodent infections match closely with quantitative theoretical predictions (Reece et al. Reference Reece, Drew and Gardner2008). Yet some malaria parasite species consistently show sex ratios that are far more variable during infection and less female-biased than would be expected from the inbreeding rate (e.g. Shutler and Read, Reference Shutler and Read1998; West et al. Reference West, Reece and Read2001; Paul et al. Reference Paul, Ariey and Robert2003; Neal and Schall, Reference Neal and Schall2010). The mismatch may be related to the problem of maximizing transmission success when gametocytes are rare. Parasites with a strongly female-biased sex ratio would risk too few males being taken up to fertilize all of the females, a problem that could be exacerbated by transmission-blocking immune defences (such as antibodies that agglutinate male gametes, Carter et al. Reference Carter, Gwadz and Green1979). Accounting for the possibility of too few male gametes when gametocytes are rare, models instead predict sex ratios that are less female-biased than would be predicted from simple theory (Gardner et al. Reference Gardner, Reece and West2003, and others), consistent with empirically observed patterns (e.g. Mitri et al. Reference Mitri, Thiery, Bourgouin and Paul2009; Ramiro et al. Reference Ramiro, Alpedrinha, Carter, Gardner and Reece2011).
When success is limited by gametocyte numbers, maximizing colonization of the mosquito would seem to be an appropriate target for selection (e.g. Reece et al. Reference Reece, Drew and Gardner2008), but that may not be the case when gametocytes are abundant. Experiments suggest that there is an upper limit on the number of parasites that can successfully develop within the vector (Sinden et al. Reference Sinden, Dawes, Alavi, Waldock, Finney, Mendoza, Butcher, Andrews, Hill, Gilbert and Basáñez2007) as well as the number a mosquito can harbour and still survive long enough to transmit (Dawes et al. Reference Dawes, Churcher, Zhuang, Sinden and Basáñez2009). Because of these limitations, strains that export more gametocytes can actually experience reduced onward transmission (Pollitt et al. Reference Pollitt, Churcher, Dawes, Khan, Sajid, Basáñez, Colegrave and Reece2013). A remaining challenge is to determine how often such crowding is likely to constrain parasite fitness, and to what extent parasites can side-step the problem by modifying their gametocyte production, adjusting their sex ratios, or by using apoptosis to correct for over-crowding (reviewed in Pollitt et al. Reference Pollitt, Colegrave, Khan, Sajid and Reece2010; Reece et al. Reference Reece, Pollitt, Colegrave and Gardner2011). Transmission-blocking interventions will not be effective if parasites are able to compensate for their effects, but even worse would be an intervention that eases crowding within the mosquito and thereby allows more efficient onward transmission. Thus, models and data together suggest that the within-vector dynamics have the potential to make a qualitative difference to parasite evolution, especially in the face of intervention efforts.
THE ROLE OF MODELS IN DISCERNING THE SELECTIVE LANDSCAPE
Models are uniquely suited to explore the fitness consequences of parasite strategies and to determine whether shifting selection pressures are likely to unearth novel parasite traits. In that vein, models have been used to understand what factors have constrained the evolution of HIV so that vector-transmission is essentially non-existent, despite the potential advantage (Day et al. Reference Day, Mideo and Alizon2008). Similarly, a model of parasites with specialized transmission stages predicted that parasites should divert all resources to transmission investment when infection is ending (terminal investment, Koella and Antia, Reference Koella and Antia1995). Such terminal investment has not been observed (at least, in malaria parasites), even in extremely crowded in vitro conditions (Bruce et al. Reference Bruce, Alano, Duthie and Carter1990). Since the quantitative prediction has not been supported, the model opens up an interesting avenue of questioning. Are there any biases in our experimental or statistical approaches that would obscure terminal investment? Is the predicted strategy not really optimal, and if not, what other factors need to be accounted for in models? If the predicted optimal strategy is correct, what prevents parasites from attaining that evolutionary optimum in reality? By exploring the strategies that have (so far) failed to evolve, models help make sense of the diverse life histories that do exist and the feedbacks that constrain their evolution.
Characterizing the fitness landscape and the constraints on parasite adaptation is a particularly urgent concern, since human interventions are currently remodelling that landscape, easing some constraints and imposing new ones. For example, recent models suggest that sustainable disease control might be achieved by less aggressive vector-control methods (Koella et al. Reference Koella, Lynch, Thomas and Read2009; Read and Thomas, Reference Read and Thomas2009). The logic is that malaria parasites, like many other mosquito-borne pathogens, require a long time to incubate within a mosquito in order to be transmitted, so targeting control towards only older mosquitoes (for example through lower doses of insecticides, Glunt et al. Reference Glunt, Thomas and Read2011, or biopesticides with delayed action, Lynch et al. Reference Lynch, Grimm, Thomas and Read2012) could simultaneously reduce malaria risk while imposing less selection for insecticide resistance in the vector. Thus, mosquitoes would still be present and feeding, but few if any would be capable of transmitting malaria. However, recent experiments suggest that mosquito bites, even from uninfected mosquitoes, can alter within-host dynamics: malaria-infected birds fed upon by uninfected mosquitoes subsequently harboured greater numbers of parasites than birds not receiving mosquito bites, and birds became more infectious in the days following this exposure (Cornet et al. Reference Cornet, Nicot, Rivero and Gandon2014). Transient increases in blood-borne parasite abundance are often observed in chronic avian malaria infections and usually attributed to a lapse in host immunity (Valkiunas, Reference Valkiunas2005), but the experimental results reported by Cornet et al. (Reference Cornet, Nicot, Rivero and Gandon2014) suggest that such a lapse could be triggered by exposure to mosquito bites. One interpretation of this data is that parasites are able to facultatively alter their dynamics to enhance infectiousness in the presence of mosquitoes, raising the question of how. Do parasites alter transmission investment (e.g. Fig. 3C), or burst sizes (another apparently plastic trait in P. chabaudi, Mideo et al. Reference Mideo, Savill, Chadwick, Schneider, Read, Day and Reece2011b ), or by switching antigens? Equally important, if any of these strategies could increase infectiousness, why would parasites not always employ them? Cornet et al. (Reference Cornet, Nicot, Rivero and Gandon2014) use models to show that, if proliferation increases the risk of host mortality, it would select for parasites that only upregulate their numbers when transmission is possible (i.e. when mosquitoes are present), but increasing proliferation late in infection could render parasites more vulnerable to clearance by adaptive immunity, especially if the antigenic repertoire is close to being exhausted.
Distinguishing between these possibilities is essential to predicting the consequences of selectively removing older mosquitoes vs conventional approaches aimed at killing all mosquitoes. If parasite expansion is merely the result of removing an immune constraint, then leaving uninfected mosquitoes around could have the unintended consequence of causing infected hosts to relapse, at least in the short-term. Alternatively, if the expansion of parasite numbers represents adaptation on the part of the parasites, killing mosquitoes before they are infectious would remove the benefit of increased proliferation within the host but leave the cost. If increasing parasite numbers late in infection also increases the risk of immune clearance, then less aggressive interventions could be even more efficient at reducing malaria prevalence than the conventional approach of indiscriminately removing all mosquitoes. At the core of the issue is what parasites stand to gain (or lose) from relapses; transient increases in parasite biomass appear advantageous in the short-term, since they coincide with enhanced transmission rates (Cornet et al. Reference Cornet, Nicot, Rivero and Gandon2014), but further theory and experiments are needed to project the long-term consequences over the entire parasite life cycle.
CONCLUSIONS
Models have been immensely useful for refining intuition and improving methods for inferring what cannot be observed directly. Recent work – theoretical and experimental – has highlighted the rich detail of within-host ecology, necessary for placing parasite life cycles into a robust evolutionary framework. These details are likely to matter as disease intervention efforts become more sophisticated, and integration between models and data can locate the critical gaps in knowledge and augment efforts to unravel the complex patterns of parasite evolution.
ACKNOWLEDGEMENTS
We thank Andrew F. Read, Ottar N. Bjørnstad, Nicholas J. Savill, and David R. M. Smith and two anonymous reviewers for helpful comments on earlier drafts, and Thomas G. Platt for useful discussion.
FINANCIAL SUPPORT
This work was supported by the Human Frontiers Science Program (grant number RGP0046/2013), the Natural Sciences and Engineering Research Council (N.M., Discovery Grant 436171), and the Royal Society (S.R.), the Wellcome Trust (S.R., 082234), the Centre for Immunity, Infection and Evolution (S.R., 095831) and the Natural Environmental Research Council (S.R., grant number K006029).


 Open access