

Fat has a crucial role in membrane structures, the immune system and brain development( Reference Burlingame, Nishida and Uauy 1 , Reference Calder 2 ). Dietary fat is one of the most important macronutrients: it provides energy (38 kJ/g (9 kcal/g)); supplies two essential fatty acids, i.e. α-linolenic acid (18:3n-3) and linoleic acid (18:2n-6); and facilitates the absorption of lipid-soluble vitamins( 3 ). On the other hand, it is widely accepted that high intake of some specific dietary fats is associated with several chronic diseases such as CVD, obesity, cancers and type 2 diabetes mellitus( Reference Ericson, Hellstrand and Brunkwall 4 – Reference Vafeiadou, Weech and Sharma 6 ). It has also been indicated that the amount of specific types of dietary fat, i.e. SFA, MUFA and PUFA, is more notable than the total amount of dietary fat in the relationship with the risk of these diseases( Reference Hooper, Summerbell and Higgins 7 , Reference Hu, Manson and Willett 8 ). An expert panel of the WHO concluded that there is convincing evidence that replacing SFA with PUFA decreases the risk of CHD, and possible evidence of a relationship between PUFA intake and reduced risk of diabetes mellitus( 9 ).
The WHO and FAO have established recommendations for dietary fat intakes to decrease the burden of chronic diseases caused by excessive intakes of specific dietary fatty acids worldwide: for total dietary fat, 15–35 % of total energy (%TE); for SFA, an upper limit of 10 %TE; and 6–11 %TE for PUFA( 9 ). Various countries such as the USA, the UK, China and Japan have all developed their own national guidelines( Reference McGuire 10 – Reference Sasaki 13 ). Chinese dietary reference intakes suggest a total fat intake of 20–30 %TE and SFA intake of <10 %TE for adults( 12 ).
The growth rate of China’s gross domestic product continued the great momentum maintained since the implementation of the country’s reform and opening-up policy. As the economy developed, Chinese people, especially the ones living in urban areas with higher household incomes, transformed their ‘traditional’ dietary pattern to be ‘westernized’( Reference Wang, He and Li 14 – Reference Batis, Sotres-Alvarez and Gordon-Larsen 16 ). The Chinese traditional diet consists mainly of cereals, tubers and vegetables, with small to moderate intakes of animal foods, high intakes of carbohydrate and dietary fibre and low intake of fat, while the ‘westernized’ diet tends to contain more animal foods and refined plant foods accompanied with high fat and protein intakes and low dietary fibre intake( Reference Ericson, Hellstrand and Brunkwall 4 , Reference Zhai, Wang and Du 17 , Reference Wang, Zhai and Du 18 ). In recent years, transformation of the dietary pattern from ‘traditional’ low-fat to ‘westernized’ high-fat was thought to be an aetiological factor in the prevalence of chronic diseases in China( Reference Wang, Zhang and Xiao 19 – Reference Wang, Liang and Wei 22 ).
However, scant research has evaluated longitudinal trends of fatty acid intakes in Chinese adults over the past decades, particularly with regard to examining the changing profile of dietary fatty acids( Reference Zhai, Wang and Du 23 ). The present study aimed to report the trends of total fat, SFA, MUFA, PUFA and essential fatty acid intakes and their food sources in Chinese adults using the long-term follow-up data from year 1997 to 2011 from the China Health and Nutrition Survey (CHNS).
Methods
Study design
The CHNS are an ongoing series of longitudinal household surveys established in 1989 and followed-up in 1991, 1993, 1997, 2000, 2004, 2006, 2009 and 2011. The design of the CHNS has been previously described in detail elsewhere( Reference Popkin, Du and Zhai 24 , Reference Zhang, Zhai and Du 25 ). Eight provinces joined the survey from 1989 to 1997, including Liaoning (replaced by Heilongjiang in 1997), Shandong, Jiangsu, Henan, Hubei, Hunan, Guangxi and Guizhou. In 2000, Liaoning rejoined the survey and in 2011, three municipal cities (Beijing, Shanghai, Chongqing) were added. A multistage, random cluster approach was used to draw the sample surveyed in each province. Four counties (one low-, two middle- and one high-income county, defined on the basis of per capita income) and two cities (a large city, usually the provincial capital, and a randomly selected smaller lower-income city) were selected from each province using a weighted sampling method. Two urban and two suburban communities were randomly selected in cities. One community in the capital city and three rural villages were randomly chosen in counties. Twenty households were then randomly selected within each community( Reference Zhang, Zhai and Du 25 ). All individuals in each household were interviewed.
Data collection
The survey data were obtained mainly from three aspects: a questionnaire survey, a physical examination and a diet recall. Demographic and lifestyle information such as survey year, age, sex, ethnic origin, stratum, smoking status, physical activity level, education level and work status were obtained through a questionnaire. Participants’ body weight, height, waist and hip circumferences and blood pressure were measured by well-trained investigators, following a standard protocol with calibrated equipment. BMI was calculated as weight/height2 (kg/m2). Diet recall data at individual level while food inventory data at household level were collectively obtained on three consecutive days (randomly allocated to start from Monday to Sunday). The same procedure was followed during all nine survey periods for collecting dietary recall data. An urbanization index was measured that represents the change in twelve dimensions (including population density, economic activity, traditional markets, modern markets, communications, transportation infrastructure, sanitation, housing, diversity, education, health infrastructure and social services) at community level( Reference Jones-Smith and Popkin 26 , Reference Su, Jia and Wang 27 ). The information on food composition data and food codes of 1989, 1991 and 1993 was unable to be extracted from Chinese authorities. In the present study, we used the survey data from 1997 to 2011 only, and excluded participants who reported implausible total energy or total fat intake (the upper and lower 1 % of the intake) and those younger than 18 years old.
Dietary assessment
The measurement of individuals’ dietary intake in CHNS is a combination of two parts: three consecutive 24 h dietary recalls at the individual level and a household-level food inventory weighing performed over the same three days, which were randomly allocated from Monday to Sunday. The three consecutive days of 24 h recall dietary data were collected by trained nutritionists who recorded amounts, types and place of all the food items consumed. To determine the food consumption at household level, the change in available food was weighed and recorded from the beginning to the end of each survey. With oil and condiments as an example, we converted household survey data into individual intake by calculating the percentage of the oil and condiments from the home inventory that each member consumed by the ratio of his or her energy intake to the energy intake of all family members. The nutrient intake amounts from consumed foods were further found using an expanded and updated ongoing database: the China Food Composition Tables( 28 – 30 ).
According to the classification rules of the China Food Composition Tables, we further divided food items into eight groups, including meat and meat products, poultry and poultry products, dairy and dairy products, eggs and egg products, fish, shellfish and molluscs, animal oils, vegetable oils and others. The information on each individual’s daily fatty acid intake, such as SFA, MUFA and PUFA, was converted from grams per 100 g of food to grams per actual weight of food consumed. The total weight of a certain food group was calculated as the sum of raw weights of the edible parts of all foods in this group.
Statistical analysis
Data analyses were performed using the statistical software package SAS version 9.2. Fatty acids were presented in the unit of percentage of total energy (%TE) to compare with the China and WHO recommendations. Linear mixed-effect models were used to calculate the adjusted mean values of total fat, protein, carbohydrate, SFA, MUFA, PUFA, EPA, DHA, 18:1, 18:2 and 18:3 fatty acids (adjusted for age, urbanization index and total energy intake). Adjusted means and se were used to describe the variables in each survey round. The changes in nutrient intakes over the survey period were characterized by linear trend tests. Trends in fatty acid intakes were conducted stratified by sex, when considering the different energy intakes and nutrient requirements.
Results
Demographic information is presented in Table 1. A total of 19 475 adults (9420 men and 10 055 women) were included in our study. Slightly more than half of the participants were women in each survey round. The mean age ranged from 43·0 to 50·8 years and from 44·1 to 50·6 years for men and women, respectively. The urbanization index increased by approximately 37 % as per capita gross domestic product increased sevenfold over the survey period.
General characteristics of participating Chinese adults aged 18 years or above (n 19 475) in each survey round by sex, China Health and Nutrition Survey, 1997–2011Footnote *
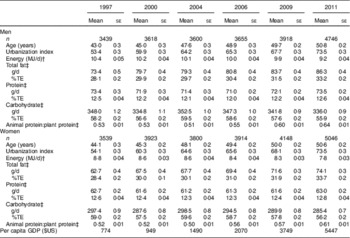
%TE, percentage of total energy intake; GDP, gross domestic product.
* P for trend <0·0001 for all variables.
† Adjusted for age and urbanization index; 1 MJ = 1000 kJ, 1 kcal = 4·184 kJ.
‡ Adjusted for age, urbanization index and total energy intake.
Adjusted mean intakes of fatty acids and their main food sources, stratified by sex, among Chinese adults older than 18 years are shown in Tables 2–4.
Adjusted mean intakes of fatty acids among Chinese adults aged 18 years or above (n 19 475) in each survey round by sex, China Health and Nutrition Survey, 1997–2011Footnote *
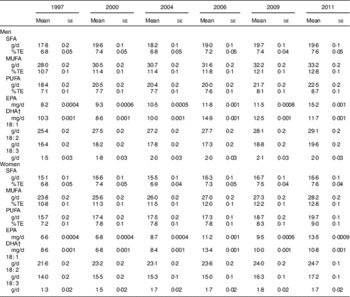
%TE, percentage of total energy intake.
* Adjusted for age, urbanization index and total energy intake. Significant trend in each subgroup (except DHA) across the survey years, P<0·0001.
† P for trend <0·05 for men and <0·001 for women
Daily intakes (g/d) of main food sources of fatty acids among participating Chinese adults aged 18 years or above (n 19 475) in each survey round by sex, China Health and Nutrition Survey, 1997–2011Footnote *
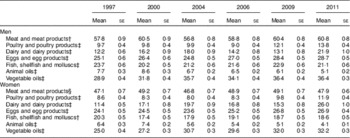
* Adjusted for age, urbanization index and total energy intake.
† P for trend <0·001.
‡ P for trend <0·0001.
§ P for trend <0·05.
Top food sources and percentage contributions to intakes of total fat and fatty acids (%) among participating Chinese adults aged 18 years or above (n 19 475) in each survey round by sex, China Health and Nutrition Survey, 1997–2011Footnote *
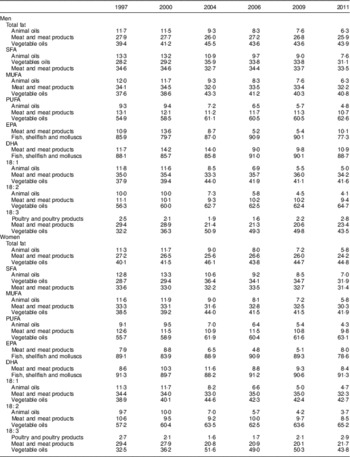
* P for trend <0·0001 for all variables.
Total fat intake and food sources
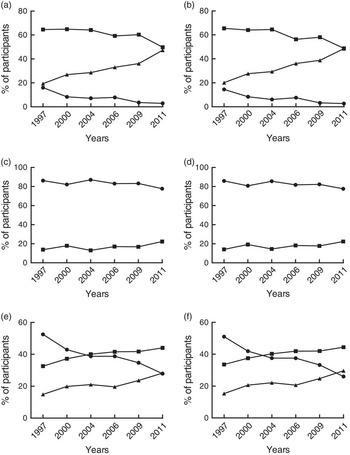
Compared with 1997, dietary energy intake was lower in 2011 (P for trend <0·0001) while both intake and energy proportion of total fat were higher (P for trend <0·0001; Table 1). In 2011 nearly half of the participants, 47·3 % of men and 48·5 % of women, consumed dietary fat >35 %TE (Fig. 1). Vegetable oils were the main source of total fat, providing about 40 % or more (Table 4), and their mean daily intake was 26 and 29 % greater for men and women, respectively, over time. Meanwhile, animal oil intakes showed a downward trend (P for trend <0·0001; Table 3) and provided about one-tenth or less of total fat (Table 4). The ratio of animal to plant protein (P for trend <0·0001; Table 1) was higher in 2011 than in 1997, which is in line with more animal food consumption (Table 3). Meat and meat products were the most consumed animal foods (Table 3), which provided about one-quarter of total fat in both sexes (Table 4). Daily intakes of eggs, fish and seafood and dairy foods were low and provided minor amounts of fat (Tables 3 and 4).
Distribution of participating Chinese adults aged 18 years or above (n 19 475) in different ranges of fat and fatty acid intakes (%TE) in each survey round by sex, China Health and Nutrition Survey, 1997–2011: (a) total fat, males; (b) total fat, females (a, b: —▲—, >35 %TE; —■—, 15–35 % TE; —●—, <15 %TE); (c) SFA, males; (d) SFA, females (c, d: —■—, ≥10 % TE; —●—, <10 %TE); (e) PUFA, males; (f) PUFA, females (e, f: —▲—, >11 %TE; —■—, 6–11 % TE; —●—, <6 %TE). The ranges were based on the recommendation of the FAO/WHO( 9 ) (%TE, percentage of total energy intake)
SFA intake and food sources
In 2011, SFA intake in men and women was slightly higher than SFA intake in 1997. Energy from SFA also showed a fluctuating and increasing trend, from 6·8 to 7·6 %TE for both sexes (P for trend <0·0001; Table 2). The percentage of participants with SFA intake >10 %TE was nearly 10 % higher over the survey period to reach approximately 22 % of the study population in 2011 (Fig. 1). The percentage of SFA from animal sources (animal oils and meat food) decreased by about 7 to 8 %, while that from vegetable oils showed an upward trend in the early half of the survey period and a downward trend in the later half to provide about one-third of total SFA (Table 4).
MUFA intake and food sources
The trend of MUFA intake was similar to that of SFA. The energy from MUFA was 2 % higher in 2011 than in 1997 for both sexes (Table 2). The mean intake of 18:1 fatty acid, the major source of MUFA, was about 3 g/d higher in 2011 than in 1997 (P for trend <0·0001; Table 2). With the increasing intake of MUFA, MUFA from animal oils almost halved, while that from vegetable oils increased by nearly 10 % (P for trend <0·0001; Table 4).
PUFA intake and food sources
Table 2 shows that the mean PUFA intake in our study population was about 4 g/d higher in 2011 than in 1997. The percentage of energy from PUFA, with an upward trend, was from 7 to 9 %TE and always within the range of 6–11 %TE (the WHO recommendation) during the whole survey period. Animal oils, meat and meat products and vegetable oils were the top three food groups providing PUFA (Table 4). The percentage of PUFA from vegetable oils was higher than that from animal oils and meat and meat products (P for trend <0·0001; Table 4). During the survey period, the mean intake of EPA plus DHA fluctuated around 20 mg/d, 18 to 27 mg/d for men and 15 to 24 mg/d for women (Table 2). About 90 % of EPA and DHA was obtained from fish, shellfish and molluscs (Table 4). Significant upward trends in 18:2 and 18:3 fatty acid intakes were observed; in 2011, the intake of 18:2 or 18:3 fatty acid was about 3 or 0·5 g/d higher than in 1997, respectively, for both sexes (P for trend <0·0001; Table 2). The percentage of 18:2 and 18:3 fatty acids from vegetable oils, which accounts for about or more than half of their amounts, was larger than that from animal sources (animal oils, meat and poultry foods; Table 4). The mean percentage of energy from 18:3 in 2011 was 0·5 to 0·8 %TE higher than that in 1997 for both sexes.
Discussion
To our knowledge, few researches have focused on the trends of fat and fatty acid intakes in a representative population( Reference Elmadfa and Kornsteiner 31 – Reference Vadiveloo, Scott and Quatromoni 35 ), especially in Chinese who underwent a rapid transition in food pattern and disease profile during the past decades. Our study demonstrated that from 1997 to 2011, Chinese adults consumed more vegetable oils, but less animal fats, resulting in more MUFA and PUFA intakes while the percentage of energy from SFA was of low level. They consumed less fish and seafood, resulting in very low EPA and DHA intakes of about 20 mg/d. These data show that the dietary fat and fatty acids in the Chinese diet are different from those reported in Western countries( Reference Li, McNulty and Tiernery 36 – Reference Honors, Harnack and Zhou 39 ) and maritime nations such as Japan( Reference Micha, Khatibzadeh and Shi 40 ). It is then required to re-examine the relationship, observed in Western countries( Reference Mente, de Koning and Shannon 41 – Reference Krauss, Eckel and Howard 43 ), of dietary fat with the more prevalent chronic diseases that have been observed over the past decades in China( Reference Chen, Wen and Lin 44 , Reference Wang, Mi and Shan 45 ). Based on the present diet data, the dietary fat is dominated by vegetable oils, and it should be analysed if Chinese people suffer a different risk of chronic diseases to Westerners who consume more SFA and marine n-3 fatty acids. These data also imply that Chinese people depend mostly on the de novo synthesis of EPA and DHA from α-linolenic acid in their body. Hence it may be questionable from the viewpoint of dietary availability and scientific rationality to recommend Chinese people to take the same amount of DHA and EPA as peoples of other countries.
As reported elsewhere( Reference Zhai, Wang and Du 23 , Reference Zhang, Meng and Jiang 46 , Reference Fu, Wang and Wang 47 ), the similar trend is found that total fat intakes are higher after than before the period of fast economic growth in China. Compared with the situation in Japan during its economic boom of the 1960s and 1970s, the Japanese also had a rapid increase in fat intake, which reached 58 g/d and 25 %TE in 1973 and fluctuated around this value thereafter( Reference Matsumura 48 , 49 ). In contrast, average fat intakes in our study kept increasing over the whole survey period and reached a level of more than 33 %TE, approaching that of Europeans and Americans( Reference Elmadfa, Meyer and Nowak 38 , 50 ).
Several publications have reported average fatty acid intakes in populations from different countries( Reference Elmadfa and Kornsteiner 31 , Reference Harika, Eilander and Alssema 34 , Reference Hulshof, van Erp-Baart and Anttolainen 51 ). A recent review demonstrated that only two of twenty-four European countries had SFA intake below 10 %TE and about half of these countries had PUFA intake below 6 %TE, and SFA and PUFA intakes and food patterns in Europe had slightly changed during the past 20–25 years( Reference Eilander, Harika and Zock 33 ). The National Health and Nutrition Examination Survey (NHANES) reported that Americans have kept their mean intakes of SFA above 10 %TE and of PUFA above 6 %TE in past decades( 50 ). In contrast, recent data from Japan, Bangladesh, South Korea and India reported their mean SFA intakes were below 10 %TE( Reference Harika, Eilander and Alssema 34 , Reference Choudhary, Grover and Javed 52 , Reference Maruyama, Nakano and Shima 53 ). The explanation for this difference between Western and Asian countries might be the different food sources of dietary fat. For instance, Chinese consume their fat primarily from vegetable oils and secondly from animal oils and meat foods; on the contrary, Westerners ingest fat primarily from dairy, butter and meat food, and secondly from vegetable oils( Reference Linseisen, Welch and Ocke 32 , Reference Eilander, Harika and Zock 33 , Reference Li, McNulty and Tiernery 36 , Reference Pot, Prynne and Roberts 54 ). Vegetable oils were reported as showing an increased consumption over time in China and India( Reference Choudhary, Grover and Javed 52 , Reference Zhai, He and Ma 55 , Reference Li, Rao and Kong 56 ), the mean intake of vegetable oils in European countries also showed a growing trend in the past, while the percentage of vegetable oils in total edible oils reached a higher level in China than in these countries (approximately 85 % v. less than 50 %)( Reference Elmadfa, Meyer and Nowak 38 , 57 ).
The very low intakes of EPA and DHA reported here are in line with the result of the Minnesota Heart Survey( Reference Honors, Harnack and Zhou 39 ). During the whole survey period, mean intakes of EPA plus DHA remained below 30 mg/d, which is far less than the reported intakes of 80 to 1189 mg/d in Europeans( 3 , Reference Elmadfa, Meyer and Nowak 38 , Reference Micha, Khatibzadeh and Shi 40 ), 90 to 150 mg/d in Americans( Reference Honors, Harnack and Zhou 39 , Reference Ervin, Wright and Wang 58 ), nearly 1000 mg/d in Japanese( Reference Micha, Khatibzadeh and Shi 40 ) and the FAO/WHO’s acceptable macronutrient distribution range of 0·25–2 g/d( 9 ). Such low intakes of EPA and DHA imply that Chinese people have to synthesize them de novo from α-linolenic acid to meet the physiological requirement. The main source of EPA and DHA is fish, shellfish and molluscs; as compared with other animal foods, consumption of these are very low in Chinese, accounting for no more than 20 % of the total intake of animal foods according to data from the China Nation Bureau of Statistics over the past two decades( 57 ). The present data on EPA, DHA and fish and seafood consumption reflect the Chinese long-term and traditional dietary pattern. In considering the unknown efficiency of EPA and DHA synthesis in the body of Chinese people, which might undergo a metabolic adaptation to the habitual dietary pattern which can be up-regulated possibly( Reference Sergeant, Hugenschmidt and Rudock 59 – Reference Li, Lin and Ma 61 ), caution should be taken before recommending to Chinese people an allowance of dietary DHA and EPA, as per FAO/WHO( 9 ), European( 3 ) and American( Reference McGuire 10 ) guidelines, without available and sufficient fish and seafood supply and scientific evidence. Generally, over the period 1997–2011, with 5 %TE addition of total fat, Chinese people ingested a smaller amount of energy from SFA with slow growth and a greater amount of energy from PUFA with modest growth in comparison with Europeans and Americans. Chinese people had very low intakes of EPA and DHA in comparison with Europeans, Americans and Japanese.
High dietary fat intake is thought to be a risk factor for chronic diseases( 3 , Reference Skeaff and Miller 62 , Reference Mente, De and Shannon 63 ). The increase in incidence of chronic diseases in China over the past decades is partly attributed to the changing amount of dietary fat( 64 ). However, this suggestion overlooked the evidence that the type and food sources of fat consumed are more meaningful than the total fat amount in the relationship of dietary fat with chronic diseases( Reference Hu, Manson and Willett 8 , Reference Voon, Ng and Lee 65 – Reference Willett 69 ). This relationship, as well as the deteriorative effects of SFA( Reference Summers, Fielding and Bradshaw 70 , Reference Söderström, Rosenblad and Adolfsson 71 ) and protective effects of PUFA( Reference Sanders 72 ) and marine n-3 fatty acids( Reference Willatts, Forsyth and Agostoni 73 ), in Chinese people then need to be re-examined in the context that dietary fat is dominated by vegetable oils. It should be analysed if Chinese people suffer different risk of chronic diseases compared with Westerners consuming more SFA and marine n-3 fatty acids; or compared with Japanese who consume plenty of marine n-3 fatty acids, PUFA and less SFA.
Our results, firstly, so far, demonstrate the trends in dietary fat and fatty acid intakes in China over nearly 15 years in the same large population of China. Besides, we showed the intakes of EPA and DHA and their trends, which are scantily reported in previous studies in China to our knowledge. In future, our research could make up for information deficiency about dietary intakes of fatty acids, which may provide a reference for related public policies in China.
In the present study, there are some limitations that must be acknowledged. The Chinese State Statistical Office did not share their sample frame with the CHNS team when the survey was planned and implemented, although the design used extant census data as best as it could for a multilevel random sampling. As a result, our data are not nationally representative of China. In recent years, the types of food consumed in the Chinese diet have increased gradually and although the food composition databank has been updated, it cannot contain all foods. Besides, the information on fatty acids in our food composition databank is incomplete, which could also lead to underestimation of intakes of some fatty acids and even a lack of information on some specific fatty acids, such as trans-fatty acids.
Conclusion
Our study shows different dietary intakes and profile of fatty acids in Chinese adults from that reported in people of other countries. Over the years from 1997 to 2011, Chinese adults ingested more fat mainly from annually growing intakes of vegetable oils, resulting in more intake of PUFA, and less fat from low intakes of animal oils, resulting in percentage of energy from SFA being relatively low and growing slowly; and their dietary EPA and DHA intakes remained very low throughout survey period as a result of low consumptions of fish and seafood.
Acknowledgements
Acknowledgements: This research used data from the China Health and Nutrition Survey (CHNS). The authors thank the National Institute of Nutrition and Food Safety, China Center for Disease Control and Prevention; the Carolina Population Center, University of North Carolina at Chapel Hill; the National Institutes of Health (NIH; grant numbers R01-HD30880, DK056350 and R01-HD38700); and the Fogarty International Center, NIH for financial support for the CHNS data collection and analysis files from 1989 to 2006; and both parties plus the China–Japan Friendship Hospital, Ministry of Health for support for CHNS 2009 and future surveys. Financial support: This research received no specific grant from any funding agency in the public, commercial or not-for-profit sectors. Conflict of interest: None. Authorship: X.S. conducted data collating and analysed the data, and wrote the manuscript. A.P.F designed the study, conducted data collating, scheduled the statistical analysis, and critically revised the manuscript. J.J.H. conducted data collating and advised on statistical analysis. Z.Q.L., M.H.G. and R.G. contributed to editing of the final version of the manuscript. K.J.L. critically revised the manuscript, and had the primary responsibility for the final content. All authors read and approved the final manuscript. Ethics of human subject participation: This study was conducted according to the guidelines laid down in the Declaration of Helsinki and all procedures involving human subjects/patients were approved by the institutional review committees of the University of North Carolina at Chapel Hill and the Chinese Center for Disease Control and Prevention. Written informed consent was obtained from all subjects/patients.


