


Introduction
Health administrative databases provide rich sources of information at low-cost for stroke research through passive population-based data collection. Administrative data have been used for evaluations of stroke hospitalization rates and re-admissions, outcomes such as mortality and home time, changes in stroke systems of care, and temporal trends. Reference Yu, Holodinsky and Zerna1 A major limitation of administrative data is the lack of detailed information on stroke severity, which is a crucial predictor of outcomes. Reference Rost, Bottle and Lee2–Reference Smith, Shobha and Dai4 Inability to account for stroke severity limits risk adjustment in hospital or population-based studies and may exaggerate associations of risk factors or covariates such as age, sex, and co-morbidities with stroke outcomes Reference Fonarow, Pan and Saver5 . Chart abstraction or linkage with clinical registries may provide stroke severity measures such as the National Institutes of Health Stroke Scale (NIHSS) but these methods are costly, not available for large populations, and vulnerable to missing data. Reference Thompson, Luo, Gardiner, Burke, Nickles and Reeves6
The Passive Surveillance Stroke Severity (PaSSV) indicator was developed in Ontario, Canada, using exclusively variables available in healthcare administrative datasets. Its inclusion in models resulted in greater predictive value for 30-day case fatality compared to not using a stroke severity measure. Reference Yu, Austin and Rashid7 However, PaSSV has not been validated outside of Ontario.
We sought to externally validate the PaSSV indicator in Alberta, Canada, using a population-based administrative dataset with linkages to a clinical acute stroke registry and outcomes of case fatality and home time.
Methods
Setting
The study was conducted in the province of Alberta, Canada, from 2007 to 2018. The adult population of Alberta in 2018 was 3,340,585. The Alberta Health Care Insurance Plan provides medical coverage to most (99%) Alberta residents except for the members of the military, federal inmates, individuals who opt out of the Alberta Health Care Insurance Plan, and the Royal Canadian Mounted Police. The administrative health databases were linked deterministically by use of the unique personal health number.
Study Sample and Administrative Data Sources
We used the Canadian Institutes for Health Information (CIHI) Discharge Abstract Database (DAD) to identify hospital admissions and the CIHI-National Ambulatory Care Reporting System (NACRS) to identify ED visits for first acute ischemic stroke or intracerebral hemorrhage (ICH) in Alberta between January 1, 2007, and December 31, 2018, using International Statistical Classification of Diseases and Related Health Problems, Tenth Revision, Canada, most responsible diagnosis codes [ischemic stroke: I63.x (excluding I63.6), I64.x, H34.1; ICH: I61.x]. We did not include those with subarachnoid hemorrhage, due to substantially differing etiologies, care pathways, and outcomes. We included patients with hospital admission and used information from both ED visits and admissions to calculate PaSSV. Diagnostic codes for stroke hospitalization have excellent positive predictive value in Canada. Reference Porter, Mondor, Kapral, Fang and Hall8 Information on long-term care was obtained from the Provincial Continuing Care Information System and on rehabilitation from the National Rehabilitation System. Date of death was obtained from the Canadian Vital Statistics Database.
We excluded patients < 18 or > 105 years of age at stroke onset, those with elective admissions, with in-hospital stroke events, and those with a prior diagnosis of stroke in a 5-year washout period between 2002 and 2006. We excluded individuals who were not registered in the Alberta Provincial Registry during the three years prior to stroke admission to ensure we did not include individuals with a recent stroke in another jurisdiction.
PaSSV
Stroke severity was estimated for hospitalized patients using PaSSV, Reference Yu, Austin and Rashid7 which was calculated from 12 variables extracted from the chart by administrative coders and available at hospital presentation or admission (NACRS and/or DAD): age, sex, triage score, arrival by ambulance, transfer to a stroke center, ataxia, decreased level of consciousness, mechanical ventilation within 2 days, and speech, visual, motor, or sensory symptoms. PaSSV was validated against data from the Ontario Stroke Registry. We used coefficients that allowed estimation of Canadian Neurological Scale (see Supplemental Table 1 for more information on variable derivation and coefficients), where a lower score indicates greater stroke severity.
Covariates
Administrative databases were used to obtain age, sex, stroke type, and Charlson co-morbidity index. Reference Charlson, Pompei, Ales and MacKenzie9 Co-morbidities were obtained using validated algorithms in a 3-year look-back window of hospital records prior to the index stroke. We calculated the Charlson index using weights derived for ischemic stroke patients Reference Hall, Porter, Quan and Reeves10 (Supplemental Table 2). We also identified atrial fibrillation as it is not included in the Charlson index. There are two comprehensive stroke centers (CSC) in Alberta, and we identified whether patients had been admitted or transferred to a CSC at any time during their episode of care.
Outcomes
Our primary outcome was 30-day case fatality. We chose this primary outcome as stroke severity is the most important predictor of 30-day mortality after stroke Reference Rost, Bottle and Lee2 and because previous publications have shown the importance of accounting for stroke severity to accurately compare 30-day mortality from different hospitals. Reference Fonarow, Pan and Saver5,Reference Fonarow, Saver and Smith11 Our secondary outcomes were 1-year case fatality and 90-day home time, which is a patient-centered outcome valued by patients with stroke and other conditions. Reference Xian, O’Brien and Fonarow12–Reference Barnett, Grabowski and Mehrotra14 Home time was defined as the number of nights spent outside of healthcare institutions within 90 days of the index admission to acute care hospital, and this outcome is associated with global disability after stroke. Patients who died in hospital after the index stroke have a home time of zero days. We used home time cutoff values of ≥80 days and <50 days as these thresholds correlate roughly with modified Rankin score of 0–1 (excellent outcome) and 3–6 (dependent or dead), Reference Yu, Austin and Rashid7 respectively.
NIHSS Subsample with QuICR Linkage
The Quality Improvement and Clinical Research (QuICR) Alberta Stroke Program initiative began on April 1, 2015. QuICR included patients with ischemic stroke who received intravenous thrombolysis and/or endovascular thrombectomy, and hospital stroke coordinators recorded baseline NIHSS after admission. Deterministic data linkage between the QuICR registry and administrative databases was done in the available years of QuICR using unique patient identifiers assigned to all people in Alberta.
Analysis
For baseline characteristics, we determined crude rates for categorical variables and means for continuous variables. We conducted two main analyses for validation of PaSSV. Firstly, we used the entire administrative dataset from 2007 to 2018. We used Cox proportional hazard models to determine the association between baseline covariates and 30-day case fatality, with and without the inclusion of PaSSV. Covariates included in the model were age (continuous), sex, stroke type (ischemic or ICH), center type (CSC vs. non-CSC), Charlson co-morbidity index (2+ vs. 0–1), and atrial fibrillation. We obtained Harell’s C-statistic and 95% confidence intervals (CI) to assess model fit with and without PaSSV. The same analysis was completed for 1-year case fatality. We also evaluated the change in adjusted hazard ratios (aHR) for each covariate with the addition of PaSSV.
Using logistic regression, we evaluated the association between the same variables and ≥80 days of home time or <50 days of home time, with and without the addition of PaSSV. We obtained C-statistics with 95% CI from the logistic models. We also obtained pseudo R2 as a measure of explained variation for the logistic models.
In the QuICR subsample, we performed the same regression analyses as above and compared the C-statistic of models with no stroke severity, and models with PaSSV, models with baseline NIHSS.
Statistical analysis was performed in Stata 17.0 (College Station, TX). The use of data in this project received research ethics approval from the University of Calgary research ethics board.
Results
We included 28,672 patients in the overall sample admitted with acute stroke (see Supplemental Figure 1 for patient flowchart). Mean age was 71.9 (SD 14.5), 47.0% were female, and 12.2% had ICH. Mean PaSSV was 7.7 (SD 1.9), 13.1% died at 30 days, and mean 90-day home time was 47.7 days (SD 37.4; Table 1). Outcomes stratified by each PaSSV component are shown in Supplemental Table 3. Among those in NIHSS subsample (treated with thrombolysis or EVT), the prevalence of each PaSSV component stratified by NIHSS score is shown in Supplemental Figure 2. All components had higher prevalence with greater NIHSS except ataxia and sensory symptoms, in which there was a lower prevalence. Ataxia, visual, sensory, and decreased LOC had the lowest prevalence (<10%).
Baseline characteristics of patients in overall sample and NIH subsample
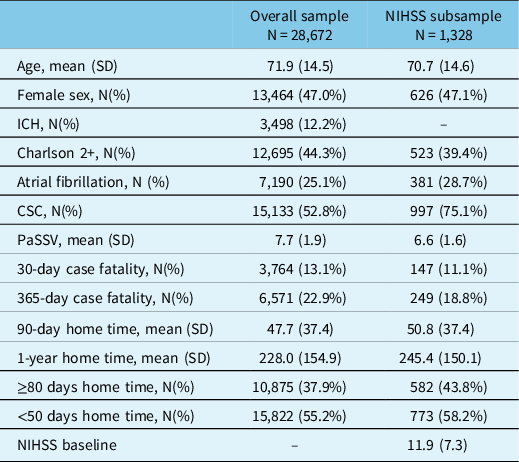
CSC indicates Comprehensive Stroke Centre, PaSSV indicates Passive Surveillance Stroke Severity Indicator (lower score indicates greater estimated stroke severity), ICH indicates intracerebral hemorrhage, NIHSS indicates National Institutes of Health Stroke Scale.
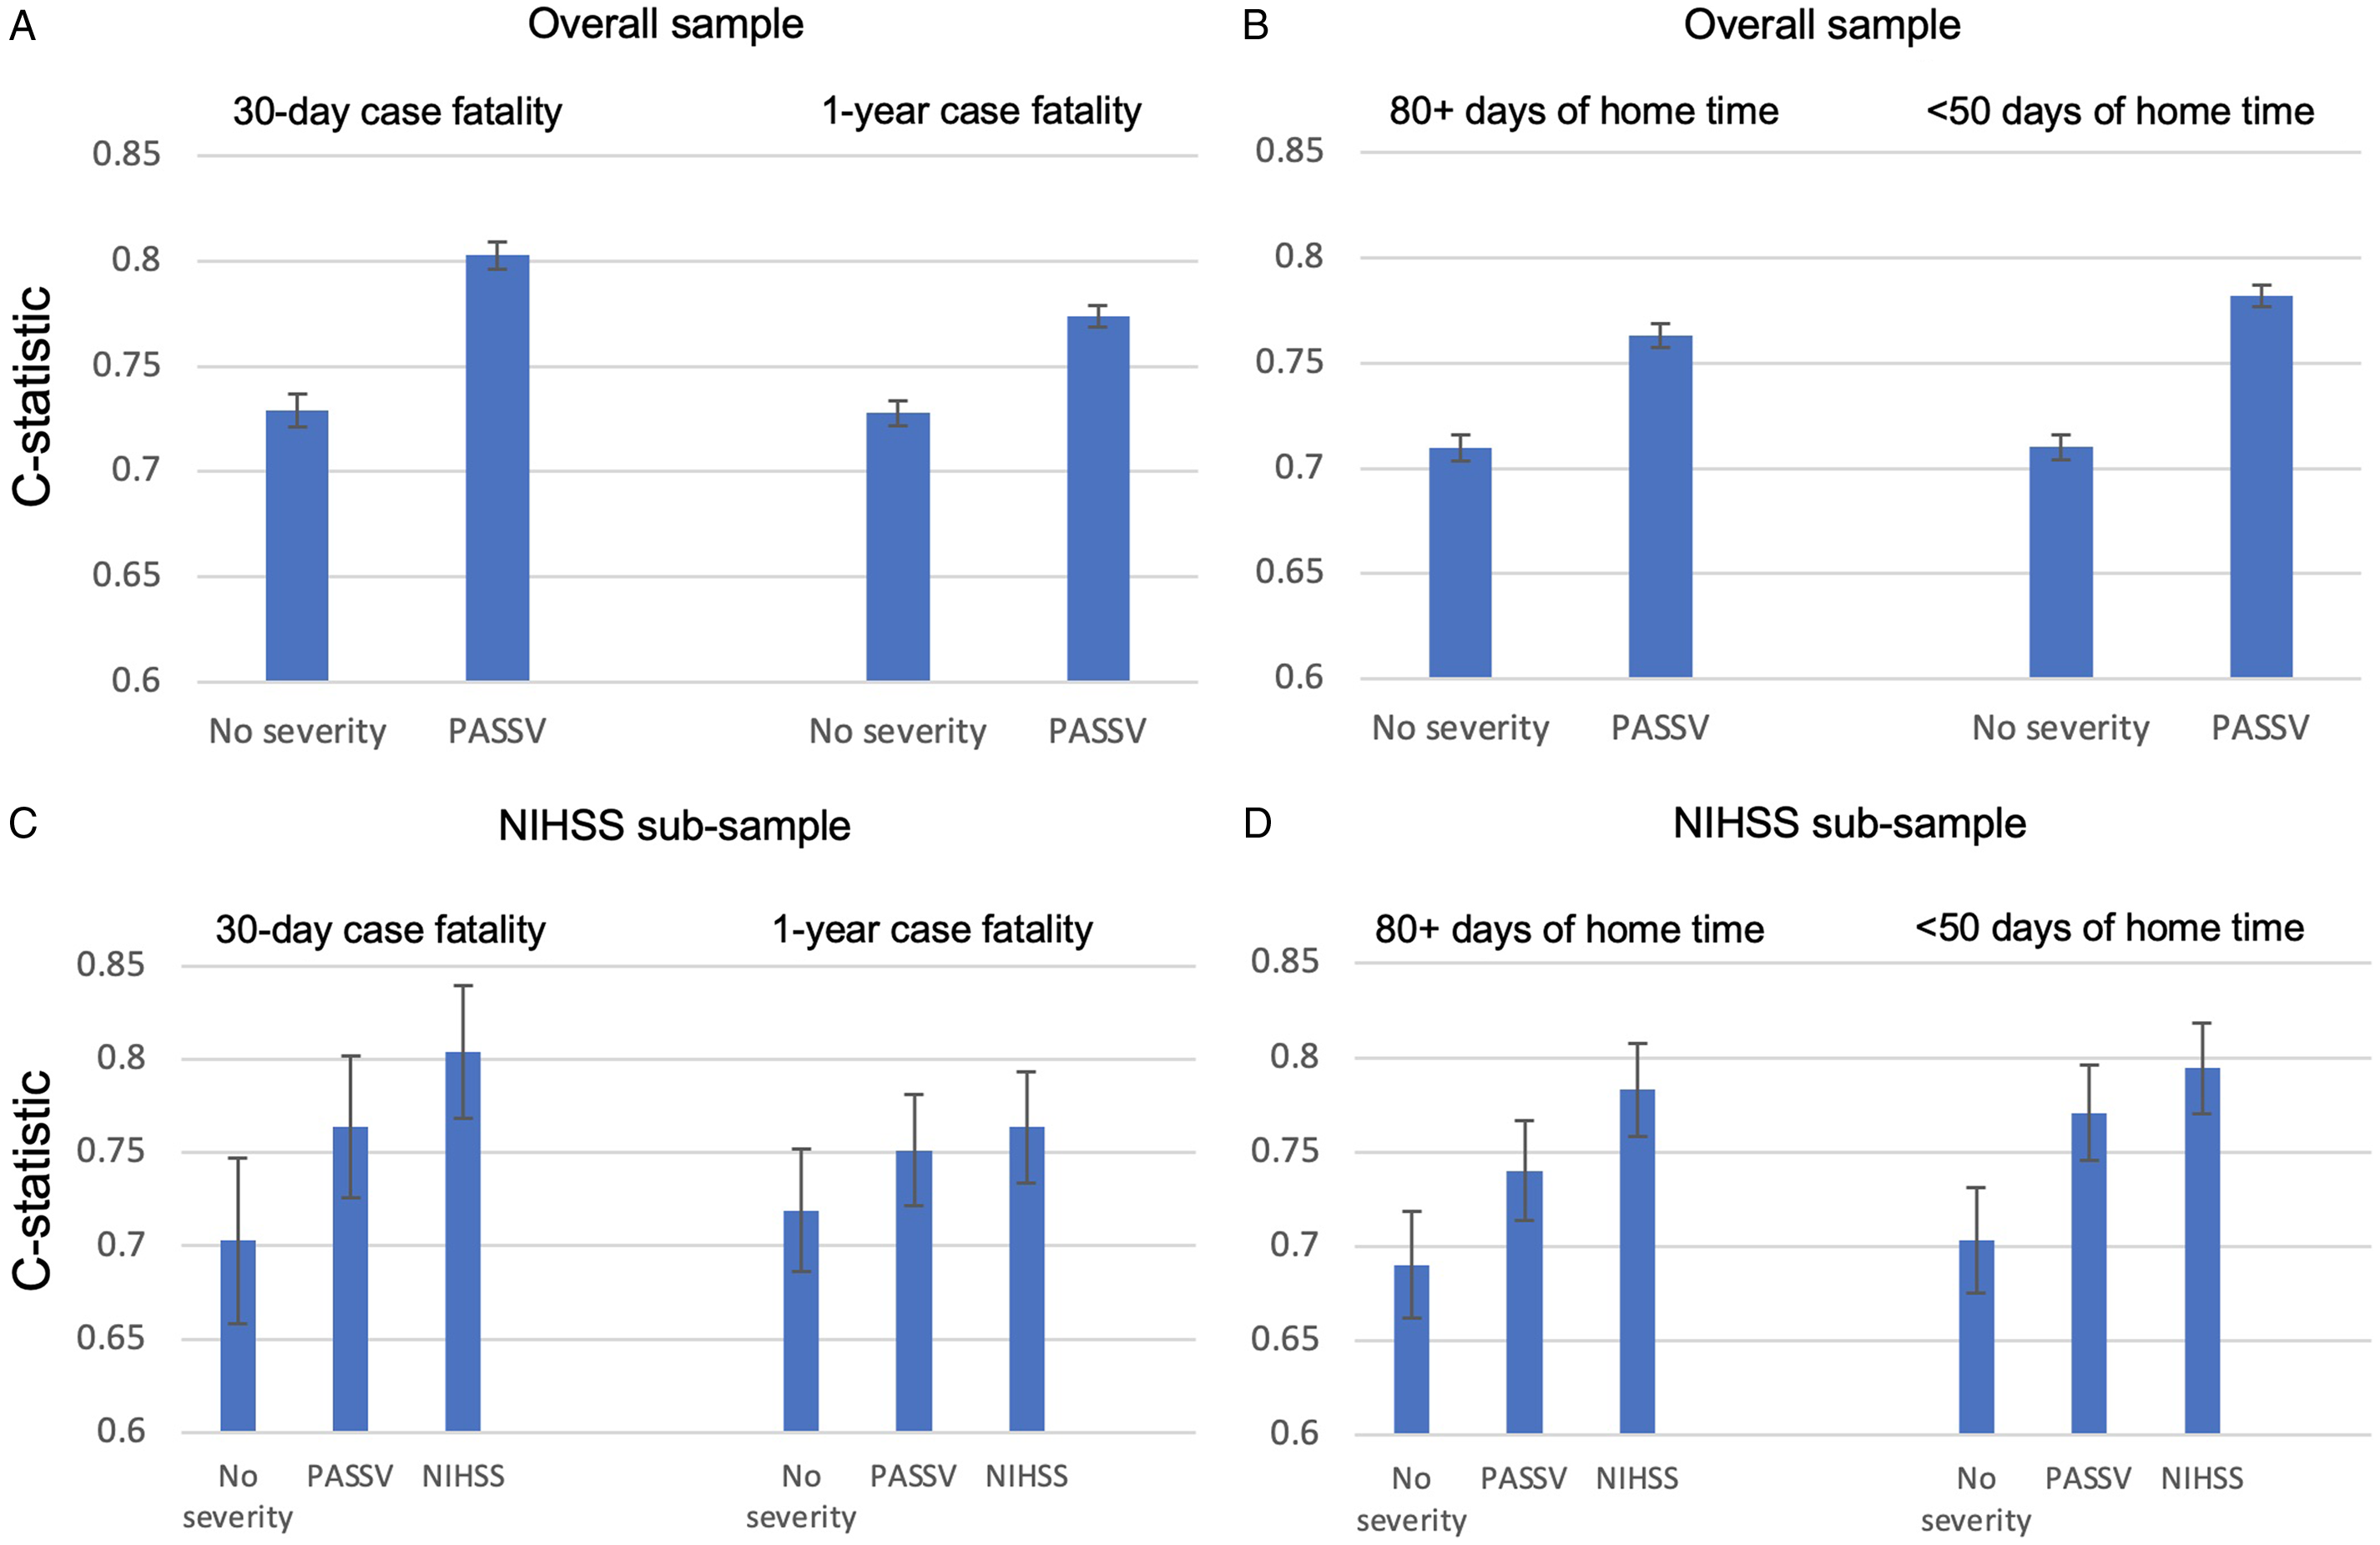
In the Cox model without PaSSV, older age, female sex, ICH, admission to CSC, Charlson score 2+, and atrial fibrillation were associated with higher 30-day case fatality (Table 2). The C-statistic increased when adding PaSSV to the model for 30-day case fatality (from 0.72 [95% CI 0.72–0.74] to 0.80 [95% CI 0.80–0.81]) and for 1-year case fatality (Figure 1A). Adding PaSSV to the model attenuated the strength of associations with case fatality for age, sex, and ICH. Without PaSSV, admission to CSC was not associated with case fatality (aHR 1.03 [95% CI 0.96–1.10]), but risk adjustment with PaSSV showed that admission to CSC was associated with lower case fatality (aHR 0.72 [95% CI 0.67–0.77]). Similar observations were found in the models for 1-year case fatality (Table 2).
C-statistics and 95% confidence intervals for all models. C-statistic increases when adding PaSSV compared to no stroke severity for case fatality (A) and home time (B) in the overall sample, and in the NIHSS subsample (C-D), and inclusion of NIHSS resulted in the greatest discrimination.
Hazard ratios for 30-day and 1-year case fatality after acute stroke from Cox proportional hazard models, comparing models with and without PaSSV
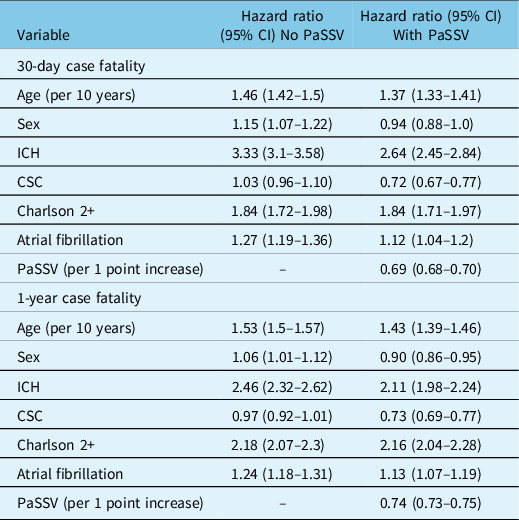
CSC indicates Comprehensive Stroke Centre, PaSSV indicates Passive Surveillance Stroke Severity Indicator, lower PaSSV indicates higher stroke severity, ICH indicates intracerebral hemorrhage.
In the logistic models, older age, female sex, ICH, Charlson 2+, and atrial fibrillation were associated with lower odds of ≥ 80 days of home time (Table 3). The C-statistic increased when adding PaSSV for ≥ 80 days of home time (from 0.71 [95% CI 0.70–0.72] to 0.76 [95% CI 0.76–0.77] and for < 50 days of home time (Figure 1B). Adding PaSSV to the model attenuated the strength of association with home time for age, sex, and ICH (Table 3). In addition, admission to a CSC was associated with higher odds of ≥ 80 days of home time after addition of PaSSV. The greatest magnitude of change was for CSC (change from adjusted odds ratio 1.15 [95% CI 1.09–1.21] to 1.67 [95% CI 1.58–1.76]; Table 3). The impact of adding PaSSV on the CSC association was similar for <50 days of home time (Table 3), with a reversal from higher odds to lower odds.
Odds ratios for ≥ 80 days and < 50 days of home time after acute stroke from logistic regression models, comparing models with and without PaSSV
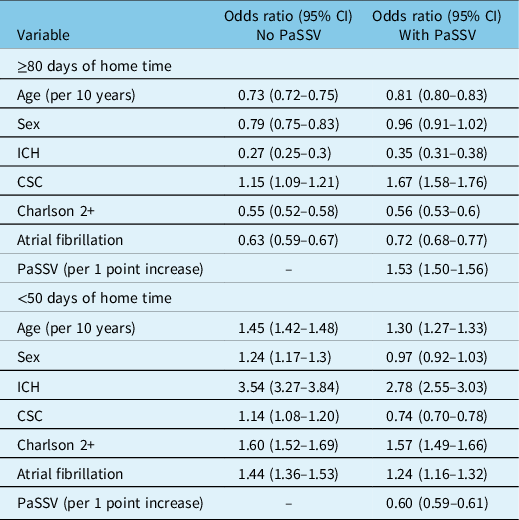
CSC indicates Comprehensive Stroke Centre, PaSSV indicates Passive Surveillance Stroke Severity Indicator, lower PaSSV indicates higher stroke severity, ICH indicates intracerebral hemorrhage.
In the NIHSS subsample (N = 1,328), the C-statistic for 30-day case fatality increased sequentially from the model with no stroke severity (0.70 [95% CI 0.66–0.75]), to the model with PaSSV (0.76 [95% CI 0.73–0.80]), to baseline NIHSS (0.80 [95% CI 0.77–0.84]; Figure 1C). This gradient was similar for 1-year case fatality (Figure 1C), for ≥80 days of home time, and for <50 days of home time (Figure 1D). For home time, pseudo R2 values increased with the addition of PaSSV, and further with NIHSS, implying a greater degree of explained variation (Supplemental Table 4).
Discussion
We demonstrated that PaSSV can be used as an indicator to estimate baseline stroke severity using a population sample external to that in which PaSSV was originally derived. In a population-based administrative dataset and a clinical registry subset, we found that model discrimination for mortality and home time was improved with the addition of PaSSV, and coefficients of covariates associated with outcomes were meaningfully altered, particularly those for admission to a CSC.
Accounting for stroke severity in studies of stroke outcomes is important for multiple reasons. First, accounting for stroke severity results in substantial re-classification of hospital-level performance based on mortality rates and is important in the interpretation of inter-hospital differences. Reference Fonarow, Pan and Saver5,Reference Katzan, Spertus and Bettger15 In our study, prior to accounting for stroke severity, admission to a CSC was not associated with case fatality. However, including PaSSV in the model resulted in a strong association between CSC and lower case fatality. This finding emphasizes the differences in case-mix of patient population treated in hospitals with different levels of care and the importance of risk adjustment when ranking institutions or center type. This is in line with a statement from the American Health Association/American Stroke Association highlighting the importance of including stroke severity to obtain risk-adjusted outcomes when comparing the quality of stroke care at different hospitals. Reference Katzan, Spertus and Bettger15 Second, stroke severity, along with age, is the strongest predictor of mortality and disability. Reference Rost, Bottle and Lee2–Reference Smith, Shobha and Dai4 The impact of confounding by stroke severity was evident in our analysis given the significant attenuation of hazard ratios for older age and ICH after PaSSV was added to the models. Third, studies of stroke systems of care, such as temporal trends or disparities in access to stroke services, Reference Kamel, Parikh and Chatterjee16,Reference Joundi, Smith, Yu, Rashid, Fang and Kapral17 may be confounded by stroke severity, and therefore, having a stroke severity measure is ideal for appropriate interpretation of results.
Our results are compatible with a recent study of administrative data in Australia, showing a c-statistic of 0.80 for 30-day mortality using a model incorporating age, sex, prior stroke, socioeconomic status, co-morbidities, arrival by ambulance and urgent triage status. With the addition of the Glasgow Coma Scale, the c-statistic increased to 0.83. A strength of our study is the comparison of model performance between PaSSV and NIHSS. The PaSSV indicator can be derived from passively collected administrative data variables available on admission or within 2 days of hospital admission. Improvements in C-statistic for 30-day case fatality in this study (0.72 to 0.80) were similar to the original derivation (0.69 to 0.76). Reference Yu, Austin and Rashid7 In addition, we show a strong association between the PaSSV indicator and lower home time. Home time is a feasible, objective measure that has been validated as a proxy for functional outcome after stroke in multiple jurisdictions. Reference Yu, Rogers and Wang21–Reference Gattellari, Goumas, Jalaludin and Worthington26 However, stroke severity is strongly associated with home time, Reference Yu, Fang, Porter, Austin, Smith and Kapral24,Reference Holodinsky, Yu, Kapral and Austin27 and therefore, accounting for stroke severity is important for interpretation of home time trends and associations. The demonstration that PaSSV improves predictive value for home time adds construct validity to PaSSV as an estimate of the latent variable of stroke severity.
There were some limitations to this work. Firstly, this validation study was conducted in the same country as the original work but using data from a difference province. Although healthcare in Canada is administered provincially, Alberta has many similarities to Ontario including universal healthcare system and similar diagnostic coding practices. Further studies would be needed to validate PaSSV outside of Canada. Second, the linked registry for the sub-analyses using the NIHSS included only those who received thrombolysis and thrombectomy and therefore only included patients with ischemic stroke and had a bias for more severe strokes. Nevertheless, there were similar improvements in discrimination with PaSSV in the overall dataset and subset of patients with NIHSS. Third, certain variables in the PaSSV indicator are reflections of stroke systems of care. Two variables within PaSSV are particularly dependent on the local stroke system of care: transfer of care and triage acuity category. While we validated PaSSV in a different province, the stroke systems between Alberta and Ontario are likely quite similar compared to other jurisdictions. External validation in other stroke systems would be warranted before widespread use due to the possibility of substantially different processes of care, such as transfers versus bypasses and acuity level. The association between presence of ataxia, visual deficits, and sensory symptom codes and lower severity stroke has multiple potential explanations. In severe strokes with motor deficits and aphasia, the presence of sensory, visual, or ataxic symptoms may be less likely to be documented by the physician. This may be due to reduced relevance of documenting these symptoms in context of a large hemispheric stroke, difficulty in examination (i.e. sensory exam in a patient with severe aphasia), or absence of the symptom (i.e. no ataxia is present in a completely plegic limb). In an analysis of Alberta administrative data, physician documentation was the dominant factor in coding accuracy. Reference Yu, Quan, McRae, Wagner, Hill and Coutts28 Administrative data coders will also be less likely to document these symptoms in patients with severe stroke severity and complex hospital course and high mortality, and more likely to document in mild stroke with a short hospital admission. The Canadian coding standards endorse preferential coding of main diagnoses and co-morbidities that require additional treatment or increase the length of stay. 29 Therefore, symptoms may be less likely to be coded in those with more severe stroke due to lower likelihood of impacting the hospital stay. While this may lead to under-ascertainment of certain symptoms (given the low prevalence of those with visual, ataxia, and sensory symptoms in our sample which decreased further with higher NIHSS), these results reflect the current reality of stroke documentation and coding in Canada and could be the focus of further research to refine risk estimation in Canada and other jurisdictions. Fourth, it should be highlighted that the discrimination with PaSSV was lower than with NIHSS and that residual confounding by stroke severity likely persists with use of the PaSSV indicator. Clinical measures of stroke severity should be used in analyses of stroke outcomes wherever possible, but this information is often not available for large populations, or is frequently missing, Reference Smith, Shobha and Dai4 and when missing not randomly distributed leading to bias. Reference Thompson, Luo, Gardiner, Burke, Nickles and Reeves30
In summary, we demonstrate the utility of the PaSSV indicator in predicting and risk adjusting for important outcomes after acute stroke in a second Canadian province. This study provides further support for the use of PaSSV in stroke outcomes and health systems research.
Supplementary Material
To view supplementary material for this article, please visit https://doi.org/10.1017/cjn.2022.46
Funding
RAJ is supported by a Fellowship Grant from the Canadian Institutes of Health Research (Funding reference number MFE-164702). AY holds a Heart and Stroke Foundation of Canada National New Investigator Award.
Conflict of Interest
The authors have no conflicts of interest to declare.
Statement of Authorship
RA: Project conception, statistical analysis, writing of manuscript
JK: Acquisition of data, critical revision of manuscript
JS: Acquisition of data, critical revision of manuscript
DN: Acquisition of data, critical revision of manuscript
Michael Hill: Project conception, critical revision of manuscript
MK: Project conception, critical revision of manuscript
ES: Project conception, critical revision of manuscript
AY: Project conception, critical revision of manuscript


 Open access