


Introduction
Long-term care facilities are expected to provide high quality services, as are any other health service provider. The measurement and publication of performance data on long-term care services contributes to transparency and strengthens accountability to stakeholders, including clients and those providing oversight (Berta, Laporte, & Wodchis, Reference Berta, Laporte and Wodchis2014), and may lead to quality improvement (Mor, Reference Mor2005).
Several theoretical frameworks describe the potential role of public reporting of performance data on improvement in health care. Berwick, James, and Coye (Reference Berwick, James and Coye2003) identified two pathways by which public reporting improves health system performance: a selection pathway and a change pathway. The selection pathway refers to the effects of market forces, whereby well-informed patients choose the better performing providers, increasing their market share and thus improving system performance on average. The change pathway represents improvements resulting from changes within health care institutions as a consequence of public reporting. A number of authors have expanded on these pathways, challenging some of the underlying assumptions (Contandriopoulos, Champagne, & Denis, Reference Contandriopoulos, Champagne and Denis2014; Levesque & Sutherland, Reference Levesque and Sutherland2017). A notable example is the addition of a reputation pathway, where concerns about the reputation of health care institutions, rather than the trust and altruism postulated to underlie the change pathway, are considered to motivate changes (Bevan, Evans, & Nuti, Reference Bevan, Evans and Nuti2019; Hibbard, Stockard, & Tusler, Reference Hibbard, Stockard and Tusler2003).
The actual impact of public reporting of performance data on quality improvement is a topic of scientific debate. Recent systematic reviews found that available evidence is often of low quality and suggests a limited role for the publication of performance data on quality improvements (Campanella et al., Reference Campanella, Vukovic, Parente, Sulejmani, Ricciardi and Specchia2016; Fung, Lim, Mattke, Damberg, & Shekelle, Reference Fung, Lim, Mattke, Damberg and Shekelle2008; Metcalfe et al., Reference Metcalfe, Rios Diaz, Olufajo, Massa, Ketelaar and Flottorp2018). However, these reviews also recognized that the design and implementation of a fit-for-purpose reporting system may impact its effects (Fung et al., Reference Fung, Lim, Mattke, Damberg and Shekelle2008). Reporting on performance is often broadly defined as “the release of information about quality of care” (Mukamel, Weimer, Spector, Ladd, & Zinn, Reference Mukamel, Weimer, Spector, Ladd and Zinn2008; Totten et al., Reference Totten, Wagner, Tiwari, O’Haire, Griffin and Walker2012; Werner, Konetzka, & Polsky, Reference Werner, Konetzka and Polsky2016). However, a wide range of information might constitute performance data. For example the five-star quality rating of nursing homes used in the United States is based on quality measures, staffing, and regulatory deficiencies (Konetzka, Yan, & Werner, Reference Konetzka, Yan and Werner2020). Both the content of performance reporting and the way that these data are reported may affect the impact of reporting on the groups that the reporting is aimed at (Fung et al., Reference Fung, Lim, Mattke, Damberg and Shekelle2008).
Research on the impact of public reporting on improvement often focuses on the selection pathway (Mukamel et al., Reference Mukamel, Weimer, Spector, Ladd and Zinn2008; Totten et al., Reference Totten, Wagner, Tiwari, O’Haire, Griffin and Walker2012; Werner et al., Reference Werner, Konetzka and Polsky2016). This pathway postulates a number of preconditions that are rarely met. For example, excess supply of long-term care beds is necessary to give users the opportunity to actually choose among providers. Another precondition is for providers to lose market share and eventually close their doors, as a consequence of the choices made by these users (Contandriopoulos et al., Reference Contandriopoulos, Champagne and Denis2014).
These preconditions are mostly lacking in Canada, where for the most part there is no excess in supply, particularly in the long-term care sector (Berta et al., Reference Berta, Laporte and Wodchis2014; Guru et al., Reference Guru, Fremes, Naylor, Austin, Shrive, Ghali and Tu2006; Ivers et al., Reference Ivers, Taljaard, Giannakeas, Reis, Williams and Bronskill2019). The choices of potential long-term care service users are limited by bed availability in long-term care facilities and sometimes by waiting times. It seems safe to assume that the selection pathway, which is based on market dynamics, does not play an important role in mediating the effects of public reporting of performance. This means that a study on the impact of public reporting of performance in long-term care facilities in Canada must focus on the other potential pathways of improvement support. We might even speculate that the long history of quality improvement in hospitals and long-term care in Canada (Guru et al., Reference Guru, Fremes, Naylor, Austin, Shrive, Ghali and Tu2006; Poss et al., Reference Poss, Jutan, Hirdes, Fries, Morris and Teare2008; Veillard, Tipper, & Allin, Reference Veillard, Tipper and Allin2015) has strengthened an improvement culture, making institutions more sensitive to pathways that are mostly internally driven, such as the change pathway.
Most of the long-term care facilities in Canada’s provinces and territories use the Resident Assessment Instrument Minimum Data Set (RAI MDS) to collect person-level clinical information (Hirdes, Mitchell, Maxwell, & White, Reference Hirdes, Mitchell, Maxwell and White2011). These data are submitted to the Canadian Institute for Health Information (CIHI) for inclusion in the Continuing Care Reporting System (CCRS) database. The data collection system is pan-Canadian, but the responsibility for the financing, organization, and regulation of competencies in long-term care is at the sub-national (provincial and territorial) level (Berta et al., Reference Berta, Laporte and Wodchis2014), creating a unique opportunity to compare data for long-term care facilities in different provincial/territorial long-term care systems.
The CCRS was launched in 2003, with provinces and territories in Canada progressively joining over the following years (Canadian Institute for Health Information, 2018; Hirdes et al., Reference Hirdes, Poss, Caldarelli, Fries, Morris and Teare2013). Initially, comparative quality measures were provided only to facilities and provincial/territorial governments via a private portal, where facilities and governments could create queries and compare performance with national and jurisdictional averages. There was no public reporting. The one exception was the province of Ontario, which used the CIHI data to publicly report four performance indicators at the facility level (new and worsened pressure ulcers, worsened incontinence, and falls) as of 2010. The indicator on use of restraints was added to the other four indicators later on, with reporting on it becoming compulsory since 2012 (Walker et al., Reference Walker, Shearkhani, Bai, McGilton, Berta and Wodchis2020). CIHI identified a subset of performance indicators for public reporting, which in June 2015 became part of the online portal Your Health System (YHS) (Canadian Institute for Health Information, n.d.). Data on 9 long-term care indicators were made publicly available at facility level, whereas an additional 10 indicators were made public as aggregates at jurisdiction (provincial/territorial) level. The remaining 16 indicators continued to be available to long-term care facilities and provincial/territorial governments, but not to the general public. We will refer to those as “privately” reported indicators. The YHS portal, which also includes performance reporting from other health settings, received considerable attention. An impact evaluation study performed at the time of the launch showed that key stakeholders found these performance reporting activities to be highly relevant, with 70 per cent feeling that these reporting activities directly informed initiatives in the stakeholders’ organizations (Canadian Institute for Health Information, 2015).
The key questions investigated are:
1. (a) Did trends in long-term care performance indicators change following public reporting? (b) Were the changes in publicly reported indicators consistent with trends for those that continued to be only privately reported?
2. (a) Did results vary when jurisdiction, size, urban/rural status, or corporation affiliation of the long-term care facilities were taken into account? (b) Were there differences in results when previous performance and previous performance trends were taken into account?
Methods
Data Source
This study uses facility-level data from the CCRS. The CCRS includes data from residential care facilities and hospital-based continuing care. Hospital-based continuing care was outside the scope of our study and hence these facilities are not included in our analysis. The data are primarily collected by residential long-term care facilities using the RAI-MDS version 2.0 (Canadian Institute for Health Information, 2018). The CCRS includes the following Canadian jurisdictions: Yukon, British Columbia, Alberta, Saskatchewan, Manitoba (only facilities in the area covered by Winnipeg Regional Health Authority), Ontario, Newfoundland and Labrador, New Brunswick, and Nova Scotia. A number of studies have confirmed the reliability and validity of the data collected using the RAI MDS instrument in Canada (Doupe et al., Reference Doupe, Poss, Norton, Garland, Dik, Zinnick and Lix2018; Hirdes et al., Reference Hirdes, Ljunggren, Morris, Frijters, Finne Soveri and Gray2008; Hirdes et al., Reference Hirdes, Poss, Caldarelli, Fries, Morris and Teare2013; Poss et al., Reference Poss, Jutan, Hirdes, Fries, Morris and Teare2008).
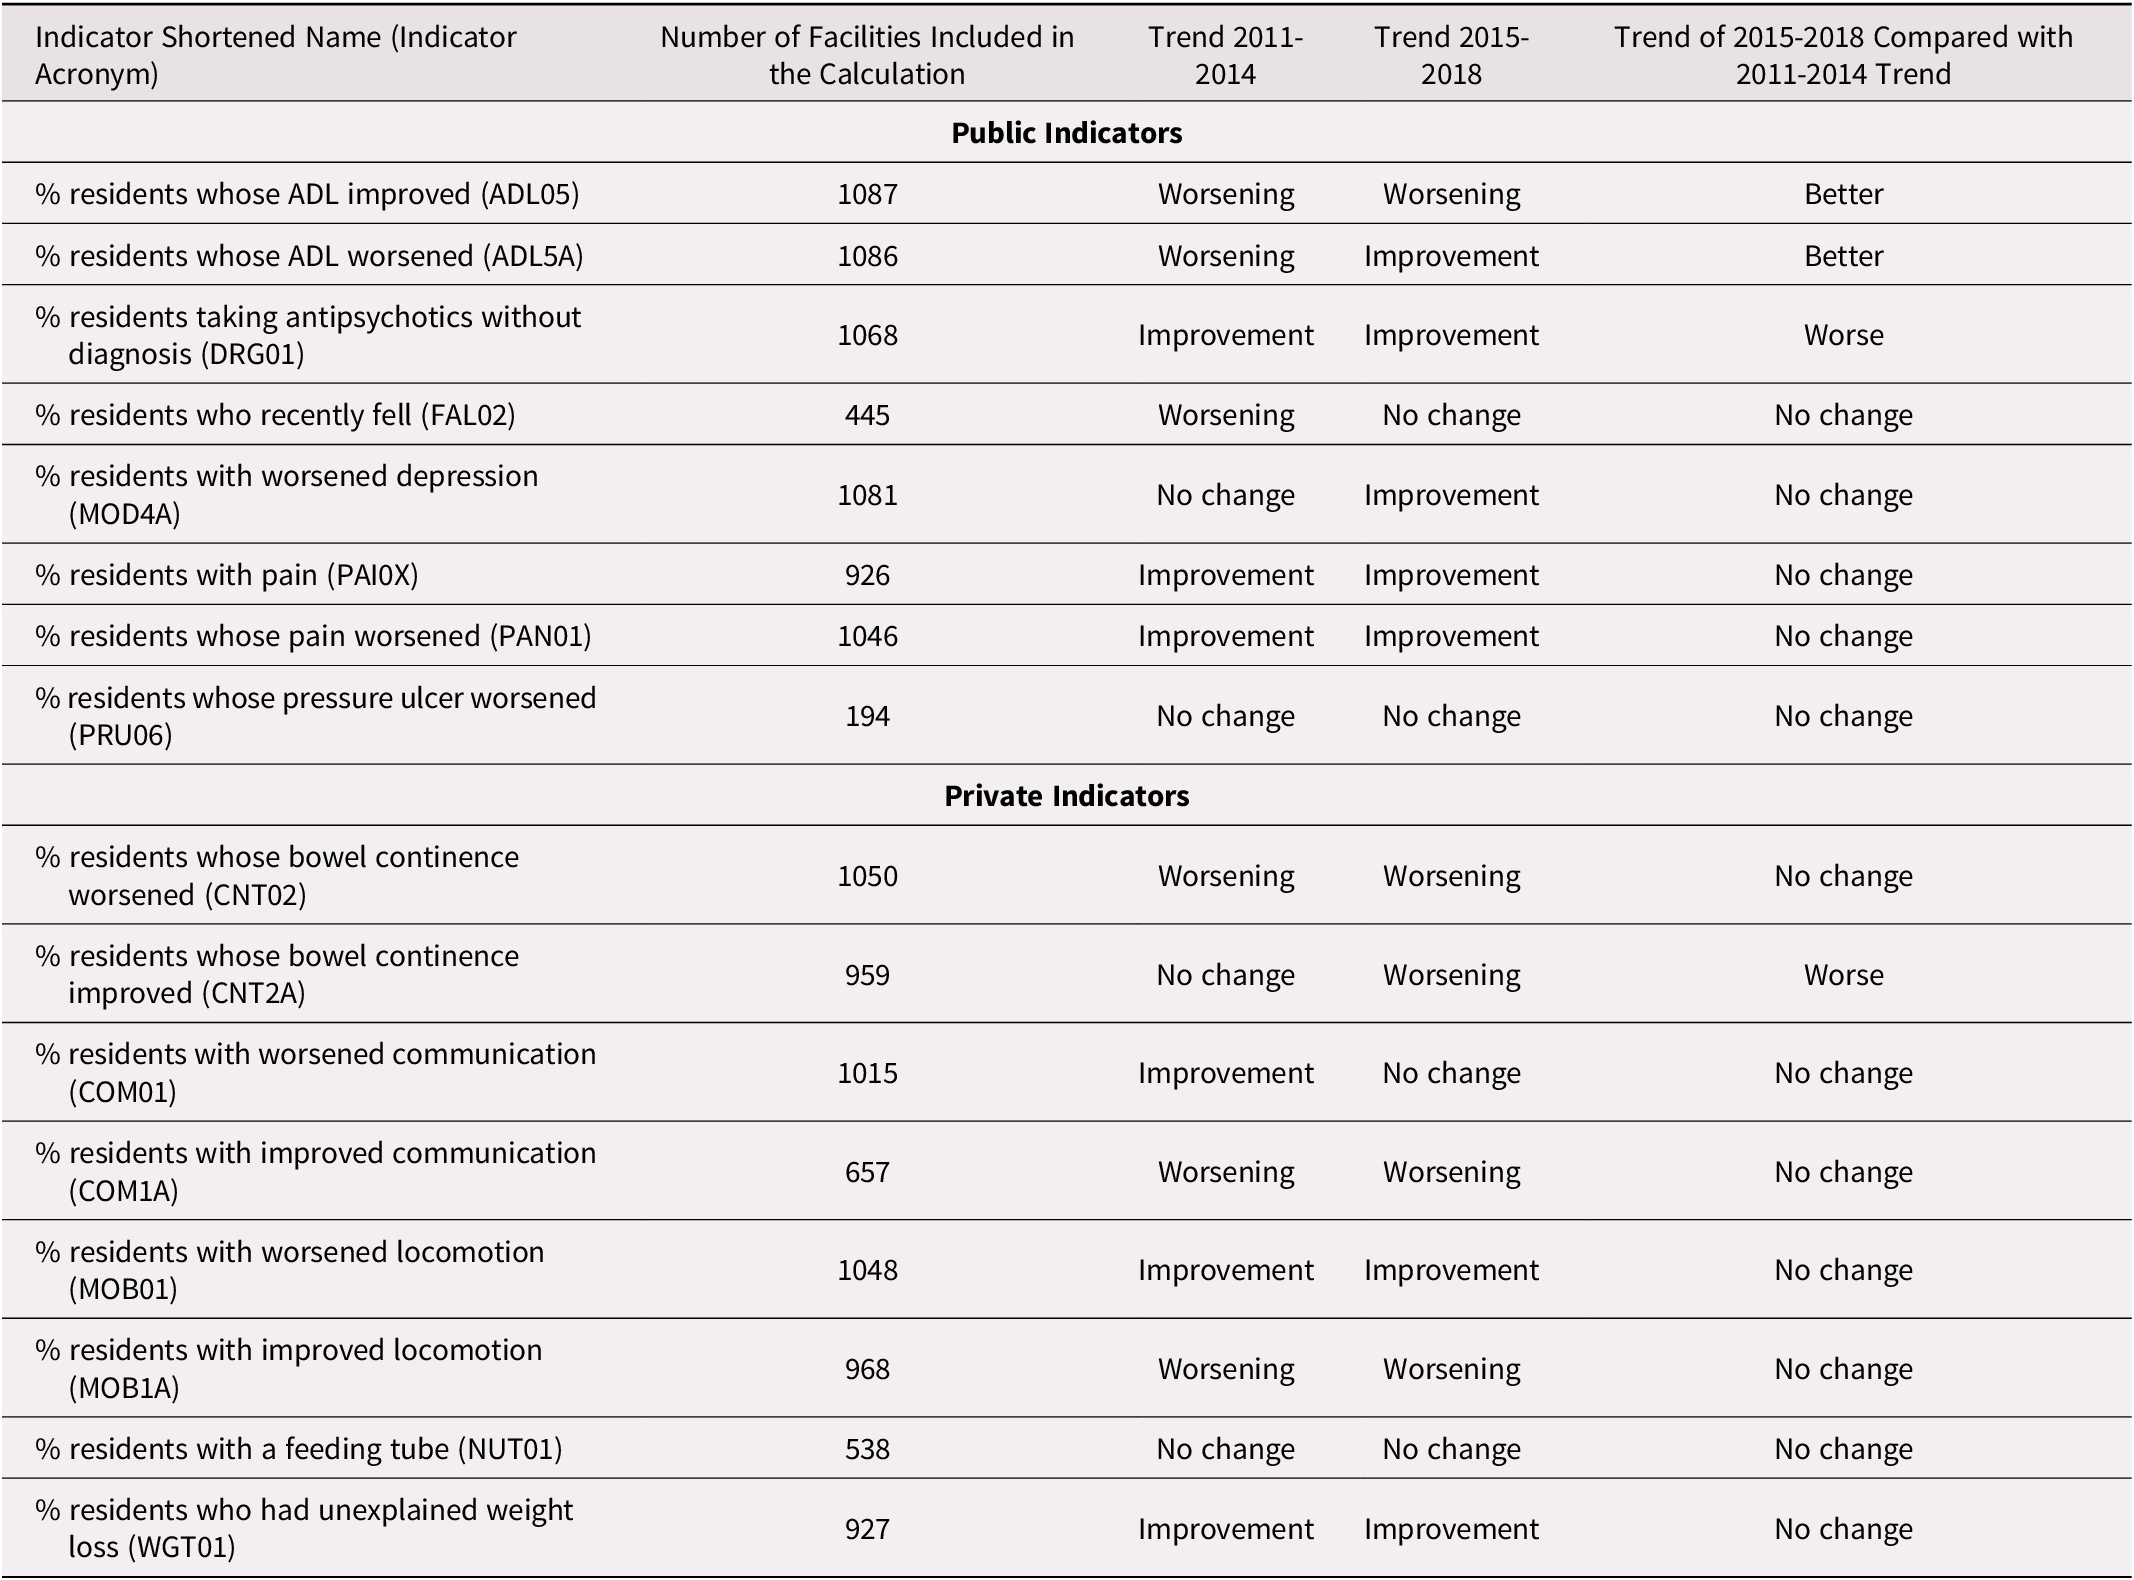
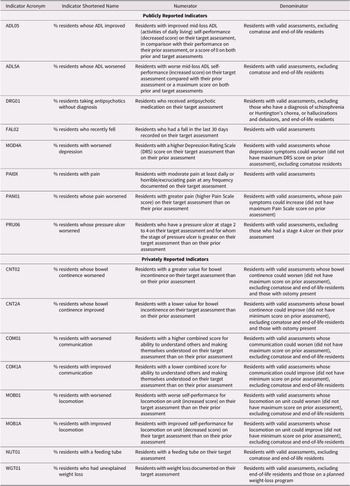
For our analysis, we selected eight publicly reported indicators. A ninth indicator (monitoring the use of restraints) was excluded because it was the subject of legislation and standards that were implemented at different times across the country (Alberta Health, 2018; Residential Care Regulation, 2009; Walker et al., Reference Walker, Shearkhani, Bai, McGilton, Berta and Wodchis2020). For comparison, we selected 8 out of a possible 16 indicators that were reported only privately. We selected the eight indicators that we considered to be the least related to the publicly reported indicators. For example, the indicator on new pressure ulcers (reported privately) was considered in its root causes too similar to the indicator on worsening pressure ulcers (reported publicly). Potential differences caused by public reporting would most likely be considerably mitigated by similar underlying levels of quality of care (Konetzka et al., Reference Konetzka, Yan and Werner2020). Within the selection of public and private indicators, several are closely related to each other. Two indicators are closely related to activities of daily living (ADL05, ADL5A), two are related to pain (PAI0X, PAN01), two to bowel continence (CNT02, CNT2A), two to communication (COM01, COM1A), and two to locomotion (MOB01, MOB1A). (The indicator acronyms are explained in Table 1.) It is unlikely that the performance of these indicator pairs are independent of each other. However, these indicator pairs are either both publicly or both privately reported. The full list of indicators included in the analysis is provided in Table 1 (Canadian Institute for Health Information, 2017).
List of indicators included in the analysis with short definitions

Note. Source: Canadian Institute for Health Information, 2017.
Data Analysis
Our data analysis was based on the indicators’ risk adjusted values. The details of the risk adjustment procedure are explained elsewhere (Canadian Institute for Health Information, 2013; Jones et al., Reference Jones, Hirdes, Poss, Kelly, Berg and Fries2010). We only included those facilities that provided data for at least 3 years between 2011 and 2014 and for at least 3 years between 2015 and 2018. As some facilities provided data for some but not all indicators through the study period, the number of facilities included in the analysis varies by indicator. Furthermore, all Ontario facilities were excluded from the analyses of the indicators on residents who fell in the last 30 days and residents whose stage 2–4 pressure ulcer worsened. This is because Ontario data for these two indicators have been publicly available at facility level since 2010. All mentions of annual values actually refer to the corresponding fiscal year (i.e., April 1 to March 31 of the following year), so, for example, 2011 is used for the fiscal year 2011–2012.
Our analysis considers the publication of performance data (i.e., June 2015) as the intervention and that any change in performance related to the intervention will become apparent starting in the fiscal year 2015; that is, in the data related to the period April 2015–March 2016. The event prompting changes aimed at improving performance might have been the announcement of the publication of data to long-term care facilities, which preceded the actual publication by several months. The time necessary for the reference event to lead to detectable changes in performance, if they occur, is also not clear, and is likely different depending on the indicator. Using trends over time over a 4-year period in our analysis reduces the importance of performance in a single year, and hence the impact of potentially misrepresenting the years 2014 and 2015 as preceding and following the intervention.
The trends in the periods 2011–2014 and 2015–2018 were calculated with a multi-level model with random intercepts, with fiscal year as the independent variable and facility as the only secondary variable (the script used to define the model is provided as Model 1 in Supplement 1). The jurisdiction where facilities are located was not included in the multi-level model directly, as jurisdictional-level differences were analysed separately.
If the value of the fixed effects regression coefficient of the fiscal year was statistically significant (two-sided p value < 0.05), then the change in the period analysed was considered significant. Significant coefficient values were considered as either improvement or worsening of an indicator, depending on whether the coefficient was positive or negative and on whether increase of the performance values represented improvement or worsening. A separate multi-level model assessed the significance of the change in trend between the periods 2011–2014 and 2015–2018 (the script used to define the model is provided as Model 2 in Supplement 1). In this case, the independent variables in the model were the fiscal year, the time period (either 2011–2014 or 2015–2018) and the interaction term fiscal year/period. The fixed effects regression coefficient of the latter (i.e., the fiscal year/period interaction term) was the basis to assess improvement, worsening, or lack of change of trend between the two periods. A p value of the fixed effects regression coefficient of the fiscal year/period interaction term > 0.05 was interpreted as a lack of change in the indicator values.
The choice of analysis method was guided by the study setting. Although, generally speaking, a difference in differences approach is more powerful in proving an effect, the lack of a counterfactual in our data set did not allow for such an approach (Wing, Simon, & Bello-Gomez, Reference Wing, Simon and Bello-Gomez2018). An interrupted time series analysis, another powerful method used in similar studies, was prevented by insufficient data points (Penfold & Zhang, Reference Penfold and Zhang2013). By comparing trends instead of single values, as in a simple before and after study, we maximized the use of the data available.
To compare the regression model coefficients of different indicators, values were standardized using proportion of maximum scaling. The risk-adjusted indicator value for each year for each facility was converted using the formula: (risk adjusted value – minimum)/(maximum-minimum) where the risk adjusted value is the one considered in the specific case, and the minimum and maximum values are respectively the lowest and highest risk adjusted values of that indicator among all facilities over all years. The coefficients were then calculated with the same multi-level models previously described.
The analysis previously described provided the results to answer research question 1 (a). By comparing the trends changes observed among publicly reported indicators with those observed among privately reported indicators, we were able to respond to research question 1 (b).
Facilities were grouped according to a number of variables. Facility size was defined by number of beds, where small facilities have up to and including 29 beds, medium facilities have between and including 30 and 99 beds, and large facilities have 100 beds or more. Such categorization of facility sizes is regularly used at CIHI as part of facility characteristics for peer comparisons. The location was designated as urban or rural using Statistics Canada methodology (Statistics Canada, n.d.). Facilities were designated as belonging to a corporation or as stand-alone facilities based on ownership information available at CIHI. We also created a subgroup of best- and worst-performing facilities for each indicator. In order to do this, we considered the mean indicator value in the period 2011–2014. In accordance with the classical theory on diffusion of innovation of Rogers (Kaminski, Reference Kaminski2011), the top 16 per cent and bottom 16 per cent of performers for each indicator were categorized as the best and worst performers.
The same analysis used to respond to research questions 1 (a) and 1 (b) was applied to long-term care facilities grouped by jurisdiction, size, urban/rural status, and corporation affiliation to respond to research question 2 (a) and to the two groups of best and worst performers to partly answer the research question 2 (b). The second part of the response to question 2 (b) was provided by plotting the coefficient of performance improvement in the period 2011–2014 against the magnitude of the change in trend in the period 2015–2018 (i.e., the regression coefficient of the interaction terms in Model 2).
Calculations were done using R software version 3.6.3.
Results
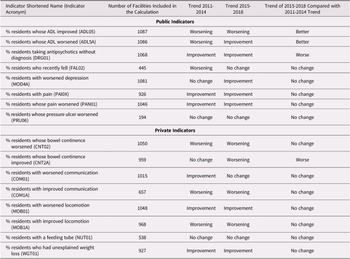
In the period 2015–2018, five out of eight publicly reported indicators showed improvement, whereas one indicator showed a worsening trend. Among the privately reported indicators in the same period, four indicators were worsening and two were improving (Table 2).
Indicator trends in long term care facilities in Canada in the periods before and after 2015
Trend Changes before and after 2015
To test for an association between public reporting and performance, we were mainly interested in whether the trends changed significantly in the period 2015–2018 as compared with the trend in the period 2011–2014.
Among the eight indicators that were publicly reported in 2015, two showed a change in trend toward improved performance relative to the 2011–2014 time period. Both indicators were related to ADL. One indicator showed a change toward worsened performance. Among the eight indicators that were not publicly reported, there was only one indicator that showed a change in trend during the period 2015–2018 compared with the period 2011–2014, and this was in the direction of worsened performance.
For visual support to Table 2 interpretation, a scatter plot of the time trends of mean risk adjusted indicator values nationally and by province is provided in Supplement 2 (Figures S1–S10). The fixed effects regression coefficient related to the variable “fiscal year” in Model 1 and the fixed effects regression coefficient of the fiscal year/period interaction term in Model 2 and their respective p values were used to create Table 2 and are listed in Supplement 3 (Tables S1–S7).
Trends by Jurisdiction, Size, Urban/Rural Status, and Corporation Affiliation of the Long-Term Care Facilities
Tables 3, 4, and 5 show the changes in trends in the period 2015–2018 as compared with the period 2011–2014, when facilities are grouped by size, membership of a larger corporation, and urban/rural location. We considered as diverging; that is, inconsistent, only those cases in which different groups showed opposite trends (i.e., improvement in one group and worsening in another). Such opposite trends are rarely observed, as marked in the tables, suggesting that these characteristics (size, membership of a larger corporation, and urban/rural location) do not play an important role in the association between public reporting and performance trends over the study time period.
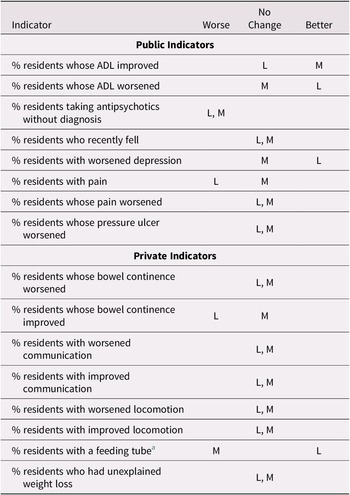
Change in trend during the period 2015–2018 as compared with 2011–2014 by membership in a corporation for selected indicators
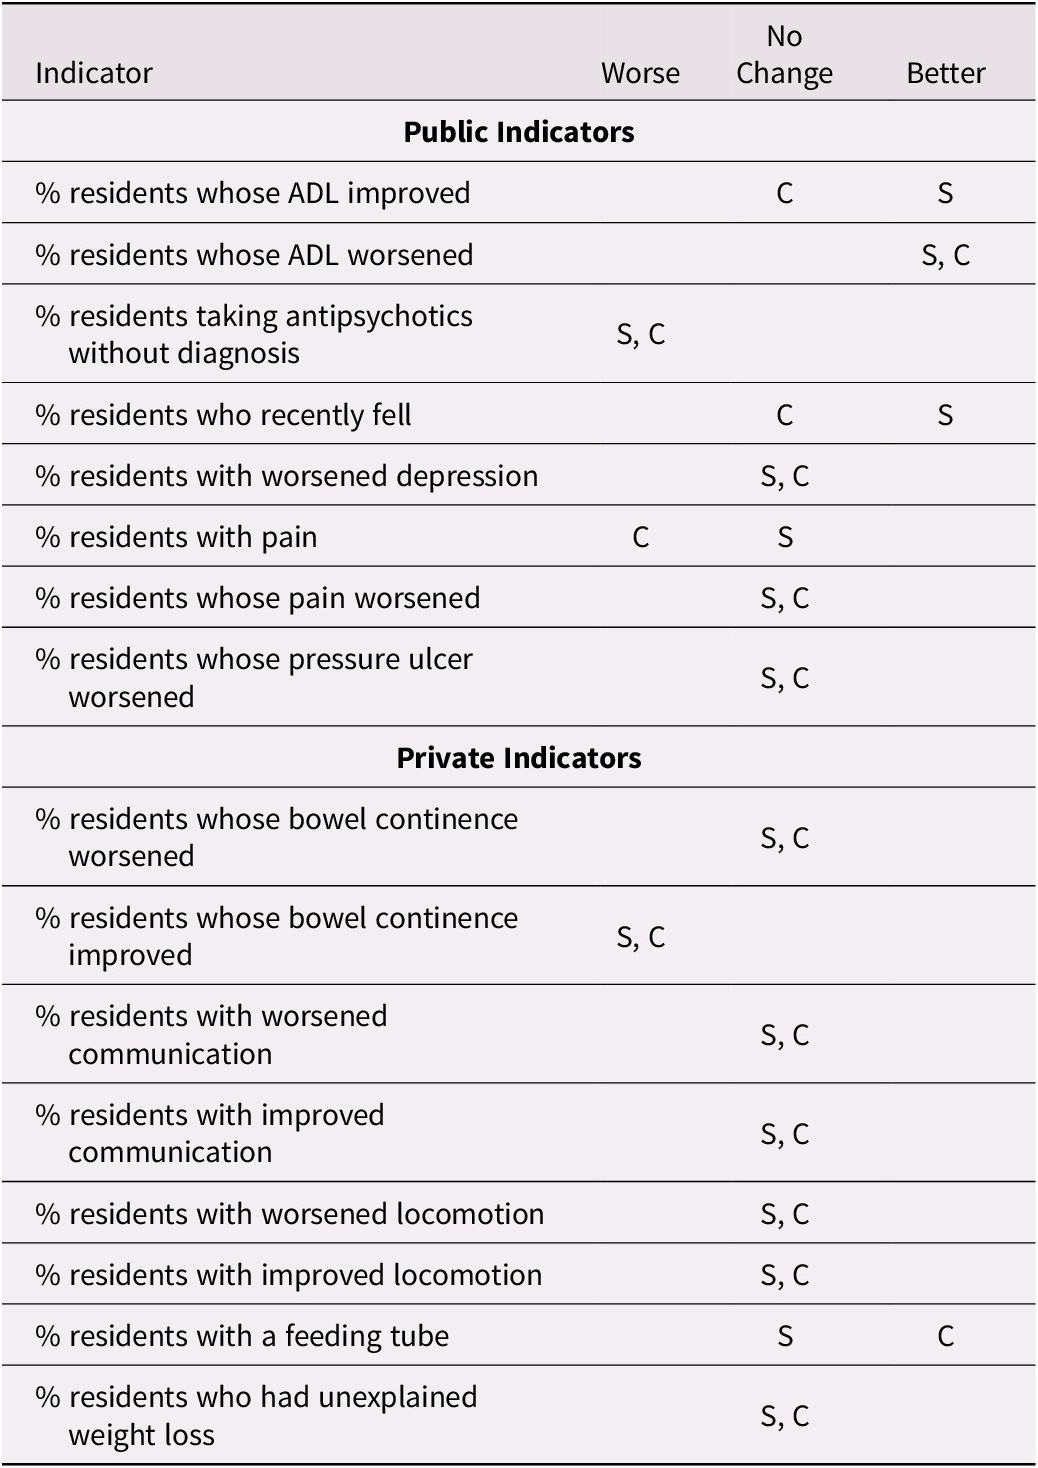
Note. S refers to facilities that are not member of a larger corporation; C refers to facilities that are members of a larger corporation.
Change in trend in the period 2015-2018 as compared to 2011-2014 by facility size for selected indicators. (small facilities are excluded due to small numbers of facilities)
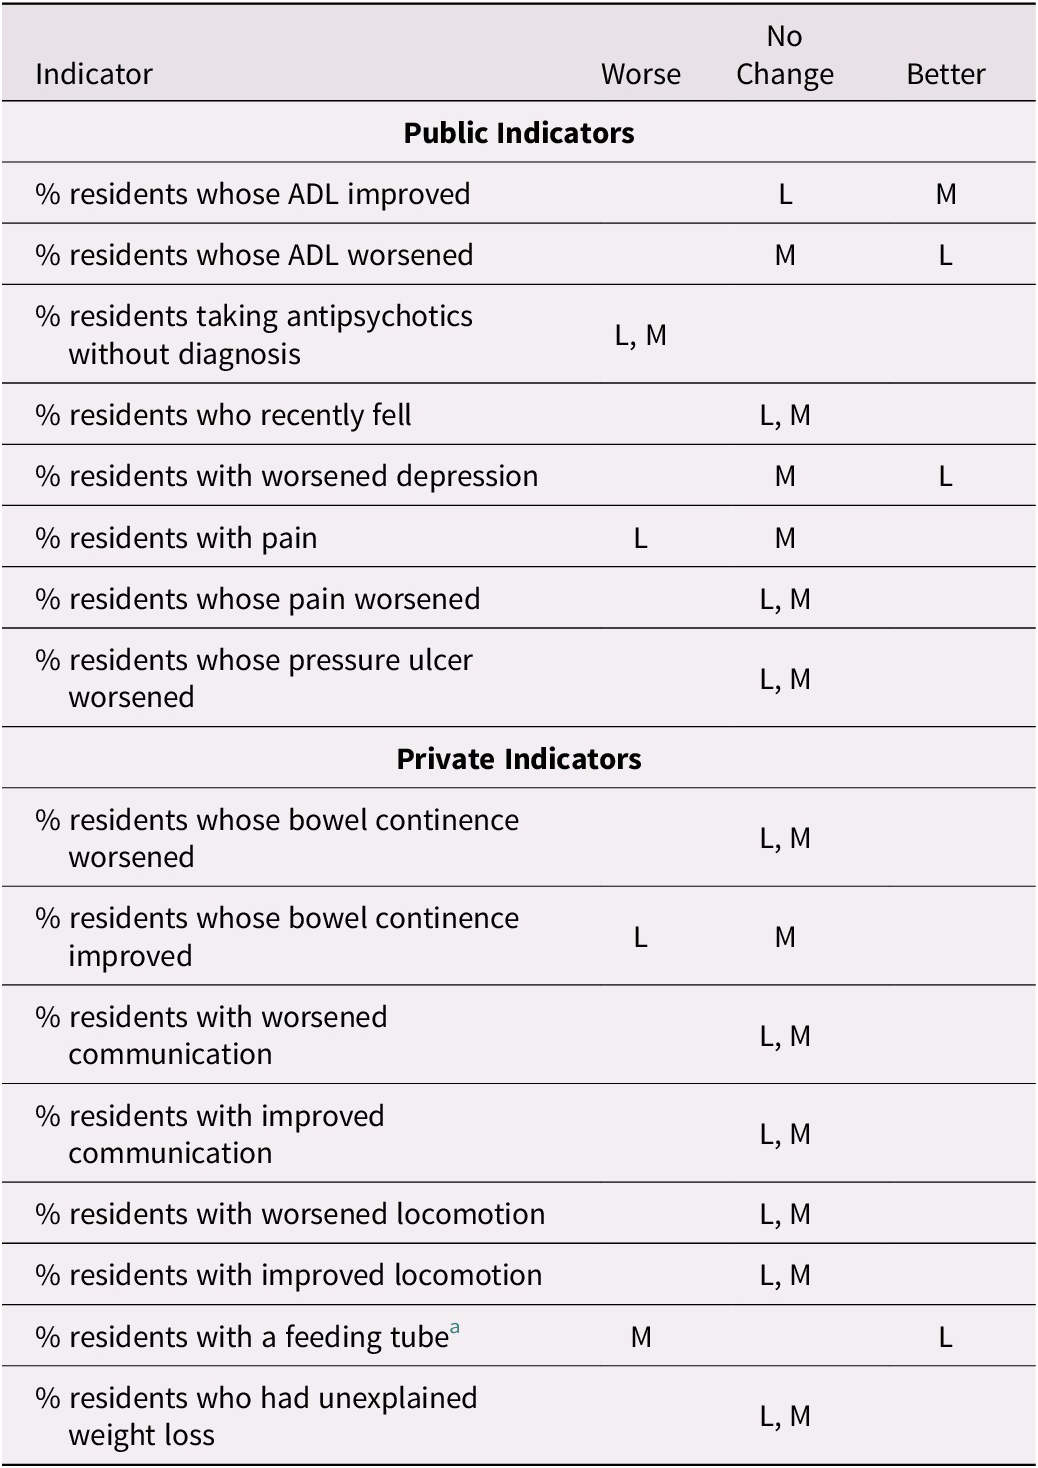
Note. L refers to large facilities; M refers to medium-sized facilities.
a Diverging trend.
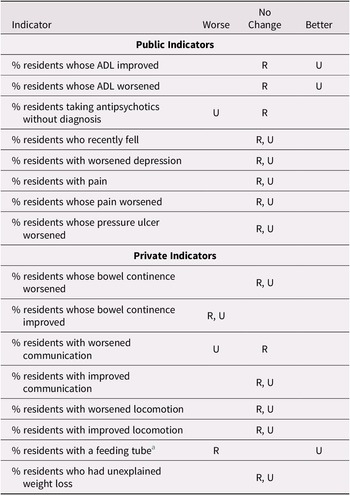
Change in trend during the period 2015–2018 as compared with 2011–2014 by urban/rural location for selected indicators
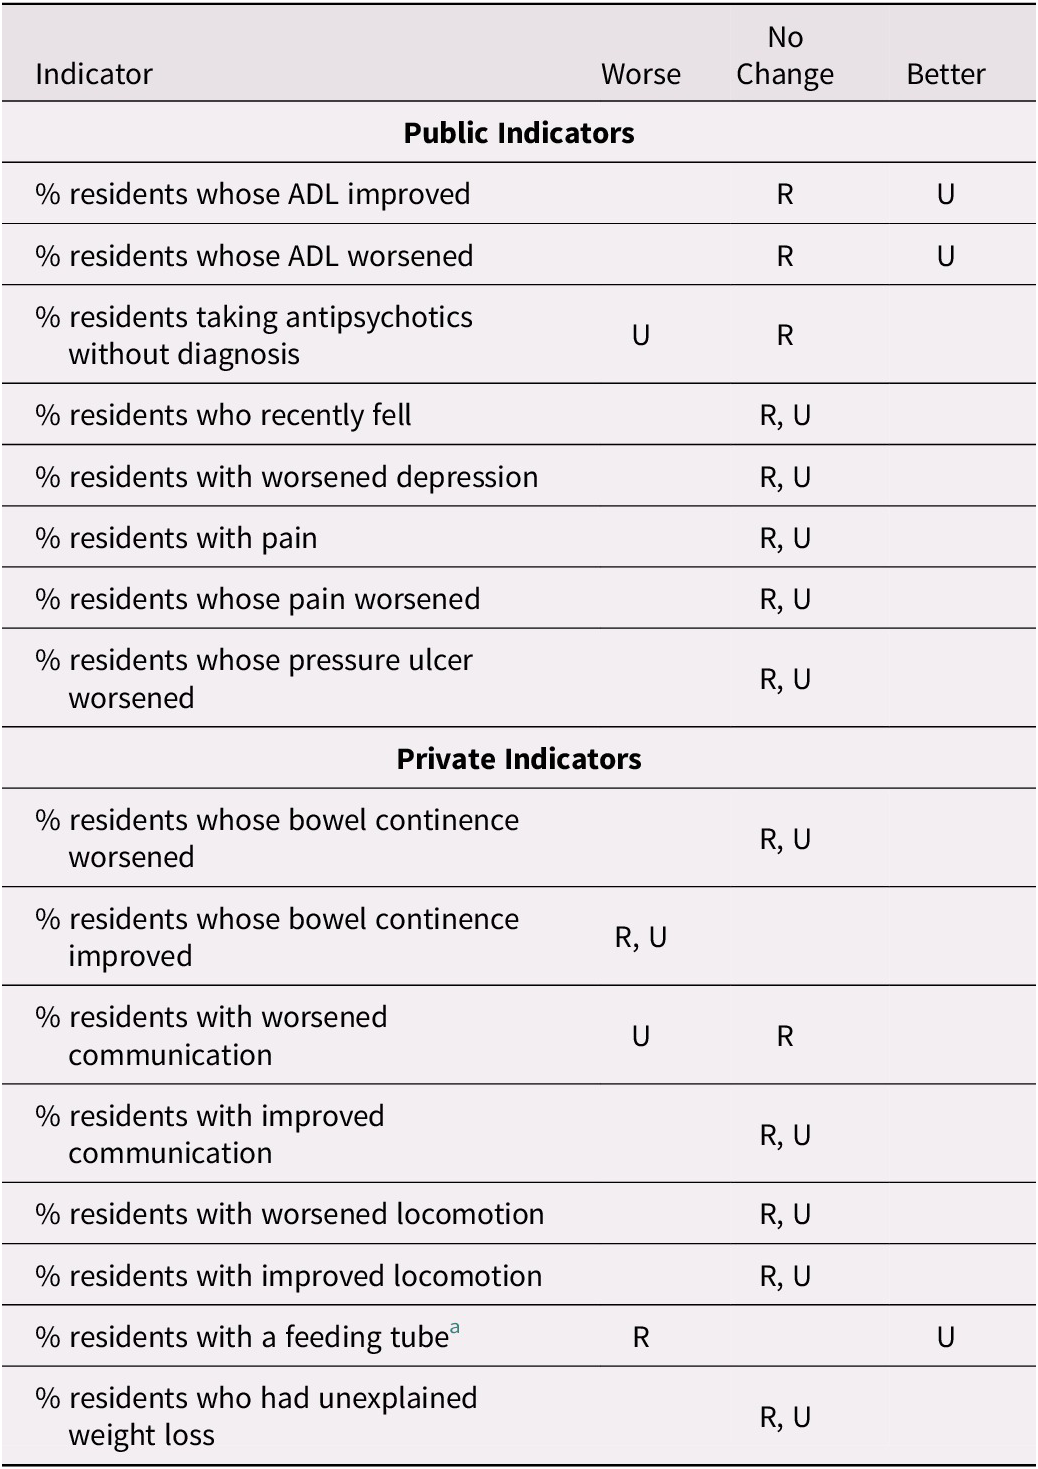
Note. R refers to rural facilities; U refers to urban facilities.
a Diverging trend
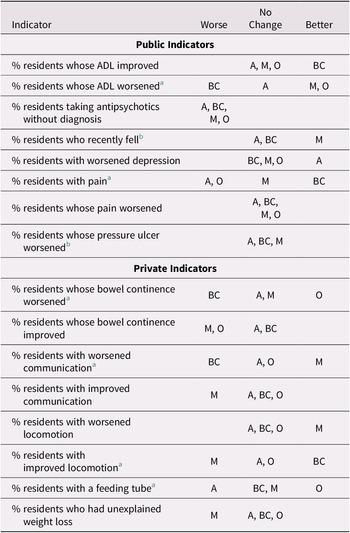
Table 6 shows trend changes by jurisdiction. The change of trend after 2015 was in diverging directions among jurisdictions in the case of six indicators, four privately reported and two publicly reported. This suggests that jurisdiction plays an important role in modifying indicator trends. However, the data do not suggest that the association between trend change and public reporting differs importantly by province.
Change in trend during the period 2015–2018 as compared with 2011–2014 by jurisdiction for selected indicators
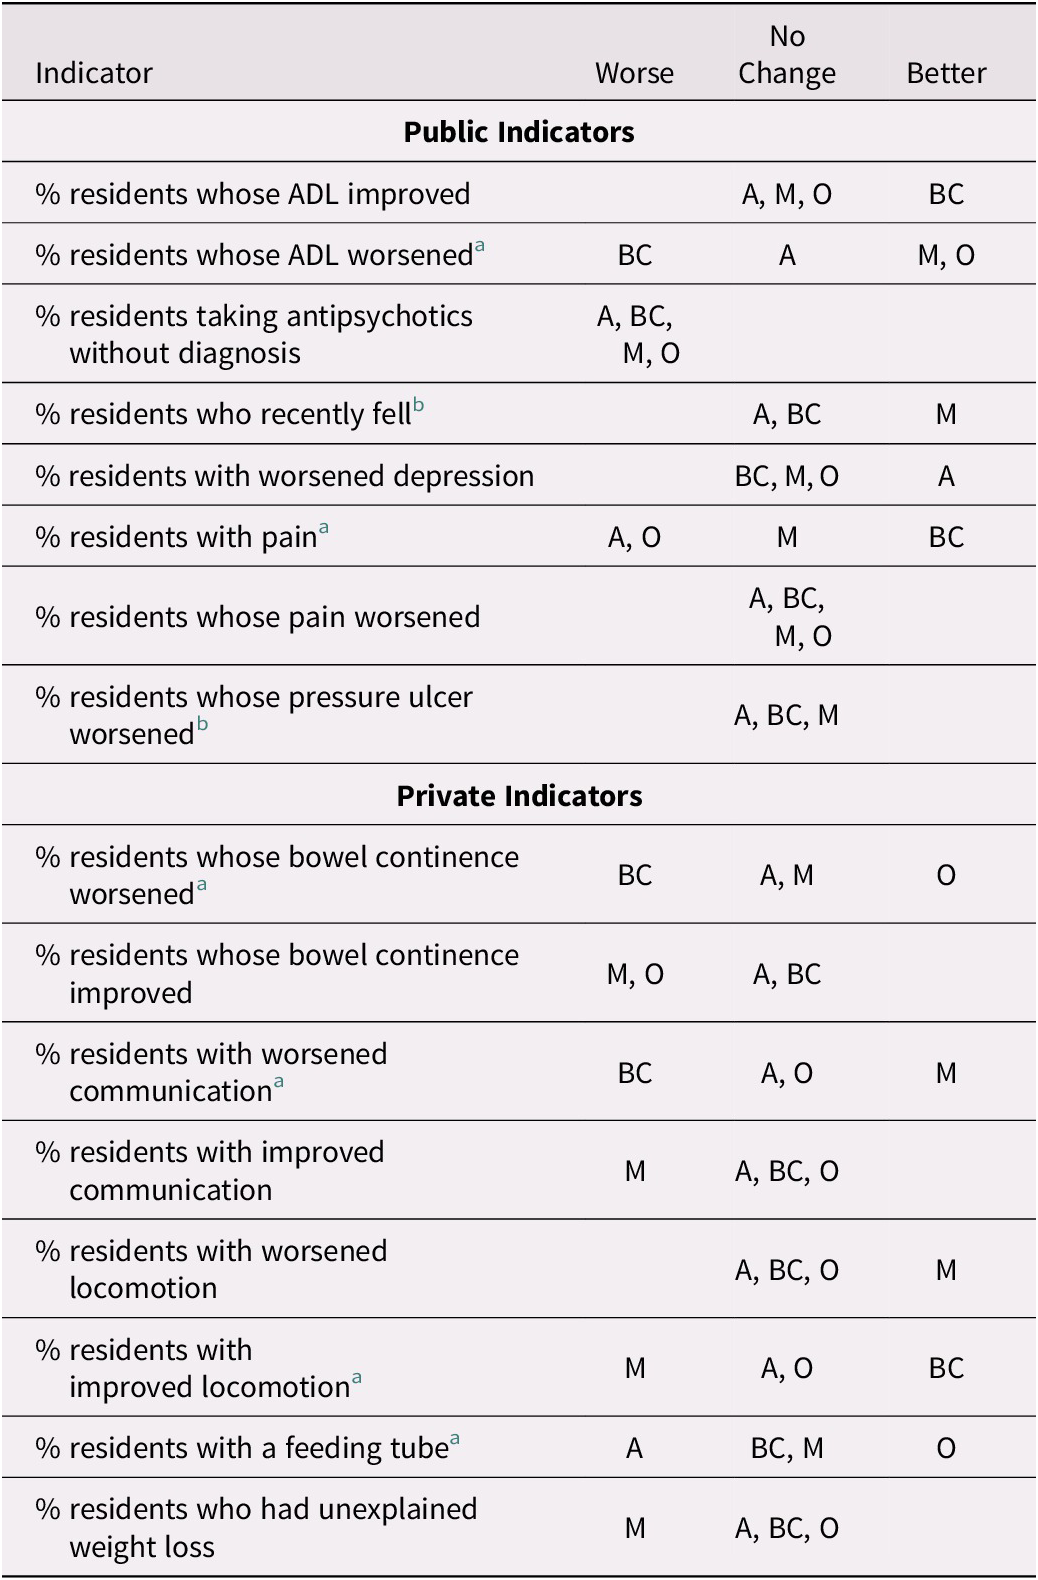
Note. A refers to facilities in Alberta; BC refers to facilities in British Columbia; M refers to facilities in Manitoba; O refers to facilities in Ontario.
a Diverging trend.
b Ontario not included.
Trends Changes, Previous Performance, and Previous Trends
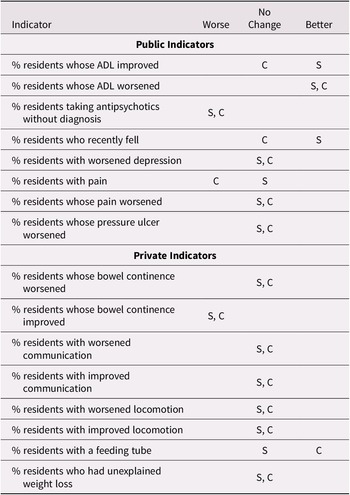
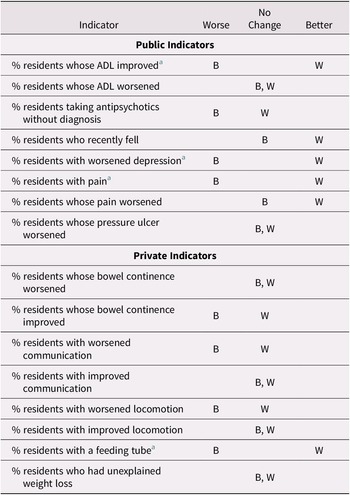
When the best performing long-term care facilities are considered as a group, we did not find a significant trend change for the better in the period 2015–2018 as compared with 2011–2014, among either the publicly or privately reported indicators. We also considered separately the worst performing long-term care facilities. There were five indicators out of eight with a significant change in trend for the better among publicly reported indicators and only one changing for the better among the privately reported indicators (Table 7). This suggests a correlation between public reporting and performance improvement among the worst performers.
Change in trend during the period 2015–2018 as compared with 2011–2014 for the best and worst performers for selected indicators
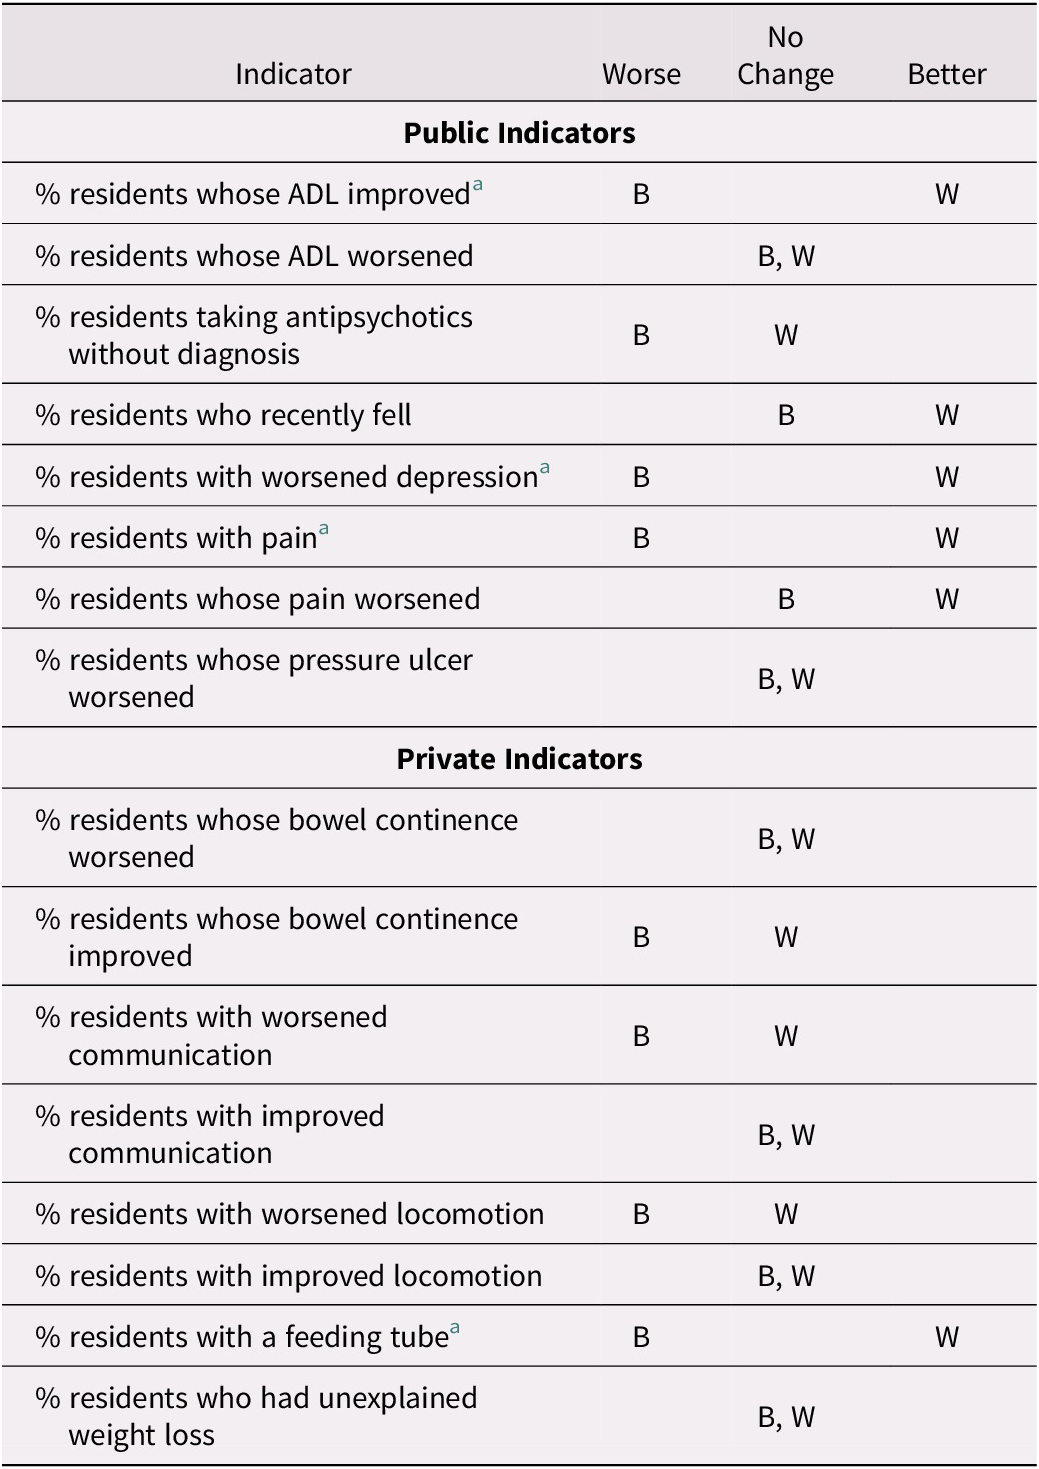
Note. B refers to best performing facilities for that indicator; W refers to worst performing facilities for that indicator.
a Diverging trend.
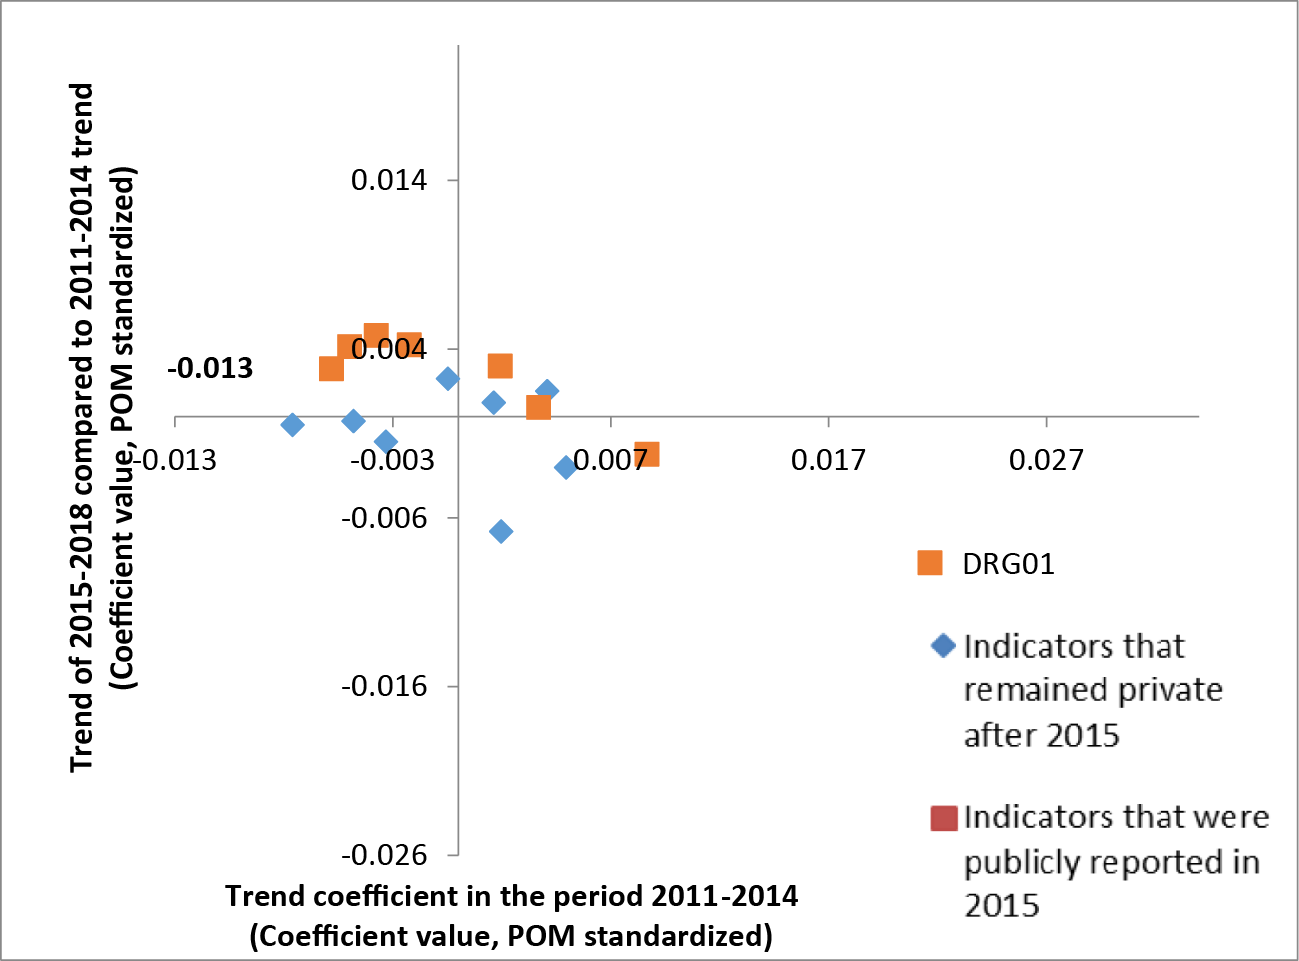
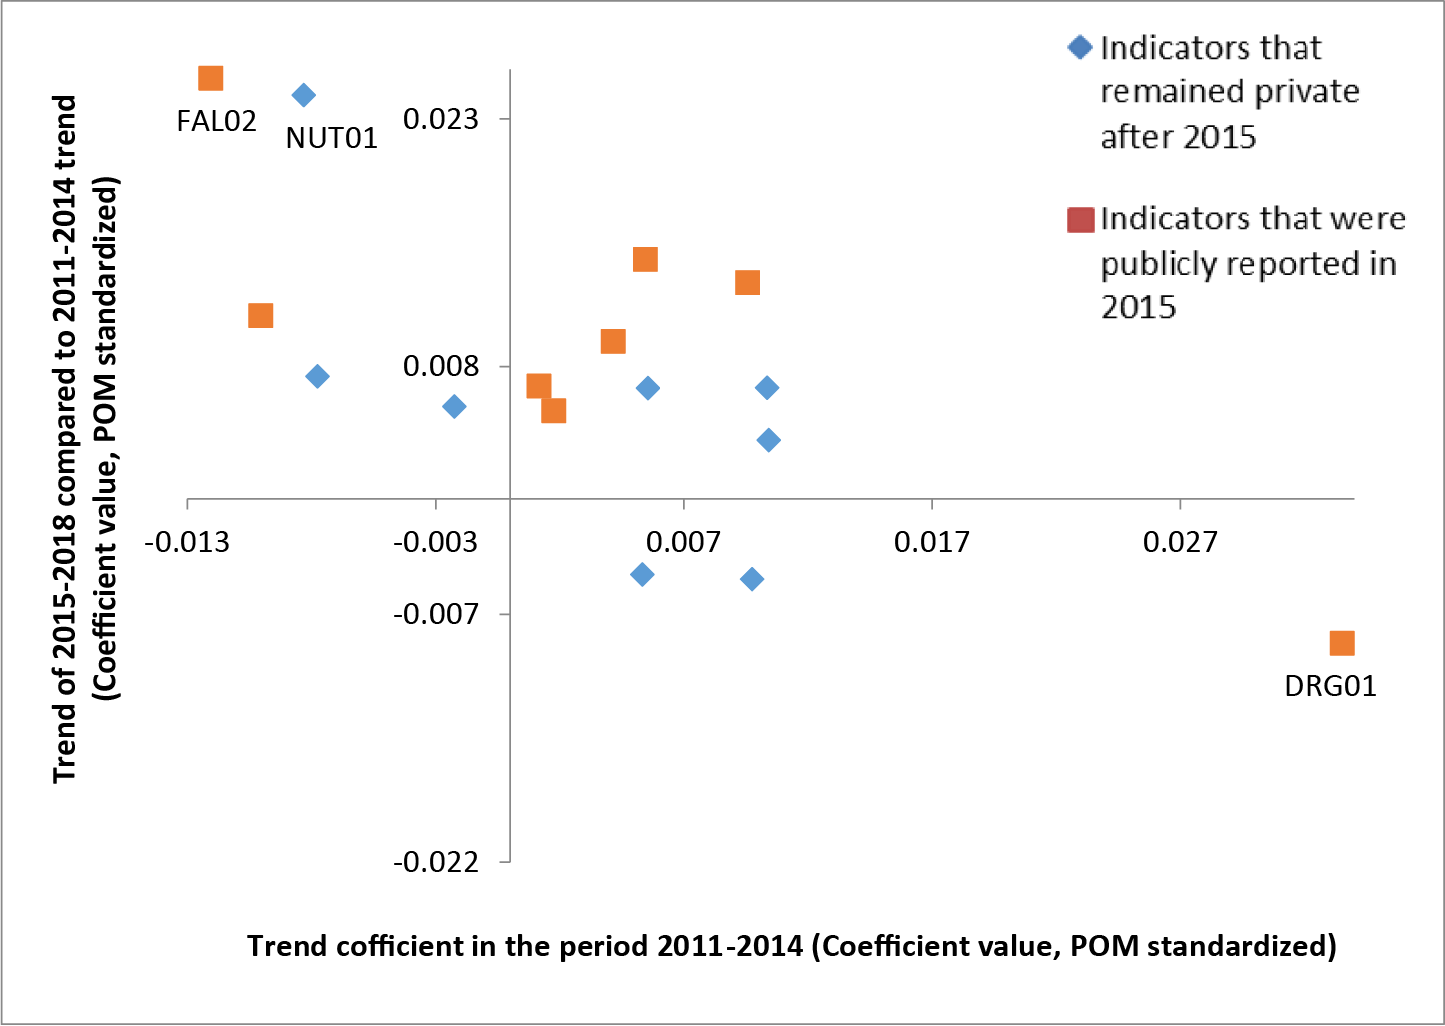
In addition to considering average performance during the period 2011–2014, we also considered the indicator trends in the period 2011–2014 as a potential factor affecting the association between performance and public reporting. Plotting the coefficient of improvement during the period 2011–2014 (how much the indicator was improving) against the magnitude of the change in trend during the period 2015–2018 with respect to the previous period suggests a relationship, whereby the greater the trend in a direction in the first period, the greater the change of trend in the opposite direction in the next period. This relationship appears more pronounced among the publicly reported indicators (Figure 1).
Indicator trends during the period 2011–2014 (on x-axis) against the change in trend during the period 2015–2018 with respect to 2011–2014 (on y-axis). DRG01 = percent of residents taking antipsychotics without diagnosis. The values on the x and y axes refer to coefficient values of the models, based on annual adjusted indicator values standardized with a proportion of maximum (POM) scaling approach.
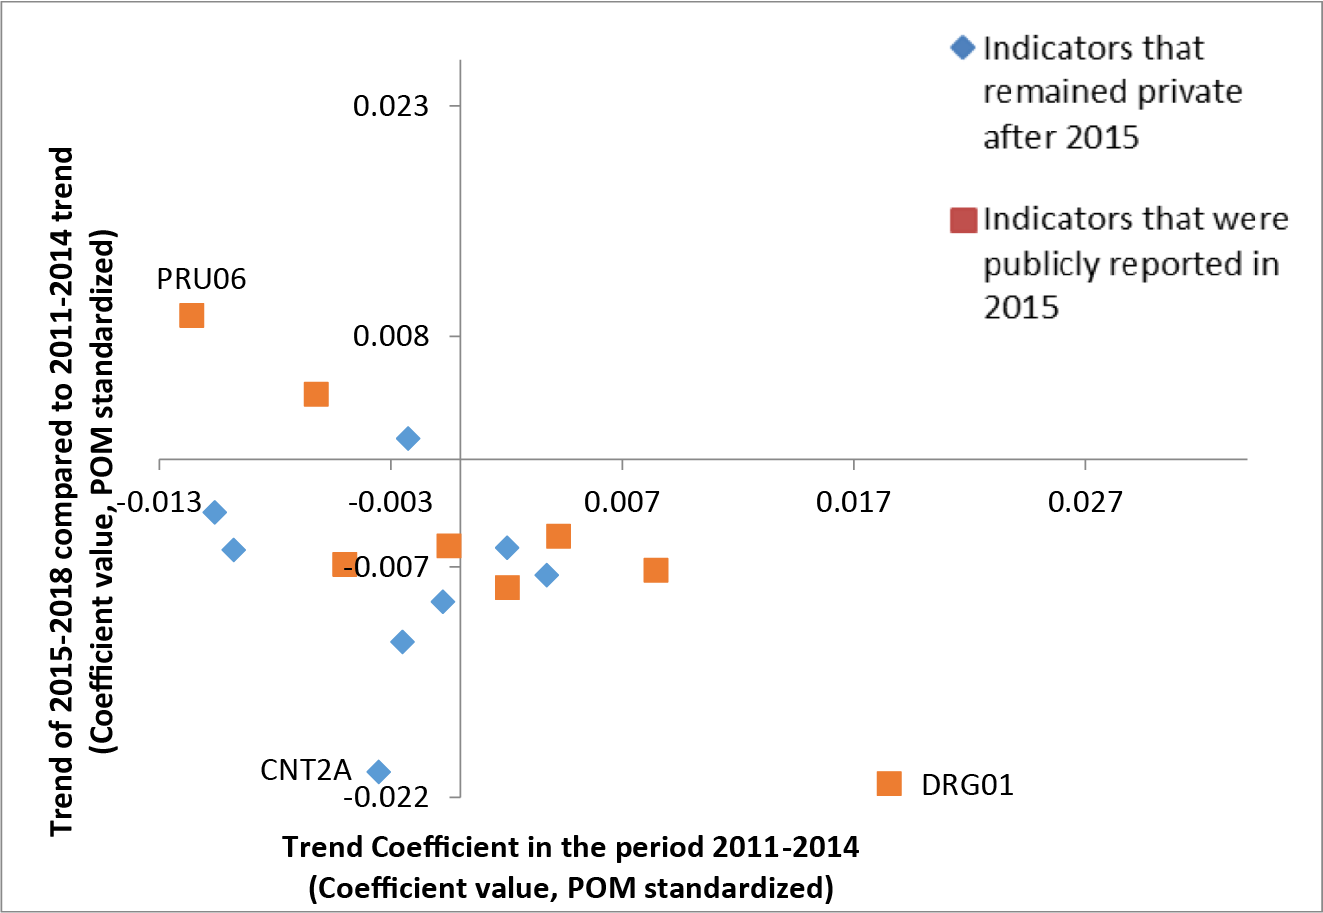
Among the best performing long-term care facilities, the indicators privately reported after 2015 appear to have either changed little or changed for the worse. When the worst-performing long-term care facilities are considered, the cluster seems to shift towards the top right quadrant. This indicates relatively larger improvements during the period 2011–2014 and relatively more positive changes in trends during the period 2015–2018 with respect to the best performers. The distribution of the data points also suggests that the changes among indicators that remained private after 2015 were more often smaller (Figures 2 and 3).
Indicator trends during the period 2011–2014 (on x-axis) against the change in trend during the period 2015–2018 with respect to 2011–2014 (on y-axis) for the best performing long-term care facilities. PRU06 = percent of residents whose pressure ulcer worsened; CNT2A = percent of residents whose bowel continence improved; DRG01 = percent of residents taking antipsychotics without diagnosis. The values on the x and y axis refer to coefficient values of the models, based on annual adjusted indicator values standardized with proportion of maximum (POM) scaling approach.
Indicator trends during the period 2011–2014 (on x-axis) against the change in trend during the period 2015–2018 with respect to 2011–2014 (on y-axis) for the worst performing long-term care facilities. FAL02 = percent of residents who recently fell; NUT01 = percent of residents with a feeding tube; DRG01 = percent of residents taking antipsychotics without diagnosis. The values on the x and y axes refer to coefficient values of the models, based on annual adjusted indicator values standardized with proportion of maximum (POM) scaling approach.
Discussion
During the period 2015–2018, more publicly reported indicators showed improving than showed worsening trends (5 out of 8 and 1 out of 8 respectively). During the same period, more privately reported indicators showed worsening than showed improving trends (4 out of 8 and 2 out of 8 respectively). When the trends during the period 2015–2018 are compared with pre-existing trends (i.e., during the period 2011–2014), the change in trend is mostly non-significant both among the publicly and the privately reported indicators (5 out of 8 and 7 out of 8 indicators with no change, respectively). Improvement in the previous trends are observed in two cases, both related to ADL and both publicly reported since 2015.
Each of the indicators considered has its own story with respect to background and factors that influence it. For example, the magnitude of the changes in trends in the indicators on residents taking antipsychotics without a diagnosis of psychosis (DRG01) consistently stands out with respect to other indicators in the magnitude of improvement prior to 2015 and a change in trend for the worse after 2015. To interpret this, we should consider jurisdictional and national activities that targeted this indicator in particular. For example, in British Columbia, the Patient Safety and Quality Council launched the Call for Less Antipsychotics in Residential Care (CLeAR) initiative in 2012 (BC Care Providers Association, 2018). In Alberta, the Appropriate Use of Antipsychotics project was piloted in 2013 and scaled up in 2014–2015 (Bueckert, Cole, & Robertson, Reference Bueckert, Cole and Robertson2019). The Winnipeg Regional Health Authority in Manitoba focused an improvement project on the appropriate use of antipsychotics, ultimately leading to a nationwide initiative spearheaded by the Canadian Foundation for Healthcare Improvement, which started in 2014 (Canadian Foundation for Healthcare Improvement, 2013). In Ontario, prescription of antipsychotics in long-term care facilities may have been influenced by the Long-Term Care Homes Act enacted in 2010 (Walker et al., Reference Walker, Shearkhani, Bai, McGilton, Berta and Wodchis2020).
For the indicator measuring the percentage of residents with pain, significant improvement was observed in British Columbia during the 2011–2014 period. During the period 2015–2018, this trend did not merely continue, but rather increased even further. One possible reason may be additional dissemination activities within provinces. Often some of the indicators published by CIHI are also published by jurisdictional organizations such as Health Quality Ontario (2018), now part of Ontario Health, and the Office of the Seniors Advocate British Columbia (2019). Sometimes this information is disseminated further, for example in the case of British Columbia, through a dedicated portal of a regional newspaper (Carman, Reference Carman2016). These differences in the reach of published data may account for some of the differences seen among jurisdictions. If this were the case, it would support the relevance of the reputation pathway (Bevan et al., Reference Bevan, Evans and Nuti2019; Hibbard et al., Reference Hibbard, Stockard and Tusler2003) and of what Levesque and Sutherland (Reference Levesque and Sutherland2017) described as external sources of motivation. At the same time, the mean value related to percentage of residents with pain (PAI0X) was higher (i.e., worse) for British Columbia than for Ontario and Alberta, leaving more room for improvement in British Columbia. We cannot know to what extent each of these two factors (differences in the reach of the published data and worse mean value for one of the indicators in one of the jurisdictions) influenced the trends observed.
Comparisons among indicators that were made public in 2015 and those that were not must consider that each indicator is influenced by a number of underlying factors. This means, for example, that an indicator belonging to one group cannot be used for direct comparison (as a counterfactual) against an indicator in the other group in a difference in differences analysis. Nonetheless, as a group, the indicators that were not made public in 2015 provide a useful reference against which to contrast the findings related to the indicators that were made public in 2015.
The CIHI portal Your Health System offers three views of the indicators: “In Brief”, “In Depth”, and a private access section for providers called “Insight” (Canadian Institute for Health Information, n.d.). These approaches cater to the needs of different stakeholders, providing facility level data, presenting them in a 3 × 3 matrix and through other analyses, but they are also complemented by additional dissemination activities, as has been explained. The importance of how the information is disseminated has often been emphasized (Kumpunen, Trigg, & Rodrigues, Reference Kumpunen, Trigg and Rodrigues2014; Lemire, Demers-Payette, & Jefferson-Falardeau, Reference Lemire, Demers-Payette and Jefferson-Falardeau2013). Therefore, future analysis of the impact of public reporting in Canada would also need to consider the ways in which information was disseminated, which can vary across regions or even cities.
Several studies on the impact of organization characteristics and environment on quality improvement showed that performance differed according to these characteristics (Mora & Walker, Reference Mora and Walker2016; Sherar & Maley, Reference Sherar and Maley2015; Totten et al., Reference Totten, Wagner, Tiwari, O’Haire, Griffin and Walker2012; Wilkinson, Haroun, Wong, Cooper, & Chignell, Reference Wilkinson, Haroun, Wong, Cooper and Chignell2019). Our analysis did not focus on the average difference in performance, but rather on the rate of change. When facilities were grouped by urban/rural location and membership of a corporation, we did not find diverging trend changes among facilities according to these characteristics. We found only 1 indicator out of 16 with a diverging trend change between large and medium facilities. The differences in trend changes among the four provinces included in the study presented a more diverse picture, suggesting that jurisdiction level factors must be carefully considered when analysing the association between public reporting and performance.
The best performers did not show a change in trend for the better in either publicly or privately reported indicators. The worst performers on the other hand showed a change in trend for the better in five out of eight publicly reported indicators but only in one privately reported indicator. This is consistent with the results of other studies (Cai & Temkin-Greener, Reference Cai and Temkin-Greener2011; Jung, Shea, & Warner, Reference Jung, Shea and Warner2010; Totten et al., Reference Totten, Wagner, Tiwari, O’Haire, Griffin and Walker2012; Zinn, Weimer, Spector, & Mukamel, Reference Zinn, Weimer, Spector and Mukamel2010). These findings could be explained through a ceiling effect, a well-established concept in which high average scores prevent meaningful comparisons or recognition of improvement trends (Pouwer, Snoek, & Heine, Reference Pouwer, Snoek and Heine1998). It stands to reason that in the short run, current technologies and organizational and other limitations put a ceiling on how much an indicator can improve within a facility and its environment. This expectation, in line with the findings of Hibbard et al. (Reference Hibbard, Stockard and Tusler2003) also appears to be implied by the performance map, where performance is plotted against the improvement in the previous period (Nuti & Vainieri, Reference Nuti, Vainieri, Johnson and Stukel2016). The postulation of a ceiling effect is supported in our analysis by the apparent inverse relation between the rate of improvement in the first period analysed and the change in the rate of improvement in the following period. The implication of the ceiling effect is that significant improvement can only be expected in cases in which the performance during the previous period has not already improved considerably.
Our findings can be explained by the theories on the impact of public reporting on performance discussed in the Introduction (Berwick et al., Reference Berwick, James and Coye2003; Bevan et al., Reference Bevan, Evans and Nuti2019; Contandriopoulos et al., Reference Contandriopoulos, Champagne and Denis2014; Hibbard et al., Reference Hibbard, Stockard and Tusler2003; Levesque & Sutherland, Reference Levesque and Sutherland2017), even though the findings do not provide exclusive support for any one of them. It is noteworthy that none of these theories explicitly mention a ceiling or similar effect, which is supported by our findings.
Strengths and Limitations
Our analysis took advantage of the quasi-experimental settings provided by the publication of some performance indicators in long-term care at the facility level in 2015. The analysis considered different jurisdictions, increasing the generalizability of the findings.
We assumed that the main difference between indicators that were made publicly available and those that were not was limited to their publication status. We must also consider the possibility that any difference in trend between the two groups of indicators has the same underlying causes as those that lead to the choice of indicators for public reporting, such as policy relevance, reliability, and amenability to change (Adair et al., Reference Adair, Simpson, Casebeer, Birdsell, Hayden and Lewis2006; Veillard et al., Reference Veillard, Tipper and Allin2015). This provides a potential alternative hypothesis for the differences observed.
Furthermore, interactions among indicators cannot be excluded. According to the “teaching to the test” theory, public reporting of some performance indicators may have unintended consequence for indicators that are not reported (Konetzka et al., Reference Konetzka, Yan and Werner2020). These effects may be of concomitant improvement of unreported indicators through a spill-over effect of the efforts to improve on the reported ones. Alternatively, resources may be moved away from some areas that are not publicly reported, resulting in a worsening effect on the indicators. It is also possible that a heightened attention to quality and safety measures leads to a more general strengthening of improvement activities (Werner, Konetzka, & Kruse, Reference Werner, Konetzka and Kruse2009). In our study, there is an evident relationship between the public indicators related to ADL functioning and the private indicators on locomotion capabilities. In order to minimize these interactions, we made our best efforts to choose a set of indicators for which the relationship between those that were made public in 2015 and those that remained private is minimal. The aim was to reduce the chances of concomitant improvements of the non-publicly reported indicators caused by spill-over effects. The study design does not allow for the detection of direct negative effects of public reporting on non-publicly reported indicators. If such an effect is present, it represents a possible explanation for the differences observed between publicly and non-publicly reported indicators observed.
The phenomenon of regression to the mean (Morton & Torgerson, Reference Morton and Torgerson2003) cannot be excluded as a possible explanation, in particular, for the differences observed between best and worst performers. We addressed the issue by selecting facilities that achieved the best and worst average indicator values over the whole period prior to publication (i.e., between 2011 and 2014) as opposed to selecting one point in time. Furthermore, different distributions of trend changes between indicators that were made public in 2015 and those that were not cannot be attributed to regression to the mean.
Conclusions
The answer to whether public reporting improves performance is not straightforward. Several contextual factors must be taken into account. Our analysis shows that the performance trends and performance level prior to publication are two important factors to consider. The association of public reporting and improvement seems more evident among indicators for which there was no improvement prior to publication and among the worst performing facilities. Because of a “ceiling effect”, publication of performance data may have little effect on facilities that had already reached their peak performance and on indicators for which an improvement trend was present prior to publication. The implication of the finding is that decision makers’ thinking about public reporting of performance indicators should consider whether the purpose of public reporting of performance is improvement. In this case, the choice of indicators to be published and the timing of their publication should take into account indicators’ performance levels and improvement trends prior to publication. Public reporting of performance indicators on long-term care in Canada made a difference that should be understood in the specific context of setting, policy environment, time, chosen indicators, and other specific factors, such as dissemination and diffusion of performance information, addressed in this article.
Acknowledgments
We thank Norma Hall, Nancy Gault, Jacqueline Kurji, Saul Melamed, and Grant Hollett from the Canadian Institute for Health Information; Gregory Marchildon from the North American Observatory on Health Systems and Policies at the Institute of Health Policy, Management and Evaluation of the University of Toronto; Lori Mitchell from the Winnipeg Regional Health Authority; Nancy Copper from the Ontario Long Term Care Association; Danny Wang and Sue Sweeney from the Registered Nurses’ Association of Ontario; John Hirdes from the University of Waterloo; Corinne Schalm from Alberta Health; Mollie Cole from Health Quality Council of Alberta; and the staff at Health Quality Ontario, Ontario Health for their input in framing key questions on the impact of public reporting of performance data and for providing valuable contextual information and perspectives on the issue.
Funding
This work was performed by the Marie Skłodowska-Curie Innovative Training Network (HealthPros – Healthcare Performance Intelligence Professionals), which has received funding from the European Union’s Horizon 2020 research and innovation programme under grant agreement Nr. 765141.
Supplementary Materials
To view supplementary material for this article, please visit http://doi.org/10.1017/S0714980821000714.


 Open access