


The role of taste in dietary intake is of particular interest from a nutritional perspective. That is, taste plays a key role in food choice and dietary patterns( 1 ). Besides guiding food choice, taste may serve as an early signal of its nutrient content( Reference van Dongen, van den Berg and Vink 2 , Reference Lease, Hendrie and Poelman 3 ), thereby affecting satiation( Reference de Graaf and Kok 4 ) and subsequent food intake( Reference Griffioen-Roose, Hogenkamp and Mars 5 – Reference McCrickerd and Forde 7 ). Studying dietary patterns from a taste perspective – and not only a nutritional perspective – provides us with a deeper understanding of the role of taste in dietary intake.
Research on the role of taste in dietary intake is still in its infancy. To study the role of taste in dietary intake, it is essential to objectively quantify the taste intensity values across foods consumed within a population. Food composition tables are globally available; however, only three studies compiled a taste database( Reference van Dongen, van den Berg and Vink 2 , Reference Lease, Hendrie and Poelman 3 , Reference Martin, Visalli and Lange 8 ). Van Dongen et al.( Reference van Dongen, van den Berg and Vink 2 ) quantified the basic taste intensity values of fifty frequently consumed single Dutch foods and subsequently studied taste–nutrient relationships. More recently, Martin et al.( Reference Martin, Visalli and Lange 8 ) described the taste profile of 590 French foods within the diet of their twelve trained panellists. Yet, these studies assessed taste values only for selected foods that were not representative of the diet of the general population. We are aware of only one study( Reference Lease, Hendrie and Poelman 3 ) that determined taste values of foods within the entire diet of a national sample of the population. However, this Australian study focused on taste–nutrient relationships in foods and did not assess the role of taste in dietary intake.
The role of taste in dietary intake may differ among sex and weight status subgroups of the population. Although no literature is available on dietary taste patterns, this is available for studies on taste preferences. For example, several studies have found that men liked salty and/or fatty foods more than women( Reference Deglaire, Méjean and Castetbon 9 – Reference Zellner, Garriga-Trillo and Rohm 15 ), whereas women liked sweet foods more than men( Reference Deglaire, Méjean and Castetbon 9 , Reference Matsushita, Mizoue and Takahashi 10 , Reference Weingarten and Elston 14 , Reference Zellner, Garriga-Trillo and Rohm 15 ). However, it is less clear whether taste preferences differ by weight status. Some studies have found a positive association between liking for sweet( Reference Deglaire, Méjean and Castetbon 9 , Reference Matsushita, Mizoue and Takahashi 10 ) or salty foods and BMI( Reference Deglaire, Méjean and Castetbon 9 ), whereas other studies have found lower liking ratings for sweet and salty foods in obese than in lean individuals( Reference Cox, Van Galen and Hedderley 16 ) or no difference in liking across BMI categories( Reference Cox, Perry and Moore 17 ). However, dietary taste patterns by subgroups of the population have never been assessed.
The current study is the first that aimed to assess dietary taste patterns in the Netherlands by sex, weight status, age and educational level. We combined a taste database – containing sweet, sour, bitter, salt, umami and fat sensation values of 476 foods – with the food intake data from the Dutch National Food Consumption Survey (DNFCS, 2007–2010) – a nationally representative sample of the population( Reference van Rossum, Fransen and Verkaik-Kloosterman 18 ). In addition, we combined the taste values with the food intake data from an observational study that was independent of our food selection process: the Nutrition Questionnaires plus (NQplus) study (2011–2013).
Methods
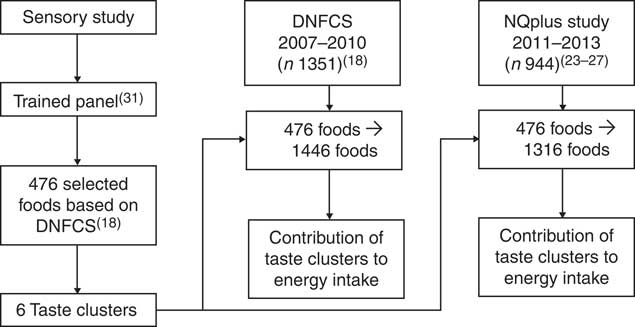
A trained sensory panel was set up in Wageningen (the Netherlands) to assess a large set of frequently consumed foods in terms of basic taste intensity (sweet, sour, bitter, salt and umami) and fat sensation values (see the ‘Taste database’ section). Training of a panel increases the panel’s internal consensus, reproducibility of taste values and discriminative power between taste modalities and foods( Reference Wolters and Allchurch 19 – Reference Losó, Gere and Györey 21 ). Foods within the resulting taste database were grouped on taste using hierarchical cluster analyses. This resulted in six groups that consisted of foods that were most similar in taste intensity values. Subsequently, the taste database was combined with food intake data from two observational studies to assess the % of energy intake (EI) from each taste cluster across study populations (Fig. 1).
Diagram of the study design. DNFCS, Dutch National Food Consumption Survey; NQplus study, Nutrition Questionnaires plus study.
Study populations
Dutch National Food Consumption Survey
We used the most recent DNFCS (2007–2010)( Reference van Rossum, Fransen and Verkaik-Kloosterman 18 ). The DNFCS is representative of the Dutch population regarding age, sex, region, degree of urbanisation and educational level. Diet was assessed in a total of 3819 Dutch individuals aged 7–69 years. The trained dietitians used the computer-directed interview programme for standardisation of 2-d 24-h recalls, GloboDiet( Reference Slimani, Deharveng and Charrondière 22 ). During the interviews, weight and height were reported (not measured) to an accuracy of 0·1 kg and 0·5 cm. On the basis of the information on both interview days, the average body weight and height were calculated. BMI was determined as the average body weight (in kg) divided by the average height (in m) squared (kg/m2). Weight status subgroups were categorised as follows: normal weight (BMI 18·5–25·0), overweight (BMI 25·0–30·0) and obese (BMI >30·0). Educational level was categorised into low (primary school, lower vocational, low or intermediate general education), middle (intermediate vocational education and higher general education) and high (higher vocational education and university). Age was categorised into younger individuals (19–30 years) and older individuals (31–50 years). In the present analyses, we included the food intake data from men and women aged 19–50 years (DNFCS 2007–2010, n 1402). Individuals who were breast-feeding (n 4), seriously underweight (n 9), underweight (n 36) or without information on weight status (n 1) were excluded from the analyses. One participant was excluded because of missing food intake data at 1 measurement day. In total, we included the food intake data from 687 men and 664 women (n total 1,351) with a mean age of 33 (sd 9) years and BMI of 26 (sd 5) kg/m2 (Table 1).
Total energy intake and the contribution of macronutrients to energy intake stratified by sex, age, BMI and educational level in the Dutch National Food Consumption SurveyFootnote ‡ (Mean values and standard deviations)
a,b Mean values with unlike superscript letters were significantly different.
* Significant difference between men and women. † P<0·05, †† P<0·01, ††† P<0·001.
‡ Multivariate ANCOVA was performed including all tastes and subgroups. If the overall effect was significant (P<0·05), ANCOVA was used to compare subgroups within each taste group (P<0·05, Bonferroni corrected). For age and sex, independent samples t tests were used (P<0·05, Bonferroni corrected).
Nutrition Questionnaires plus study
The NQplus study was conducted between May 2011 and February 2013 in Wageningen and surroundings( Reference Trijsburg, de Vries and Boshuizen 23 – Reference Sluik, Geelen and de Vries 27 ). In total, 2048 men and women aged between 20 and 70 years old participated in this study. Half of them (n 1113) were randomly allocated to the so-called recall group. In this group, each individual completed one to six telephone and three web-based recalls. For comparison with the DNFCS, we used only the first two recalls by telephone (n 968). Height was measured with a stadiometer (SECA) to the nearest 0·1 centimetre and weight was measured using a digital scale (SECA) to the nearest 0·1 kg; the average of the two measurements was included in the data set. Weight status subgroups were categorised as in the DNFCS. Educational level was categorised into low (no education or primary or lower vocational education), middle (lower secondary or intermediate vocational) and high (higher secondary education, higher vocational education or university). Age was categorised into younger individuals (19–30 years), middle-aged individuals (31–50 years) and older individuals (>50 years). Individuals who were pregnant (n 3), underweight (n 8) or without information on educational level (n 13) were excluded from the analyses. In total, we included the food intake data of 498 men and 446 women (n total=944) with a mean age of 53 (sd 12) years and BMI of 26 (sd 4) kg/m2 (Table 2). All individuals gave written informed consent before participation in the study. The study was approved by the ethical committee of Wageningen University (ABR no. NL34775.081.10) and was conducted according to the Declaration of Helsinki.
Total energy intake and the contribution of macronutrients to energy intake stratified by sex, age, BMI and educational level in the Nutrition Questionnaires plus studyFootnote ‡ (Mean values and standard deviations)
a,b Mean values with unlike superscript letters were significantly different.
* Significant difference between men and women. † P<0·05, †† P<0·01, ††† P<0·001.
‡ Multivariate ANCOVA was performed including all tastes and subgroups. If the overall effect was significant (P<0·05), ANCOVA was used to compare subgroups within each taste group (P<0·05, Bonferroni corrected). For sex, independent samples t tests were used (P<0·05, Bonferroni corrected).
§ Age group: 20–30 v. 31–50, P<0·05; 31–50 v. 51+, P<0·01; 20–30 v. 51+, P<0·001.
Misreporting of daily energy intake
To explore the effect of misreporting of EI on dietary taste patterns, we performed sensitivity analyses. We identified potential low-energy reporters (LER) based on the ratio between EI and BMR. Schofield equations were used to estimate BMR from body weight and height, taking into account age and sex( 28 ). We used a cut-off value of EI/BMR of 1·35 to identify potential LER at the group level( Reference Goldberg, Black and Jebb 29 ). In addition, we identified low- and high-energy reporters (HER) at an individual level by calculating 95 % confidence limits of EI/BMR for the DNFCS (95 % CI 0·91, 2·63) and NQplus study (95 % CI 0·98, 2·46)( Reference Goldberg, Black and Jebb 29 ).
Taste database
Panellists
Dutch adults (18–55 years) with a self-reported normal BMI (18·5–25·0 kg/m2) were recruited from Wageningen and surroundings (the Netherlands). We selected panellists (n 15) on the basis of their taste recognition, taste discrimination, the ability to sustain attention and sensory profiling abilities. The panel consisted of three men and twelve women, with a mean age of 33 (sd 12) years and a BMI of 23 (sd 2) kg/m2. All individuals gave written informed consent and they received financial compensation for their participation in the study. The study was approved by the ethics committee of Wageningen University (ABR no.: NL47315.081.13) and was conducted according to the declaration of Helsinki. This study was registered at https://clinicaltrials.gov/ as NCT03233503. The training procedure and selection of panellists have been described in more detail elsewhere( Reference van Stokkom, Teo and Mars 30 , Reference Teo, van Langeveld and Pol 31 ).
Training and panel performance
Panellists received intensive training to evaluate the intensity of sweet, salt, sour, bitter, umami and fat sensation using modified Spectrum™ scales (0–100 mm, Table 3)( Reference Martin, Visalli and Lange 8 , Reference Muñoz and Civille 32 ). Panellists were trained for a total of 63 h over 6 months using Spectrum™-based reference solutions for each basic taste, followed by simple modified products and commercially available foods. Reference solutions were positioned at fixed points at the scale and contained increasing concentrations of sucrose for sweetness, sodium chloride (NaCl) for saltiness, monosodium glutamate (MSG) for umami, citric acid for sourness and caffeine for bitterness. In addition, we modified foods by adding increasing concentrations of taste compounds. For example, NaCl and MSG were added to mashed potatoes and cooked rice for saltiness and umami; caffeine and citric acid were added to agar for bitterness and sourness; sucrose was added to gelatin for sweetness; and mascarpone was added to vanilla custard for fat sensation. Subsequently, panellists were trained to evaluate the taste intensity of pre-selected commercially available foods using the taste solutions as references. At the end of training, panellists reached consensus on the basic taste and fat sensation values for twenty-five commercially available foods that could serve as reference products in addition to the reference solutions (Table 3).
Reference solutions and products shown per taste and fat sensation
* Inspired by Muñoz & Civille( Reference Muñoz and Civille 32 ).
† Inspired by Martin et al.( Reference Martin, Visalli and Lange 8 ).
Panellists were instructed to evaluate a set of nineteen control products in terms of six taste attributes to assess their performance. Panel performance measures (discriminative power, agreement and reproducibility) were regularly monitored during training and profiling sessions. Oral feedback was given by the researcher to improve the panels’ performance. Panellists were able to discriminate between solutions and products, and nearly all taste values could be reproduced. Panellists profiled each of the foods in triplicate.
Food selection and preparation for profiling
After training, we selected foods for profiling based on the DNFCS (2007–2010). Foods were selected based on pre-defined criteria – that is consumption frequency and contribution to the consumption of energy and macronutrients. In addition, we selected foods that contributed most to the variation in EI. In total, we selected 476 foods that were reported in the DNFCS and that contributed in total to 83 % of EI in the DNFCS and 66 % of EI in the NQplus study for an average individual day of consumption. We used expert knowledge from research dietitians to select one of the most often consumed brands for profiling.
Foods were prepared using recipes from the product’s package or were prepared according to normal household practice( Reference Henderson 33 ). Cooked foods were prepared unseasoned, so without any additions of condiments, salt or spices. Foods were prepared one hour before sensory testing to control for the serving temperature. After preparation, cooked foods were kept warm using a bain-marie container (60–65°C). Cold foods were served at room (20–25°C) or refrigerator temperature (4–9°C) where appropriate.
Dietary taste patterns
Foods and food groups in the taste database were grouped into six taste clusters using hierarchical cluster analyses. Subsequently, the taste database was combined with food intake data. For reported foods that were not in the taste database, we estimated mean taste intensity values based on the corresponding food groups. For each individual, we calculated the % of EI from each taste cluster, averaged over 2 24-h recall days.
Classification of foods in taste clusters
Groups of products were formed within the taste database using hierarchical cluster analyses on foods’ mean taste intensity values. The number of clusters was decided using Ward’s method( Reference Ward 34 ). Six taste clusters were identified that accounted for 73 % of the variance (R 2=0·73). We described the taste clusters as ‘neutral’, ‘fat’, ‘sweet and sour’, ‘bitter’, ‘sweet and fat’ and ‘salt, umami and fat’ based on their mean taste intensity values (Table 4). For each food in the taste database, the ‘distance’ to the cluster centre is shown in the online Supplementary Table S3. The distance gives an indication of how similar a food product is relative to the other foods in that cluster; the larger its value, the more dissimilar. To describe the type of foods that are in each taste cluster, we used the twenty-three NEVO food groups in the Dutch Food Composition table( 35 ). A relatively large number of foods were classified in the ‘neutral’-tasting cluster that was low in all six taste modalities. NEVO food groups in the ‘neutral’ taste cluster included 94 % of all ‘bread’ products within the taste database, 89 % of all ‘vegetables’, 43 % of all ‘potatoes’, 36 % of all ‘fish’ products, 28 % of all ‘nuts, seeds and savoury snacks’ and 15 % of all ‘meat, meat products and poultry’. The ‘fat’ taste cluster included 80 % of all ‘fat and oils’ and 31 % of all ‘cheese’ products. Food groups in the ‘sweet and sour’ taste cluster included 59 % of all ‘(non-) alcoholic beverages’, 63 % of all ‘fruits’ and 33 % of all ‘milk and milk products’. The ‘sweet and fat’ taste cluster included 92 % of all ‘sugar, sweets, sweet spreads and sweet sauces’, 85 % of all ‘pastry, cakes and biscuits’ and 57 % of all ‘milk and milk products’. The ‘bitter’ taste cluster consisted of 28 % of all ‘(non-) alcoholic beverages’. Food groups in the ‘salt, umami and fat’ taste cluster were 83 % of all ‘meat, meat products and poultry’, 67 % of all ‘nuts, seeds and savoury snacks’, 63 % of all ‘cheese’ products, 57 % of all ‘potatoes’ and 100 % of all ‘soups’.
Taste intensity values of all taste modalities and nutrient content stratified by taste clusters (Mean values and standard deviations)
Estimating sensory profiles of untested foods
For reported foods in the food intake data that were not in the taste database, we estimated taste values based on the corresponding food groups. Currently, no food classification system exists that groups foods on the basis of taste. Therefore, we used the Dutch NEVO food groups that were based on similarities in nutritional values. For each NEVO food group, we calculated average taste intensity values based on the 476 profiled foods. For example, we calculated average taste intensity values of profiled foods in the food group ‘bread’ and assigned these taste values to all untested foods in this food group.
However, not all NEVO food groups were appropriate for estimating taste values. For example, the NEVO food group ‘milk and milk products’ consists of foods such as ‘neutral’-tasting milk, ‘sweet and sour’-tasting yogurt and ‘sweet and fat’-tasting desserts. Therefore, for this food group it is more accurate to estimate taste values of untested foods using the smaller (sub-) sub-food groups within the GloboDiet food group classification: ‘milk’, ‘milk beverages’, ‘yogurt’, ‘fromage blanc, petits suisses’, ‘cream desserts, puddings’ and ‘dairy products and non-dairy product creams’. The GloboDiet food group classification comprises nineteen main groups and eighty-six subgroups, and fifteen of these subgroups are further detailed into sixty-two sub-sub-food groups based on similarities in nutritional values( Reference Slimani, Deharveng and Charrondière 22 ). We used the GloboDiet (sub-) sub-food groups for five NEVO food groups that were too diverse in taste. Three NEVO food groups (‘(non-) alcoholic beverages’, ‘milk and milk products’ and ‘fat, oils and savoury sauces’) were fully replaced and two NEVO food groups (‘nuts, seeds and savoury snacks’ and ‘meat and meat products’) were partially replaced by the GloboDiet food groups (online Supplementary Fig. S1 and Tables S1 and S2).
The NEVO food groups ‘mixed dishes’ and ‘potatoes’ did not consist of GloboDiet (sub-) sub-food groups, and were too diverse in taste to calculate mean taste intensity values. Therefore, we matched untested foods within the food groups ‘mixed dishes’ and ‘potatoes’ with a tested food item that was similar in macronutrient and sodium content. Similarly, four NEVO food groups were too diverse in taste, not consumed in isolation or were not frequently consumed by the Dutch population: ‘miscellaneous’, ‘herbs and spices’, ‘soya products and vegetarian foods’ and ‘preparations’. These four food groups were not matched with the average taste intensity values and were treated as missing values (only 1 % of total EI).
This systematic approach resulted in mean taste intensity values for a combination of fourteen NEVO and twenty GloboDiet food groups. We combined the mean taste intensity values of these thirty-four food groups with the 476 foods in the taste database. Subsequently, we repeated hierarchical cluster analyses on the taste intensity values of foods and food groups combined. We obtained six taste clusters that were similar to the taste clusters described in the ‘Classification of foods in taste clusters’ section. In total, foods responsible for 99 % of EI in both study populations were classified into one of the six taste clusters.
Recoding of coffee and tea
In 24-h recall data, foods are mainly reported as single foods, even when consumed in combination with other foods. In the Netherlands, coffee and tea are consumed on a daily basis and often in combination with sugar and/or milk; therefore, these added ingredients can contribute to dietary taste patterns. We identified how coffee or tea was consumed using the following rules. If coffee and sugar were reported in equal frequencies in an eating occasion, coffee was consumed with sugar (and similarly for tea). Exceptions were if both coffee and tea were reported in equal frequencies in an eating occasion. We assumed that coffee milk was always consumed in combination with coffee. All tested coffee products (with or without milk and/or sugar) were classified in the ‘bitter’ taste group in our cluster analyses (online Supplementary Table S3). Therefore, we assigned coffee milk and sugar that was consumed in combination with coffee to the ‘bitter’ taste group. Tea with and without sugar was classified in the ‘neutral’ taste group. Thus, sugar that was consumed in combination with tea was assigned to the ‘neutral’ taste group.
Statistical analyses
Data were analysed using SAS version 9.3. (SAS Institute, Inc.). Multivariate ANCOVA (MANCOVA) was used to test differences in the percentage of EI from the taste clusters by sex, age, weight status (BMI) and educational level, taking into account all taste clusters simultaneously. ANCOVA was used to compare specific subgroups within each taste cluster if the MANCOVA results were significant (P<0·05). For age (DNFCS only) and sex, independent samples t tests were used. Models for sex were adjusted for age, BMI and education; models for age were adjusted for BMI and education; models for BMI were adjusted for age and education; and models for education were adjusted for age and BMI. We performed sensitivity analyses by excluding the percentage of EI from foods not profiled by our panellists, and by excluding potential LER at group level and under- and over-reporters at an individual level (see the ‘Misreporting of daily energy intake’ section). Repeated-measures ANOVA was used to compare differences in the percentage of energy between eating occasions. P values <0·05 were considered significant (Bonferroni’s correction). The between- and within-person variation and intra-class correlation coefficients (ICC) were calculated for the percentage of total EI from each of the taste clusters between the 2 recall days.
Results
Major contributions to daily EI in the entire diet were from ‘neutral’-tasting foods (36 % in the DNFCS and 39 % in the NQplus study), ‘salt, umami and fat’-tasting foods (23 and 22 %, respectively) and ‘sweet and fat’-tasting foods (both studies 14 %). The remaining daily EI was obtained from ‘fat’-tasting foods (11 % and 8 %, respectively), ‘sweet and sour’-tasting foods (both studies 11 %) and ‘bitter’-tasting foods (both studies 5 %). The ICC, a measure of day-to-day variation of EI, ranged from 0·12 for ‘fat’-tasting foods to 0·44 for ‘bitter’-tasting foods in the DNFCS. This was similar in the NQplus study, where the ICC ranged from 0·14 for ‘neutral’-tasting foods to 0·48 for ‘bitter’-tasting foods.
Dietary taste patterns stratified by eating occasions
During main meals, individuals consumed significantly more % energy from foods tasting ‘neutral’ (40–49 %) or ‘fat’ (9–14 %) than during snacking occasions (11–20 %, 1–2 %, respectively; Fig. 2, DNFCS). This was in line with the NQplus study (online Supplementary Fig. S2): ‘neutral’- and ‘fat’-tasting foods contributed relatively more energy to main meals (40–53 %, 8–10 %) than to snacking occasions (16–24 %, 1–2 %, P<0·001). During snacking occasions, however, individuals consumed significantly more % energy from foods tasting ‘bitter’ (17–32 %) and ‘sweet and fat’ (25–27 %) than during main meals (1–5 %, 6–15 %, P<0·001) in the DNFCS. Similarly, individuals in the NQplus study consumed significantly more % energy from foods tasting ‘bitter’ (18–30 %) and ‘sweet and fat’ (28–30 %) than during main meals (1–3 %, 6–13 %, P<0·001).
Percentage of energy from each taste group for main meals (a) and snacking occasions (b) separately, shown for the Dutch National Food Consumption Survey (n
total 1351). a: breakfast, n 1282 (![]() ); lunch, n 1304 (
); lunch, n 1304 (![]() ); dinner, n 1348 (
); dinner, n 1348 (![]() ). b: in the morning, n 1190 (
). b: in the morning, n 1190 (![]() ); in the afternoon, n 1301 (
); in the afternoon, n 1301 (![]() ); in the evening, n 1320 (
); in the evening, n 1320 (![]() ). Values are means and standard deviations.
). Values are means and standard deviations.
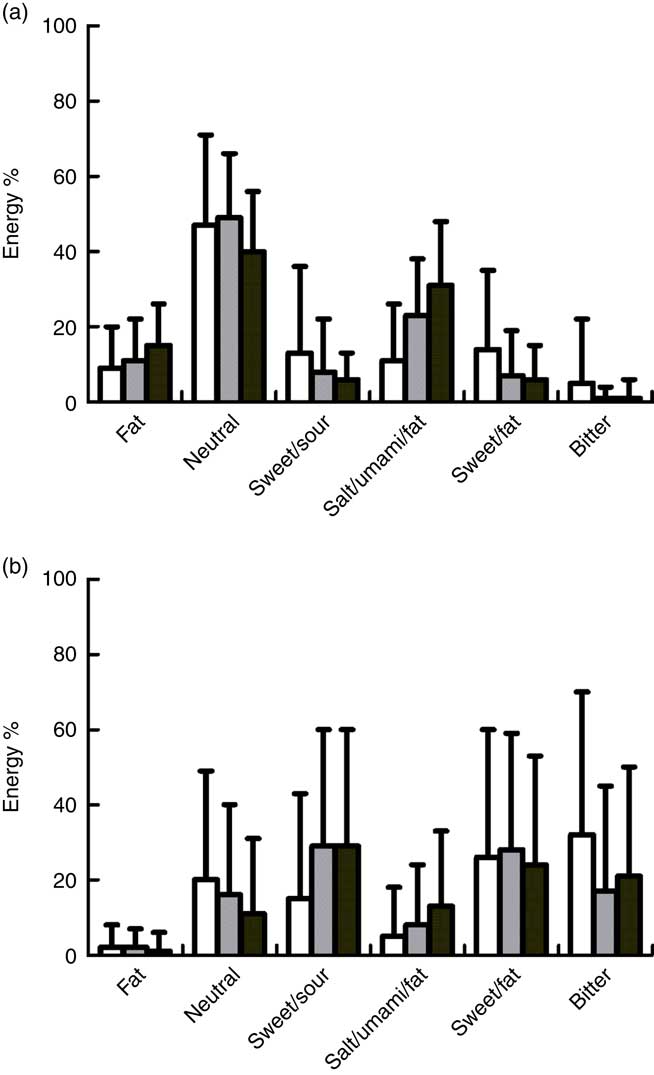
Day-to-day variation in dietary taste patterns was lowest during breakfast in both the DNFCS and the NQplus study, as indicated by higher ICC. During breakfast, the ICC ranged from 0·38 for ‘fat’-tasting foods to 0·51 for ‘bitter’-tasting foods, whereas this was 0·03 for ‘fat’-tasting foods to 0·34 for ‘bitter’-tasting foods during the other eating occasions in the DNFCS. Similarly, in the NQplus study the ICC ranged from 0·36 for ‘neutral’-tasting foods to 0·51 for ‘sweet and sour’-tasting foods during breakfast, whereas this was 0·0 for ‘salt, umami and fat’-tasting foods to 0·34 for ‘bitter’-tasting foods during the other eating occasions.
Dietary taste patterns stratified by individual characteristics
Contributions to daily EI from each of the 6 taste clusters were assessed for different socio-demographic and weight status subgroups of the population. Dietary taste patterns were assessed for the entire diet (Tables 5–6), as well as for tested foods only for each subgroup of the population (online Supplementary Tables S4 and S5). In both study populations, we found similar differences in dietary taste patterns by sex, weight status and age. We did not find any significant differences in dietary taste patterns by educational level.
Percentage of total energy intake from each taste cluster based on cluster analyses stratified by sex, age, BMI and educational level, and averaged over 2 d of 24-h recalls in the Dutch National Food Consumption SurveyFootnote ‡ (Mean values and standard deviations)
a,b Mean values with unlike superscript letters were significantly different.
* Significant difference between men and women.
† P<0·05, †† P<0·01, ††† P<0·001.
‡ Multivariate ANCOVA was performed including all tastes and subgroups. If the overall effect was significant (P<0·05), ANCOVA was used to compare subgroups within each taste group (P<0·05, Bonferroni corrected). For age and sex, independent samples t tests were used (P<0·05, Bonferroni corrected). Models for sex were adjusted for age, BMI and education; models for age were adjusted for BMI and education; models for BMI were adjusted for age and education; models for education were adjusted for age and BMI.
Percentage of total energy intake from each taste group based on cluster analyses stratified by sex, age, BMI and educational level, and averaged over 2 d of 24-h recalls in the Nutrition Questionnaires plus studyFootnote ‡(Mean values and standard deviations)
a,b Mean values with unlike superscript letters were significantly different.
* Significant difference between men and women.
† P<0·05, †† P<0·01, ††† P<0·001.
‡ Multivariate ANCOVA was performed including all tastes and subgroups. If the overall effect was significant (P<0·05), ANCOVA was used to compare subgroups within each taste group (P<0·05, Bonferroni corrected). For sex, independent samples t tests were used (P<0·05, Bonferroni corrected). Models for sex were adjusted for age, BMI and education; models for age were adjusted for BMI and education; models for BMI were adjusted for age and education; models for education were adjusted for age and BMI.
Sex
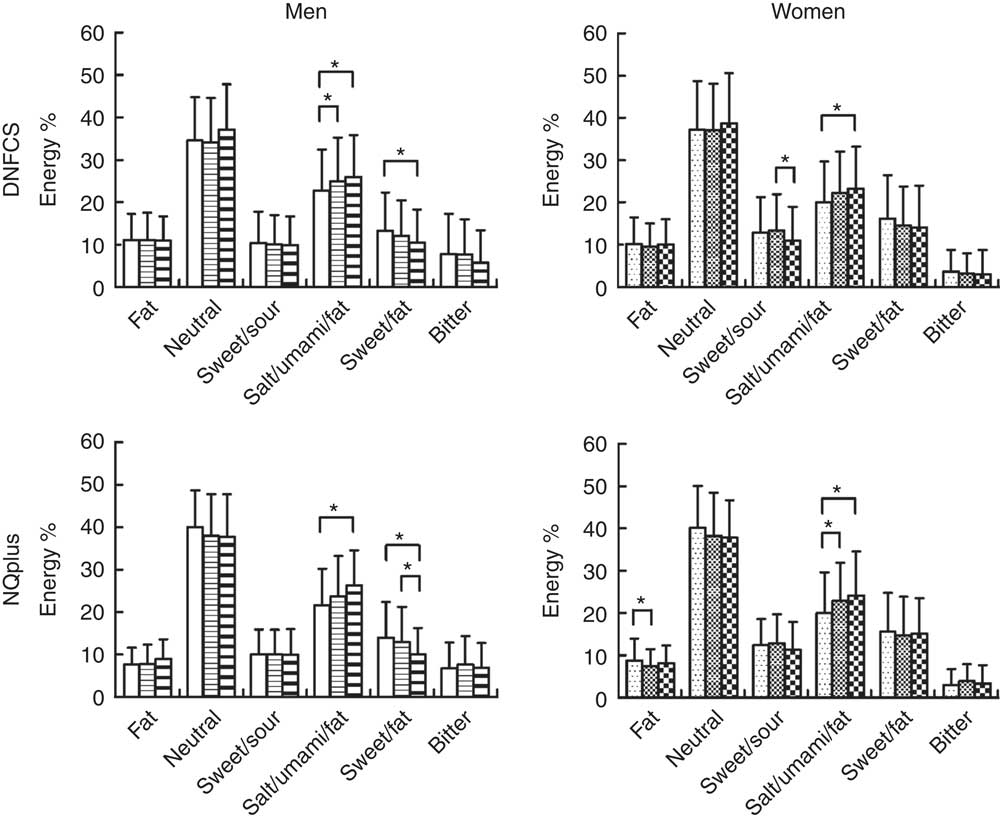
Dietary taste patterns differed between men and women (Fig. 3), both in the DNFCS (Table 5) and in the NQplus study (Table 6). Men consumed a significantly larger percentage of energy from foods tasting ‘salt, umami and fat’ (DNFCS, 24 %, and NQplus, 23 %) and ‘bitter’ (7 %) compared with women (DNFCS, 21 %, P<0·001, and NQplus, 22 %, P=0·005 and 3 %, P<0·001 and 4 %, P<0·001, respectively, Tables 5–6). Women consumed a significantly larger percentage of energy from ‘sweet and fat’ (both studies 15 %)- and ‘sweet and sour’-tasting foods (13 % and 12 %, respectively) compared with men (12 %, P<0·001, and 13 %, P=0·001, respectively, and both studies 10 %, P<0·001).
Percentage of total energy intake from each taste cluster based on cluster analyses stratified by sex and BMI, and averaged over 2 d of 24-h recalls in the Dutch National Food Consumption Survey and in the Nutrition Questionnaires plus (NQplus) study. ![]() , Normal-weight men;
, Normal-weight men; ![]() , overweight men;
, overweight men; ![]() , obese men;
, obese men; ![]() , normal-weight women;
, normal-weight women; ![]() , overweight women;
, overweight women; ![]() , obese women. Multivariate ANCOVA was performed including all tastes and subgroups. If the overall effect was significant (P<0·05), ANCOVA was used to compare subgroups within each taste group (P<0·05, Bonferroni corrected). Models for sex were adjusted for age, BMI and education; models for BMI were adjusted for age and education. *Significant difference between weight status subgroups. Dutch National Food Consumption Survey: normal-weight men, n 363; overweight men, n 244; obese men, n 80. Normal-weight women, n 351; overweight women, n 173; obese women, n 140. NQplus: normal-weight men, n 185; overweight men, n 243; obese men, n 70. Normal-weight women, n 244; overweight women, n 142; obese women, n 60.
, obese women. Multivariate ANCOVA was performed including all tastes and subgroups. If the overall effect was significant (P<0·05), ANCOVA was used to compare subgroups within each taste group (P<0·05, Bonferroni corrected). Models for sex were adjusted for age, BMI and education; models for BMI were adjusted for age and education. *Significant difference between weight status subgroups. Dutch National Food Consumption Survey: normal-weight men, n 363; overweight men, n 244; obese men, n 80. Normal-weight women, n 351; overweight women, n 173; obese women, n 140. NQplus: normal-weight men, n 185; overweight men, n 243; obese men, n 70. Normal-weight women, n 244; overweight women, n 142; obese women, n 60.
Weight status
Obese women (BMI >30·0) consumed a significantly larger percentage of energy from foods tasting ‘salt, umami and fat’ (DNFCS, 23 %, and NQplus, 24 % and, although not significant, less from ‘sweet and fat’ (14 and 15 %) compared with normal-weight women (BMI 18·5–25·0 kg/m2; ‘salt, umami and fat’ 20 % in both studies, DNFCS; P=0·004, NQplus; P=0·011, ‘sweet and fat’, 16 % in both studies, P=0·12, P=0·99, respectively, Fig. 3). Similarly, obese men consumed a significantly larger percentage of energy from foods tasting ‘salt, umami and fat’ (26 % in both studies) and less from ‘sweet and fat’ (11 %, 10 %) compared with normal-weight men (‘salt, umami and fat’, DNFCS; 23 %, P=0·037 and NQplus; 22 %, P=0·001 ‘sweet & fat, 13 %, P<0·05, 14 %, P<0·01, respectively).
Age
In both study populations, we found that younger or middle-aged individuals consumed a significantly smaller percentage of energy from ‘bitter’-tasting foods compared with older individuals. In the DNCFS, younger men and women (aged 19–30 years) consumed a significantly smaller percentage of energy from ‘bitter’ (7 % and 3 %, respectively)-tasting foods compared with middle-aged men and women (aged 31–50 years; 8 %, P=0·034, and 4 %, P=0·006, respectively). Similarly, in the NQplus study, middle-aged men and women (aged 31–50 years) consumed a significantly smaller percentage of energy from ‘bitter’ (6 % and 3 %, respectively)-tasting foods compared with older men and women (aged 51 and older; 8 %, P=0·001 and 4 %, P=0·004, respectively). In addition, we found that younger men and women (aged 19–30 years) consumed a significantly larger percentage of energy from ‘sweet and sour’-tasting foods (11 and 14 %, respectively) compared with middle-aged men and women (aged 31–50 years; 9 and 11 %, respectively, both P<0·001) in the DNFCS, but not in the NQplus study.
Education
No significant differences in dietary taste patterns were found between groups of low, medium or high educational level (all P values >0·05).
Misreporting of daily energy intake
We excluded potential LER at the group level (LER, n 661, 49 %, in the DNFCS study and 520, 53 %, in the NQplus study) from our analyses to explore the effect of under-reporting on dietary taste patterns. Accurate reporting (AR) and HER overweight and obese men (25 % of the energy in the DNFCS and 24 % in the NQplus study) and women (24 and 23 %, respectively) consumed more percentage energy from ‘salt, umami and fat’-tasting foods than AR and HER normal-weight men (23 and 22 %) and women (both 20 %) (online Supplementary Tables S6 and S7). These findings were significant for AR and HER men (P=0·018) and women (P<0·001) in the DNFCS study, and for women (P=0·034) but not for men (P=0·126) in the NQplus study. In addition, we excluded potential LER (DNFCS, n 154, 11 %, and NQplus, n 121, 13 %) and potential HER (DNFCS, n 10, 1 %, and NQplus, n 1, 0·1 %) at an individual level from our analyses (online Supplementary Tables S8 and S9). Similarly, normal-reporting obese men (26 % in the DNFCS, P=0·03, and 27 % in the NQplus study, P<0·001) consumed more % energy from ‘salt, umami and fat’-tasting foods than normal-reporting normal-weight men (23 % and 21 %, respectively). Obese women (23 %, P=0·0588, and 24 %, P=0·0777, respectively) also consumed more % energy from ‘salt, umami and fat’-tasting foods compared with normal-reporting normal-weight women (both 20 %), although this was NS.
Discussion
This study is the first that aimed to assess dietary taste patterns in the Netherlands by sex, weight status, age and educational level. This is the first study to observe that dietary taste patterns differ by sex and weight status. We found similar results concerning dietary taste patterns in two different study populations. Men consumed a significantly larger percentage of energy from foods tasting ‘bitter’ and ‘salt, umami and fat’ and a smaller percentage of energy from foods tasting ‘sweet and fat’ and ‘sweet and sour’ compared with women. Obese men and women consumed a significantly larger percentage of energy from foods tasting ‘salt, umami and fat’ and less, although only significant in men, from foods tasting ‘sweet and fat’ than normal-weight men and women.
A key strength of our study is that we used a large database with taste values of foods – obtained by a trained panel – in combination with food intake data from two study populations. Trained panels are commonly used as an objective measure to quantify sensory properties of foods( Reference Meilgaard, Civille and Carr 36 ). Training increases the panel’s internal consensus, reproducibility and discriminative power( Reference Wolters and Allchurch 19 – Reference Losó, Gere and Györey 21 ). Importantly, foods for profiling were selected using objective criteria – that is consumption frequency and contribution to energy and macronutrient intake in the DNFCS. However, it remained of interest whether dietary taste patterns could be reproduced in an observational study that was independent of our food selection process. Therefore, we assessed dietary taste patterns in the DNFCS (2007–2010), as well as in an independent observational study that used a similar dietary assessment method – that is the NQplus study (2011–2013). In addition, we performed sensitivity analyses by excluding EI from foods that were not profiled by our panellists. The NQplus study population was somewhat older but also higher educated than the DNFCS study population. Despite these study population differences, similar results were found concerning dietary taste patterns in the entire diet and in the selected profiled foods for both study populations. This suggests that our findings are valid for the diet of the general population of healthy Dutch adults.
Across eating occasions, we found dietary taste patterns in line with reported macronutrient intake in the DNFCS (2007–2010)( Reference van Rossum, Fransen and Verkaik-Kloosterman 18 ). For individual foods, studies have found positive associations between sweetness and monosaccharides and disaccharides, umami and protein, and fat sensation and fat content( Reference van Dongen, van den Berg and Vink 2 , Reference Lease, Hendrie and Poelman 3 , Reference van Langeveld, Gibbons and Koelliker 37 ). In the current study, individuals consumed relatively more energy from foods tasting ‘salt, umami and fat’ during lunch and dinner than during breakfast, in line with reported protein (24 and 45 %) and fat (22 and 42 %) intake during lunch and dinner compared with breakfast (14 and 13 %, respectively)( Reference van Rossum, Fransen and Verkaik-Kloosterman 18 ). In addition, EI from ‘sweet and sour’- and ‘sweet and fat’-tasting foods was relatively higher during snacking occasions compared with main meals, in line with reported monosaccharide and disaccharide intake during snacking occasions (on average 48 % of the total intake of monosaccharides and disaccharides v. 30 % energy from snacks( Reference van Rossum, Fransen and Verkaik-Kloosterman 18 )). Thus, taste can be related to macronutrients both at the level of individual foods and dietary intake.
Since the 1970s, it is debated whether overweight and/or obese individuals have a preference for sweet or savoury-tasting foods, and this issue is still discussed. Some studies have found a positive association between liking for sweet( Reference Deglaire, Méjean and Castetbon 9 , Reference Matsushita, Mizoue and Takahashi 10 ) or savoury foods and BMI( Reference Deglaire, Méjean and Castetbon 9 ). In contrast, other studies have reported lower liking ratings for sweet and savoury foods in obese v. lean individuals( Reference Cox, Van Galen and Hedderley 16 ) or no difference in liking across BMI categories( Reference Cox, Perry and Moore 17 ). An explanation for this lack of consensus on obese people’s taste preferences might be that liking of food is dependent on the consumption context – for example, where and with whom people are eating( Reference Meiselman 38 ). Therefore, laboratory measures of liking may not accurately predict dietary intake; taste preferences are not the same as dietary taste patterns. However, it may be assumed that a higher preference of certain foods is reflected in a higher intake of these foods, depending also on other factors such as costs and health( 1 ). To our knowledge, the current study provides the first indications for a higher percentage of EI from ‘salt, umami and fat’- and potentially less from ‘sweet and fat’-tasting foods in obese individuals compared with normal-weight individuals. These findings suggest that obese individuals may partly substitute consumed amounts of ‘sweet and fat’-tasting foods for ‘salt, umami and fat’-tasting foods. Another possibility could be that obese individuals consume more energy-dense ‘salt, umami and fat’- and less energy-dense ‘sweet and fat’-tasting foods than normal-weight individuals. Our findings are based on dietary intake in a large representative sample of 1351 adults and an additional sample of 944 adults in the Netherlands. In contrast to our expectations, total EI was not significantly different between obese and normal-weight individuals. However, our conclusions seemed unaffected by under-reporting of EI. Nevertheless, under-reporting may still be an issue as we did not take the level of physical activity into account. In particular, high-fat sweet foods may be sensitive to under-reporting, and under-reporting of EI increases with BMI( Reference Mela and Aaron 39 ). Future studies on dietary taste patterns are needed to confirm our findings in other Western and non-Western study populations to fully resolve this issue globally.
In both study populations, we found similar differences in dietary taste patterns between men and women. Women consumed a significantly larger percentage of energy from foods tasting ‘sweet and fat’ and ‘sweet and sour’ than did men, in line with monosaccharide and disaccharide intake in both studies (DNFCS; 22 % total energy (TE) in women, 20 % TE in men, NQplus study; 21 % TE in women, 18 % TE in men). Men consumed a significantly larger percentage of energy from foods tasting ‘bitter’, in line with a relatively higher EI from alcohol in men (DNFCS; 4 % TE, NQplus study; 5 % TE) than in women in both studies (2 % TE, 3 % TE, respectively). In addition, we found a significantly higher EI from ‘salt, umami and fat’-tasting foods in men than in women. In contrast, the percentage of energy from protein (DNFCS; both 15 % TE, NQplus study; both 16 % TE) and fat (DNFCS; both 34 % TE, NQplus study; both 34 % TE) did not differ between men and women in the DNFCS. However, our findings are in line with studies showing that men liked salt and/or fatty foods more than women( Reference Deglaire, Méjean and Castetbon 9 – Reference Zellner, Garriga-Trillo and Rohm 15 ). Similarly, evidence exists for a higher liking for sweetness in women than in men( Reference Deglaire, Méjean and Castetbon 9 , Reference Matsushita, Mizoue and Takahashi 10 , Reference Weingarten and Elston 14 , Reference Zellner, Garriga-Trillo and Rohm 15 ), although one study found no sex differences in sweet food liking( Reference Keskitalo, Tuorila and Spector 11 ). To our knowledge, only one study reported significantly higher frequency of consumption of salty-and-fatty foods in men than in women, but no sex differences in the frequency of consumption of sweet-and-fatty foods( Reference Keskitalo, Tuorila and Spector 11 ). An explanation for our consistent differences in dietary taste patterns by sex might be that we studied the role of taste in dietary intake, including the consumption context( Reference Meiselman 38 ).
Dietary taste patterns varied between the 2 recall days; ICC ranged from 0·12 to 0·44 in the DNFCS and from 0·14 to 0·48 in the NQplus study. This is because of the chosen dietary assessment method as such; 24-h recalls are prone to natural day-to-day variation in intake. Therefore, it is not possible to accurately estimate dietary taste patterns at the individual level in the current study. However, the within-person variation tends to cancel out at the group level if the group is large enough and the recalls are repeated within individuals( 40 ). In the current study, we compared dietary taste patterns only at the group level and not at an individual level, which is appropriate given our large sample size (n 1351 and n 944) and use of 2-d 24-h recalls.
In conclusion, our findings demonstrate that our taste database can be used to study the role of taste in dietary intake in the Netherlands by sex, weight status, age and educational level. In addition, dietary taste patterns can be reproduced using our taste database in an independent study population. We have found that men consumed relatively more energy from foods tasting ‘bitter’ and ‘salt, umami and fat’ and less energy from foods tasting ‘sweet and fat’ and ‘sweet and sour’ compared with women. Moreover, our findings suggest that in particular the percentage of EI from ‘salt, umami and fat’ may be higher and that from ‘sweet and fat’ may be lower in obese individuals than in normal-weight individuals. Future follow-up studies are needed to clarify a potential causal relationship between dietary taste patterns and weight gain, in adults but also in other study populations such as children and in both Western and non-Western study populations. Future prospective studies could also investigate whether dietary taste patterns can explain differences between subgroups at risk of chronic diseases such as CVD and type 2 diabetes. Studying dietary patterns from a taste perspective – and not only a nutritional perspective – can provide us with a deeper understanding of the role of taste in dietary intake.
Acknowledgements
The authors acknowledge Els Siebelink, Korrie Pol, Marlot Smulders, Eric Benyon, Petroula Gogoulou, Sandra Scheffel, Martha van der Velde, Delphine Dupuis, Chloé Parizel, Zahabia Jivaji, Desiree Lucassen, Janneke Schultink, Renske Geers and Vera van Stokkom for their assistance and/or advice during data collection.
This study was supported by a collaborative agreement between the chair of Sensory Science and Eating Behaviour, Department of Human Nutrition, Wageningen University; the chair of Marketing and Consumer Behaviour; Sub-department Business, Consumer and Competence Studies, Wageningen University; Consumer Science and Health, Wageningen Food & Biobased Research; Danone Nutricia Research; Heineken BV; Friesland Campina Research; and Unilever R&D Vlaardingen. The Nutrition Questionnaires plus study was core funded by ZonMw (ZonMw, Grant 91110030).
The authors’ responsibilities were as follows: A. W. B. v. L., P. S. T., J. H. M. d. V., E. J. M. F., C. d. G. and M. M. designed the research; A. W. B. v. L. and P. S. T. conducted the research; A. W. B. v. L. analysed the data, had primary responsibility for the final content of the manuscript and wrote the manuscript; P. S. T., J. H. M. d. V., E. J. M. F., C. d. G. and M. M. provided critical edits to and reviewed the manuscript; and all authors read and approved the final manuscript.
None of the authors has any conflicts of interest to declare.
Supplementary material
For supplementary material/s referred to in this article, please visit https://doi.org/10.1017/S0007114518000715


